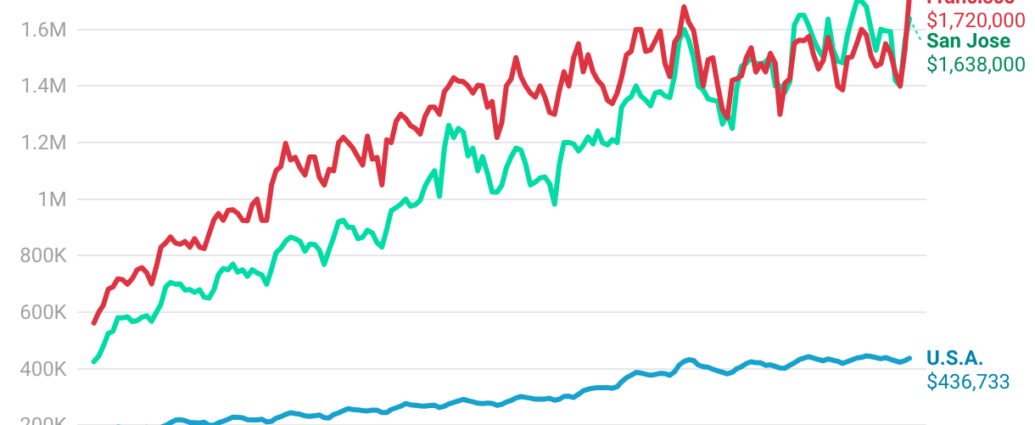
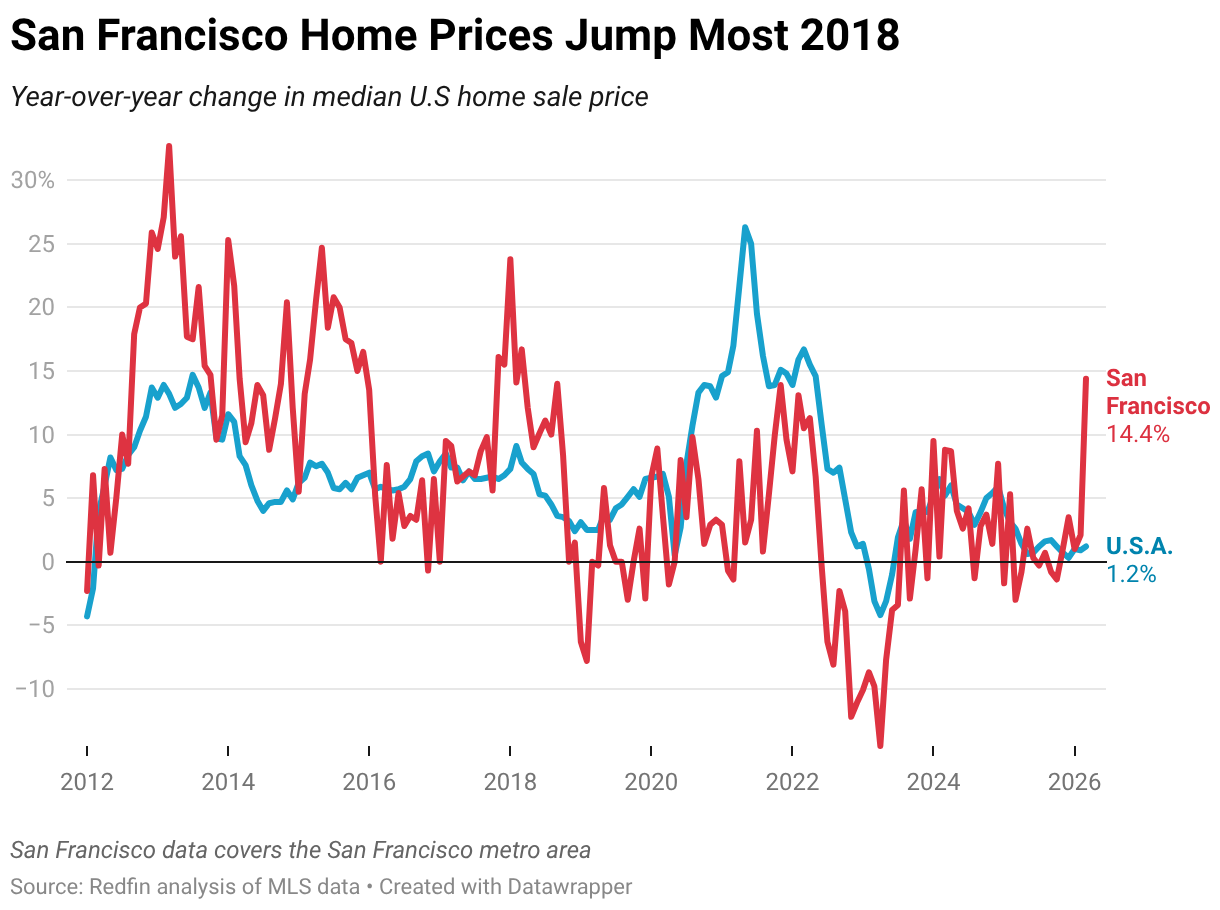
- The median sale price in the Bay Area metro rose 14% year over year in March, compared with a 1% gain nationwide. That helped San Francisco reclaim its title as the most expensive major metro to buy a home.
- Nationally, the housing market remained sluggish as high costs and economic uncertainty gave buyers and sellers pause.
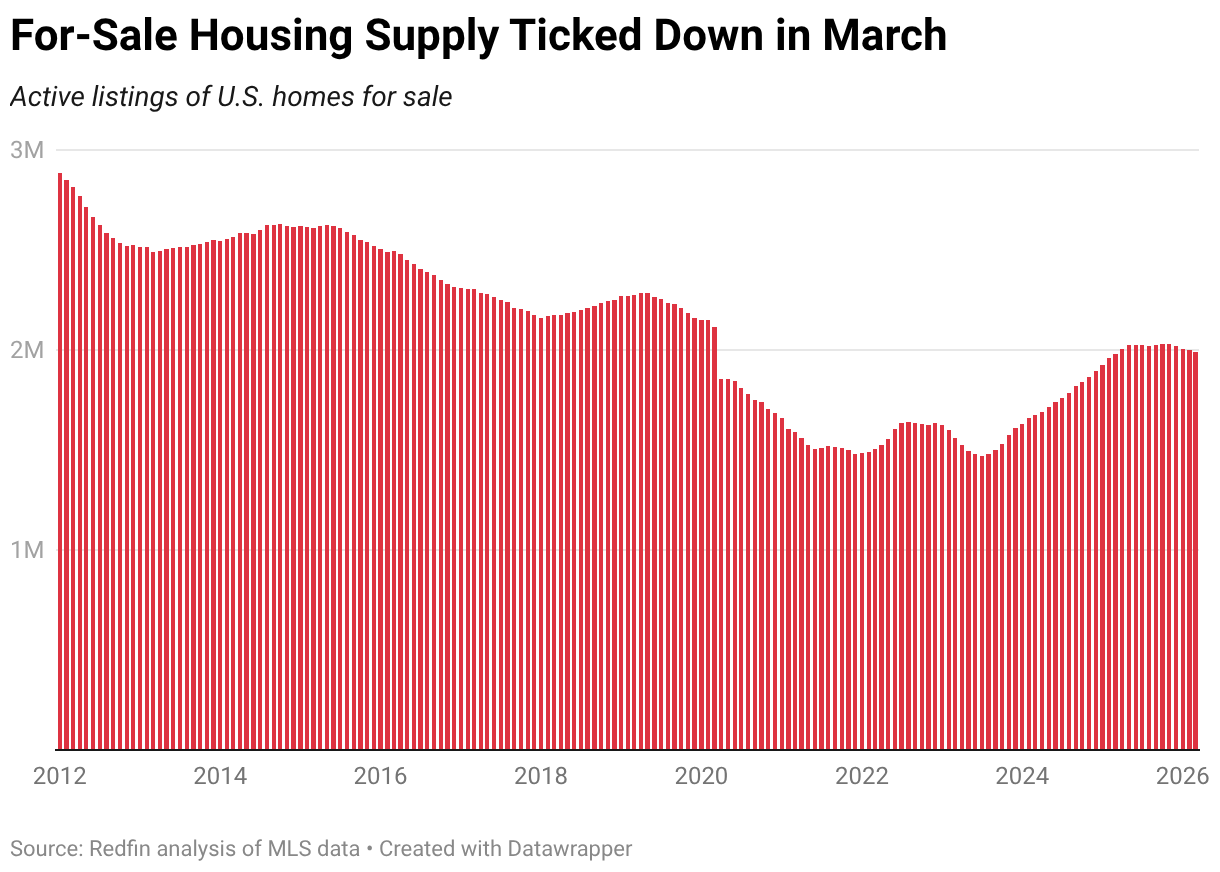
- Active listings of U.S. homes for sale fell 1% from a month earlier and pending sales barely budged. Homes that did sell moved at the slowest March pace in a decade.
The median home sale price in the San Francisco metropolitan area jumped 14.4% year over year in March to a record $1.7 million. That’s the largest increase since March 2018 and the biggest gain among the 50 most populous U.S. metro areas.
Condo prices in San Francisco rose particularly quickly, posting a 24.4% year-over-year increase last month—the largest since 2013.
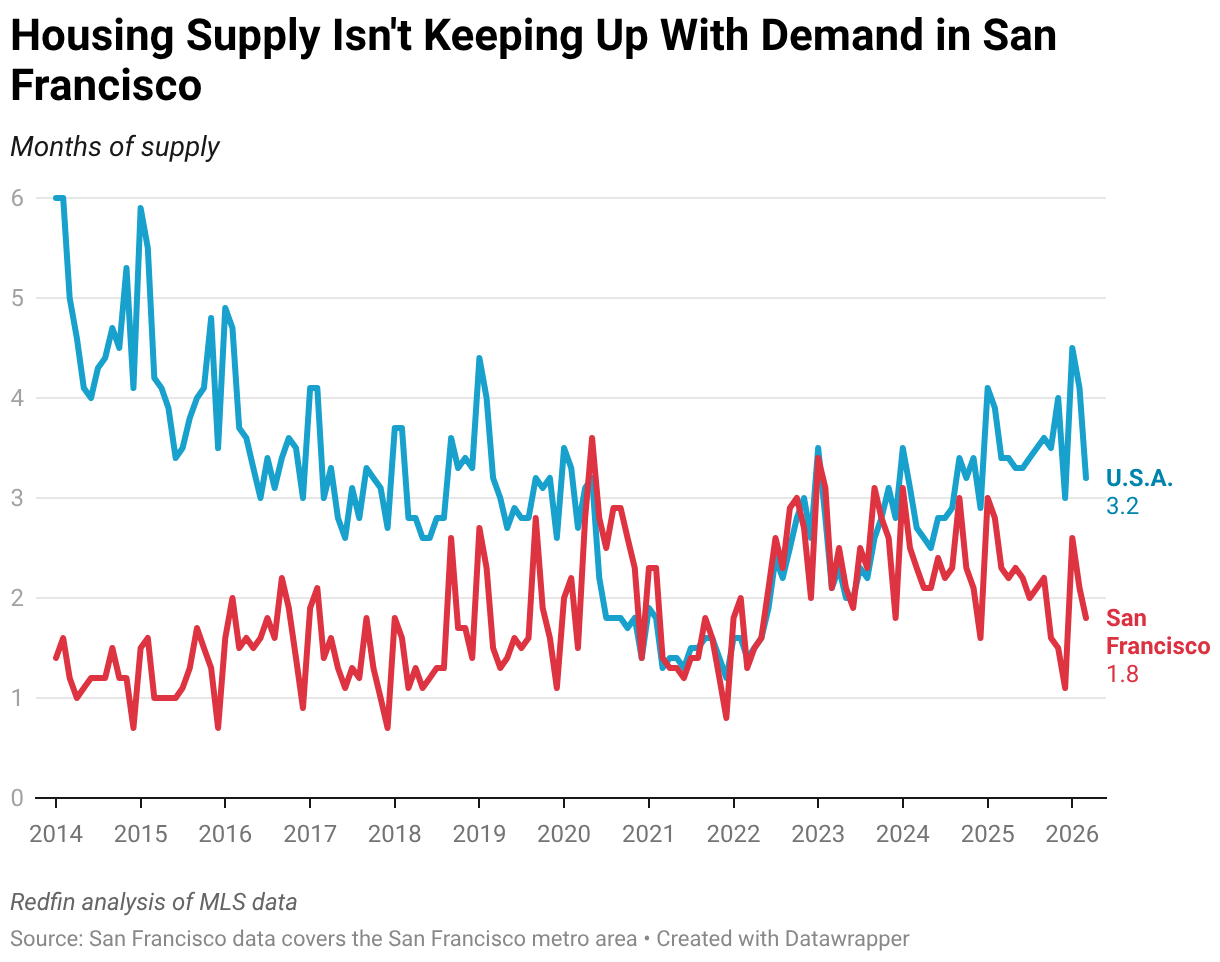
San Francisco’s housing market has been heating up as a boom in the artificial intelligence industry and a return to the office have coincided with a lack of inventory.
“A lot of 22-year-olds are getting $500,000 signing bonuses from AI companies, and they’re excited to buy homes,” said local Redfin Premier real estate agent Ali Mafi. “Inventory isn’t keeping up—sellers have been hearing that if they wait to sell, they’ll get a better deal. But suddenly, the time to sell is now. We’re seeing quality homes in desirable areas get 20 offers and go for as much as $900,000 over the asking price.”
Mafi said sellers should still make sure their homes are in tip-top shape before going to market (cleaning, staging, painting, etc.). Oftentimes, a $20,000 investment there can turn into $100,000 because it helps the home sell for a higher price—especially when demand is so strong, he noted.
Thanks to last month’s price jump, San Francisco has reclaimed its title as the major U.S. metro with the highest home prices, eclipsing neighboring San Jose, which held that title for much of 2024 and 2025.
The typical San Francisco home that sold in March went for 8.9% more than its final list price—the largest March premium since 2022. By comparison, the typical U.S. home sold for 1.3% below its final list price—the biggest March discount since 2020.
San Francisco’s housing market has just 1.8 months of supply, compared with 3.2 months nationwide. Months of supply measures the length of time it would take for the existing supply of homes for sale to be bought up at the market’s current pace of sales, assuming no new listings.
Nationally, the Housing Market Remains Sluggish
The median U.S. home sale price rose 1.2% year over year in March to $436,733. That’s the fastest growth in five months but remains low by historical standards.
Active listings of U.S. homes for sale fell 0.6% month over month on a seasonally adjusted basis—the largest decline since June 2023. Some sellers have been retreating due to lackluster demand for their homes; pending home sales were little changed from a month earlier (0.1%) on a seasonally adjusted basis in March and fell 2.6% from a year earlier. High home prices, rising mortgage rates and economic uncertainty have caused many house hunters to stay on the sidelines.
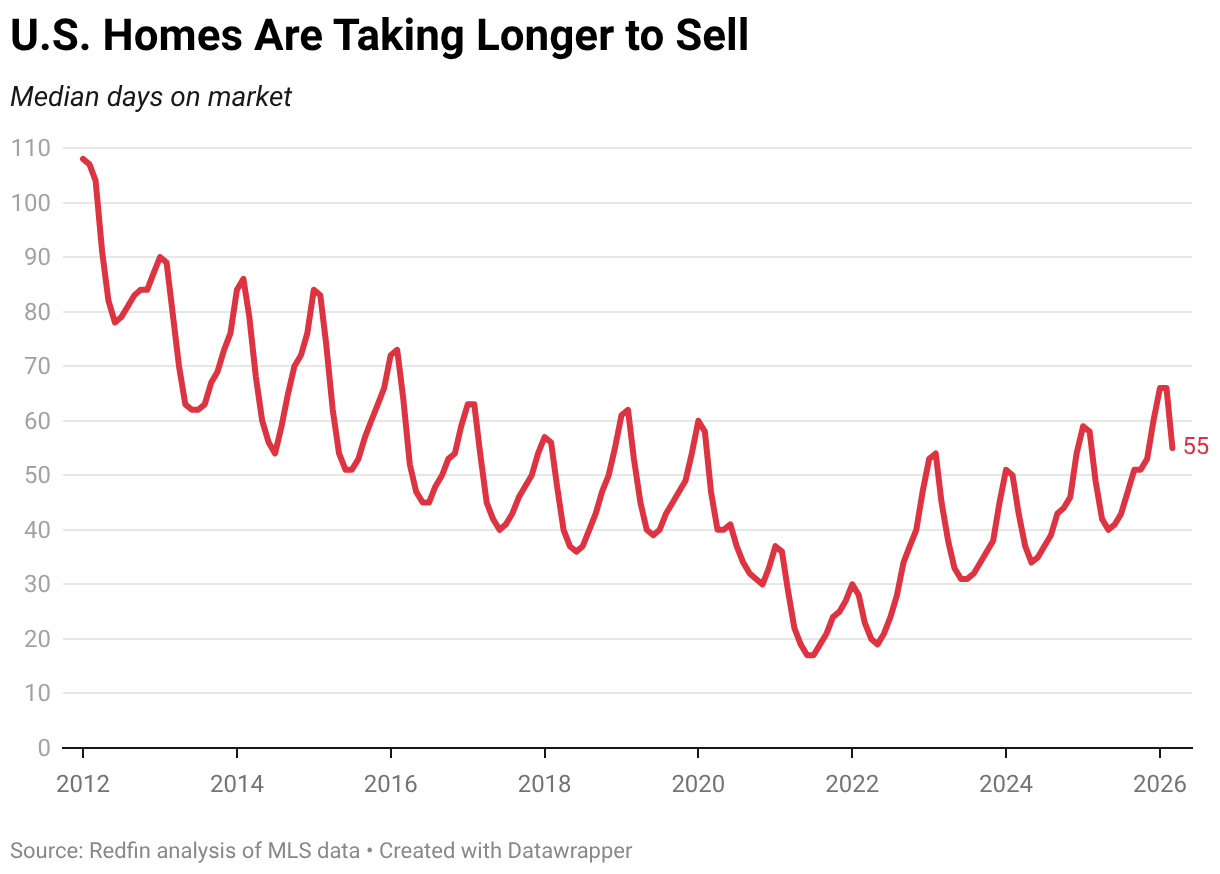
It’s worth noting that while both buyers and sellers have been retreating, buyers have retreated faster, which means they are far outnumbered by sellers. That imbalance is why buyers have negotiating power. Yes, home price growth is inching up, but buyers are also scoring the largest discounts in years as sellers watch their homes linger on the market. The typical home that went under contract in March did so in 55 days. That’s the slowest March pace in a decade and is up from 49 days a year earlier.
March 2026 Housing Market Highlights: United States
| March 2026 | Month-over-month change | Year-over-year change | |
|---|---|---|---|
| Median sale price | $436,733 | 1.8% | 1.2% |
| Existing-home sales, seasonally adjusted annual rate | 4,222,253 | -0.3% | -0.3% |
| Pending home sales, seasonally adjusted | 482,196 | 0.1% | -2.6% |
| Homes sold, seasonally adjusted | 427,358 | 0.6% | -1.6% |
| New listings, seasonally adjusted | 554,854 | 2.4% | -2.6% |
| Total homes for sale, seasonally adjusted (active listings) | 1,990,299 | -0.6% | 0.5% |
| Months of supply | 3.2 | -0.9 | -0.2 |
| Median days on market | 55 | -11 | 6 |
| Share of homes that sold above final list price | 25.6% | 2.9 ppts | -1.5 ppts |
| Average sale-to-final-list-price ratio | 98.7% | 0.5 ppts | -0.2 ppts |
|
Pending sales that fell out of contract, as % of overall pending sales |
13.4% | 0.2 ppts |
0.9 ppts |
| Monthly average 30-year fixed mortgage rate | 6.18% | 0.13 ppts |
-0.47 ppts |
March 2026 Metro-Level Highlights
The figures below are based on a list of the 50 most populous U.S. metropolitan areas. Some metros may be removed from time to time to ensure data accuracy. Refer to our metrics definition page for explanations of metrics used in this report. Metro-level data are not seasonally adjusted. All changes below represent year-over-year changes.
- Prices: Median sale prices rose most from a year earlier in San Francisco (14.4%), Detroit (11.1%) and Milwaukee (8%). They fell most in Oakland, CA (-6.3%), Dallas (-4.5%) and Sacramento, CA (-2.5%).
- Pending home sales: Pending sales rose most in West Palm Beach, FL (25.4%), Miami (13.5%) and Milwaukee (11.7%). They fell most in Providence, RI (-13.2%), New Brunswick, NJ (-11.5%) and New York (-10.9%).
- Closed home sales: Home sales rose most in West Palm Beach (15.5%), Kansas City, MO (11.7%) and Virginia Beach, VA (9.4%). They fell most in Nassau County, NY (-9.7%), Pittsburgh (-8%) and Oakland (-7.8%).
- New listings: New listings rose most in San Jose, CA (13.5%), Boston (9.3%) and San Francisco (9.1%). They fell most in Tampa, FL (-17.4%), Jacksonville, FL (-13.4%) and Miami (-13.3%).
- Active listings: Active listings rose most in Seattle (16.8%), Detroit (11.5%) and Milwaukee (10.8%). They fell most in Jacksonville (-18%), Tampa (-9.5%) and Riverside, CA (-9%).
- Days on market: In Nashville, the typical home that went under contract did so in 91 days, which was 23 days longer than a year earlier—the biggest increase among the metros analyzed. Next came Indianapolis (+22 days) and Austin, TX (+19 days). The biggest decreases were in Kansas City, MO (-5 days), Fort Worth, TX (-4 days), San Francisco (-3 days) and West Palm Beach (-3 days).
March 2026 Full Metro-Level Data
| U.S. metro area | Median sale price | Median sale price, Y/Y change | Pending sales, Y/Y change | Homes sold, Y/Y change | New listings, Y/Y change | Active listings, Y/Y change | Median days on market | Median days on market, Y/Y change |
|---|---|---|---|---|---|---|---|---|
| Anaheim, CA | $1,260,000 | 4.7% | 0.6% | 1.3% | -9.0% | -5.6% | 36 | 1 |
| Atlanta, GA | $392,000 | -0.8% | -2.9% | 4.7% | -3.2% | 1.7% | 59 | 4 |
| Austin, TX | $430,000 | -2.3% | 11.0% | 2.4% | -2.0% | 2.7% | 93 | 19 |
| Baltimore, MD | $399,000 | 6.4% | -0.8% | -3.5% | -0.8% | 6.6% | 41 | 9 |
| Boston, MA | $748,000 | 3.2% | -2.7% | -0.9% | 9.3% | 6.9% | 26 | 6 |
| Charlotte, NC | $408,000 | 0.5% | N/A | -2.9% | 2.6% | 8.2% | 74 | 14 |
| Chicago, IL | $375,000 | 4.2% | 2.7% | 2.3% | 2.3% | -1.8% | 51 | -2 |
| Cincinnati, OH | $310,000 | 6.9% | 7.1% | -1.2% | 3.1% | 6.5% | 45 | 2 |
| Cleveland, OH | $240,000 | 5.5% | -0.1% | -1.1% | -0.5% | 2.8% | 32 | 0 |
| Columbus, OH | $355,000 | 4.4% | 9.2% | 0.3% | 0.6% | 2.6% | 51 | 6 |
| Dallas, TX | $400,000 | -4.5% | 6.0% | 0.3% | -5.0% | -0.2% | 66 | 14 |
| Denver, CO | $589,000 | -1.0% | 0.0% | 2.8% | -6.9% | 0.6% | 24 | -1 |
| Detroit, MI | $200,000 | 11.1% | -6.4% | -7.6% | -2.8% | 11.5% | 37 | 6 |
| Fort Worth, TX | $352,585 | -0.7% | 5.5% | 1.0% | -1.8% | -1.8% | 54 | -4 |
| Houston, TX | $330,320 | -2.0% | -7.0% | -0.4% | -4.4% | 2.1% | 76 | 13 |
| Indianapolis, IN | $310,000 | 2.3% | 0.8% | -2.1% | -0.9% | 7.2% | 51 | 22 |
| Jacksonville, FL | $372,000 | 2.4% | -0.2% | -0.5% | -13.4% | -18.0% | 76 | 5 |
| Kansas City, MO | $345,000 | 6.2% | N/A | 11.7% | 5.3% | -0.4% | 32 | -5 |
| Las Vegas, NV | $450,000 | 0.0% | -2.8% | 2.9% | -6.7% | 5.7% | 62 | 10 |
| Los Angeles, CA | $913,400 | -1.3% | 1.1% | 4.0% | -2.7% | -2.0% | 45 | 3 |
| Miami, FL | $580,000 | 1.8% | 13.5% | 2.9% | -13.3% | -7.7% | 95 | 9 |
| Milwaukee, WI | $350,000 | 8.0% | 11.7% | 9.2% | 8.6% | 10.8% | 41 | -1 |
| Minneapolis, MN | $380,000 | 0.0% | -7.2% | -1.3% | 3.0% | 4.8% | 34 | 3 |
| Montgomery County, PA | $500,000 | 7.5% | -2.7% | 3.7% | -1.9% | 2.8% | 35 | 7 |
| Nashville, TN | $464,900 | 0.0% | -2.3% | -2.8% | 3.7% | 9.2% | 91 | 23 |
| Nassau County, NY | $737,000 | 5.3% | -9.8% | -9.7% | -4.8% | -7.9% | 46 | 8 |
| New Brunswick, NJ | $550,000 | 0.2% | -11.5% | -5.8% | 0.5% | 0.3% | 51 | 9 |
| New York, NY | $790,000 | 4.8% | -10.9% | -1.5% | -3.3% | -5.4% | 68 | 1 |
| Newark, NJ | $600,000 | 1.7% | -1.4% | -2.4% | -0.4% | 1.5% | 35 | -1 |
| Oakland, CA | $918,000 | -6.3% | N/A | -7.8% | -4.9% | -7.3% | 15 | 0 |
| Orlando, FL | $410,000 | 1.2% | -7.3% | -6.8% | -8.1% | -8.7% | 59 | -1 |
| Philadelphia, PA | $291,000 | 2.1% | -5.7% | -7.8% | 4.1% | 0.7% | 56 | 12 |
| Phoenix, AZ | $470,000 | 0.0% | 6.0% | 8.8% | -5.1% | -0.4% | 59 | 3 |
| Pittsburgh, PA | $250,000 | 6.4% | 1.8% | -8.0% | -2.3% | 1.0% | 72 | 3 |
| Portland, OR | $552,696 | 1.4% | 3.8% | 9.3% | 0.6% | 1.7% | 31 | 1 |
| Providence, RI | $525,000 | 6.7% | -13.2% | -7.5% | -11.1% | -3.1% | 37 | 7 |
| Riverside, CA | $585,000 | -1.7% | -0.7% | 0.9% | -8.7% | -9.0% | 54 | 2 |
| Sacramento, CA | $585,000 | -2.5% | 4.2% | 4.9% | 1.8% | -0.1% | 23 | 1 |
| San Antonio, TX | $313,725 | -0.1% | 0.1% | 2.8% | 6.3% | 1.0% | 105 | 18 |
| San Diego, CA | $915,000 | 0.0% | -1.4% | 9.2% | -0.3% | -2.6% | 27 | 2 |
| San Francisco, CA | $1,720,000 | 14.4% | N/A | 5.4% | 9.1% | -6.5% | 13 | -3 |
| San Jose, CA | $1,638,000 | -0.1% | N/A | 4.5% | 13.5% | 3.4% | 10 | -1 |
| Seattle, WA | $834,000 | 0.5% | -8.1% | -3.0% | 2.4% | 16.8% | 12 | 4 |
| St. Louis, MO | $281,000 | 6.0% | N/A | -3.3% | 7.2% | 10.0% | 33 | 5 |
| Tampa, FL | $375,000 | 1.4% | -7.1% | 0.1% | -17.4% | -9.5% | 56 | 7 |
| Virginia Beach, VA | $367,423 | 5.0% | -3.9% | 9.4% | 2.5% | -1.2% | 36 | 2 |
| Warren, MI | $313,000 | 4.3% | 3.2% | -1.4% | 2.5% | 10.2% | 32 | 6 |
| Washington, DC | $585,000 | 0.0% | 6.7% | 5.5% | 2.1% | 8.3% | 38 | 7 |
| West Palm Beach, FL | $515,000 | -1.0% | 25.4% | 15.5% | -7.3% | -5.0% | 86 | -3 |
The post San Francisco Home Prices Jump Most in 8 Years Amid AI Boom appeared first on Redfin Real Estate News.