Volume is one of the most widely used trading indicators in market analysis. The underlying idea is straightforward: a price move accompanied by high volume is generally considered more reliable, as it reflects stronger participation from market participants.
This apparent simplicity is what made volume so popular, leading many traders to rely on it as a confirmation tool for price movements.
Understanding how volume works is essential for anyone involved in trading or building systematic strategies. However, volume is not as easy to interpret as it may seem, and in several contexts it can be distorted or difficult to compare.
In this article, we will explore what volume actually represents, then focus on some of the most common pitfalls in its interpretation, along with practical ways to address them.
What Is Volume in Trading and How the Indicator Works
Volume represents the number of contracts or shares traded over a given period of time. On most trading platforms, it is displayed as a histogram, typically located at the bottom of the chart.
To better understand its meaning, consider a simple example: every trade involves a buyer and a seller. When a transaction is executed, volume increases based on the number of units exchanged. For instance, if 1 share is traded, volume increases by 1. If 100 shares are traded, volume increases by 100. In essence, volume simply measures the total number of transactions completed.
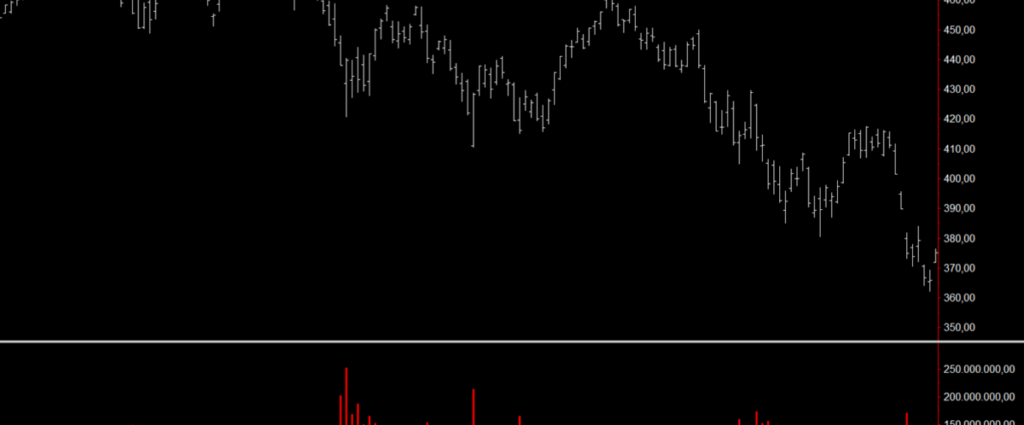
As shown in Figure 1, volume is always tied to a specific time interval. On a daily chart, for example, each bar in the histogram represents the total number of trades executed during that trading session. This means volume is not cumulative over time – it resets at the beginning of each new interval, reflecting activity within that specific period.
From a visual standpoint, it is easy to identify phases of lower activity, characterized by smaller volume bars, and phases where trading activity increases significantly, highlighted by noticeable spikes. This alternating pattern is one of the key reasons why volume has become such a widely used tool for analyzing market activity.
Figure 1. Volume indicator in trading: example of a volume histogram on a daily chart
Why Volume Is So Widely Used by Traders
As mentioned earlier, volume is often used as a confirmation tool for price movements. The underlying assumption is that higher volume reflects participation from larger market players, and therefore from more influential participants.
From this perspective, a significant increase in volume is typically interpreted as a sign of stronger interest and engagement, making …
This post was originally published here