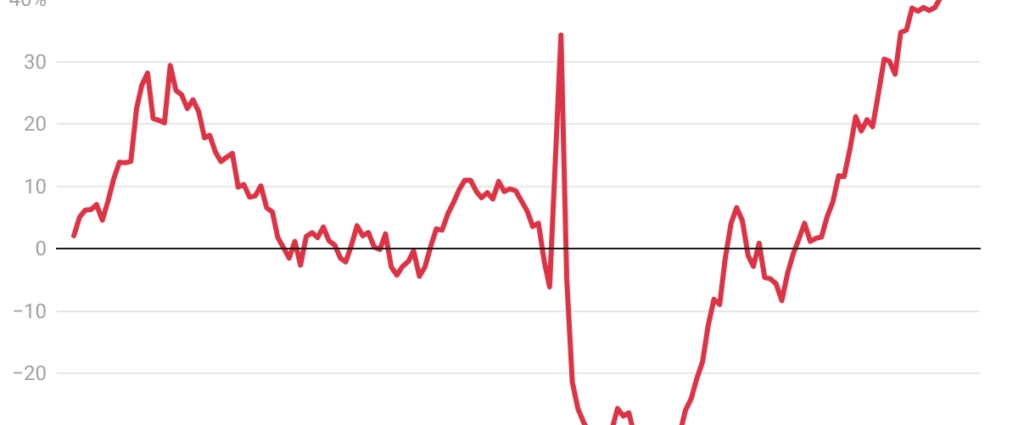
- Nationally, sellers outnumber buyers by 43%—just shy of the largest gap in records dating back to 2013. When sellers outnumber buyers, the buyers who are in the market have bargaining power.
- 38 of the most populous metro areas were buyer’s markets in March, up from 29 a year earlier. Just five were seller’s markets, down from nine in 2025.
- Home prices rose 5% across seller’s markets last month, compared with a 2% increase in buyer’s markets.
There were an estimated 43.1% more home sellers than buyers in the U.S. housing market in March (or 600,168 more, in numerical terms). That’s just shy of the largest gap in records dating back to 2013 and is up from 28% (or 432,532) a year earlier. The largest gap on record is 45.2% in December 2025.
We define a market where there are over 10% more sellers than buyers as a buyer’s market and a market where there are over 10% fewer sellers than buyers as a seller’s market. A market where the gap is plus or minus 10% is considered a balanced market. By this definition, it has been a buyer’s market since May 2024.
When sellers outnumber buyers, buyers typically hold the negotiating power because they have options. That’s why a market with a lot more sellers than buyers is considered a buyer’s market. Of course, it’s only a buyer’s market for those who can afford to buy. High housing costs and economic uncertainty have caused many house hunters to retreat, creating an imbalance of buyers and sellers.
“High property taxes, rising insurance costs and fears about job security are making homebuyers very selective,” said Barb Cooper, a Redfin Premier real estate agent in Austin, TX, where sellers outnumber buyers by 112%. “The buyers who are in the market want turnkey homes in every sense, and they can afford to wait without compromising because we have tons of inventory.”
We estimated the number of buyers using proprietary Redfin data on the typical time from a buyer’s first tour to close of purchase, and MLS data on active listings and pending sales. The estimated number of sellers in the market is simply the number of active listings in the MLS. These estimates, along with median-sale price data in this report, are seasonally adjusted and subject to revision. See a more detailed methodology here and view an interactive dashboard here.
Buyers Are Retreating, Which Is Causing Some Sellers to Retreat
There were an estimated 1.39 million homebuyers in the market in March, just shy of the 1.38 million record low hit in April 2020—the start of the pandemic. That’s little changed from a month earlier but down 10% from a year earlier.
There were an estimated 1.99 million sellers in the market—the lowest level in a year. That’s down 0.5% from a month earlier and up 0.7% from a year earlier.
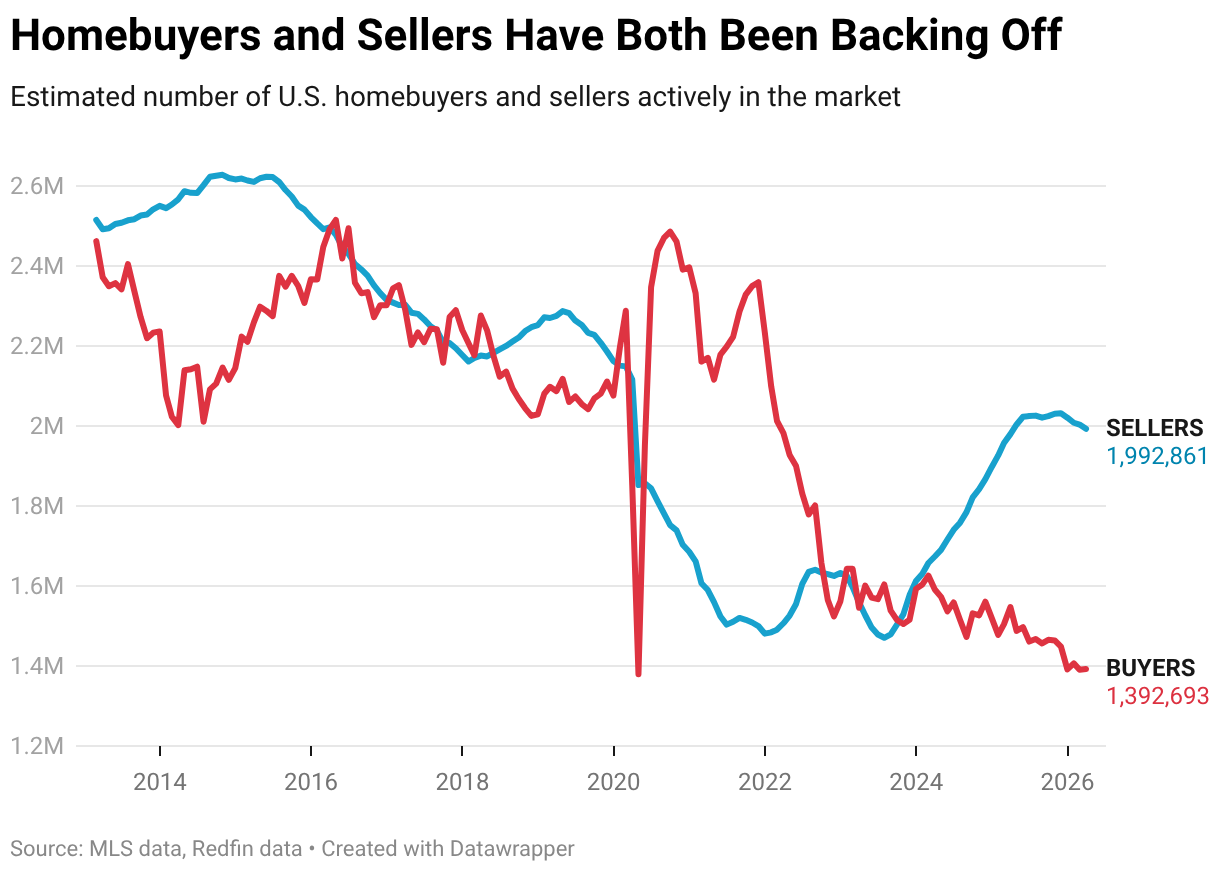
Home sellers have been retreating in part due to lackluster demand from buyers. Some sellers are delisting after watching their homes sit on the market, while others are choosing not to list at all after seeing nearby homes sell for below the asking price. Redfin did report last month that relistings are beginning to rise as sellers bet on a spring uptick in demand.
There Are 38 Buyer’s Markets, Down From 29 Last Year
Thirty-eight of the 49 U.S. metropolitan areas Redfin analyzed were buyer’s markets in March, up from 29 a year earlier. In five of those markets, there were over twice as many sellers as buyers.
The strongest buyer’s market was Miami, which had an estimated 148% more sellers than buyers. Next came Nashville (119%), Austin, TX (112%), San Antonio (109%) and Las Vegas (101%). Redfin analyzed the 50 most populous U.S. metropolitan areas and included in this analysis the 49 with sufficient data.
The Sun Belt skyrocketed in popularity during the pandemic, when scores of homebuyers moved in from more expensive parts of the country. To meet surging demand, homebuilders ramped up activity, which is one reason there are now a lot more homes for sale than people who want to buy them. The buyer pool has also shrunk because soaring housing costs in recent years have priced many people out of the market.
New construction can have a significant influence on whether negotiating power lies with buyers or sellers because it impacts the balance of supply and demand. The South and the West have historically issued the most building permits, while the Northeast and the Midwest (where the five seller’s markets are located) have issued the fewest.
Florida and Texas, in particular, build more homes than other states. Florida has also been grappling with intensifying natural disasters, soaring insurance premiums and rising condo HOA fees, which has prompted some homeowners to leave. Miami, specifically, frequently shows up as a buyer’s market because it has a lot of housing supply, which could be in part due to the high number of condos.
There Are 5 Seller’s Markets, Down From 9 Last Year
Just five of the metros Redfin analyzed were seller’s markets in March, down from nine a year earlier.
The strongest seller’s market in March was Newark, NJ, which had an estimated 30.4% fewer sellers than buyers. The other four seller’s markets were Nassau County, NY (-28%) Montgomery County, PA (-26.2%), Milwaukee (-19.7%) and New Brunswick, NJ (-12.5%).
On average, home prices rose 4.8% year over year across the five seller’s markets in March, compared with a 1.6% increase across the 38 buyer’s markets—an indication that buyer’s markets offer house hunters more leverage.
Metro-Level Summary: 50* Most Populous Metros (March 2026)
| U.S. metro area | Balance of power | Percent by which sellers outnumber buyers | Buyers | Sellers |
|---|---|---|---|---|
| Anaheim, CA | Buyer’s Market | 43.6% | 5,079 | 7,293 |
| Atlanta, GA | Buyer’s Market | 70.4% | 22,692 | 38,656 |
| Austin, TX | Buyer’s Market | 112.1% | 8,509 | 18,043 |
| Baltimore, MD | Balanced Market | -5.9% | 10,851 | 10,205 |
| Boston, MA | Balanced Market | -1.4% | 10,952 | 10,794 |
| Charlotte, NC | Buyer’s Market | 88.7% | 9,057 | 17,087 |
| Chicago, IL | Balanced Market | 1.4% | 25,427 | 25,795 |
| Cincinnati, OH | Buyer’s Market | 30.7% | 6,409 | 8,379 |
| Cleveland, OH | Balanced Market | -4.2% | 7,310 | 7,006 |
| Columbus, OH | Buyer’s Market | 22.8% | 7,081 | 8,698 |
| Dallas, TX | Buyer’s Market | 86.7% | 17,001 | 31,743 |
| Denver, CO | Buyer’s Market | 37.2% | 11,837 | 16,245 |
| Detroit, MI | Buyer’s Market | 48.7% | 4,910 | 7,304 |
| Fort Worth, TX | Buyer’s Market | 69.2% | 7,923 | 13,404 |
| Houston, TX | Buyer’s Market | 96.5% | 22,965 | 45,122 |
| Indianapolis, IN | Buyer’s Market | 23.6% | 7,723 | 9,543 |
| Jacksonville, FL | Buyer’s Market | 58.7% | 7,751 | 12,304 |
| Kansas City, MO | Buyer’s Market | 21.8% | 7,190 | 8,756 |
| Las Vegas, NV | Buyer’s Market | 100.7% | 7,110 | 14,272 |
| Los Angeles, CA | Buyer’s Market | 58.6% | 14,392 | 22,819 |
| Miami, FL | Buyer’s Market | 147.9% | 7,806 | 19,347 |
| Milwaukee, WI | Seller’s Market | -19.7% | 6,488 | 5,210 |
| Minneapolis, MN | Balanced Market | 9.0% | 12,833 | 13,989 |
| Montgomery County, PA | Seller’s Market | -26.2% | 6,905 | 5,094 |
| Nashville, TN | Buyer’s Market | 119.0% | 7,398 | 16,202 |
| Nassau County, NY | Seller’s Market | -28.0% | 9,978 | 7,181 |
| New Brunswick, NJ | Seller’s Market | -12.5% | 9,918 | 8,679 |
| New York, NY | Buyer’s Market | 12.6% | 24,811 | 27,946 |
| Newark, NJ | Seller’s Market | -30.4% | 8,153 | 5,672 |
| Oakland, CA | Buyer’s Market | 36.0% | 4,457 | 6,060 |
| Orlando, FL | Buyer’s Market | 81.4% | 9,965 | 18,075 |
| Philadelphia, PA | Buyer’s Market | 35.2% | 6,047 | 8,176 |
| Phoenix, AZ | Buyer’s Market | 79.1% | 18,415 | 32,979 |
| Pittsburgh, PA | Buyer’s Market | 55.3% | 6,030 | 9,364 |
| Portland, OR | Buyer’s Market | 45.5% | 7,502 | 10,914 |
| Providence, RI | Balanced Market | -1.9% | 4,202 | 4,124 |
| Riverside, CA | Buyer’s Market | 66.4% | 11,537 | 19,196 |
| Sacramento, CA | Buyer’s Market | 34.5% | 5,664 | 7,617 |
| San Antonio, TX | Buyer’s Market | 109.0% | 9,059 | 18,932 |
| San Diego, CA | Buyer’s Market | 29.2% | 6,272 | 8,103 |
| San Francisco, CA | Buyer’s Market | 12.1% | 2,592 | 2,905 |
| San Jose, CA | Buyer’s Market | 28.5% | 2,635 | 3,387 |
| Seattle, WA | Buyer’s Market | 34.9% | 7,681 | 10,359 |
| St. Louis, MO | Buyer’s Market | 17.8% | 8,754 | 10,312 |
| Tampa, FL | Buyer’s Market | 82.7% | 13,064 | 23,869 |
| United States of America | Buyer’s Market | 43.1% | 1,392,693 | 1,992,861 |
| Virginia Beach, VA | Buyer’s Market | 14.7% | 6,797 | 7,794 |
| Warren, MI | Buyer’s Market | 16.7% | 7,935 | 9,258 |
| Washington, DC | Buyer’s Market | 14.9% | 15,829 | 18,190 |
| West Palm Beach, FL | Buyer’s Market | 94.0% | 8,090 | 15,694 |
*Fort Lauderdale, FL has been removed due to insufficient data.
The post Homebuyers Hold the Negotiating Power In 38 Major Metros, Up From 29 Last Year appeared first on Redfin Real Estate News.