-
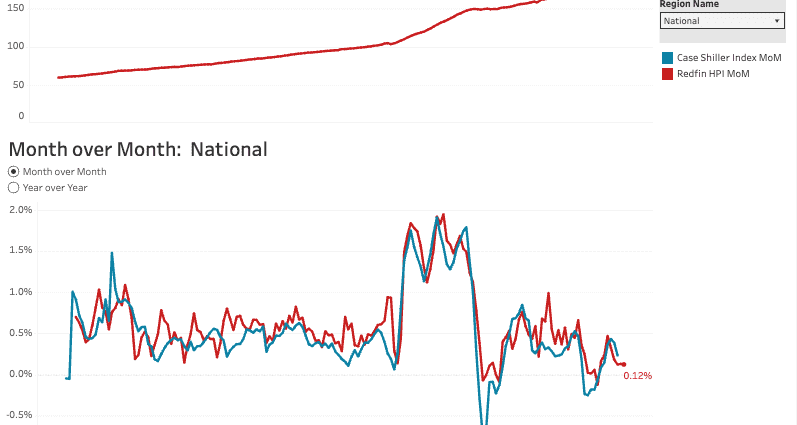
- Home prices ticked up 0.1% month over month on a seasonally adjusted basis.
- Prices rose 1.9% on a year-over-year basis–the slowest growth rate on record.
- On a local level, prices fell in 13 major metros month over month, with the biggest declines in Texas and the biggest increase in San Francisco.
U.S. home prices inched up 0.1% month over month in March on a seasonally adjusted basis, the third straight month of the same increase.
Prices rose 1.7% from a year earlier, the slowest year-over-year growth rate in records dating back to 2012. Home-price growth has been slowing since the start of 2025.
This is according to the Redfin Home Price Index (RHPI), which uses the repeat-sales pricing method to calculate seasonally adjusted changes in single-family home prices. The RHPI measures how sale prices of homes have changed since their previous sale—similar to the S&P Cotality Case-Shiller Home Price Indices—but is reported about a month earlier. March data covers the three months ending March 31, 2026. Read the full RHPI methodology here.
Home-price growth has slowed this year on a year-over-year basis because demand is tepid. Many would-be buyers have backed off due to high mortgage rates and uncertainty about the U.S. economy and the Iran war. Mortgage rates rose from 6% to 6.4% in March, largely because the Iran war pushed up oil prices and pushed markets into turmoil.
But prices are still rising, not falling, because new listings of homes for sale are declining. There are still hundreds of thousands more home sellers than buyers in the market, but now some homeowners are opting to stay put rather than list their home into a soft market.
“Price growth is losing steam, with the slowest annual gains we’ve seen in a decade–in line with our expectations for the year,” said Chen Zhao, Redfin’s head of economics research. “High mortgage rates and global uncertainty are causing some would-be buyers to back off, which is putting a lid on home prices. While that can be frustrating for homeowners hoping to sell, it’s the start of a reset for the housing market as a whole, and may ultimately bring homebuying costs down enough to bring some house hunters back.”
Home Prices Are Falling in 13 Major Metros, Led by Fort Worth and Austin
Home prices fell in 13 major U.S. metros month over month on a seasonally adjusted basis in March. Redfin analyzed the 50 most populous metro areas and included in this analysis the 46 with sufficient data.
The biggest declines were in Fort Worth, TX (-0.8%) and Austin, TX (-0.7%). Next come Nashville, TN (-0.6%), Oakland, CA (-0.6%) and Phoenix (-0.3%). The biggest increases were in Pittsburgh (2.8%), West Palm Beach, FL (2.1%), Nassau County, NY (1.4%), Chicago (1.3%) and San Francisco (1.2%).
The biggest year-over-year price declines were in San Antonio (-4.1%), Jacksonville, FL (-3.5%) and Austin (-3%). The biggest gains were in San Francisco (13%), Chicago (10.7%) and New York (9.2%). Prices are soaring in San Francisco largely because of the AI boom.
| Metro-Level Summary: Redfin Home Price Index, March 2026 | ||
| U.S. metro area | Month-over-month change (seasonally adjusted) | Year-over-year change |
| Anaheim, CA | 0.2% | 3.2% |
| Austin, TX | -0.7% | -3.0% |
| Baltimore, MD | 0.8% | 2.9% |
| Boston, MA | 0.5% | 3.6% |
| Chicago, IL | 1.3% | 10.7% |
| Cincinnati, OH | 0.6% | 3.9% |
| Cleveland, OH | 0.5% | 5.9% |
| Columbus, OH | 0.1% | -0.4% |
| Dallas, TX | 0.0% | -2.9% |
| Denver, CO | 0.1% | -0.3% |
| Detroit, MI | -0.1% | 6.2% |
| Fort Lauderdale, FL | 1.2% | 2.2% |
| Fort Worth, TX | -0.8% | -0.4% |
| Houston, TX | 0.3% | -1.6% |
| Indianapolis, IN | 0.2% | 0.8% |
| Jacksonville, FL | 0.3% | -3.5% |
| Las Vegas, NV | 0.0% | -0.6% |
| Los Angeles, CA | 0.7% | 0.2% |
| Miami, FL | 0.5% | 2.1% |
| Milwaukee, WI | 0.5% | 9.1% |
| Minneapolis, MN | 0.3% | 1.2% |
| Montgomery County, PA | 0.8% | 7.1% |
| Nashville, TN | -0.6% | -0.3% |
| Nassau County, NY | 1.4% | 7.9% |
| New Brunswick, NJ | 1.1% | 7.6% |
| New York, NY | 0.9% | 9.2% |
| Newark, NJ | 0.8% | 7.2% |
| Oakland, CA | -0.6% | 1.1% |
| Orlando, FL | -0.1% | -0.6% |
| Philadelphia, PA | -0.1% | 6.2% |
| Phoenix, AZ | -0.3% | -0.9% |
| Pittsburgh, PA | 2.8% | 5.6% |
| Portland, OR | -0.1% | -0.4% |
| Providence, RI | 1.0% | 4.9% |
| Riverside, CA | 0.2% | -1.2% |
| Sacramento, CA | -0.2% | -0.6% |
| San Antonio, TX | -0.2% | -4.1% |
| San Diego, CA | 0.7% | 1.4% |
| San Francisco, CA | 1.2% | 13.0% |
| San Jose, CA | 0.5% | 2.7% |
| Seattle, WA | 0.5% | -0.3% |
| Tampa, FL | 0.3% | 2.5% |
| Virginia Beach, VA | 0.7% | 4.3% |
| Warren, MI | -0.3% | 4.2% |
| Washington, DC | 0.2% | 0.8% |
| West Palm Beach, FL | 2.1% | -0.9% |
The post U.S. Home Prices Inched Up 0.1% in March appeared first on Redfin Real Estate News.