By JBizNews Desk
May 11, 2026
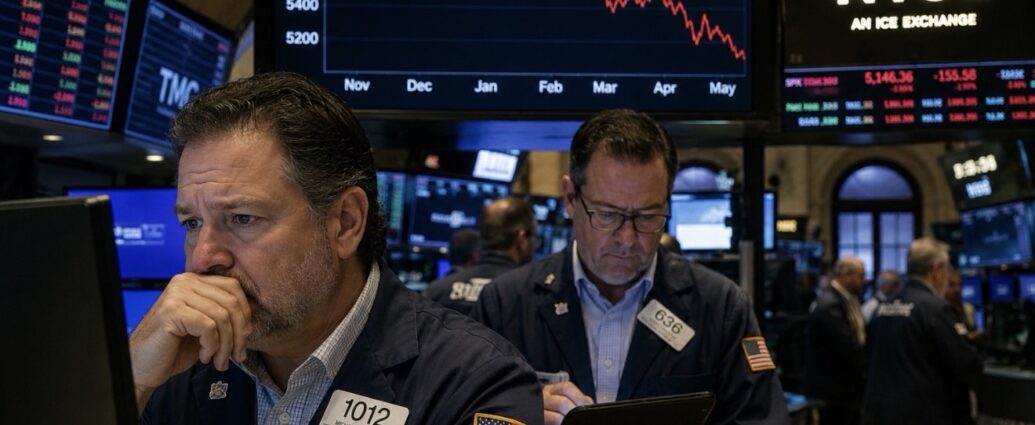
The S&P 500 just recorded six consecutive winning weeks, touched fresh all-time highs, and is trading near 7,400. By nearly every surface measure, the bull market looks healthy. But underneath the record closes, a closely watched valuation metric is sounding an alarm it has sounded only twice before in history — and both times, what followed was catastrophic.
The signal in question is the S&P 500 Shiller CAPE Ratio — formally known as the Cyclically Adjusted Price-to-Earnings ratio — a measure developed by Nobel Prize-winning economist Robert Shiller that compares the current price of the S&P 500 to its inflation-adjusted earnings averaged over the prior ten years. Unlike a standard price-to-earnings ratio, the ten-year averaging smooths out short-term earnings spikes and gives a cleaner read on whether the market is genuinely cheap or expensive relative to its underlying fundamentals. The historical average CAPE ratio since 1871 sits at approximately 17. Today it hovers near 40.
The market has only reached this valuation territory twice before in recorded history.
The first time was in the late 1920s, when the ratio climbed into the mid-30s in the lead-up to the crash of 1929 and the Great Depression that followed. The second was at the peak of the dot-com bubble in late 1999 and early 2000, when the ratio reached an all-time high of 44.19 before technology stocks collapsed and the S&P 500 lost nearly half its value over the subsequent two years.
At roughly 40 today, the current reading sits between those two historic extremes — higher than the pre-Depression peak and approaching the dot-com record.
The root of today’s elevated reading is not difficult to identify.
The S&P 500 posted double-digit gains for three consecutive years, a feat accomplished only five times in the index’s history. Over that stretch, the index rose more than 78%, a pace more than double its long-term average annual return of approximately 10%.
Much of that surge was driven by artificial intelligence enthusiasm and a narrow group of mega-cap technology companies whose valuations now dominate the broader market.
Nvidia, Alphabet, Amazon, Microsoft, and Apple account for an outsized share of the index’s total market value, while their earnings — including the massive AI-related investment gains recently highlighted by Goldman Sachs — have carried much of the apparent profit growth driving the rally.
The result is a market increasingly dependent on a small cluster of companies tied directly to the AI infrastructure boom.
Mark Zandi, chief economist at Moody’s Analytics, offered a blunt assessment of the underlying economic picture last week.
“We’d likely be in a recession already if not for the AI investment-driven boom,” Zandi said.
That single sentence captures the increasingly fragile nature of the current market environment: a powerful rally built on genuine technological transformation, but concentrated inside a remarkably narrow portion of the economy.
History, however, offers some important nuance.
A high CAPE ratio does not predict the exact timing of a market reversal.
In both prior historical instances, stocks continued climbing for months — and in some cases years — after valuations entered dangerous territory before ultimately collapsing.
During the late 1920s, markets continued advancing through September 1929 before unraveling in October. During the dot-com era, valuations remained elevated through much of 1999 before the technology crash accelerated in early 2000.
The lesson many market historians draw is not that elevated valuations immediately end bull markets, but that they reliably create conditions for sharper eventual declines once investor psychology finally shifts.
The parallels to the late-1990s technology bubble are increasingly difficult for analysts to ignore.
Cisco Systems became one of the most transformative and important companies of the internet era, supplying the networking hardware that powered the expansion of the modern web. But investors who bought Cisco shares near their 2000 peak waited more than two decades for the stock to revisit those levels.
The company itself succeeded. The valuation did not.
That same tension — between transformative technology and prices assuming near-perfect long-term execution — is increasingly becoming the defining risk surrounding today’s AI-driven market.
Investors are not necessarily wrong that artificial intelligence may reshape the global economy. The concern is whether current stock prices already assume years of flawless growth, expanding margins, and uninterrupted demand before many of the long-term economic benefits have fully materialized.
Wall Street strategists remain deeply divided over how sustainable the current rally truly is.
Bullish investors argue the AI boom represents a once-in-a-generation technological shift comparable to the rise of the internet itself, justifying historically elevated valuations for companies controlling critical semiconductor, cloud-computing, and artificial intelligence infrastructure.
More cautious analysts counter that even revolutionary technologies can produce devastating investment outcomes when expectations outrun reality.
None of this means a crash is imminent or inevitable.
The S&P 500 could continue climbing, corporate earnings may remain strong, and many individual stocks inside the broader market still trade at reasonable valuations even as the index itself becomes increasingly expensive.
But the CAPE ratio is sending investors a message worth paying attention to.
At a valuation reading near 40 — a level historically seen only before the Great Depression and the collapse of the dot-com bubble — the market is pricing in a future that leaves remarkably little room for disappointment.
— JBizNews Desk
© JBizNews.com. All rights reserved. This article is original reporting by JBizNews Desk. Unauthorized reproduction or redistribution is strictly prohibited.