
A 40- to 50 basis-point jump in mortgage rates during the second quarter has weighed heavily on fix-and-flip demand, according to the latest Fix and Flip Market Index from John Burns Research & Consulting and Kiavi.
The overall index fell to a reading of 59 in the second quarter, down from 63 in the prior quarter, marking the second consecutive quarterly decline.
The survey of approximately 275 home flippers revealed that 59% reported an increase in days on market compared with the first quarter, including 83% of flippers in the Northwest and 75% in Texas.
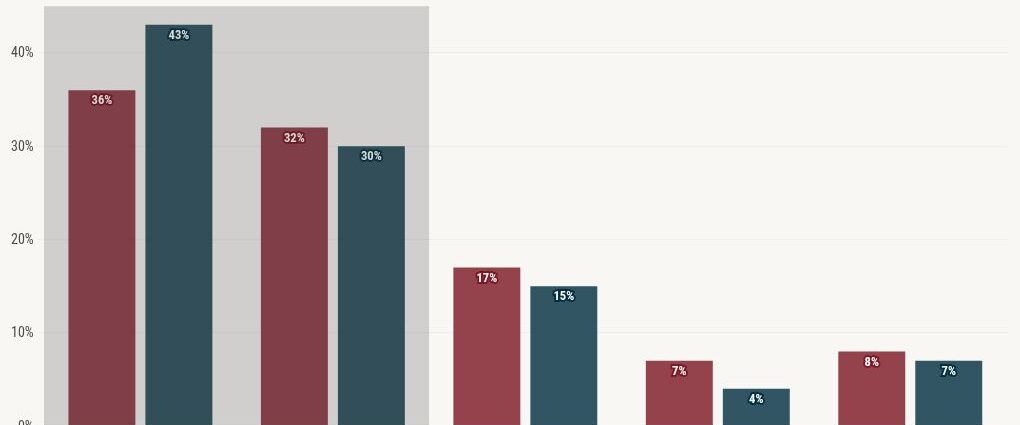
One in five flippers reported selling their homes “mostly below” estimated after-repair values (ARVs), up from 17% in the previous quarter. Nationally, 73% of flipped homes sold for less than $500,000 over the past 12 months.
Flippers in the Southeast and Texas reported the most weakness, with more respondents rating current sales conditions as “poor” than “good.”
“The spring picked up, but the Iran conflict poured water on a heating market. Since [July] 4, there is a noticeable slowdown that feels like it may continue through the balance of the year,” a Nashville-based flipper noted in the report.
Regional disparities emerge
Only Northern California and the Midwest reported more flippers selling above ARVs than below.
Conversely, flippers in the Southwest, Northwest, Florida, Texas and the Southeast reported more sales below ARV.
Northern California commanded the highest average flipped home price at $1.2 million, while average renovation costs fell nationally to $69,000, down from year-ago levels.
Renovations now account for 15% of flipped home sales prices, down from 17% one year ago.
Large flippers outperform
For the first time, the survey segmented sentiment by flipper size.
Large flippers — defined as those who bought or sold eight or more homes in the prior 18 months — consistently reported stronger market conditions than smaller operators.
“Flippers with consistent volume may have several advantages, including favorable financing terms from lenders for repeat borrowers, deeper relationships with contractors, or a more sophisticated deal pipeline (off-market, wholesale, etc.),” the report stated.
Approximately half of flipped homes were sold to entry-level buyers, while just 15% were purchased by investors in Q2 2026. Move-up and luxury home renovations averaged higher costs, reflecting larger square footage and higher-quality materials.
Financing trends, Realtor implications
Fifty-nine percent of flippers reported securing new loans in Q2, the highest share in two years.
Average effective interest rates on fix-and-flip loans continued to compress slowly, with analysts expecting further compression as institutional capital enters the residential transition lending space.
With longer days on market becoming the norm — particularly in Texas and the Northwest — real estate agents should prepare clients for extended marketing periods.
The report cautioned that “modeling on backwards-looking comps can understate time-to-sell in today’s markets.”
Flippers are increasingly exploring rental exits. As one Dallas-based flipper noted, “With the increase in days on market, owners are offering properties for rent in hopes of obtaining qualified renters who are moving into the area.”
Renovation scope
Most flippers (91%) perform moderate or heavy renovation work, ranging from cosmetic updates to full-gut renovations.
But the share of repair-and-remodel spending coming from the fix-and-flip space is expected to decrease in the near term as transaction volume and renovation spending both declined year over year.
The survey, conducted in partnership with Homevestors, measured current sales activity at 57 out of 100, with expected sales activity at 61 out of 100 on the index scale.
Values below 50 indicate contraction, while values above 50 indicate expansion.
This article was written by Jonathan Delozier and generated with the assistance of HousingWire Automation. It was reviewed by a HousingWire editor before publication.