Leadership in an Age of Disruption: A Conversation with Mitt Romney
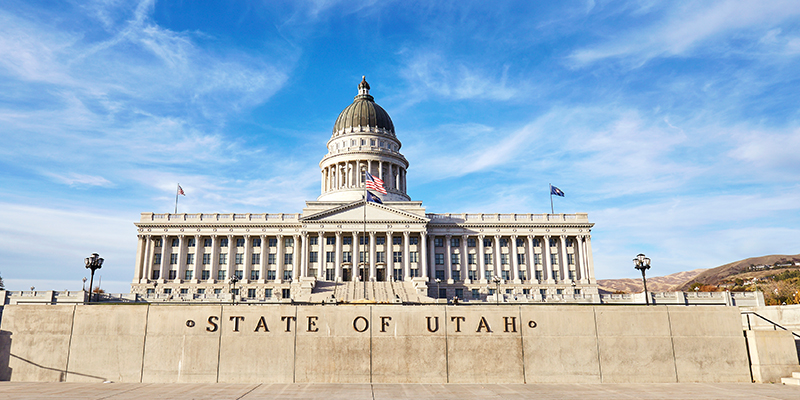
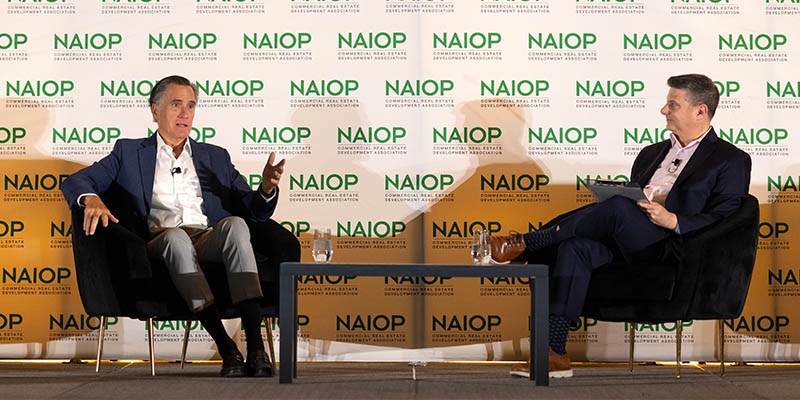
In a wide-ranging conversation at NAIOP’s National Forums Symposium this week in Salt Lake City, former U.S. Senator Mitt Romney shared candid insights on leadership, economic uncertainty, artificial intelligence and the future of American institutions. Drawing from decades in both public service and private equity, Romney offered a sobering – but ultimately hopeful – assessment of where he sees the country stand today.
A Defining Moment of Disruption
Romney didn’t mince words when describing the current moment.
“This is a turbulent, difficult time to make any predictions,” he said. “It is an inflection point in global history.”
He compared today’s environment to major turning points like the Industrial Revolution and the rise of the semiconductor – but emphasized that artificial intelligence may surpass them all in impact.
“AI is quite significantly more dramatic in terms of the impact it’s going to have on the economy, on geopolitics, on our families’ lives. It is a completely disruptive technology,” he said.
At the same time, he pointed to compounding challenges: rising national debt, geopolitical competition with China, and a growing mental health crisis among young people.
“With all those things going on, this is probably a time for strong leadership, capable leadership,” Romney said, noting that extraordinary leaders are making their mark in corporate America and in religious institutions, but that, “politically, I think we’re coming up a little short, not so much in the states as it is at the federal level.”
The Risks We’re Not Addressing
When asked what leaders should be paying more attention to, Romney returned to AI – but with a warning that what concerns him most is the lack of coordinated oversight and the absence of international cooperation.
“When we were working on the nuclear weapon, we had all of the technologists in one place, making sure the technology didn’t escape,” he said. “With regards to AI, it’s going on entirely in the private sector… run like cowboy capitalism.”
Why the Private Sector Matters Most
Romney, who built his business career at Bain Capital, made a point that resonated strongly with the audience of commercial real estate leaders.
“What you do is harder than what Washington does,” he said, acknowledging the real risks associated with commercial real estate development. “If you mess up, you’ll lose your money, your job, and maybe the jobs of a lot of people.”
He contrasted that with government accountability and underscored the importance of economic strength.
“The reason we [the U.S.] have dominated the world is not because of the brilliance of our representatives. It’s because of the extraordinary strength of our economic engine.”
“I used to think that if a company had a really good strategy, they would be successful,” he said, “And [if they have] a bad game plan, a bad strategy, they’re not going to succeed.”
“The biggest surprise to me, the biggest lesson learned through my private sector career and public sector career, is the impact of a leader,” he said.
Leading Through Turnaround Moments
Romney drew on his experience leading the 2002 Winter Olympics turnaround that rescued the games from massive debt to illustrate how leaders should act in times of crisis.
“The first thing we did was a strategic audit, looking at every aspect of the enterprise and taking everything apart,” he explained. “Then we asked ourselves, what do we have to do well to succeed? What is the absolute critical thing [we] have to have? What’s our purpose?”
“The one thing we have to have run perfectly is the field of play for the athletes, and everything else comes second,” he summarized.
Assembling the right team of skilled individuals to earn financial grants, secure sponsorships, build venues, run operations, manage volunteers, and manage media relations was a critical yet difficult task.
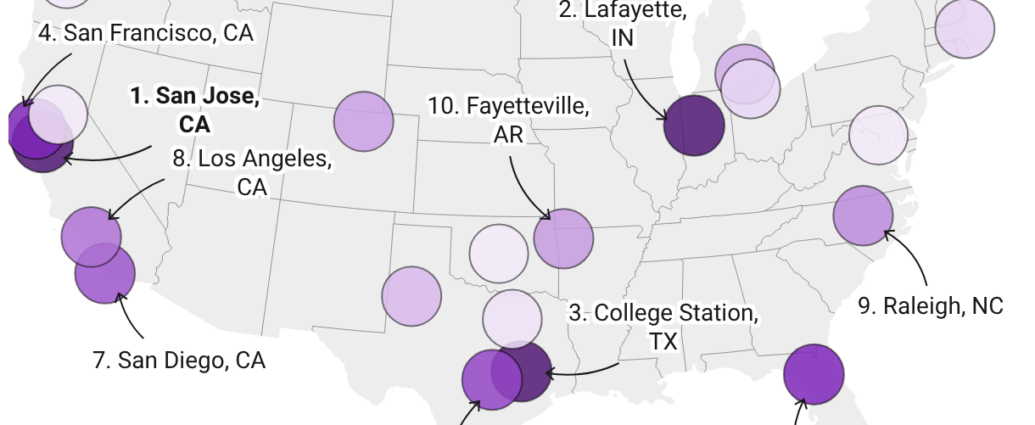
Romney said he expects that the team who will lead the 2034 games hosted again in Salt Lake City, as well as the 2028 summer games in Los Angeles, have learned from their experience.
“The key thing for the Olympics is for the host city to change the mindset from, “How can I make the most money out of these Olympics?” to “How can I serve the athletes to make sure they have a fabulous experience and serve the people who come here from the rest of the world?”
A Pragmatic Approach to Healthcare Reform
Reflecting on his years as governor of Massachusetts, Romney discussed the origins of the state’s landmark healthcare reform.
“At the time, we had almost 10% of the state population who didn’t have health insurance, and I recognized that. But I recognized there was no way that the state could pay to give everybody health insurance,” he said.
The solution was a market-based approach: require those who can afford insurance to buy it, subsidize those who cannot, and repurpose existing funds.
This took bipartisan cooperation across the state, including with former U.S. Senator Ted Kennedy (D), who helped coordinate across the federal government to adjust the rules on Medicaid in the state.
“It ended up working,” Romney said. “Today, almost everybody in the state has health insurance.”
He noted that while elements were later adopted nationally, he believes “a state-by-state model was the right way.”
Trust in Institutions
Romney emphasized that America’s economic success is rooted in something deeper than policy: trust.
“We have absolute conviction that we are a nation of laws, and that justice is blind,” he said.
However, he warned that this foundation may be eroding.
“There’s a sense that is somewhat in jeopardy, and that who you know makes a difference,” pointing to increasing politicization, particularly in judicial appointments, as a concern for long-term stability.
Despite his concerns, Romney expressed confidence in America’s ability to adapt, highlighting the country’s culture of experimentation and competition as a key advantage.
“The great advantage America has, in my opinion, is the elixir of freedom,” he said. “That’s what has allowed us to outperform the world.”
Even if challenges escalate, he believes the system will respond – either through crisis or leadership. “I’m convinced that we will probably have a crisis or two associated with AI and with our debt and with our education system, all the things I described as problems,” he said. “We will have a crisis that will wake us up, or a leader that will stand up before the crisis occurs.”
A Call for Truthful Leadership
Romney closed with a reflection on what the country needs most from its leaders.
“We need leaders who tell the truth, whether it’s good news or bad news,” he said.
And while he ruled out another presidential run, he made clear what he’s looking for in the next generation.
“Someone who can rise to the occasion, is willing to tell us the truth about the challenges we have and is willing to address them,” he said.
Featured image by Brie Pereboom. Find her on Instagram @BriePereboom.