
Transaction activity slowed across much of the housing market as mortgage rates remained elevated, but metros where homes remain within reach of buyers continued outperforming higher-priced markets.
Mortgage rates remained above 6.64% for most of the week, creating another headwind for housing demand. As HousingWire Lead Analyst Logan Mohtashami reported in this week’s Housing Market Tracker, pending home sales were essentially flat year over year while mortgage purchase applications posted only their third negative annual reading of 2026.
The national data tells us what happened. Metro-level data helps explain where it happened and why some housing markets are proving more resilient than others.
What the national data shows
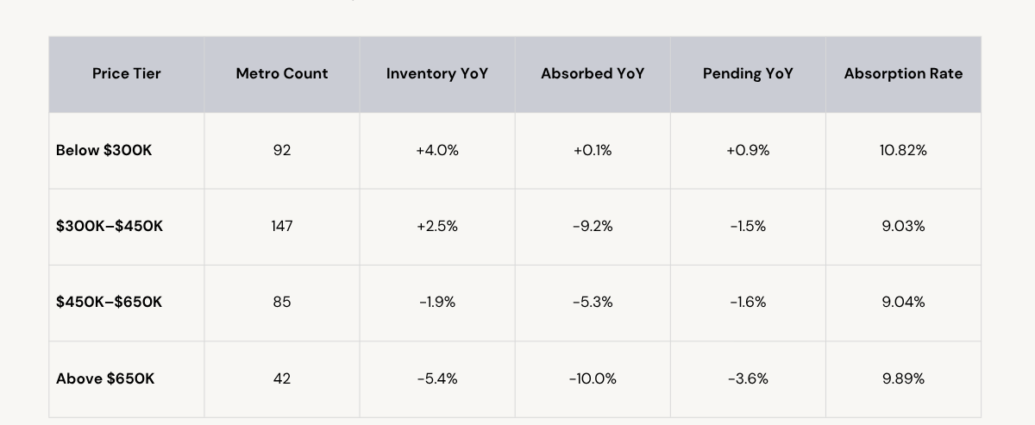
Across more than 350 metro areas, transaction activity softened broadly during the week ending July 17. Absorbed listings declined year over year in three of four price tiers. The exception was the market’s most affordable segment.
This week’s results also align with a broader pattern observed during periods of elevated mortgage rates. Housing activity tends to hold up better where homes remain affordable to a larger share of buyers.
Below $300,000, absorbed listings were essentially flat year over year, making it the only price tier to avoid a meaningful decline. Inventory in that segment increased 4.0%, suggesting additional supply is still finding buyers rather than accumulating.
At the other end of the market, absorbed listings in metros above $650,000 fell 10.0% while inventory declined 5.4%, indicating demand weakened faster than available supply.
Two markets, two outcomes
Kansas City shows where affordability continues supporting demand
Kansas City, Mo., shows how affordability can continue supporting market activity even as national demand softens. Inventory expanded alongside stronger pending sales, more completed transactions, fewer price reductions and significantly faster selling times.
- Active inventory: 4,609 to 5,395 (+17.1%)
- Absorbed listings: 557 to 604 (+8.4%)
- Estimated sales: 516 to 570 (+10.6%)
- New pending contracts: 572 to 655 (+14.5%)
- Median days on market: 56 to 28
- Share of listings with price reductions: 43.0% to 32.5%
With a median list price of $425,000, Kansas City remains relatively affordable, allowing buyers to continue demonstrating purchasing power despite elevated mortgage rates. Together, these metrics show new supply translating into stronger market activity rather than accumulating on the sidelines.
Miami shows where elevated borrowing costs continue to weigh on activity
Miami, Fla., tells a different story. Inventory contracted significantly from a year ago, but transaction activity slowed even faster while months of inventory increased.
- Active inventory: 18,619 to 13,319 (-28.5%)
- Absorbed listings: 1,332 to 741 (-44.4%)
- Estimated sales: 1,212 to 684 (-43.6%)
- New pending contracts: 764 to 723 (-5.4%)
- Median days on market: 84 to 84
- Months of inventory: 3.55 to 4.50
The gap between declining inventory and even weaker transaction activity suggests demand weakened faster than available supply, softening market conditions despite fewer homes for sale.
Together, Kansas City and Miami illustrate this week’s national housing story. Elevated mortgage rates are affecting every market, but affordability continues to shape which markets remain the most resilient.
Why it matters
The July 17 data reinforces an important point: housing markets do not respond uniformly to higher mortgage rates. Local affordability continues shaping where transactions occur and how efficiently available inventory converts into sales.
For housing professionals, the practical question is not simply whether inventory is rising or falling. It is whether available inventory is converting into transactions and how that conversion rate differs across price tiers and geographies.
A market adding inventory may be creating more opportunity. A market where both supply and demand are contracting simultaneously may signal something more significant. Understanding that difference is where local market expertise becomes most valuable.
The Spotlight takeaway
Mortgage rates may influence the national housing market, but affordability continues shaping local outcomes. This week’s data shows lower-priced metros holding up better as demand softened, reinforcing why housing professionals should evaluate not just inventory levels, but how effectively markets convert available homes into transactions.
Explore the data
Track transaction growth, inventory and market efficiency in your own market with HousingWire Intelligence (HWi), which provides inventory, pricing, demand and market activity data at the national, metro and ZIP code levels.
For weekly analysis of mortgage rates, housing demand and the macroeconomic forces shaping the market, read Logan Mohtashami’s Housing Market Tracker.
HousingWire Data methodology: This analysis is based on HousingWire Data’s national single-family housing dataset through July 17, 2026, with year-over-year comparisons to the week ending July 18, 2025. Price tiers are grouped using each metro’s median list price during the analysis week. Metrics include active inventory, absorbed listings, new pending contracts, estimated sales, median days on market, months of inventory and absorption rate, providing a standardized view of housing market performance across more than 350 U.S. metro areas.
Enterprise organizations interested in licensing HousingWire’s housing market data, APIs and analytics can learn more about HousingWire Data.