We’re seeing a small spring rebound, with new listings of homes for sale ticking up.
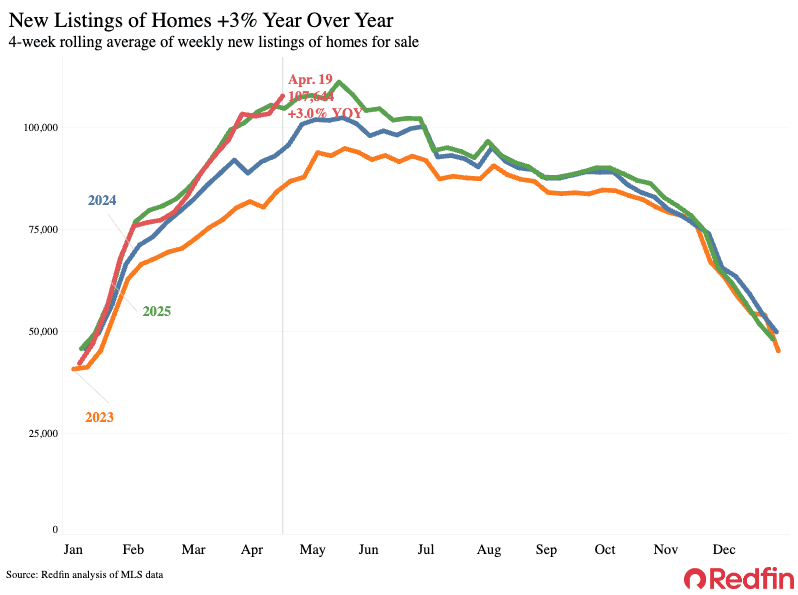
New listings of U.S. homes for sale rose 3% year over year during the four weeks ending April 19, the biggest increase since November.
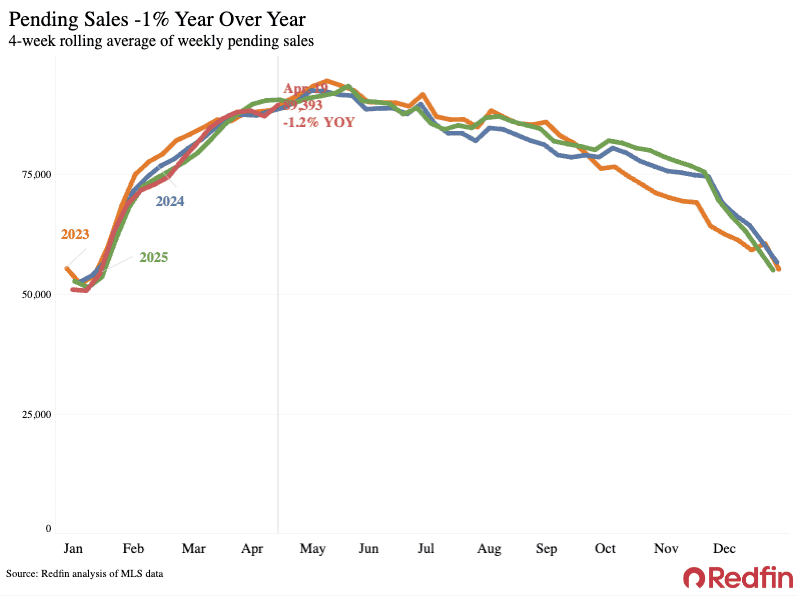
Pending home sales fell 1.2% year over year, the smallest decline in about a month. Mortgage-purchase applications rose 10% week over week.
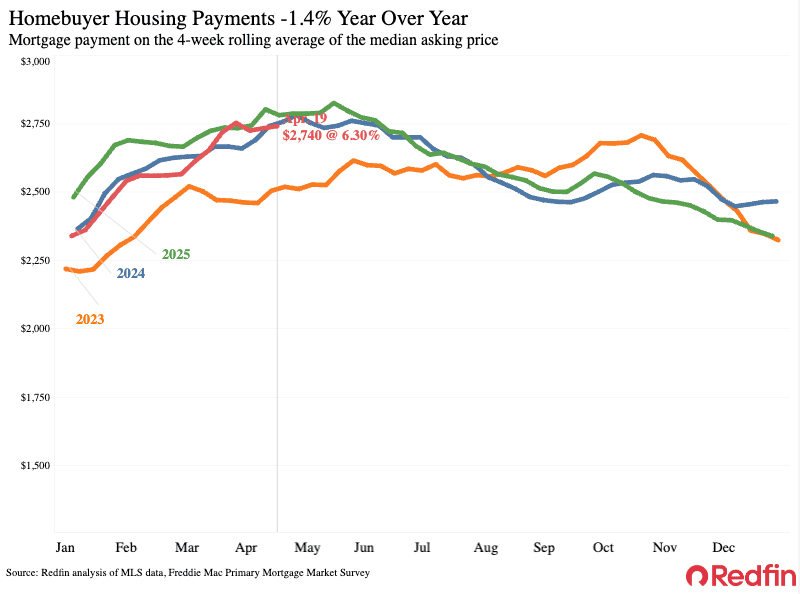
Some home sellers and buyers have entered the market as mortgage rates decline. The weekly average mortgage rate fell to 6.3% from 6.46% two weeks earlier, bringing the median monthly housing payment down 1.4% year over year. Additionally, there were some signs last week that the end was in sight for the Iran war, which sent oil prices down temporarily. That may have brought some home sellers and buyers off the sidelines as they felt more confidence in the economy.
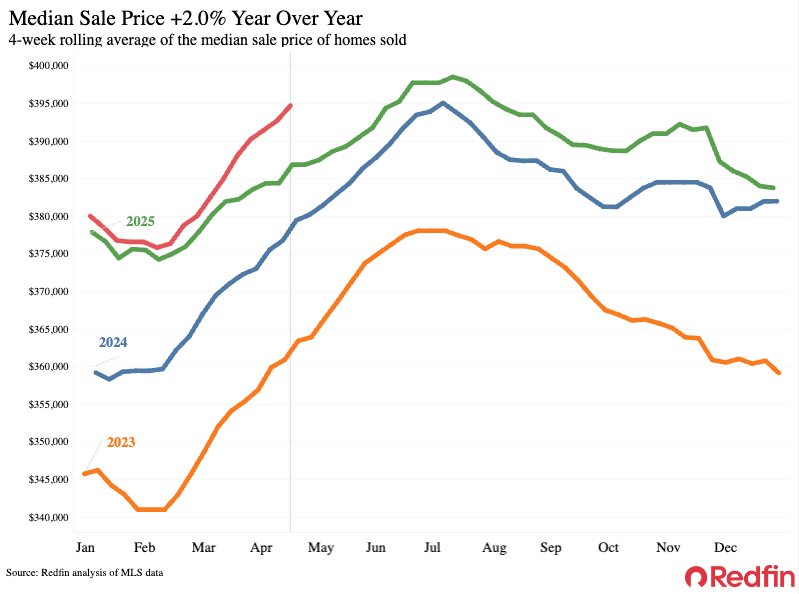
Still, this spring’s homebuying season is off to a slow start. Mortgage rates are still above the sub-6% rates we saw briefly in February, and home-sale prices are up 2% year over year. In addition to elevated costs, some Americans are shying away from selling or buying homes because the economy feels shaky, partly due to concerns about job security and the Iran war.
“The leaves are turning green, the flowers are blooming, and more sellers are listing their homes in hopes of moving before the next school year starts,” said Adrianna Berlin, a Redfin agent in Grand Rapids, MI. “While some people are holding off on selling or buying because they’re holding out hope that mortgage rates will plummet, most have come to terms with today’s costs. The people who need to move this summer are starting to list their homes or prepare for listing.”
A recent Redfin analysis found that late April is the best time to list a home for sale nationwide, though the prime window varies by region.
For Redfin economists’ takes on the housing market, please visit Redfin’s “From Our Economists” page.
Leading indicators
| Indicators of homebuying demand and activity | ||||
| Value (if applicable) | Recent change | Year-over-year change | Source | |
| Daily average 30-year fixed mortgage rate | 6.32% (April 22) | Down from 6.64% about a month earlier | Down from 6.98% | Mortgage News Daily |
| Weekly average 30-year fixed mortgage rate | 6.3% (week ending April 16) | Down from 6-month high 2 weeks earlier | Down from 6.62% | Freddie Mac |
| Mortgage-purchase applications (seasonally adjusted) | Up 10% from a week earlier (as of week ending April 17) | Up 14% | Mortgage Bankers Association | |
| Google searches of “homes for sale” | Up 5% from a month earlier (as of April 18) | Up 18% | Google Trends | |
| Touring activity | Up 32% from the start of the year (as of April 18) | At this time last year, it was up 35% from the start of 2025 | ShowingTime | |
Key housing-market data
| U.S. highlights: Four weeks ending April 19, 2026
Redfin’s national metrics include data from 400+ U.S. metro areas and are based on homes listed and/or sold during the period. Weekly housing-market data goes back through 2015. Subject to revision. |
|||
| Four weeks ending April 19, 2026 | Year-over-year change | Notes | |
| Median sale price | $394,687 | 2% | |
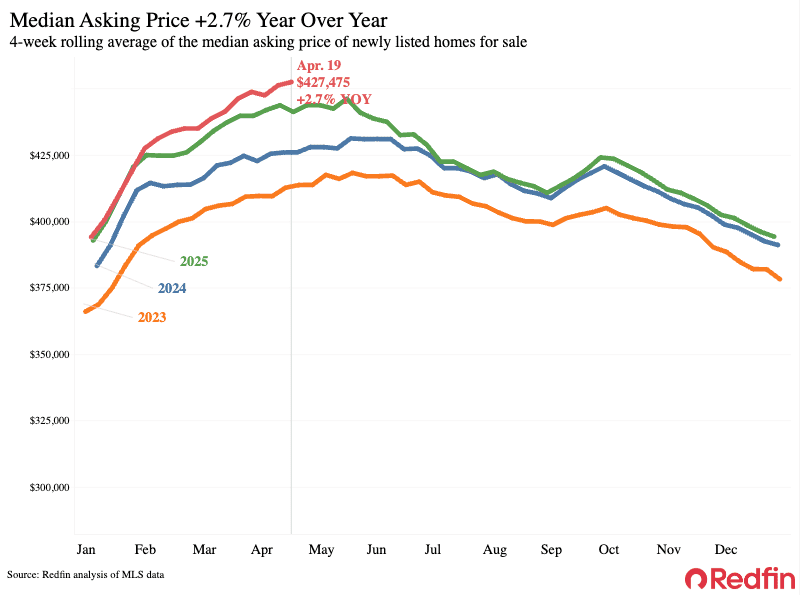
| Median asking price | $427,475 | 2.7% | |
| Median monthly mortgage payment | $2,740 at a 6.3% mortgage rate | -1.4% | |
| Pending sales | 89,393 | -1.2% | |
| New listings | 107,644 | 3% | Biggest increase since November |
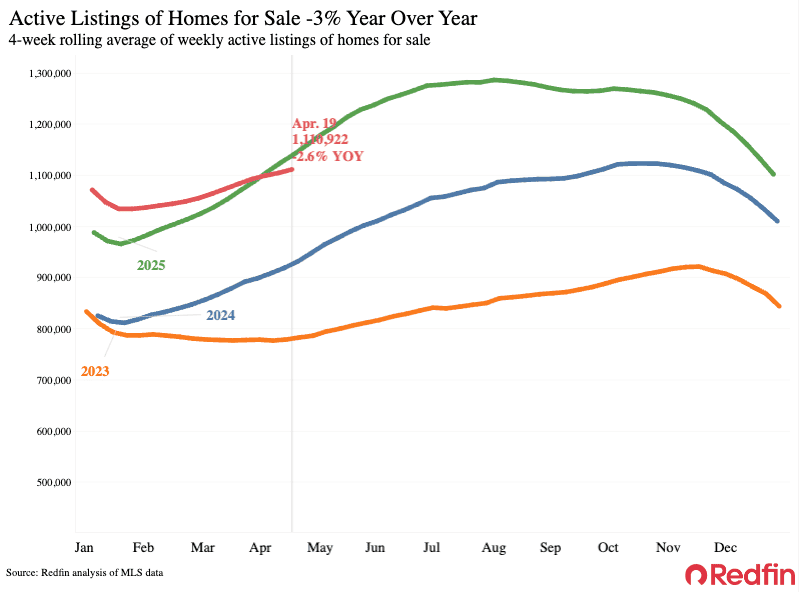
| Active listings | 1,110,922 | -2.6% | Biggest decline since 2023 |
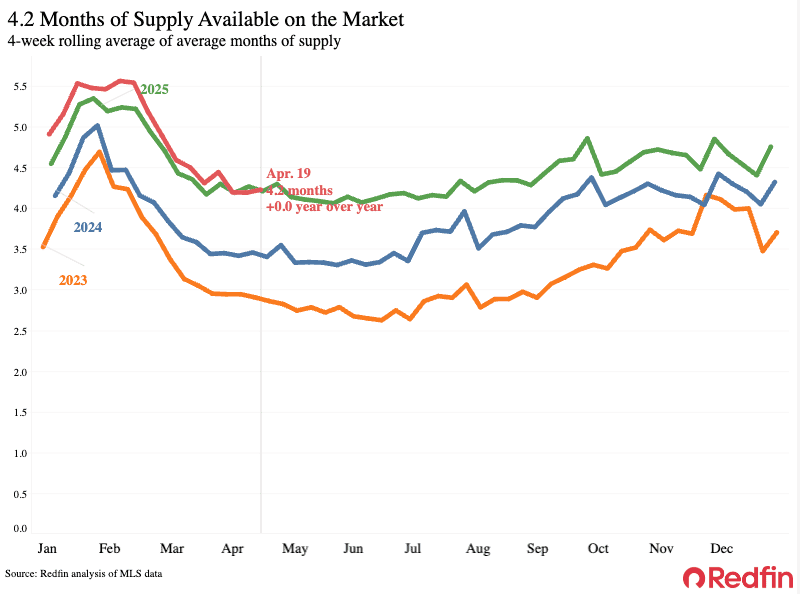
| Months of supply | 4.2 | Unchanged | 4 to 5 months of supply is considered balanced, with a lower number indicating seller’s market conditions |
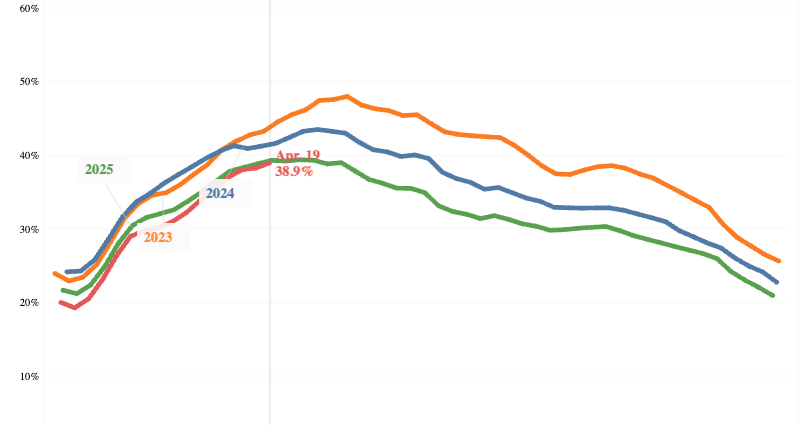
| Share of homes off market in two weeks | 38.9% | Essentially unchanged | |
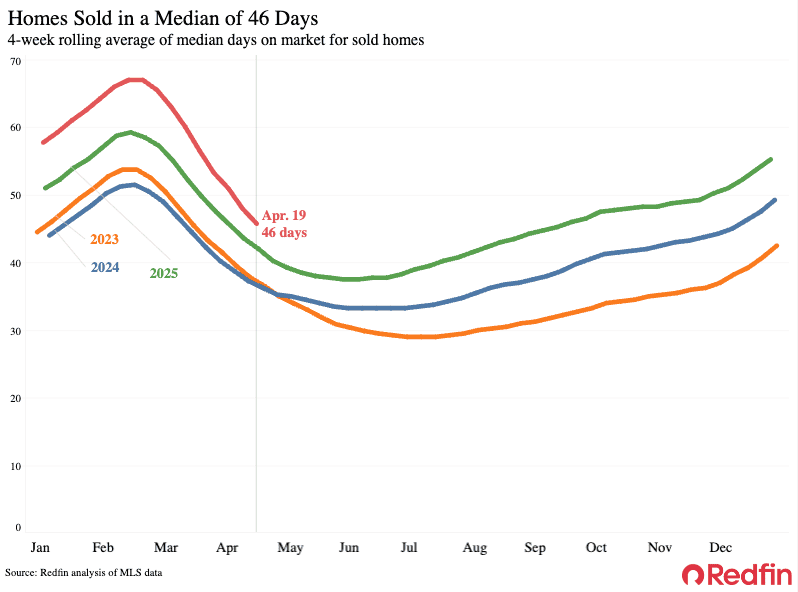
| Median days on market | 46 | +4 days | |
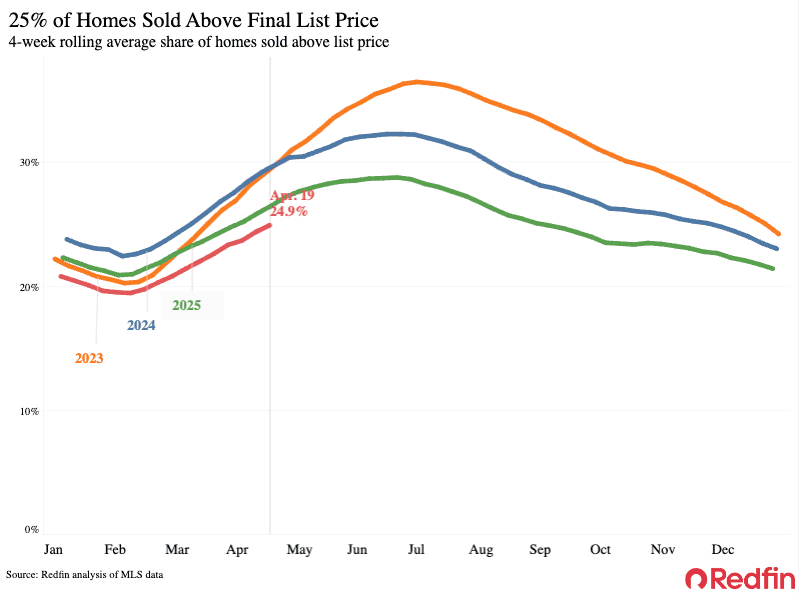
| Share of homes sold above list price | 24.9% | Down from 26% | |
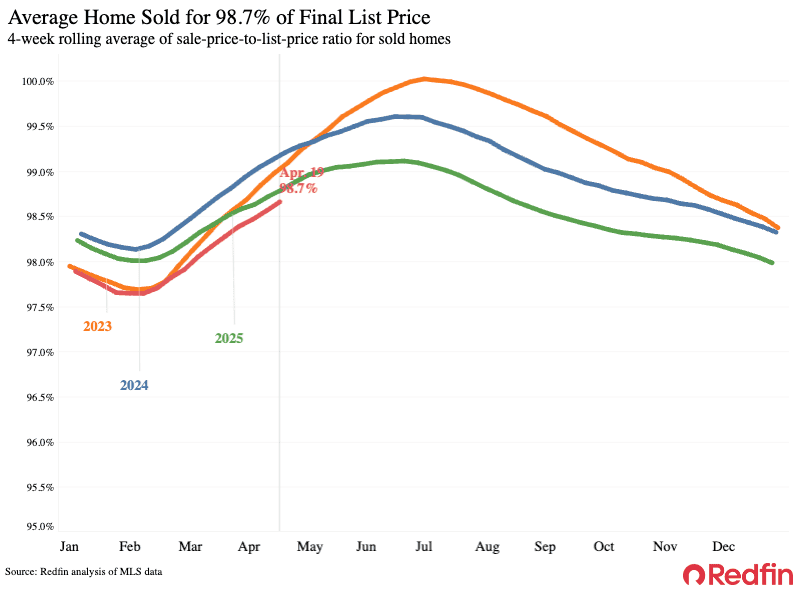
| Average sale-to-list price ratio | 98.7% | Down from 98.8% | |
|
Metro-level highlights: Four weeks ending April 19, 2026 Redfin’s metro-level data includes the 50 most populous U.S. metros. Select metros may be excluded from time to time to ensure data accuracy. |
|||
|---|---|---|---|
| Metros with biggest year-over-year increases | Metros with biggest year-over-year decreases |
Notes |
|
| Median sale price | Detroit (14.8%)
San Francisco (11.7%) Cleveland (11%) Providence, RI (10.6%) Pittsburgh (9.7%) |
Austin, TX (-3.6%)
Riverside, CA (-3.4%) Seattle (-3%) Minneapolis (-2.7%) Las Vegas (-2.4%) |
Declined in 18 metros |
| Pending sales | West Palm Beach, FL (19.6%)
Miami (10.6%) Milwaukee (6.2%) Austin, TX (4.3%) Pittsburgh (3.7%) |
Houston (-14.5%)
Seattle (-11.7%) Providence, RI (-9.6%) Nassau County, NY (-9.4%) Detroit (-9.2%) |
|
| New listings | Milwaukee, WI (22.2%)
Montgomery County, PA (20.6%) Pittsburgh (15.4%) Washington, D.C. (14.4%) Minneapolis (14%) |
Tampa, FL (-10.9%)
Riverside, CA (-10.7%) Jacksonville, FL (-10.2%) Las Vegas (-9.7%) Orlando, FL (-8.1%) |
|
Refer to our metrics definition page for explanations of all the metrics used in this report.
The post More Homeowners Are Putting Up ‘For Sale’ Signs As the Days Get Warmer appeared first on Redfin Real Estate News.