Today, the new home sales report validates two talking points I have had for some time. First, new home sales have been stuck for many years in a range that doesn’t show any real growth. For example, in November of 2025, new home sales were at a multiyear high and in January they were at a multiyear low. But in reality, new home sales haven’t gone anywhere in years.
Second, due to historically high levels of completed units for sale, the builders are very cautious about growth plans. This doesn’t mean no homes are getting built, but we need to have a better understanding of why housing starts haven’t gotten traction for years now. It’s basic supply and demand economics — with a touch of the fact that the builders aren’t the March of Dimes, they’re here to make money.
Let’s take a look at the report.
From Census: New Home Sales: Sales of new single-family houses in April 2026 were at a seasonally-adjusted annual rate of 622,000, according to estimates released jointly today by the U.S. Census Bureau and the Department of Housing and Urban Development. This is 6.2 percent (±12.8 percent)* below the March 2026 rate of 663,000, and is 11.3 percent (±11.5 percent)* below the April 2025 rate of 701,000.
Mind that the new home sales and housing starts data can be very volatile month to month, with constant revisions. That said, the chart below supports my main talking point on new home sales. If I take the COVID bump away and the 2022 low in sales, new home sales have gone nowhere for many years.
Still, new home sales are trending at 2019 sales levels. Now, if I could say that about the existing home sales market, that would mean existing home sales would be 1 to 1.3 million higher than today’s levels. So, new home sales have clearly outperformed the existing home sales market because builders can offer lower rates.

For-sale inventory and months’ supply
From Census: The seasonally-adjusted estimate of new houses for sale at the end of April 2026 was 489,000. This is 1.7 percent (±1.2 percent) above the March 2026 estimate of 481,000, and is 2.2 percent (±3.9 percent)* below the April 2025 estimate of 500,000. This represents a supply of 9.4 months at the current sales rate. The months’ supply is 8.0 percent (±16.3 percent)* above the March 2026 estimate of 8.7 months, and is 9.3 percent (±13.5 percent)* above the April 2025 estimate of 8.6 months.
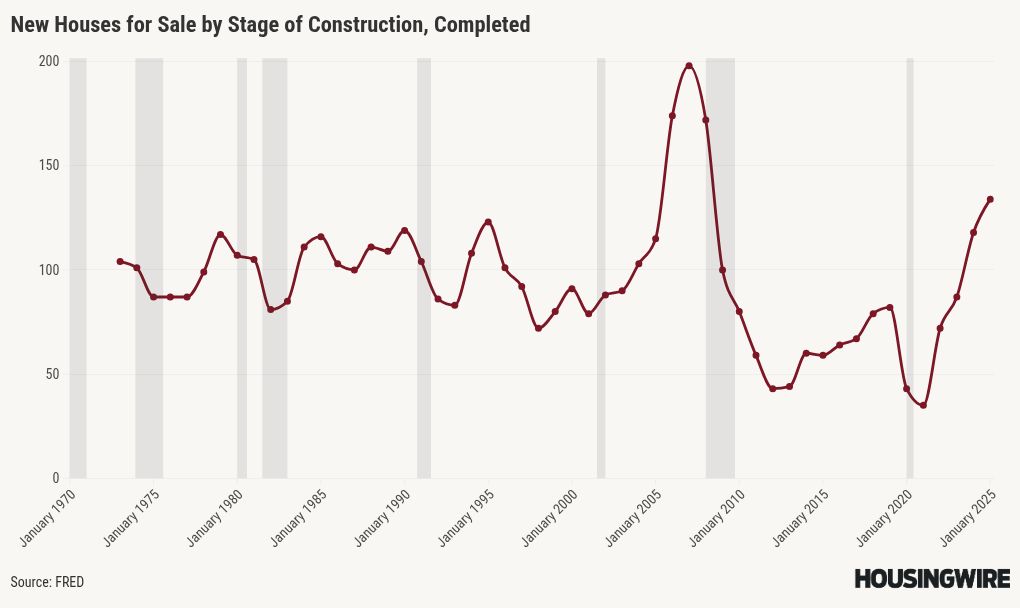
Regarding supply, I always like to focus on completed units for sale, as history has shown me that this has, over time, changed homebuilders’ behavior and how they approach construction time frames. In December of 2024, I wrote about why the builders have a supply-and-demand problem: their completed units for sale were elevated after 14 years at levels that hadn’t been a concern.
Of course, 122,000 new homes completed for sale might not sound like a lot.

But when you look at the history of this data, you can see why the builders pull back on growth — they have simply too much supply. This data line counts the completed units of sale at the start of each year.
Conclusion
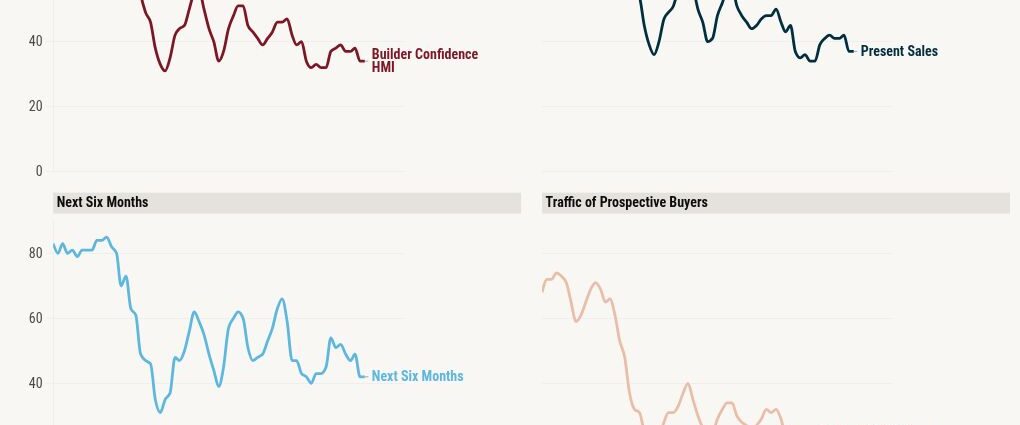
We simply need more demand for new homes to make builders more confident about building them. Right now, they’re in management mode and their confidence data, which is skewed toward smaller builders, speaks for itself.
This gives you a real-time look at the new home sales and housing construction sectors. I also wrote about the latest housing starts data here. As you can see with all the charts above, there is a clear reason why housing starts aren’t booming.