- When sellers outnumber buyers, the buyers who are in the market have bargaining power. In other words, it’s a buyer’s market.
- The strongest buyer’s markets are in the South, while the strongest seller’s markets are in the Northeast.
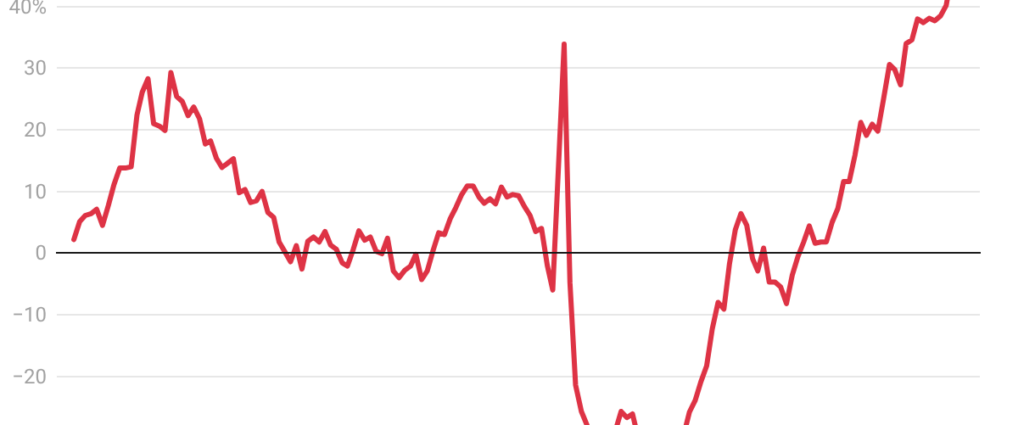
There were an estimated 46.3% more home sellers than buyers in the U.S. housing market in February (or 629,808 more, in numerical terms). That’s the largest gap in records dating back to 2013 and is up from 29.8% (or 449,409) a year earlier.
We define a market where there are over 10% more sellers than buyers as a buyer’s market and a market where there are over 10% fewer sellers than buyers as a seller’s market. A market where the gap is plus or minus 10% is considered a balanced market. By this definition, it has been a buyer’s market since May 2024.
When sellers outnumber buyers, buyers typically hold the negotiating power because they have a lot of options to choose from. That’s why a market with a lot more sellers than buyers is considered a buyer’s market. Of course, it’s only a buyer’s market for those who can afford to buy. High housing costs and economic uncertainty have caused many house hunters to retreat, creating an imbalance of buyers and sellers.
“We’re seeing a lot more inventory on the market compared to the past two years because the mortgage rate lock-in effect is easing and there’s a lot of new construction,” said Justin Gomez, a Redfin Premier real estate agent in Omaha, NE. “This has been great for affordability, especially for the younger crowd. Our median home price is in the low $300,000 range. Two years ago, people were offering $15,000 over the asking price just to get a home, with multiple offers everywhere.”
We estimated the number of buyers using proprietary Redfin data on the typical time from a buyer’s first tour to close of purchase, and MLS data on active listings and pending sales. The estimated number of sellers in the market is simply the number of active listings in the MLS. These estimates, along with median-sale price data in this report, are seasonally adjusted and subject to revision. See a more detailed methodology here and view an interactive dashboard here.
Buyers Are Retreating, Which Is Causing Some Sellers to Retreat
The number of homebuyers in the market fell 2.4% month over month in February to an estimated 1.36 million. The number of sellers posted a smaller decline, falling 0.4% to an estimated 1.99 million.
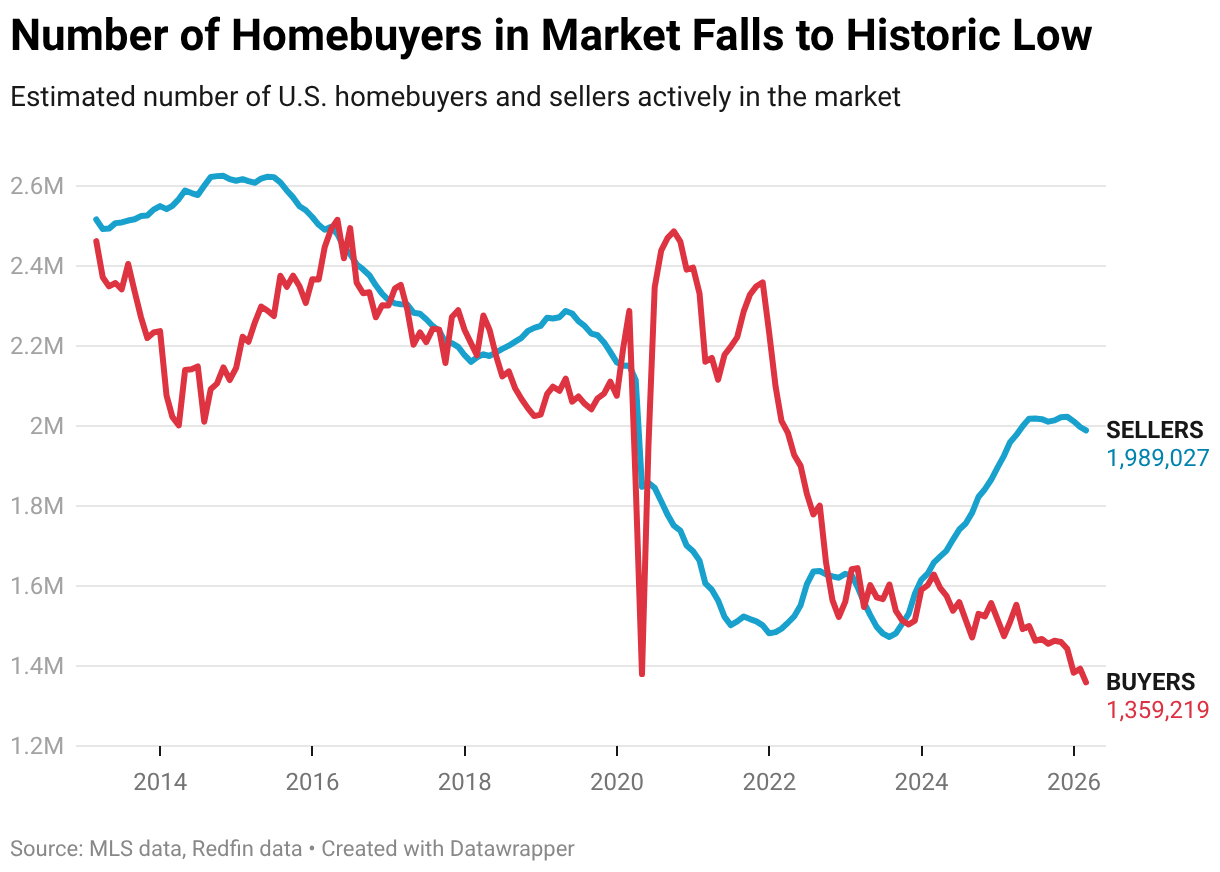
Homebuyers are retreating due to stubbornly high home prices and mortgage rates, layoffs, and mounting economic and political uncertainty. The retreat in buyers has caused some sellers, many of whom are buyers themselves, to retreat. Some sellers are delisting after watching their homes sit on the market, while others are choosing not to list at all after seeing nearby homes sell for below the asking price.
Redfin did report earlier this month that relistings are beginning to rise, which could boost housing supply. New listings are also starting to climb slightly, posting their second straight week of increases after four months of declines.
The Strongest Buyer’s Markets Are In the South
The strongest buyer’s market in February was Miami, which had an estimated 163% more sellers than buyers. Next came Nashville (120%), Austin, TX (112%), West Palm Beach, FL (110%) and San Antonio (104%). Redfin analyzed the 50 most populous U.S. metropolitan areas and included in this analysis the 49 with sufficient data.
The Sun Belt skyrocketed in popularity during the pandemic, when scores of homebuyers moved in from more expensive parts of the country. To meet surging demand, homebuilders ramped up activity, which is one reason there are now a lot more homes for sale than people who want to buy them. The pool of buyers has also shrunk because soaring housing costs in recent years have priced many people out of the market.
New construction can have a significant influence on whether negotiating power lies with buyers or sellers because it impacts the balance of supply and demand. The South and the West have historically issued the most building permits, while the Northeast and the Midwest (where the five seller’s markets are located) have issued the fewest.
Florida and Texas, in particular, build more homes than other states. Florida is also grappling with intensifying natural disasters, soaring insurance premiums and rising condo HOA fees, which has prompted some homeowners to leave. Miami, specifically, frequently shows up as a buyer’s market because it has a lot of housing supply, which could be in part due to the high number of condos.
The Strongest Seller’s Markets Are In the North
The strongest seller’s market in February was Newark, NJ, which had an estimated 31.1% fewer sellers than buyers. The other four seller’s markets were Montgomery County, PA (-29%) Nassau County, NY (-25.8%), Milwaukee (-25.2%) and New Brunswick, NJ (-14.5%).
On average, home prices rose 2.2% year over year across the five seller’s markets in February, compared with a 0.3% increase across the 37 buyer’s markets—an indication that buyer’s markets offer house hunters more leverage.
Metro-Level Summary: 50* Most Populous Metros (February 2026)
| U.S. metro area | Balance of power | Percent by which sellers outnumber buyers | Buyers | Sellers |
|---|---|---|---|---|
| Anaheim, CA | Buyer’s Market | 37.2% | 5,363 | 7,357 |
| Atlanta, GA | Buyer’s Market | 76.6% | 21,337 | 37,680 |
| Austin, TX | Buyer’s Market | 111.7% | 8,396 | 17,776 |
| Baltimore, MD | Balanced Market | -4.0% | 10,619 | 10,197 |
| Boston, MA | Balanced Market | 0.9% | 10,012 | 10,105 |
| Charlotte, NC | Buyer’s Market | 74.3% | 9,461 | 16,493 |
| Chicago, IL | Balanced Market | 2.2% | 25,112 | 25,676 |
| Cincinnati, OH | Buyer’s Market | 39.1% | 5,938 | 8,259 |
| Cleveland, OH | Balanced Market | -4.3% | 7,171 | 6,860 |
| Columbus, OH | Buyer’s Market | 29.3% | 6,626 | 8,570 |
| Dallas, TX | Buyer’s Market | 83.8% | 16,716 | 30,731 |
| Denver, CO | Buyer’s Market | 40.1% | 11,730 | 16,429 |
| Detroit, MI | Buyer’s Market | 44.8% | 5,054 | 7,317 |
| Fort Worth, TX | Buyer’s Market | 76.1% | 7,414 | 13,058 |
| Houston, TX | Buyer’s Market | 102.4% | 22,402 | 45,345 |
| Indianapolis, IN | Buyer’s Market | 22.6% | 7,643 | 9,372 |
| Jacksonville, FL | Buyer’s Market | 70.1% | 7,313 | 12,438 |
| Kansas City, MO | Buyer’s Market | 19.6% | 7,436 | 8,896 |
| Las Vegas, NV | Buyer’s Market | 89.5% | 7,453 | 14,124 |
| Los Angeles, CA | Buyer’s Market | 52.6% | 14,700 | 22,431 |
| Miami, FL | Buyer’s Market | 162.6% | 7,512 | 19,726 |
| Milwaukee, WI | Seller’s Market | -25.2% | 6,900 | 5,163 |
| Minneapolis, MN | Balanced Market | 6.9% | 12,761 | 13,644 |
| Montgomery County, PA | Seller’s Market | -29.0% | 7,111 | 5,047 |
| Nashville, TN | Buyer’s Market | 119.6% | 7,077 | 15,540 |
| Nassau County, NY | Seller’s Market | -25.8% | 9,280 | 6,885 |
| New Brunswick, NJ | Seller’s Market | -14.5% | 10,082 | 8,624 |
| New York, NY | Balanced Market | 3.8% | 26,109 | 27,100 |
| Newark, NJ | Seller’s Market | -31.1% | 8,085 | 5,573 |
| Oakland, CA | Buyer’s Market | 24.4% | 4,701 | 5,850 |
| Orlando, FL | Buyer’s Market | 73.6% | 10,342 | 17,956 |
| Philadelphia, PA | Buyer’s Market | 24.6% | 6,411 | 7,987 |
| Phoenix, AZ | Buyer’s Market | 78.7% | 18,132 | 32,396 |
| Pittsburgh, PA | Buyer’s Market | 63.7% | 5,579 | 9,132 |
| Portland, OR | Buyer’s Market | 49.7% | 7,386 | 11,059 |
| Providence, RI | Buyer’s Market | 13.5% | 3,593 | 4,078 |
| Riverside, CA | Buyer’s Market | 59.8% | 11,880 | 18,980 |
| Sacramento, CA | Buyer’s Market | 41.0% | 5,292 | 7,461 |
| San Antonio, TX | Buyer’s Market | 104.3% | 8,905 | 18,196 |
| San Diego, CA | Buyer’s Market | 18.8% | 6,627 | 7,873 |
| San Francisco, CA | Balanced Market | 2.4% | 2,575 | 2,636 |
| San Jose, CA | Buyer’s Market | 10.5% | 2,788 | 3,080 |
| Seattle, WA | Buyer’s Market | 28.9% | 7,899 | 10,181 |
| St. Louis, MO | Buyer’s Market | 13.2% | 9,087 | 10,285 |
| Tampa, FL | Buyer’s Market | 84.1% | 13,128 | 24,168 |
| Virginia Beach, VA | Buyer’s Market | 22.3% | 6,311 | 7,718 |
| Warren, MI | Buyer’s Market | 25.7% | 7,183 | 9,027 |
| Washington, DC | Buyer’s Market | 18.6% | 15,524 | 18,418 |
| West Palm Beach, FL | Buyer’s Market | 110.1% | 7,394 | 15,531 |
*Fort Lauderdale has been removed due to insufficient data.
The post There Are 630,000 More Home Sellers Than Buyers—the Biggest Gap on Record appeared first on Redfin Real Estate News.