Pending home sales are declining and touring activity is slumping.
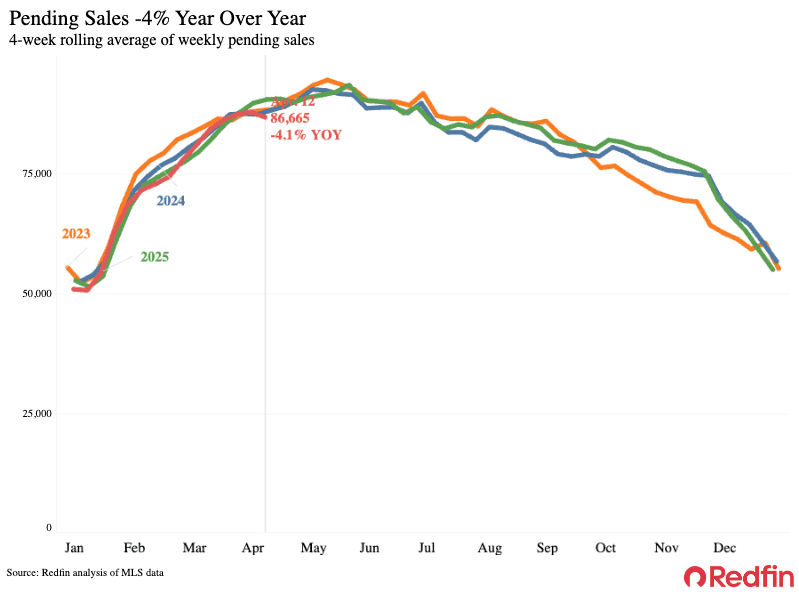
U.S. pending home sales fell 4.1% from a year earlier during the four weeks ending April 12, the biggest decline in over a year.
Sales fell in all but seven of the 50 biggest U.S. metro areas, with the biggest declines in Providence, RI (-17.5%), Houston (-16.9%) and Nassau County, NY (-14.8%). The biggest increases were in San Francisco (9.6%), West Palm Beach, FL (8.2%) and Miami (6.4%).
Homebuying demand is unseasonably slow. Home-touring activity is up just 11% since the start of the year, compared to a 40% increase over the same period last year, according to ShowingTime.
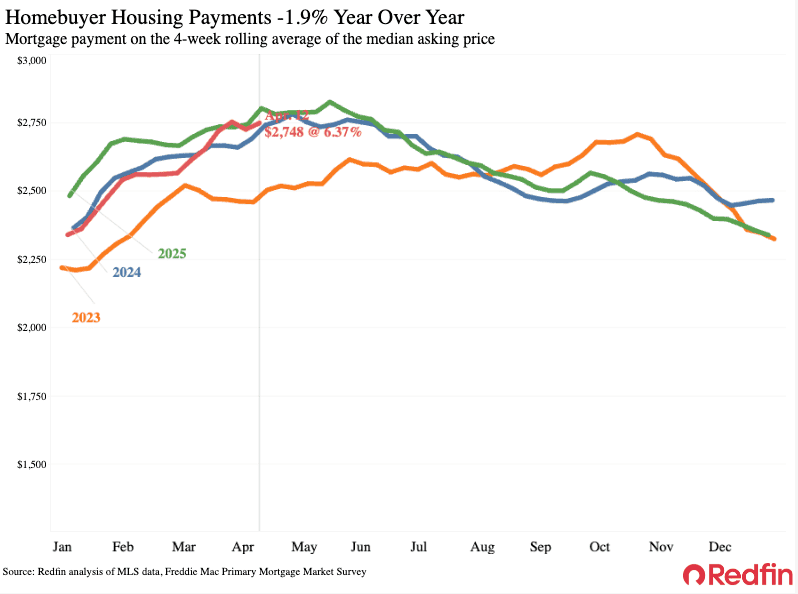
Would-be homebuyers are backing off partly because the Iran war is causing widespread geopolitical and economic uncertainty, making some Americans wary of making a big purchase. It has also contributed to higher mortgage rates, though the average rate fell slightly to 6.37% last week. Mortgage rates may swing up or down in the next few weeks, depending on the direction of the Iran war, the outcome of negotiation talks and oil prices.
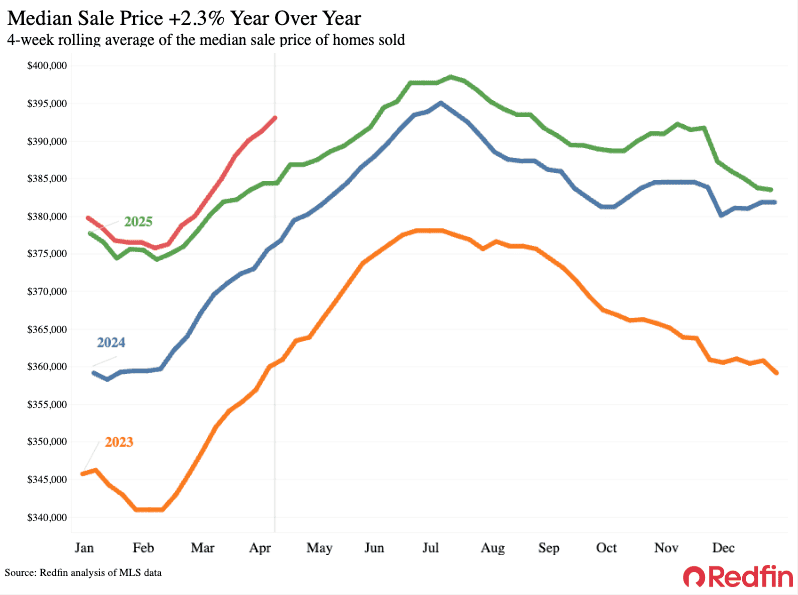
High housing costs are also sidelining house hunters. The median home-sale price rose 2.3% annually, the biggest increase in a year, and while the weekly average mortgage rate has come down slightly, it is still near a six-month high. It’s worth noting that the timing of Easter is contributing to the year-over-year decline in pending sales, too: Easter fell into this four-week period, but not the comparable period in 2025.
Redfin agents in some parts of the country say some buyers are jittery about whether it’s the right time to make a big purchase, with economic uncertainty in the air and the rising prices of other things, like gas, cutting into their budgets.
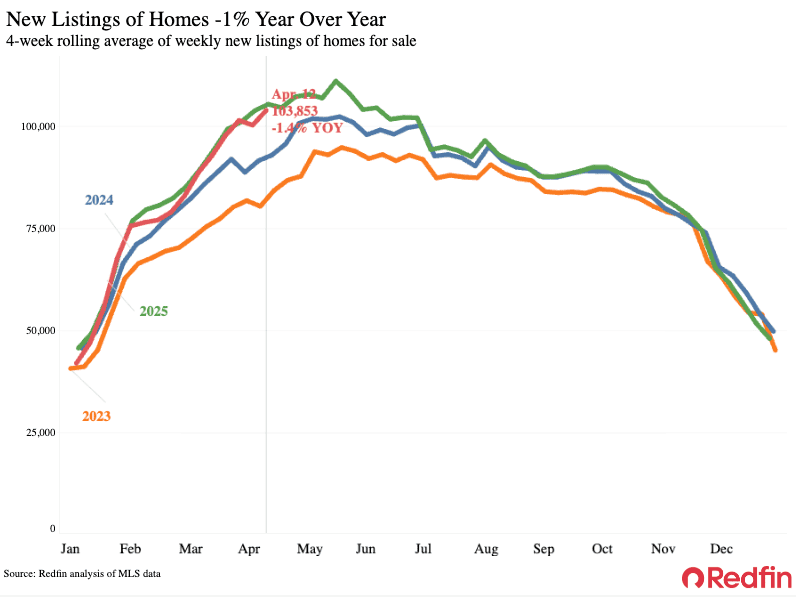
On the selling side, new listings of homes for sales declined 1.4% year over year, with some prospective sellers hitting pause while demand is down.
For Redfin economists’ takes on the housing market, please visit Redfin’s “From Our Economists” page.
Leading indicators
| Indicators of homebuying demand and activity | ||||
| Value (if applicable) | Recent change | Year-over-year change | Source | |
| Daily average 30-year fixed mortgage rate | 6.32% (April 15) | Down from 6.64% three weeks earlier | Down from 6.98% | Mortgage News Daily |
| Weekly average 30-year fixed mortgage rate | 6.37% (week ending April 9) | Down slightly from 6-month high the week before | Down from 6.62% | Freddie Mac |
| Mortgage-purchase applications (seasonally adjusted) | Down 1% from a week earlier (as of week ending April 10) | Down 3% | Mortgage Bankers Association | |
| Google searches of “homes for sale” | Up 11% from a month earlier (as of April 11) | Up 20% | Google Trends | |
| Touring activity | Up 11% from the start of the year (as of April 12) | At this time last year, it was up 40% from the start of 2025 | ShowingTime | |
Key housing-market data
| U.S. highlights: Four weeks ending April 12, 2026
Redfin’s national metrics include data from 400+ U.S. metro areas and are based on homes listed and/or sold during the period. Weekly housing-market data goes back through 2015. Subject to revision. |
|||
| Four weeks ending April 12, 2026 | Year-over-year change | Notes | |
| Median sale price | $393,059 | 2.3% | Biggest increase in a year |
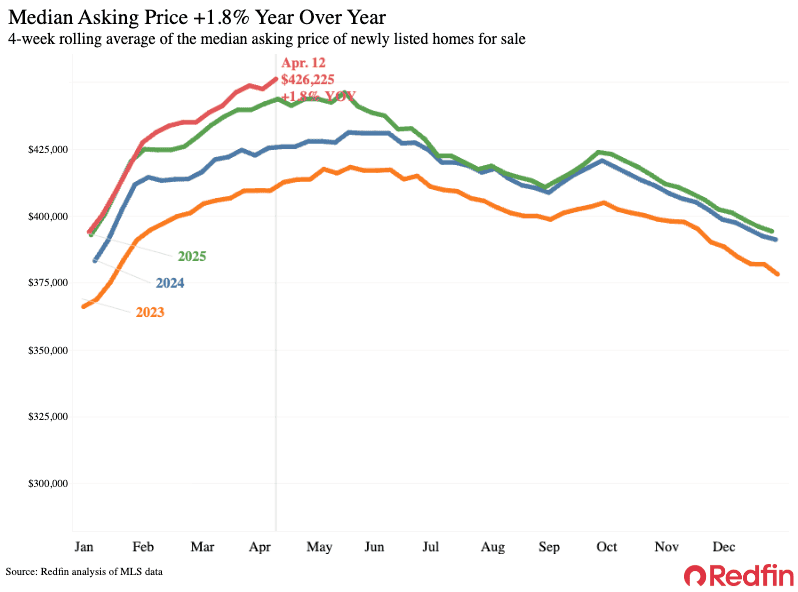
| Median asking price | $426,225 | 1.8% | |
| Median monthly mortgage payment | $2,748 at a 6.37% mortgage rate | -1.9% | |
| Pending sales | 86,665 | -4.1% | Biggest decline in a year |
| New listings | 103,853 | -1.4% | |
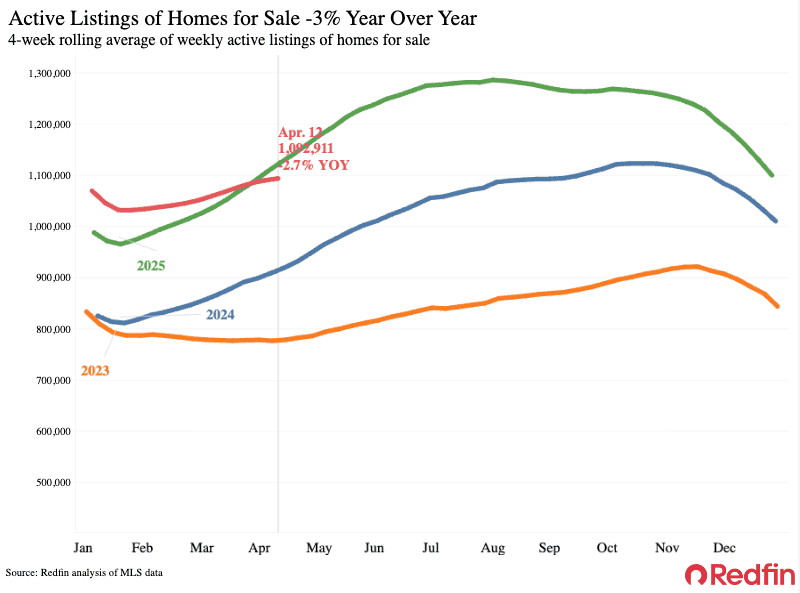
| Active listings | 1,092,911 | -2.7% | Biggest decline since 2023 |
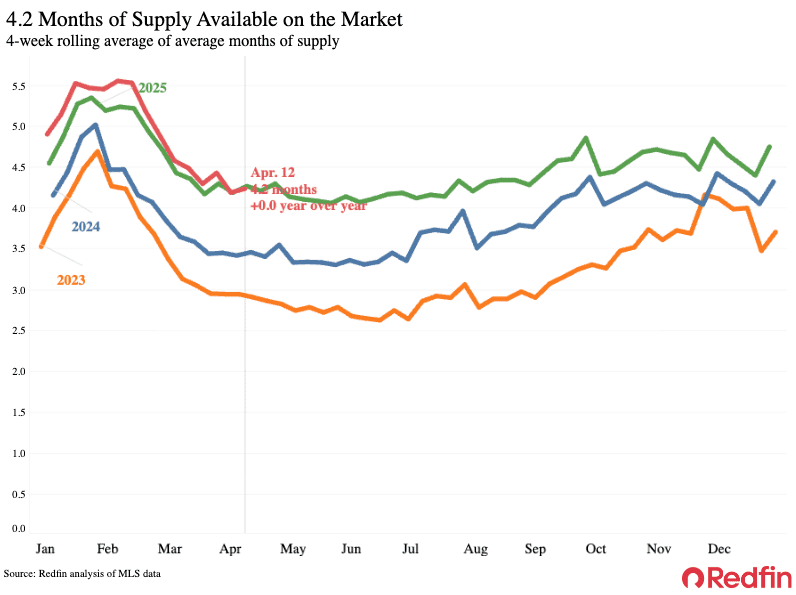
| Months of supply | 4.2 | Unchanged | 4 to 5 months of supply is considered balanced, with a lower number indicating seller’s market conditions |
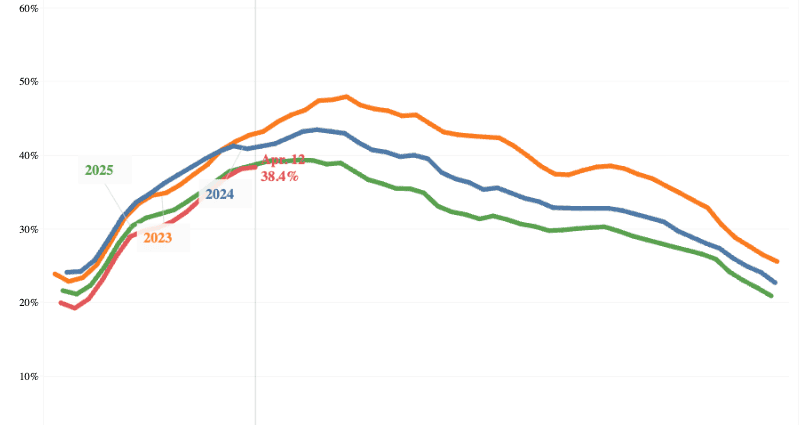
| Share of homes off market in two weeks | 38.4% | Essentially unchanged | |
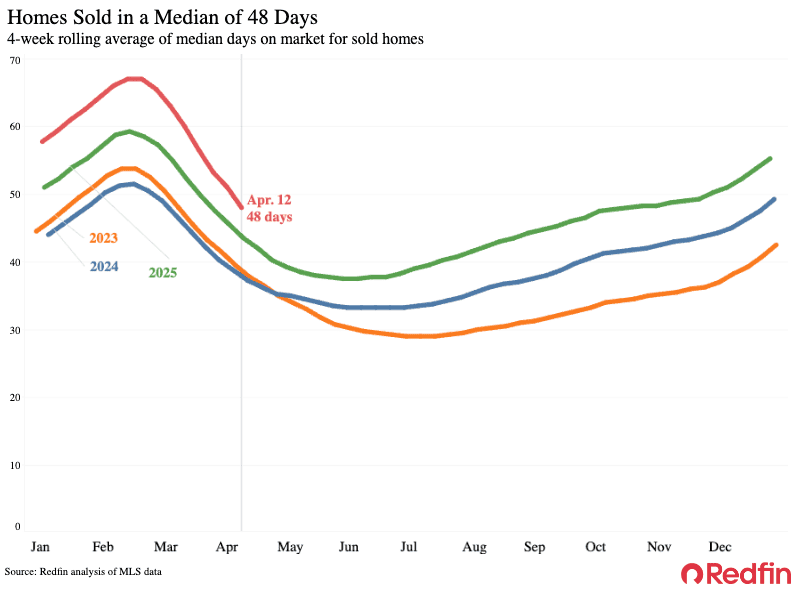
| Median days on market | 48 | +4 days | |
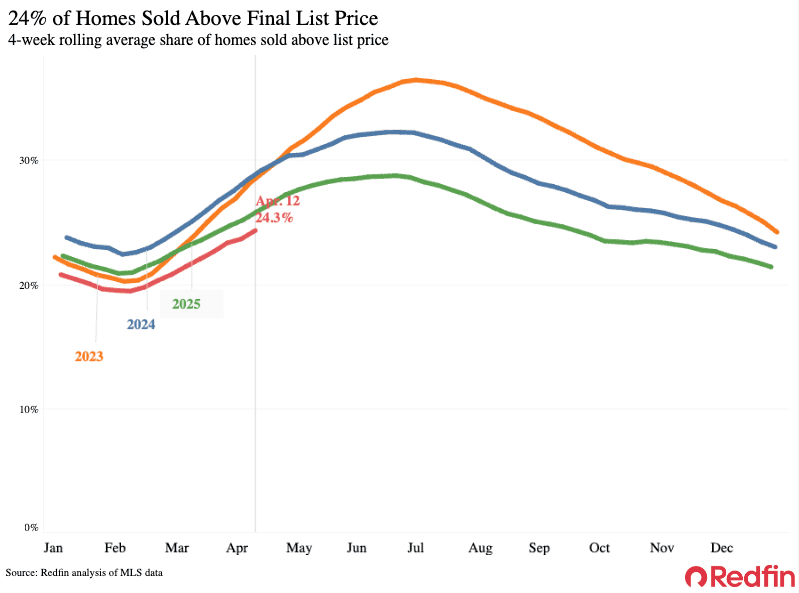
| Share of homes sold above list price | 24.3% | Down from 26% | |
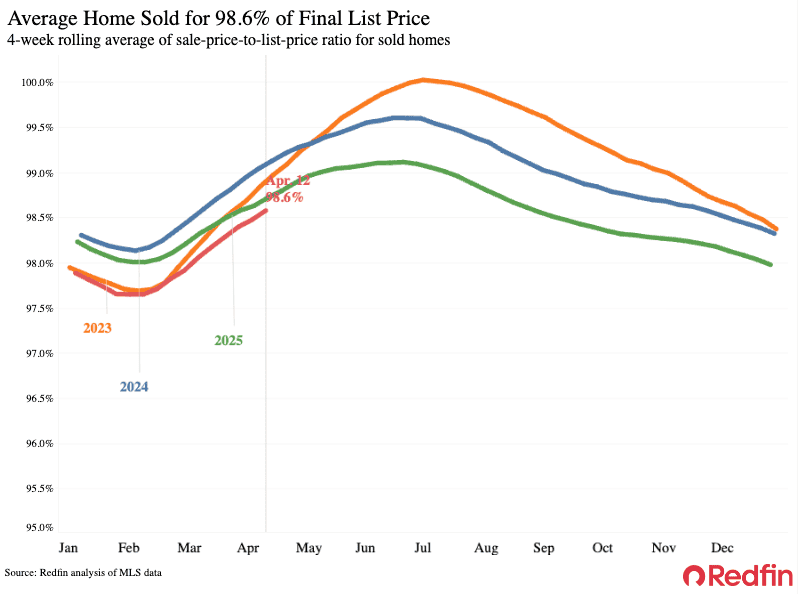
| Average sale-to-list price ratio | 98.6% | Down from 98.7% | |
|
Metro-level highlights: Four weeks ending April 12, 2026 Redfin’s metro-level data includes the 50 most populous U.S. metros. Select metros may be excluded from time to time to ensure data accuracy. |
|||
|---|---|---|---|
| Metros with biggest year-over-year increases | Metros with biggest year-over-year decreases |
Notes |
|
| Median sale price | San Francisco (13.3%)
Detroit (10.7%) Cleveland (9.8%) Providence, RI (9%) Pittsburgh (8.8%) |
Dallas (-3.4%)
Austin, TX (-3.2%) Oakland, CA (-3.2%) Seattle (-2.9%) Nashville, TN (-2.8%) |
Declined in 17 metros |
| Pending sales | San Francisco (9.6%)
West Palm Beach, FL (8.2%) Miami (6.4%) Fort Worth, TX (2.4%) Milwaukee (1.3%) |
Providence, RI (-17.5%)
Houston (-16.9%) Nassau County, NY (-14.8%) New York (-14.2%) Seattle (-13.8%) |
Increased in just 7 metros |
| New listings | Milwaukee, WI (12%)
Philadelphia (11.5%) San Jose, CA (8.5%) Minneapolis (7.3%) Indianapolis (5.8%) |
Tampa, FL (-15.8%)
Jacksonville, FL (-14.9%) Anaheim, CA (-13.8%) Riverside, CA (-13%) Orlando (-11.9%) |
|
Refer to our metrics definition page for explanations of all the metrics used in this report.
The post This Spring’s Housing Market Is Unseasonably Slow As Iran War, High Costs Curb Demand appeared first on Redfin Real Estate News.