A ton of housing data snapped back last week as it should have from the holiday-impacted week before: active inventory, new listings and weekly pending home sales all grew above trend. This usually happens when we have a major holiday the previous week that slows data, but mortgage rates have also fallen and we are almost back below 6.25% again. So, was the growth more of a rebound from Easter or falling mortgage rates? Let’s take a look and find out.
Weekly pending sales
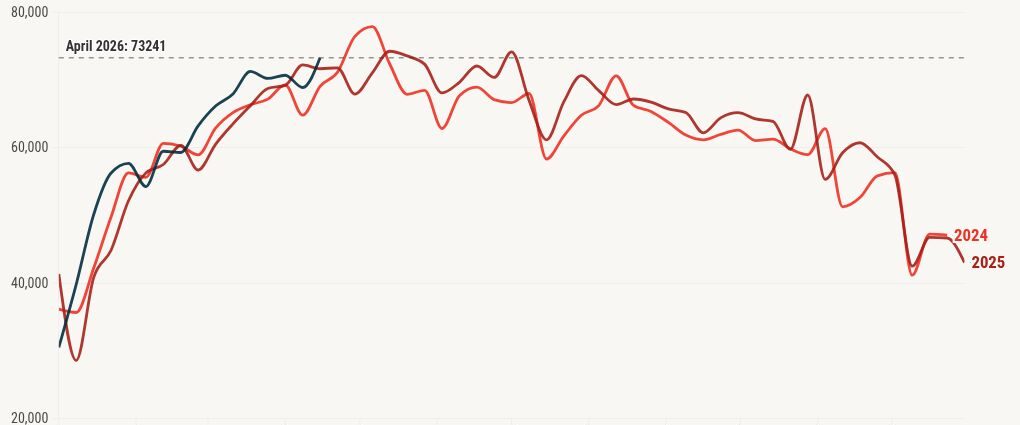
Our weekly pending home sales data provides a week-to-week perspective, though results can be affected by holidays and short-term fluctuations such as Easter weekend. Housing demand snapped back from the previous week’s negative year-over-year print. Was it all about mortgage rates falling? I don’t believe so. We usually do get a rebound from a holiday week, and we weren’t far off from showing growth in the data. So, I am going with more Easter-week snapback than rates.
Weekly pending sales usually take 30-60 days to hit the sales data. Typically, mortgage rates above 6.64% and those breaking over 7% really impact the data negatively. Under 6.25% has been the sweet spot over the past several years, excluding short-term variables.
Weekly pending sales last week over the last two years:
- 2026: 73,241
- 2025: 71,775
Mortgage purchase application data
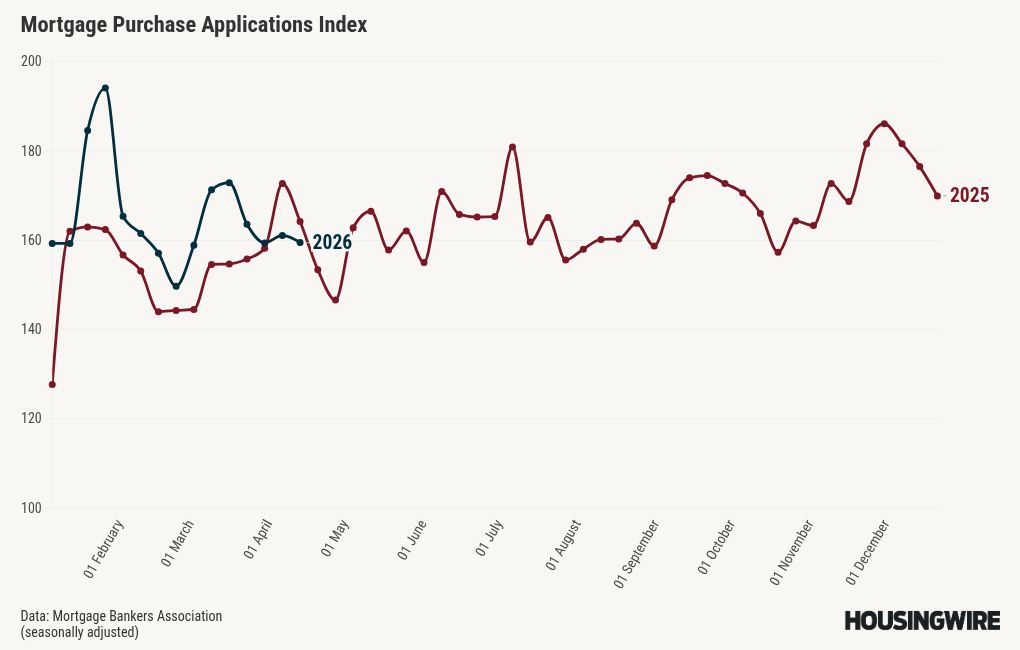
Purchase application data is a forward-looking indicator: growth here leads home sales by roughly 30-90 days. Last week, we saw a 1% week-to-week decline and a 3% year-over-year decline. Higher mortgage rates have impacted this data line, and we aren’t back below 6.25% yet, but this week’s data should be interesting as rates have fallen closer to 6.25%.
For purchase apps, what I really value is at least 12-14 weeks of positive week-to-week data. If we can get that positive week-to-week data to go with year-over-year growth, then we have something cooking. For 2026, we are basically flat on the week-to-week data, while showing positive year-over-year data up until rates rose.
Here’s 2026 so far:
- 6 positive week-over-week prints
- 7 negative week-to-week prints
- 1 flat week-to-week print
- 7 weeks of double-digit year-over-year growth
- 12 weeks of positive year-over-year growth
- 2 negative year-over-year print
10-year yield and mortgage rates
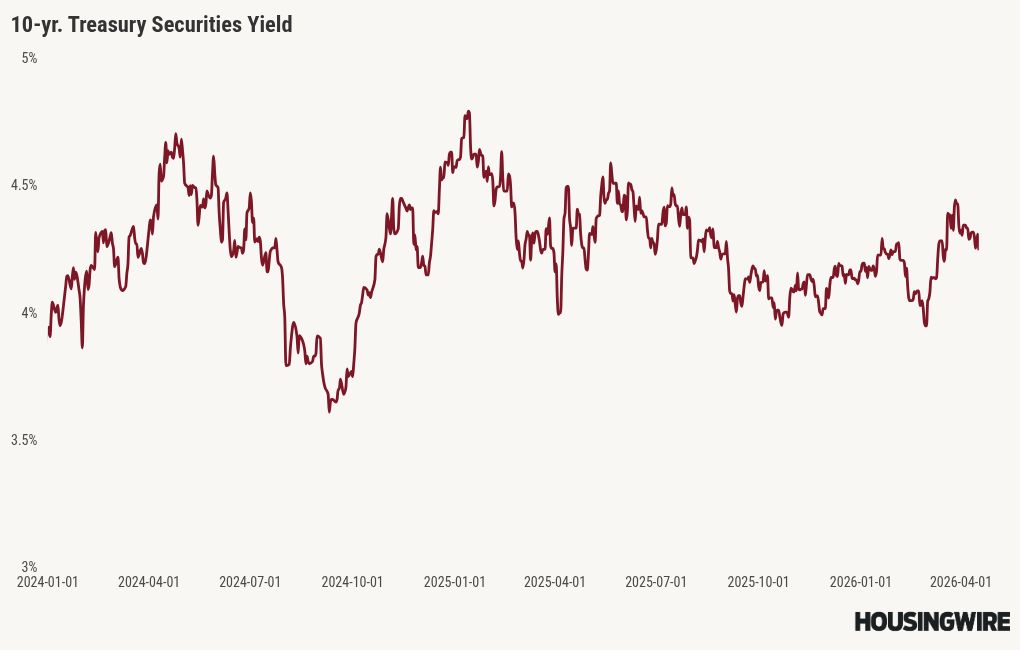
In the 2026 HousingWire forecast, I anticipated the following ranges:
- Mortgage rates between 5.75% and 6.75%
- The 10-year yield fluctuating between 3.80% and 4.60%
We recently saw a positive move in the 10-year yield and mortgage rates as the bond market has been trying to get ahead of any Iran war deal. Both times we have heard about an end to the Iran conflict, the 10-year yield has gotten back toward 4.24%. Mortgage spreads are also improving, so mortgage rates are closer toward 6.25% now.
We shall see what Monday and this week brings, but for the entire year, we have still stayed within the range I believe we should stay in for 2026 as rates have ranged between 5.98% and 6.64%.
Mortgage rates ended the week at 6.29% according to Mortgage News Daily and 6.43% according to the Polly rate lock data.
Mortgage spreads
Mortgage spreads remain a positive story for housing in 2026, as mortgage rates would have easily been over 7% in 2023 and 2024, and close to 7% in 2025, given the current 10-year yield level and the worst spread levels back then. The spreads were already deteriorating in February as yields fell, compressing volatility on the downside. The war took the spreads toward 2.11%, but now they are back down to 2%.
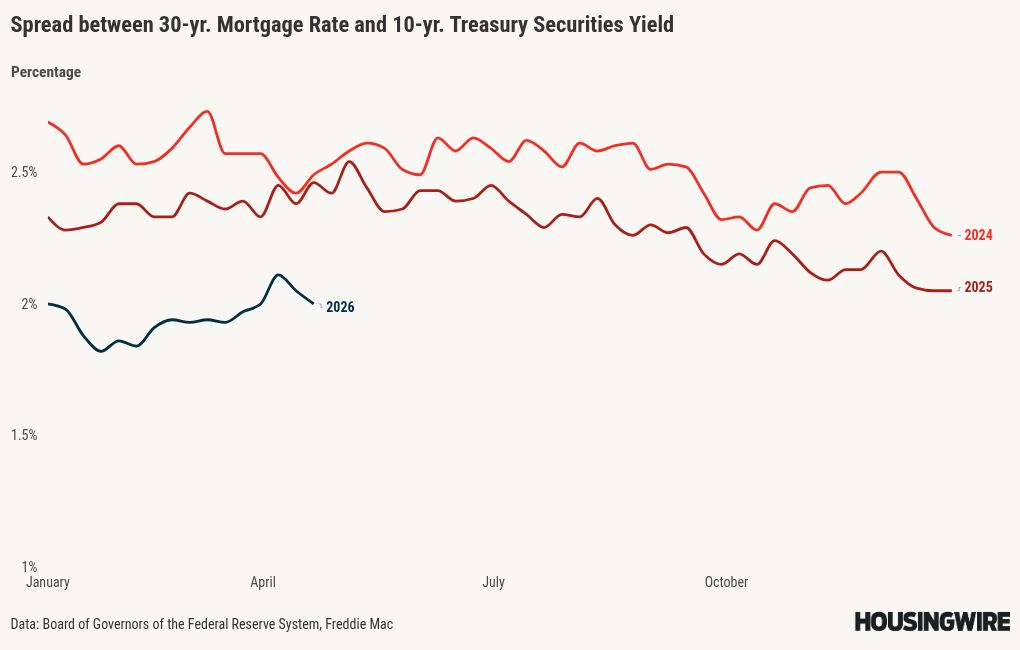
Historically, mortgage spreads have ranged from 1.60% to 1.80%. Last week, spreads closed at 2%, down from 2.05% the week before.
However, I wanted to compare last week’s rates to the worst levels of the spreads over the past three years, given the 10-year yield at its current level.
- If we had the worst mortgage spread levels of 2023, mortgage rates would be 7.39% today, not 6.29%.
- If we had the worst levels of 2024, mortgage rates would be 7.02% today.
- If we had the worst levels of 2025, mortgage rates would be 6.83% today.
Housing inventory
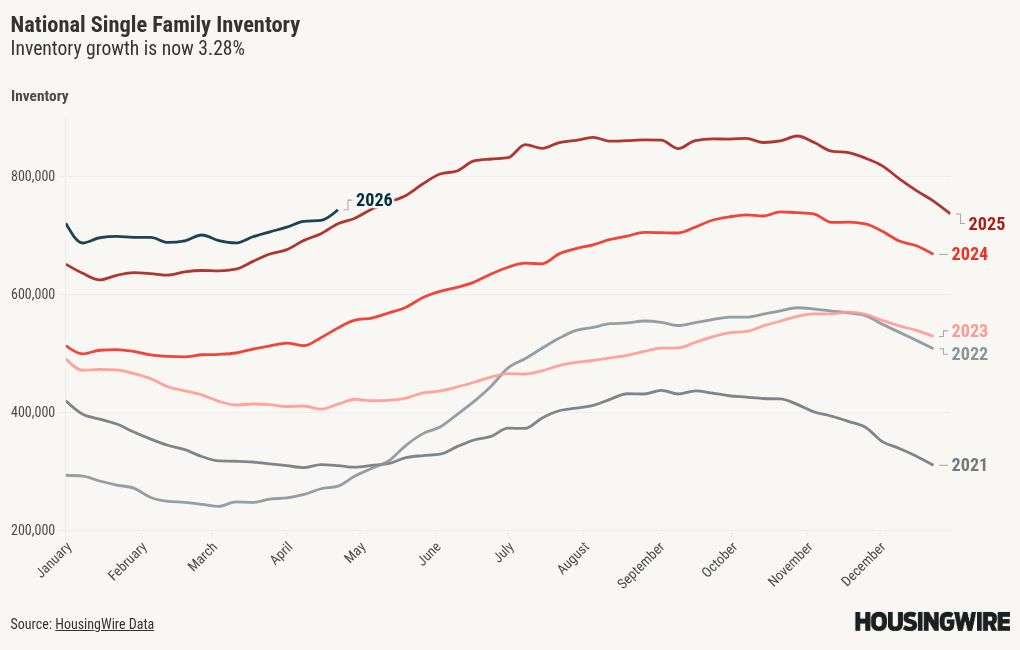
Housing inventory growth was very small two weeks ago, which was impacted by Easter. Now, we have had a solid week of inventory growth, which is the rebound impact, so if you average the two weeks out, the inventory growth story has really stayed the same this year.
We have gone from 33% year-over-year growth in inventory at the highest point in 2025 to 3.21% last week. In the past, inventory growth picked up amid higher mortgage rates, softening demand and rising year-over-year new listings. Even with the Iran conflict pushing rates higher from 5.99% toward 6.64% recently, 2026 has had the lowest rate curve for the housing market to work from since 2022, and rates have not gotten above 7% in a while.
- Weekly inventory change: (April 10-April 17): Inventory rose from 724,977 to 743,006
- Same week last year: (April 4-April 11): Inventory rose from 702,436 to 719,403
New listings
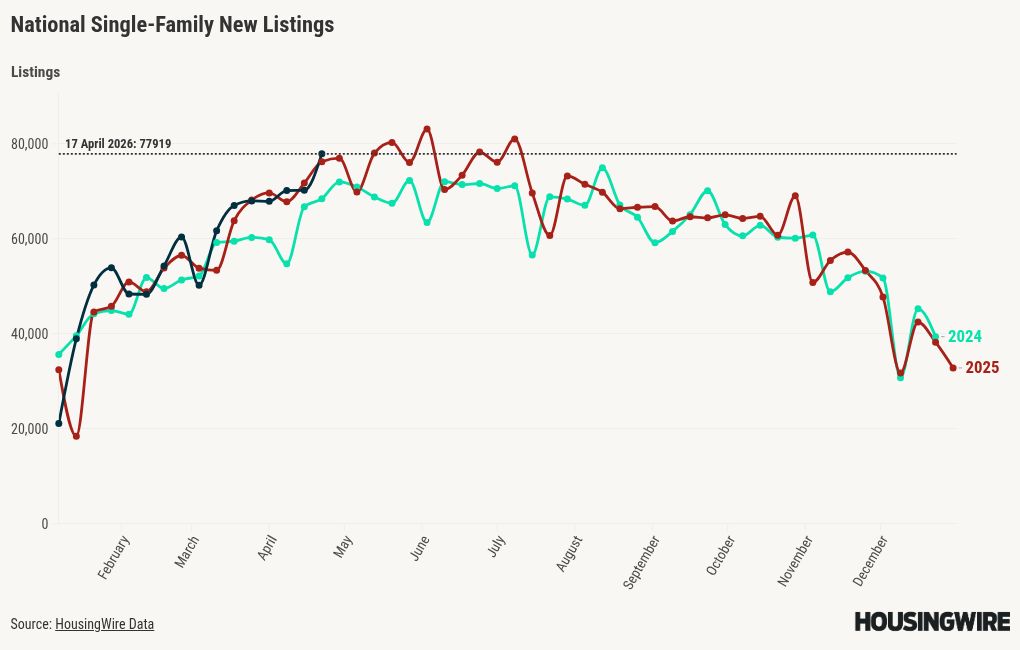
I have been disappointed with the new listings data so far this year, as I was hoping we would see some weeks with new listings ranging from 80,000 to 100,000 during the seasonal peak months, which we would see in a normal year from 2013 to 2019. We should at least get over 80,000 this year, as we did last year, but I’m not sure about growth beyond that.
New listings data had a solid week, rebounding from Easter weekend. And remember, for context on these numbers, during the housing bubble crash, new listings ranged from 250,000 to 400,000 per week for several years.
Here is last week’s new listings data for the past two years:
- 2026: 77,919
- 2025: 77,005
Price-cut percentage
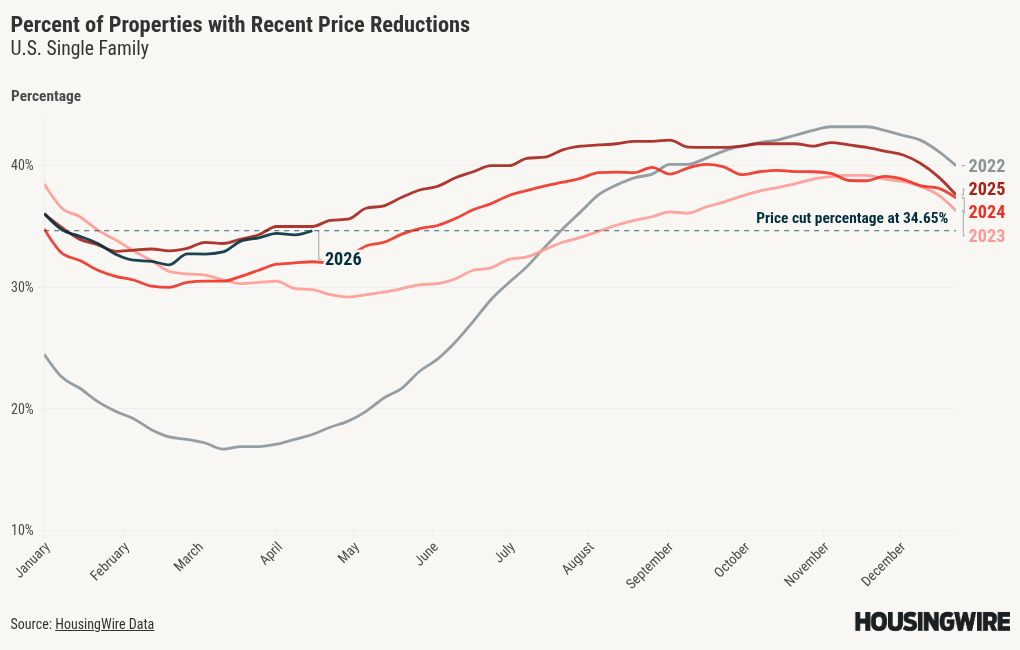
Typically, about one-third of homes undergo price reductions before they sell, reflecting the dynamic nature of the housing market. As mortgage rates and inventory rise together, the percentage of price cuts increases.
In my 2026 home-price forecast, I had a negative 0.62% call for the year nationally. However, mortgage rates were lower than I thought they would be at the start of this year, and the FHFA’s announced purchase of mortgage-backed securities pushed mortgage spreads lower than I expected earlier in the year. I believed we would get toward the 1.80% level later.
The price-cut percentage is slightly lower this year than last, and housing inventory has grown very slowly in 2026.
The price-cut percentage for last week:
- 2026: 34.65%
- 2025: 35%
The week ahead: Iran, Iran, Iran, retail sales, pending home sales, and more
Of course, the news about the Iran conflict runs the show with the bond market, which impacts housing the most.
This week, we will get our first retail sales report post-oil shock, which could be interesting. Pending home sales from the NAR will also come out. The last two months have been more funky than usual with the NAR pending home sales data; at times when it’s negative, the next month’s existing home sales beat estimates, when it’s positive, the existing home sales miss. So, the recent data has been softer with higher rates. The big story will be any new updates on the news from the Iranian conflict.