I got an early copy of Ben Carlson’s new book, “Risk & Reward.” It’s terrific. (And it goes on sale May 12!)
Carlson, of Ritholtz Wealth Management, has a gift for being both entertaining and informative. His accessible writing makes for a casual read, and yet with each page you turn, you get a little smarter about investing.
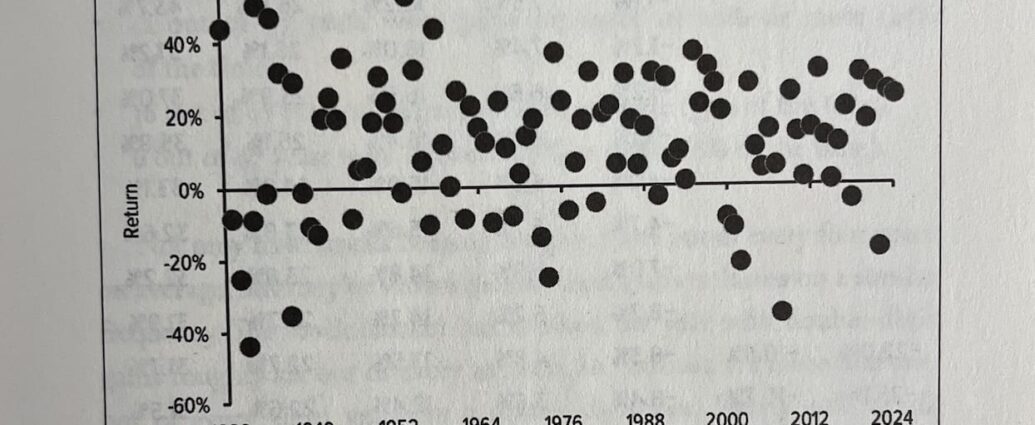
His book is loaded with helpful charts and graphics. Chapter 14 has one of my favorite visualizations of stock market performance: It’s a plot of the S&P 500’s annual returns since 1928. It’s pretty chaotic.
Some investors may find this scatterplot surprising, especially after hearing the near-constant refrain that the stock market typically returns 8% to 10%. And those figures are true if you average the years out. But almost none of the yearly returns line up in that range.
“Investing in the stock market would be far easier if you could simply bank on 10% each and every year,” Carlson wrote. “Unfortunately, it doesn’t work that way. … You could have periods of …
This post was originally published here