
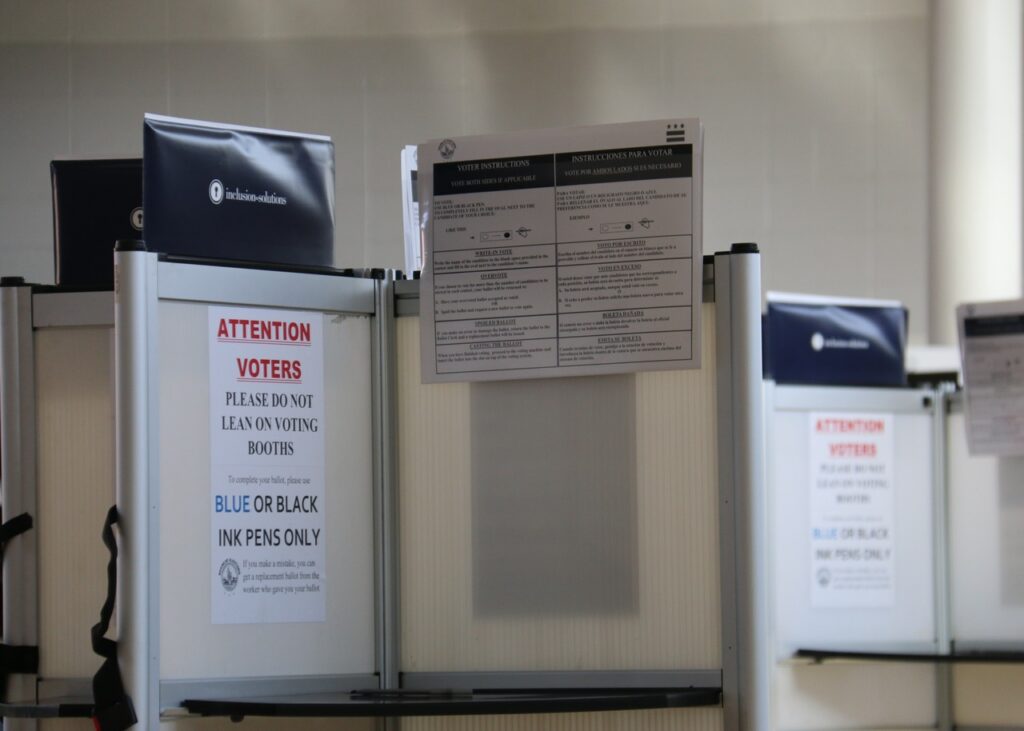
Voting booths in Washington, D.C., November 5, 2024. Archive photo: OSCE Parliamentary Assembly / Wikimedia Commons, CC BY-SA 2.0. Cropped; adapted photo under the same license.
Prediction-market traders are pricing very different outcomes in the New York, New Jersey and Florida races attracting attention ahead of Tuesday’s midterm elections. Kathy Hochul is a strong favorite in New York’s governor race, Cait Conley leads Mike Lawler in New York’s 17th District, Rebecca Bennett leads Thomas Kean Jr. in New Jersey’s 7th, and Byron Donalds is favored over David Jolly for Florida governor.
But those are not all coin-flip contests. In the live markets reviewed by JBizNews, Wisconsin’s 1st Congressional District was much closer to even odds than any of those local-interest races.
Snapshot: October 30, 2026, 12:58-1:01 p.m. EDT. Figures below are each platform’s displayed candidate or party market probabilities, listed in the same candidate order in both columns. They are not vote shares, polling results or predicted victory margins. Prices can change before readers open the links.
New York, New Jersey and Florida: the reader-interest races
| Race and candidate order | Polymarket | Kalshi |
|---|---|---|
| New York governor Kathy Hochul (D) / Bruce Blakeman (R) |
97% / 3% | 95.6% / 4.4% |
| New York 17th House Cait Conley (D) / Mike Lawler (R) |
64% / 37% | 61% / 39% |
| New Jersey 7th House Rebecca Bennett (D) / Thomas Kean Jr. (R) |
94% / 6% | 93.1% / 6.9% |
| New Jersey 9th House Nellie Pou (D) / Rosie Pino (R) |
97% / 2% | 96.7% / 3.3% |
| Florida governor Byron Donalds (R) / David Jolly (D) |
68% / 32% | 69% / 31% |
That means a 97% market price for Hochul is not a forecast that she will receive 97% of the vote. Likewise, a two- or three-percentage-point difference between Polymarket and Kalshi on the same candidate is a difference between trading venues, not evidence that the election itself is separated by two or three points.
The direct-page snapshot also differs slightly from earlier Friday quotations. Kalshi showed Conley at 61% and Lawler at 39% when checked, while Polymarket displayed 64% and 37%. The separate displayed prices are reproduced rather than forced to add to 100.
The closest House markets in this review
| Race and candidate order | Polymarket | Kalshi |
|---|---|---|
| Wisconsin 1st House Bryan Steil (R) / Mitchell Berman (D) |
51% / 48% | 50% / 50% |
| South Carolina 1st House Jenny Costa Honeycutt (R) / Nancy Lacore (D) |
53% / 47% | 53% / 47% |
| Maine 2nd House Paul LePage (R) / Matthew Dunlap (D) |
54% / 46% | 55% / 45% |
Wisconsin’s 1st was effectively a coin flip on Kalshi. Polymarket’s candidate rows displayed 51% for Bryan Steil and 48% for Mitchell Berman. South Carolina’s 1st and Maine’s 2nd also appeared among the closest races when Polymarket’s House directory was sorted by the leading candidate’s displayed chance.
These are selected close markets, not a claim that every House district has equally active trading or that a national ranking will stay unchanged. A contract’s price is a different measurement from the expected margin in ballots cast.
Senate control, Kansas and Iowa
| Race and candidate order | Polymarket | Kalshi |
|---|---|---|
| Senate control Democratic / Republican |
73% / 28% | 70% / 30% |
| Kansas Senate Adam Hamilton (D) / Roger Marshall (R) |
55% / 46% | 53% / 47% |
| Iowa Senate Ashley Hinson (R) / Josh Turek (D) |
56% / 45% | 55% / 45% |
Kansas and Iowa were the closest Senate winner markets shown in the Polymarket directory review, but neither was literally a two-point gap in displayed winning probabilities. Democrats were favored for overall Senate control on both platforms, at 73% on Polymarket and 70% on Kalshi in the recorded checks.
Other closely watched Senate contests showed clearer favorites:
| Race and candidate order | Polymarket | Kalshi |
|---|---|---|
| Maine Senate Troy Jackson (D) / Susan Collins (R) |
69% / 31% | 67% / 33% |
| Ohio special Senate Sherrod Brown (D) / Jon Husted (R) |
71% / 29% | 71% / 29% |
| Texas Senate James Talarico (D) / Ken Paxton (R) |
72% / 29% | 71% / 29% |
| Michigan Senate Abdul El-Sayed (D) / Mike Rogers (R) |
78% / 23% | 75% / 25% |
Governor markets: Texas and Georgia closer than New York
| Race and candidate order | Polymarket | Kalshi |
|---|---|---|
| Texas governor Greg Abbott (R) / Gina Hinojosa (D) |
61% / 39% | 62% / 38% |
| Georgia governor Keisha Lance Bottoms (D) / Rick Jackson (R) |
66% / 35% | 65% / 35% |
Texas was the closest state governor winner market in the Polymarket directory reviewed, followed by Georgia. Neither was priced as an even-money contest. Florida’s 68%-32% Polymarket display and 69%-31% Kalshi display put it between those races and heavily favored Hochul in New York.
The fake-polling scandal is real, but specific
Axios reported on October 21 that Wedgewood, a self-described polling firm, acknowledged that all but one of its polls were fabricated after aggregator FiftyPlusOne identified irregularities. Axios said several aggregators and the New York Times/Siena polling operation removed Wedgewood from their databases; the Times said it had listed 15 of the firm’s surveys after receiving answers to detailed questions about its operations.
That is a scandal involving Wedgewood’s data. It is not evidence that the New York Times or Siena fabricated their own surveys, and it does not establish that all polls are unreliable or that betting markets are always right.
Are markets better than polls?
They answer different questions. A poll asks a sample of people about their preferences or intentions. A prediction market shows the prices at which traders are taking financial positions on an outcome. It is a view of what people are willing to back with money, not a representative survey of voters.
The Commodity Futures Trading Commission’s explanation of event contracts says a contract’s price reflects traders’ perceived probability of an outcome. It says markets can sometimes forecast better than polling or other methods. That is not a guarantee that they are always better.
Markets can miss, too. A study of forecasts for Britain’s 2016 EU referendum found betting and prediction-market participants were among the most overconfident that Remain would win, while polls and citizen forecasts came closest to the eventual outcome. The lesson is to compare sources rather than treat either polls or bets as certainty.
Displayed probabilities can also differ from the price offered by a buy button. Separate contracts, bid-ask spreads and rounding can leave candidate figures totaling slightly above or below 100%. This article uses the displayed market-probability rows, not the trade ticket’s fee-adjusted payout calculation, and does not normalize the numbers.
The markets have their own settlement rules. Polymarket’s Senate-control contract defines control through a majority of voting seats, including the vice president’s party in a tie; Kalshi describes settlement by media consensus, with a President pro tempore fallback on February 1, 2027. Similar labels should not be mistaken for identical contracts.
For readers following the November 3 midterms, the useful signal is where real-money expectations are converging or diverging. It is not a substitute for the count. For the separate policy implications for banks, housing and crypto, see JBizNews’ Wall Street midterm analysis.
JBizNews Desk | WASHINGTON
© JBizNews.com. All rights reserved. Unauthorized reproduction or redistribution is strictly prohibited.