
Photo: Spencer Platt / Getty Images
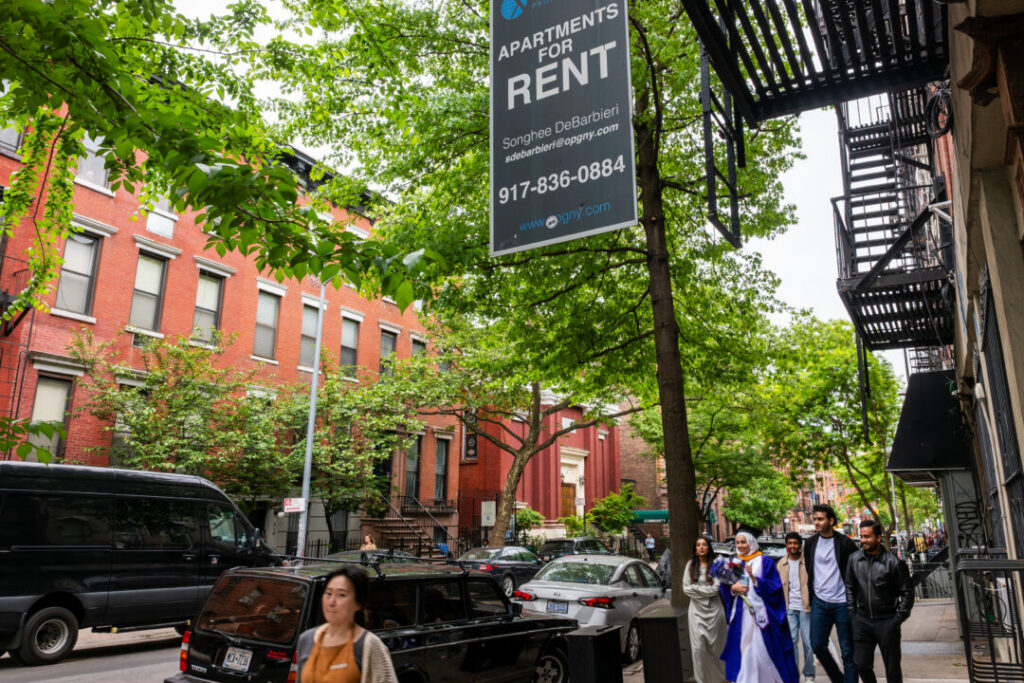
Rental housing became less affordable in 232 of 282 U.S. metropolitan areas between 2014 and 2023, according to a newly released study that adjusts for changes in housing quality rather than treating every increase in rent spending as a worsening cost burden.
The Mortgage Bankers Association’s Research Institute for Housing America report, released Tuesday, found affordability worsened in 82% of the metropolitan areas studied and improved in the other 50. Its findings describe a historical period ending in 2023, not current 2026 rents.
The study adds a qualification to the debate over housing costs: higher rental bills can reflect both more expensive housing and changes in the quality or quantity of housing that households consume. Separating those effects matters for developers, property investors and policymakers deciding where affordability problems are most severe.
A quality-adjusted measure of rental pressure
Syracuse University economist Gary Engelhardt used American Community Survey data from 2014 through 2023 to develop a metropolitan affordability index. The model accounts for housing quality, rental prices and household economic decisions, including the relationship between housing demand and income.
After making those adjustments, the estimated national decline in affordability was equivalent to a $256 annual reduction in income per renter household. That is a model-based measure of lost purchasing power, not a finding that rents rose by $256 or that renters’ paychecks fell by that amount.
As much as half the increase in rental expenditures since 2014 was associated with improvements in housing quality, the researchers found. That does not mean half of every tenant’s rent increase purchased an improvement. It describes an aggregate relationship across the housing consumed in the study.
Wide differences between metropolitan areas
Mount Vernon-Anacortes, Washington, recorded the largest deterioration under the study’s measure, equivalent to a $1,212 annual income loss per renter household. Mankato, Minnesota, showed the largest improvement, equivalent to $964 in additional annual income.
The income-equivalent losses were larger in coastal and major metropolitan areas, according to the report. But the split between 232 worsening markets and 50 improving ones shows why a national average cannot describe the experience of every renter or property market.
Traditional indicators, including rent-to-income ratios and the share of renters classified as cost-burdened, do not fully separate quality changes from increases in rental prices. The researchers argue those measures can overstate the deterioration in affordability when tenants are also consuming better housing.
For readers assessing today’s market, the study’s cutoff is important: it does not directly measure changes in rents, incomes or available apartments since 2023. Its contribution is a different way to examine the longer-term affordability problem, not a replacement for current local rent and income data.
JBizNews Desk | New York
© JBizNews.com. All rights reserved. Unauthorized reproduction or redistribution is strictly prohibited.