
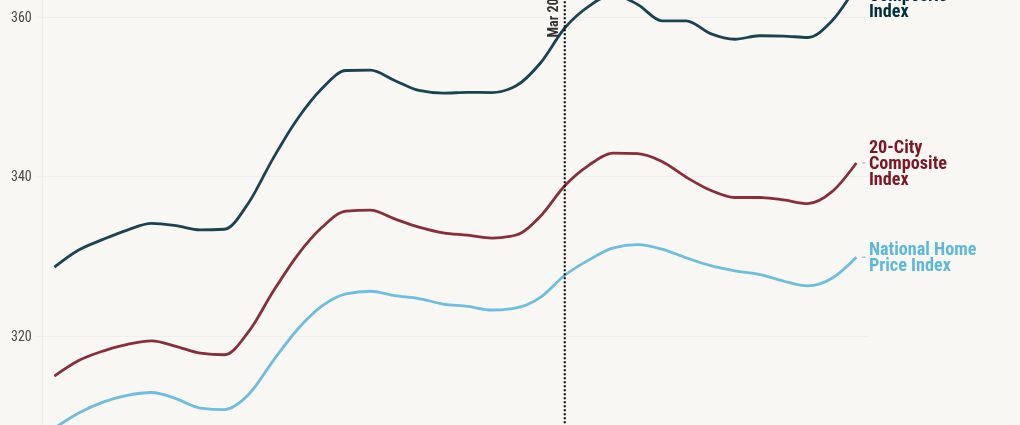
The recent slower pace of home price appreciation continued into the spring housing market, according to the S&P Cotality Case-Shiller Index for March that was released on Tuesday.
In March, the national index recorded a 0.7% annual increase, coming in at a reading of 308.07. This is down from a 0.8% annual increase in February. Month over month, the national index posted a 0.2% decline after seasonal adjustment.
“Monthly price movements offered a seasonal spring lift but little underlying momentum,” Nicholas Godec, the head of fixed income tradables and commodities at S&P Dow Jones Indices, said in a statement. “The latest six months saw only a negligible 0.3% rise in national home prices, barely keeping pace with the 0.3% in the prior half-year — a sign of a housing market nearly at a standstill.”
Similar trends prevailed in the 10-city and 20-city composite indices. The 10-city index (330.38) posted a 1.4% year-over-year increase, down from 1.5% in February. The 20-city index (318.73) recorded a 0.8% annual increase, down from 0.9% in February. Additionally, after seasonal adjustment, the 10-city index recorded a 0.03% month-over-month decline, while the 20-city index posted 0.2% monthly decrease.
These results came as more than half of the 20 markets examined posted year-over-year price declines in March. Seattle was the weakest with a 2.5% annual decline, followed by Denver (-1.95%), Tampa (-1.93%) and Dallas (-1.71%).
At the other end of the spectrum, Chicago posted the largest annual price increase at 6.1%, followed by New York and Cleveland with annual price increases of 4% and 3%, respectively.
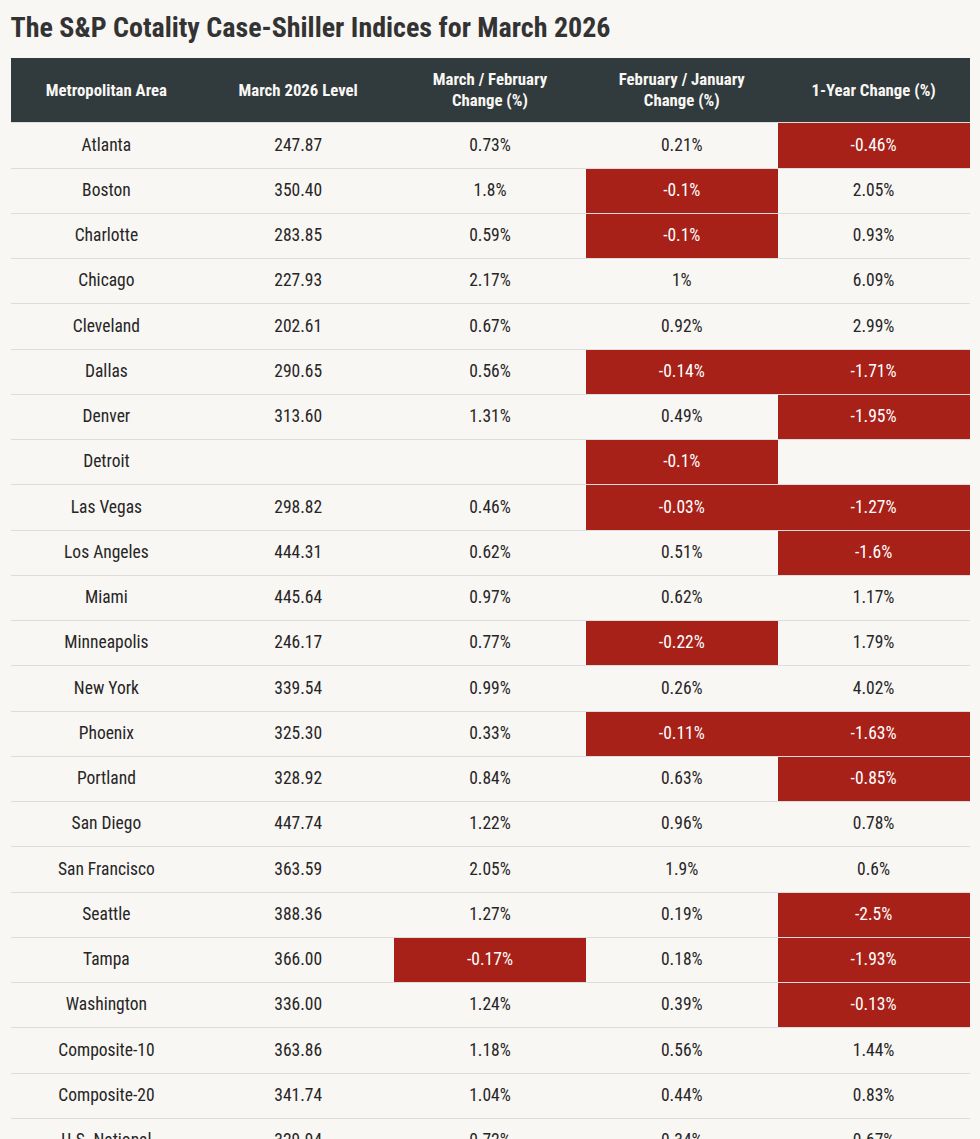
“The geographic divergence remains stark,” Godec said. “Midwest and Northeast markets are sustaining modest growth, while much of the Sun Belt and Western regions are still seeing declines. The spread between the strongest and weakest markets — 8.6 percentage points, from Chicago’s +6.1% to Seattle’s -2.5% — highlights how localized this housing cycle has become.”
Month over month, home prices rose in 19 of the 20 metros in the dataset, with Chicago posting the largest increase at 2.17% and Tampa posting the lone decrease at -0.17%.
According to the report, this marks the 10th consecutive month that inflation outpaced national home price appreciation, as the Consumer Price Index for March ran 2.6 percentage points above the 0.7% annual home price gain for the month.
“With consumer inflation accelerating to roughly 3.3% in March, U.S. home values have now fallen in real terms for the 10th consecutive month, underscoring an ongoing erosion of inflation-adjusted housing wealth,” Godec said.
HousingWire Data also reveals a softer home price growth than a year ago. For the week ending May 22, the national median list price of a single-family home was $450,000, down 3.23% from a year ago.
Additionally, as with the Case Shiller report, smaller Midwest and Rust Belt metros dominate the biggest home price gains. Johnstown, Pennsylvania, posted the largest increase at 93.88%, followed by Elmira, New York (57.79%) and Champaign-Urbana, Illinois (47.17%).