
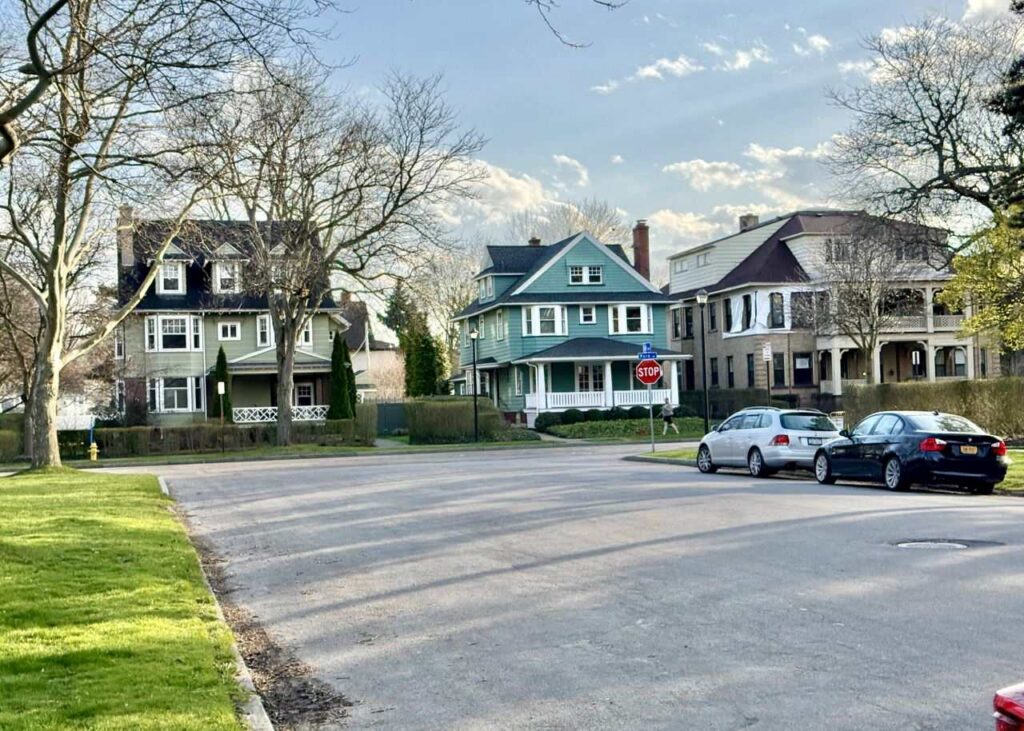
Archive 2024: Warren LeMay / CC BY-SA 2.0, cropped
Home prices rose in 78% of U.S. metro markets in the third quarter, and the national median existing single-family home price reached $432,900, up 1.7% from a year earlier, the National Association of Realtors said Thursday.
The October 29 report shows prices still rising across most of the country, though the share of markets posting gains slipped from 80% in the second quarter. Just 4% of metro areas recorded double-digit increases, compared with 5% in the prior quarter.
For buyers, a slower rate of price growth did not mean a smaller mortgage bill. NAR put the monthly mortgage payment on a typical existing single-family home with a 20% down payment at $2,251, up $69 from a year earlier and $48 from the previous quarter.
Northeast gains outpace the national increase
The Northeast’s median existing single-family home price rose 4% from a year earlier to $561,500. That was the strongest annual increase among the four regions in the report, ahead of the Midwest’s 3.6% gain to $342,500 and the South’s 1% increase to $374,900. The West’s median fell 0.6% to $629,000.
Several Northeast markets also appeared among NAR’s biggest price gainers. Rochester, New York, posted a 10.9% annual increase, just behind Gulfport-Biloxi-Pascagoula, Mississippi, at 11%. York-Hanover, Pennsylvania, rose 9.2%, while Hartford-West Hartford-East Hartford, Connecticut, gained 7.5%.
Bridgeport-Stamford-Norwalk, Connecticut, remained one of the country’s most expensive markets, with a median price of $874,200, up 3.5% from a year earlier. San Jose-Sunnyvale-Santa Clara, California, topped that list at $1.92 million.
First-time buyers face a larger income burden
NAR’s first-time buyer calculation put the monthly mortgage payment on a typical $368,000 starter home, with a 10% down payment, at $2,208. That was $67 more than a year earlier and $46 more than in the second quarter.
First-time buyers spent 36.3% of income on monthly mortgage payments in the report’s calculation. That was up from 36% in the prior quarter but down from 37% a year earlier. For typical families overall, the share was 24.1%, compared with 23.9% in the second quarter and 24.5% a year earlier.
Those figures show how affordability can improve on an income-share measure even while the dollar payment rises. They also underline the difference between entering the market with a smaller down payment and buying with 20% down.
“Even with affordability challenges causing the housing market to stagnate, home prices continue to set record highs in most parts of the country,” NAR Chief Economist Lawrence Yun said in the release.
What the median does, and does not, measure
The median is the midpoint of prices among homes sold, not a measure of how much every individual home gained in value. NAR cautions that changes in the mix of homes sold can affect the result, including shifts in the share of lower-priced distressed sales.
The report covers approximately 235 metropolitan statistical areas. Regional figures come from a separate sample that also includes rural areas and parts of smaller metros, so regional changes do not necessarily track the larger metro markets. NAR says median home-price comparisons should be made against the same period a year earlier because buying patterns are seasonal.
JBizNews Desk | Washington
© JBizNews.com. All rights reserved. Unauthorized reproduction or redistribution is strictly prohibited.