
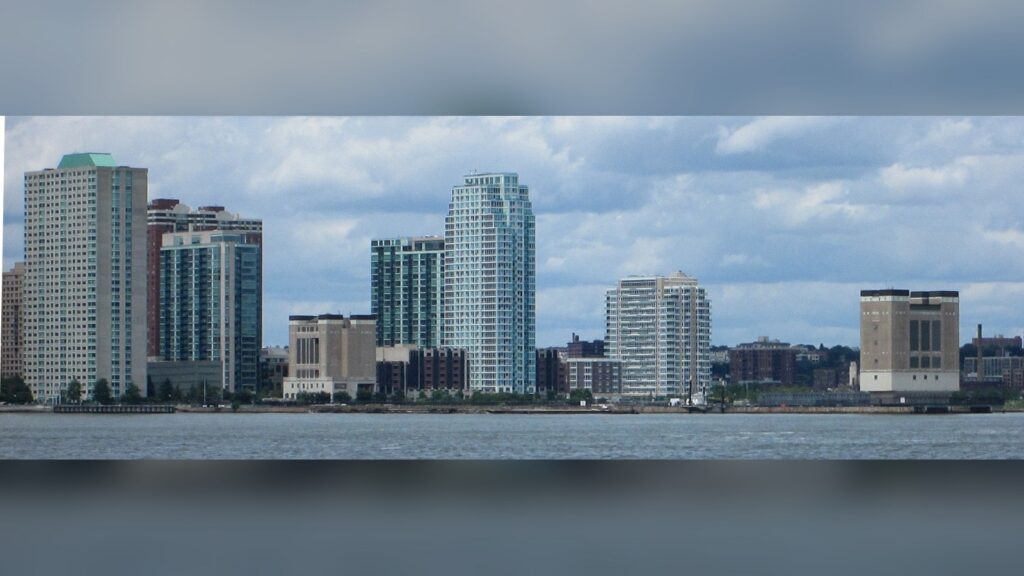
The asking-price threshold for luxury homes fell across the United States in October, with the New York-Newark-Jersey City market recording an 11.3% annual decline while Atlantic City-Hammonton, New Jersey, moved in the opposite direction. Realtor.com’s November 9 report shows a divided high-end market, not a uniform fall in the value of homes already owned or sold.
Nationally, the entry point for the most expensive 10% of listings was $1,197,014, down 2.3% from a year earlier. That marked the 31st consecutive month of annual declines in the measure. The figures are asking prices drawn from active listings, not prices paid in completed sales.
In the New York-Newark-Jersey City metropolitan area, that top-10% threshold stood at $2,677,006, according to Realtor.com’s release and tables. Despite the annual decline, it was 2.3% above September’s level. The monthly increase and yearly decrease can coexist because they compare October with different starting points.
Atlantic City-Hammonton’s luxury threshold was $2,394,625, up 3.0% from a year earlier. Its luxury listings spent a median of 64 days on the market, unchanged from the previous October. That puts the South Jersey market among the 12 of 43 metropolitan areas in the report whose thresholds rose by at least 1% annually.
For buyers and sellers, the distinction matters: the price needed to reach a market’s top tier is changing differently across locations. The threshold describes the listings available at a particular time. It does not show that every luxury property in New York lost 11.3%, or that an individual Atlantic City home gained 3%.
The national pullback was greater farther up the price range. The threshold for the top 5% of listings fell 4.1% to $1,873,040, while the top-1% threshold declined 6.2% to $5,125,874. Million-dollar listings represented 12.3% of the market, down half a percentage point from a year earlier.
Market times shortened nationally even as asking-price thresholds fell. Listings at the 90th percentile spent a median of 73 days on the market, five fewer than a year earlier, compared with 63 days for the typical listing. The top-5% tier stood at 81 days and the top-1% tier at 97 days. These listing measures are not a count of completed transactions.
Bridgeport-Stamford-Danbury, Connecticut, had the highest entry-luxury threshold at $3.96 million. It rose 10.1% from September but remained 6.8% below the prior October. Los Angeles-Long Beach-Anaheim followed at about $3.89 million, with Naples-Marco Island, Florida, at about $3.75 million.
Naples led the markets with rising thresholds, up 9.0% annually. Florida accounted for five of the 12 metros with gains of at least 1%, including North Port-Bradenton-Sarasota, Cape Coral-Fort Myers, Miami-Fort Lauderdale-West Palm Beach and Tampa-St. Petersburg-Clearwater. That regional contrast is another reason the national decline should not be treated as a rule for every local market.
The report uses Realtor.com listing feeds from participating multiple-listing services and covers active existing-home inventory, including houses, condominiums, townhomes, row homes and co-ops. New construction is excluded unless actively listed on a participating service. Its market-level comparison covers 43 metros averaging at least 500 million-dollar listings over the preceding 12 months.
The disclosure does not separate how much of each threshold change comes from sellers adjusting asking prices and how much comes from a different mix of properties being listed. Nor does it establish final negotiated prices, financing terms or the value change of the same homes over time. It offers a view of the high-end asking market, with New York and South Jersey illustrating why local comparisons matter.
JBizNews Desk | New York and New Jersey, United States
© JBizNews.com. All rights reserved. Unauthorized reproduction or redistribution is strictly prohibited.