
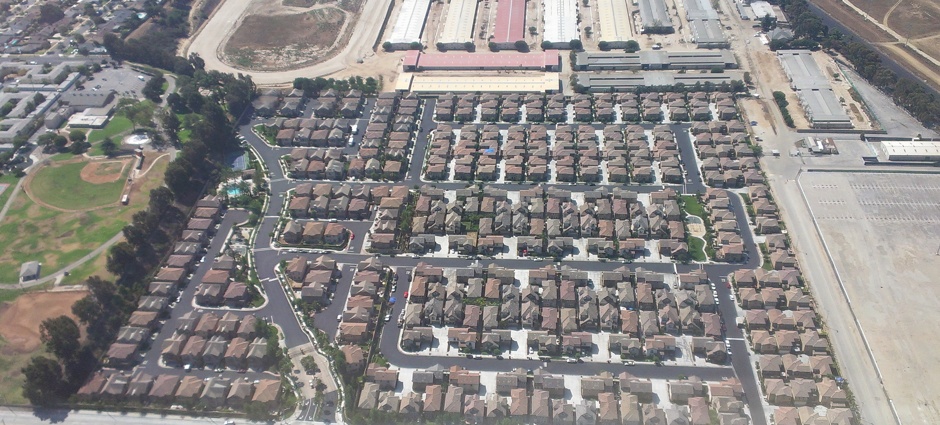
Los Angeles homes, August 2014 archive. Alfred Twu / Wikimedia Commons (CC0); cropped.
U.S. contracts to buy existing homes fell 4.7% in October from September and 16.7% from a year earlier, the National Association of Realtors reported November 18, with declines across all four major regions.
NAR’s Pending Home Sales Index fell to 63.0. The measure tracks signed purchase contracts, not completed transactions or home prices. An index reading of 100 represents average contract activity in 2001.
The report points to a weaker pipeline of transactions for real estate agents, mortgage lenders and sellers heading into the end of the year. Contracts usually close within one or two months, according to NAR, but financing, inspection and appraisal problems can delay or prevent a sale.
Declines reach every region
The West had the largest monthly drop, with pending sales down 6.9% from September and 20.3% from October 2025. The South followed with declines of 6.3% month over month and 18.7% year over year.
In the Midwest, contract activity fell 2.7% from September and 14.0% from a year earlier. The Northeast recorded the smallest declines, down 0.8% for the month and 11.1% for the year. Its smaller monthly decrease still left activity below both comparison periods.
NAR Chief Economist Lawrence Yun described September and October as two consecutive months of record-low pending contracts. He said that weakness points to sluggish fourth-quarter closings and that annual existing-home sales could be the lowest since the mid-1990s.
Those are forecasts about completed sales, not results established by the October contract report.
A possible low point, not a confirmed rebound
Yun also said October could mark the low point in contract signings for the current housing cycle, citing his view that mortgage rates appear to have peaked. The report does not establish that a recovery has begun.
The index covers signed contracts for existing single-family homes, condominiums and co-ops. NAR says its sample covers about 40% of multiple listing service data each month. That makes it an early measure of the existing-home sales pipeline, rather than a count of all housing transactions.
For buyers and sellers, the immediate distinction is between agreeing to a purchase and completing it. October’s figures show fewer agreements entering that pipeline. They do not, by themselves, show how many will close or whether prices will rise or fall.
Sources: NAR’s November 18 release on October pending home sales and NAR’s index description and methodology.
JBizNews Desk
© JBizNews.com. All rights reserved. Unauthorized reproduction or redistribution is strictly prohibited.