
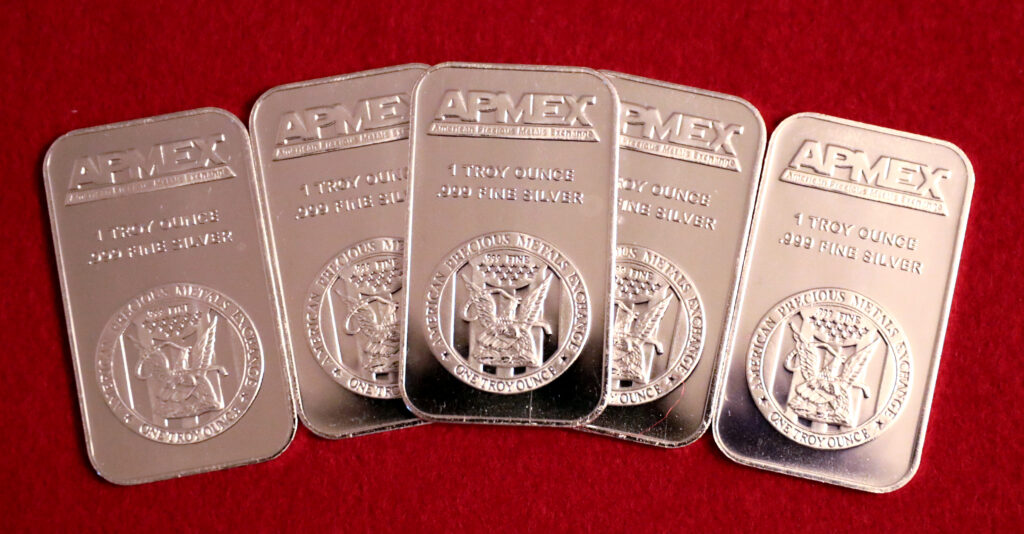
Archive silver bars, 2019. Gage Skidmore / Wikimedia Commons, CC BY-SA 3.0; cropped, adaptation under the same license.
Silver traded near $45 an ounce Thursday morning, roughly 63% below its January peak near $122, a sharp reversal for a metal pulled between factory demand and investors seeking a store of value.
The decline has erased much of silver’s surge, but not all of its longer-term gains. Rounded spot-price observations put it near $74 on May 19, around $51 to $52 on November 19 last year, and about $31 on the same date in 2024. That leaves silver roughly 40% below its level six months ago and about 12% to 13% below a year ago, while still around 45% above two years ago.
Kitco quoted a spot bid of $45.05 per troy ounce at 9:21 a.m. Eastern on November 19. The historical comparisons use rounded U.S.-dollar spot observations, not identical-time investment returns or futures-contract prices. Retail coins and bars also carry dealer premiums above the metal price.
Silver does a physical job
Silver is much more than a currency substitute. It conducts electricity in switches and electronic components and is used in solar cells. Vehicle electronics, charging infrastructure and other electrical equipment create demand for the metal, alongside jewelry and silverware.
The Silver Institute’s November 12 review, based on Metals Focus estimates, forecasts industrial demand of 640 million ounces out of total demand of 1.08 billion ounces in 2026. That is roughly three-fifths of demand. These are forecasts, not final full-year results.
Investors add a separate source of buying and selling through coins, bars, silver-backed funds and futures. Some want protection against inflation, currency weakness or financial stress; others are trading price changes. Investment flows can shift faster than manufacturers can change production plans.
That gives silver a divided identity. Economic anxiety can encourage precious-metal buying while hurting expectations for factory demand. Inflation can attract buyers of hard assets, but higher interest rates can make interest-paying investments more attractive than silver, which pays no interest. A hedge is an attempt to offset a risk, not insurance that the price will rise whenever conditions worsen.
How it compares with other commodities
Gold has a stronger official monetary role. Central banks bought about 321 metric tons in the third quarter, according to the World Gold Council. Silver investors may seek a similar store of value, but silver also depends heavily on industrial orders.
Platinum performs a different manufacturing task. Platinum-group metals help chemical reactions in vehicle catalytic converters turn harmful exhaust gases into less harmful substances. Silver’s vehicle uses are more closely tied to electrical and electronic components. Copper, meanwhile, is widely used in wiring, motors and power networks. All three have industrial exposure, but they are not interchangeable materials or investments.
Silver’s swings also need perspective. CME Group’s October data put its expected price risk above gold and copper, overlapping platinum, while oil and natural gas also showed substantial or greater expected swings.
| Commodity | October risk-index range |
|---|---|
| Gold | 20.58–25.97 |
| Copper | 22.26–26.67 |
| Platinum | 34.70–40.42 |
| Silver | 35.27–49.95 |
| WTI crude oil | 48.26–63.28 |
| Natural gas | 62.45–85.17 |
Source: CME CVOL indexes. These are each index’s low and high during October 2026, measuring options-implied expected swings over the next 30 days on an annualized scale. They are not commodity prices, actual October returns or today’s risk readings. Higher readings mean wider expected swings, not a predicted direction.
The comparison explains why silver can feel unusually turbulent beside gold without establishing that it is the world’s most volatile commodity. Oil and gas respond to their own supply, weather and geopolitical shocks.
Why the rally reversed
The rise into January was not simply a story of factories using more silver. The Silver Institute’s April review described falling available inventories, metal shifting into CME vaults and stronger investment demand contributing to a severe liquidity squeeze in October 2025. The rally accelerated into January before reversing.
Its newer November review points to changing U.S. interest-rate expectations, dollar strength and rising bond yields as pressures on precious metals. Silver-backed investment-product holdings were still 4% below their level at the start of the year as of November 3. Investor selling and a smaller supply shortfall helped ease the physical tightness.
High prices also change manufacturers’ behavior. The institute forecasts total industrial silver demand falling 3% this year: growth outside solar is being outweighed by lower solar-cell consumption as manufacturers use less silver or substitute other materials. More solar installations do not necessarily mean proportionately more silver buying.
The institute still forecasts a 35-million-ounce supply deficit in 2026. That does not guarantee a price increase, because existing stocks and investor sales can fill the gap. Lower yields, a weaker dollar or renewed investment buying could support prices; higher yields, weaker manufacturing or faster substitution could weigh on them.
Silver’s position is therefore more complicated than either a vanished boom or a guaranteed recovery. It remains far below January’s extreme, below last year’s level and well above two years ago. Its next move depends on both the metal factories need and the value investors are willing to place on holding it.
JBizNews Desk | Markets
© JBizNews.com. All rights reserved. Unauthorized reproduction or redistribution is strictly prohibited.