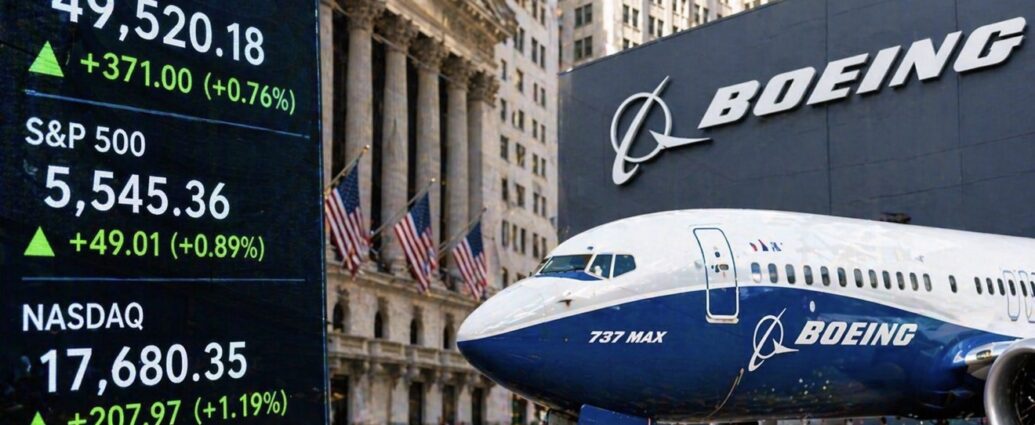
U.S. stocks rallied Wednesday, with the Dow Jones Industrial Average jumping 371 points, or 0.8%, as stronger-than-expected earnings from Boeing Co. and easing geopolitical tensions boosted investor sentiment.

The S&P 500 gained 0.9%, while the Nasdaq Composite advanced 1.2%, briefly hitting a new intraday high, as markets responded to a combination of solid corporate results and a cooling in Middle East tensions.

Investor confidence improved after President Donald Trump extended the U.S.-Iran ceasefire, citing a “seriously fractured” leadership structure in Tehran — a move that reduced immediate fears of renewed conflict and helped stabilize markets.

Boeing Delivers Stronger-Than-Expected Results

Boeing Co. reported first-quarter revenue of $22.2 billion, beating analyst estimates of $21.91 billion and rising 14% year-over-year. The company posted an adjusted loss per share of $0.20, far narrower than the expected $0.68 loss, sending shares higher in early trading.

The aerospace giant delivered 143 commercial aircraft in the quarter, topping Airbus SE’s 114 deliveries — marking Boeing’s first quarterly lead over its European rival since before the 737 MAX crisis.

The 737 MAX accounted for 114 of those deliveries, highlighting its continued role at the center of Boeing’s recovery.

Kelly Ortberg, Boeing’s President and Chief Executive Officer, confirmed production of the 737 MAX is running at 38 aircraft per month, with a fourth assembly line set to open in Renton, Washington this summer. The expansion could lift total narrowbody output to roughly 53 aircraft per month by year-end.

Boeing also reaffirmed strong long-term demand, with a record backlog of $682 billion representing more than 6,100 aircraft orders.

Jay Malave, Boeing’s Chief Financial Officer, said the company expects to generate between $1 billion and $3 billion in free cash flow in 2026 — a potential inflection point after years of financial pressure.

Caution Remains Beneath the Rally

The gains follow a volatile Tuesday session, when the Dow fell 293 points on concerns surrounding the ceasefire deadline.

Scott Welch, Chief Investment Officer at Certuity, warned that underlying risks remain. “The market was not cheap before the conflict, and this rally brings valuations back into focus,” Welch said, adding that investors will likely shift attention back to fundamentals including inflation, labor markets, and Federal Reserve policy in the coming weeks.

Looking ahead, markets now face a critical balancing act — weighing improving corporate performance against persistent macroeconomic and geopolitical uncertainty.

JBizNews Desk

Stifel Financial (NYSE:SF) held its first-quarter earnings conference call on Wednesday. Below is the complete transcript from the call.

Benzinga APIs provide real-time access to earnings call transcripts and financial data. Visit https://www.benzinga.com/apis/ to learn more.

View the webcast at https://event.webcasts.com/starthere.jsp?ei=1760250&tp_key=27e378da59

Summary

Stifel Financial Corp reported strong financial performance for Q1 2026, with net revenues of $1.48 billion, up 18% from the previous year, aided by a non-recurring gain from the sale of Stifel and Independent Advisors.

Earnings per share increased to $1.48 on a GAAP basis, significantly improving from last year’s results impacted by a $180 million legal accrual.

The company emphasized its strategic focus on AI investments to enhance client relationships and productivity, while maintaining a cautious outlook on potential risks from geopolitical tensions and interest rate uncertainties.

Global Wealth Management and Investment Banking saw record first quarter revenues, with strong advisor productivity and advisory revenue growth being key contributors.

Stifel Financial Corp highlighted a conservative lending philosophy, avoiding aggressive structures and maintaining minimal exposure to problematic credit situations, while expressing confidence in its 2026 outlook given current risk assessments.

The company addressed technological advancements like AI and their implications on business models, emphasizing the importance of human judgment in advisory roles despite automation trends.

Stifel Financial Corp’s restructuring in Europe contributed to improved margins, with further cost reductions anticipated, while maintaining a global advisory focus and leveraging U.S. capital market capabilities.

Full Transcript

Joel Jeffrey (Head of Investor Relations)

Good morning and welcome to Stifel’s first quarter 2026 earnings call on behalf of Stifel Financial Corp. I will begin the call with the following information and disclaimers. This call is being recorded. During today’s presentation we will refer to our earnings release and financial supplement, copies of which are available at stifel.com Today’s presentation may include forward looking statements that are subject to risks and uncertainties that may cause actual results to differ materially. Stifel Financial Corp. does not undertake to update the forward looking statements in this discussion. Please refer to our notices regarding forward looking statements and non-GAAP measures that appear in the earnings release. I will now turn the call over to our Chairman and Chief Executive Officer Ron Kruszewski.

Ron Kruszewski

Thanks Joel. Good morning and thanks to everyone for joining us. In the first quarter we delivered very strong performance. Net revenues of 1.48 billion were up 18% from a year ago. That includes a non recurring gain from the sale of Stifel Independent Advisors which closed in February, which was partially offset by interest on a legal judgment. We’ve excluded both from our core results. Excluding the SIA gain, revenue grew 15%. Either way, it was a record first quarter and regardless, it’s a growth rate comparable to the best firms on the Street. Earnings per share were $1.48 on a GAAP basis and $1.45 on a non GAAP basis compared to 33 cents last year. That’s a significant improvement. So I want to be transparent. Last year’s results were impacted by 180 million legal accrual, which was unusual to say the least. Adjusting for that, eps was up 32%. On a comparable basis, our annualized return on tangible equity was nearly 25%. We expect 2026 to be a good year and the first quarter reflects that. Yet the environment has become more uncertain against a backdrop of escalating geopolitical risk. Energy prices have risen, credit spreads have widened and interest rate uncertainty has increased. The wildcard remains a conflict in Iran and its potential impact on energy prices, inflation and ultimately growth. But I’d like to note that unlike some of our larger peers, Stifel’s business model isn’t built around trading volatility. We have a trading business, but it’s client driven and relationship oriented, not structured to capitalize on market dislocations. Delivering these results in a volatile quarter tells you something important about the durability and diversification of what we’ve built. Our growth was broad based global wealth management delivered record first quarter net revenue driven by record asset management revenues and growing advisor productivity. We also generated record first quarter investment banking revenue, producing a record first quarter for our institutional business. Our firm wide pretax margin was more than 22% reflecting continued robust wealth management margins coupled with an institutional pre tax margin of nearly 20%. It is noteworthy that this metric improved nearly 1300 basis points from last year, benefiting from both revenue growth and our international equities restructuring. Jim will provide more detail on that. Look, if the risk I cite remain within a range of market expectations, we are confident in a strong 2026. That confidence is grounded in something more than one quarter. Let me put these results in the longer context. Stifel is a company that both grows and understands the concept of return on invested capital. We’ve scaled revenue from about 100 million in 1996 to roughly 6 billion today and we’re targeting $10 billion in revenue and 1 trillion in client assets. We grow and we grow the right way. That long term philosophy also informs how I think about some of the questions dominating every earnings call so far this season. For each one, I want to tell you what Stifel is doing and share my observations about what I’m seeing in the market around us. The first is AI. Across Deepa, we’re seeing real benefit from our AI investments. The technology enables our advisors, our investment bankers, our commercial lenders and support teams to work faster and smarter. In every case, we’re working to enhance client relationships with AI, keeping our professionals at the center of the value proposition. The opportunity here is significant. We are in the early process of linking our data to these new tools and there is a lot of work ahead. But the early results give me confidence that we’re on the right path. But I’d be less than candid if I didn’t raise a concern about frontier models like Mythos that are becoming an entirely new category of technology. As recently as a few weeks ago, I’m not sure any of us really fully understood what Mythos was, possibly even those that created it. And the next version, as I understand it, is already in development. Models this powerful increase capability on both sides of the table for those defending and for those who would do harm. And if you ask me what our industry needs to get right before anything else, the answer is Cyber, not just for Wall Street. This requires a national response. I have consistently said that this is an issue of national security. The second is credit. At Stiepel, our lending philosophy has never been built around chasing yield. We treat lending as a relationship oriented business, not a volume driven growth engine. The headlines this season involved specific credit situations. First Brands, Tricolor, Medallia, where aggressive structures, weak collateral monitoring and and in some cases fraud drove the losses. Depot had essentially zero exposure to any of them. As an aside, the more recent concern has been about liquidity in private credit vehicles. Some funds are limiting withdrawals and we’re seeing secondary market participants offering liquidity at significant discounts to nav. It reminds me of the scene in It’s a Wonderful Life where Potter is trying to buy Bailey Billingham loan shares at $0.50 on the dollar during a run on the bank. The underlying assets haven’t changed, but when everyone rushes for the exit at once, the gates come down. That’s a structural issue. The third consistent question surrounds software loans. I read the predictions that every software loan is essentially worthless given AI disruption. To put some numbers to Stifel, our software loan exposure is approximately 500 million on a $43 billion balance sheet. Not a material number. But the more important point is that we have reviewed our software exposure carefully. And while there are always normal pockets of stress, we don’t see the broad credit issues that the headlines suggest. The fourth is legislation and market structure. Two questions are dominating this debate, right? Stablecoin yield and tokenized equities. Let me tell you where Stiepel stands on both. On stablecoins, we will offer them. But in my opinion, if a stablecoin pays yield, that’s a deposit subject to capital requirements, aml, BSA and the full framework of bank regulation. Or if the yield comes from investing the underlying funds, then it’s a money market fund. Follow those rules. Legislation should not create a third option that avoids both. On tokenized equities, we will build the capability to offer, settle and trade them. But in my opinion, the regulatory framework should follow the underlying asset. A tokenized Apple share is still Apple stock. Every rule that applies to that stock, disclosure, best execution, settlement, finality, investor recourse applies to the token. The technology changes the delivery, it doesn’t change the obligation. And for those who say this is about protecting the incumbents, if that was true, we wouldn’t be building the capability at all. But we are building this capability. The principle is simple. A deposit is a deposit, a security is a security. Custody is custody. Nearly a century of Investor protection wasn’t built to apply only to some participants. The technology doesn’t change that. I’ve discussed AI and software disruption, credit markets and legislation and market structure. In each case. I wanted you to understand both where Stifel stands and my observation about what’s happening around us. Over the last 30 years we have shown a consistent ability to adjust to economic and technology change. Global Wealth Management is growing, our institutional pipelines are strong and our investments in the innovation economy through venture lending and deposit generation are paying dividends. Bottom line. What I see is a firm that is very well positioned. So Jim, please take us through the numbers.

Jim

Thanks Ron and good morning everyone. Before I jump into the financial results, I’d remind everyone that the EPS numbers are reported on a split adjusted basis following our 2-for-1 stock split that was effective in late February of this year. Turning to the results, total non GAAP revenues of 1.44 billion was right in line with consensus estimates. Investment banking was the primary upside driver, exceeding expectations by $8 million or 2% as a number of transactions closed late in the quarter. Advisory revenue was the primary driver of the beat. Transactional revenue came in 1% below expectations but increased 7% from the prior year. I’ll cover the components in more detail when we get to the institutional segment. Asset management revenue was modestly above consensus and increased 12% from the prior year and was driven by market appreciation and net new asset growth. Net interest income came in at the lower end of our guidance and $3 million below consensus. I’ll cover the details and the second quarter guidance when we get to the global wealth management section, but to highlight the miss to consensus expectations was driven by lower corporate or non bank net interest income expenses were well controlled and benefited from the strategic actions Ron referenced earlier. Both our comp ratio and non comp expenses came in below consensus. The effective tax rate was roughly 23%, slightly below both guidance and consensus due to improved profitability from our non US operations. Turning to Slide 4 Global Wealth Management generated $932 million in net revenue, the strongest first quarter in our history and essentially in line with last quarter’s record. Results were driven by record asset management revenue and growth in net interest income. These results are particularly strong given the sale of SAA reduced our transactional and asset management run rate for two months during the quarter. We ended the quarter with total client assets of $539 billion and fee based assets of $220 billion. Excluding the SIA impact, total client assets and fee based assets were essentially flat sequentially. Despite the equity market decline as net new asset growth was in the low single digits and was offset by market depreciation, our recruiting pipeline remains robust though activity is episodic and dependent on changing compet market dynamics. Over the last 12 months we’ve recruited trailing 12 month production totaling approximately $80 million, which does not include the impact that recruiting has on net interest income. Our client driven balance sheet continues to enhance both earnings consistency and client engagement. As I mentioned, net interest income came into the lower end of our guidance due to slower loan growth as market volatility impacted fund banking late in the quarter more than offsetting growth in residential mortgages, securities based lending and C and I loans. Non bank interest income, particularly within corporate interest and securities lending was approximately $3 million lower than originally forecast. For the second quarter we expect net interest income in the range of 280 to 290 million dollars. Client cash balances increased meaningfully during the quarter. Suite balances increased by more than $670 million while non wealth client funding increased by nearly $1.2 billion, reflecting strong momentum from our Venture Group third party money fund balances increased by nearly $200 million. We have significant funding to grow our loan book. While loan growth in the first quarter was slower than originally forecast, we’ve already seen fund banking activity pick up in April and we are maintaining our full year guide of up to $4 billion in asset growth. Turning slide 5 our institutional group posted its strongest first quarter in our history. Revenue was $495 million up 29% year over year driven by record first quarter investment banking. Investment banking revenue totaled $341 million up 44% year over year, coming in slightly above our recent guidance due to a number of transactions closing late in the quarter with a particularly meaningful contribution from our new partners at Bryant Garnier. Advisory revenues increased 59% to $218 million with continued strength in financials, industrials, consumers and healthcare. Equity capital raising was 67 million, our second strongest first quarter result with increased issuer engagement led by health care industrials and energy Fixed income underwriting of 50 million was up 9% year over year driven by increased public finance activity and higher corporate issuance. We remain the number one negotiated issue manager in public finance by deal count with nearly 15% market share and are also seeing increased success in larger par value transactions. Investment banking and advisory pipelines remain very strong. That said, the pace of realization will depend on the geopolitical and economic factors that Ron mentioned earlier including energy prices, credit spreads and interest rate uncertainty. We continue to anticipate a strong 2026 transactional revenue increased 4% year over year, driven by a 12% increase in fixed income revenue reflecting increased client activity from market volatility. Equity Transactional revenue was down 7% entirely reflecting the European restructuring. Excluding that impact of a $9 million year over year decline due to those restructuring efforts, our core equity transactional business grew by 10%. This was also the primary driver of the nearly 1300 basis point improvement in our institutional pre tax margins year over year. While we’ve made significant progress in our non U.S. operations, the first quarter benefited from some larger advisory fees and results will not be linear over the remainder of the year. Moving on to expenses, our comp ratio of 57.5% was the high end of our full year guidance and down from 58% a year ago. We are certainly conservative in our comp accruals early in the year and will continue to look for leverage as the year progresses. Non compensation expenses totaled 293 million, up 8% year over year. After excluding the illegal accrual from the first quarter of 2025, our operating non comp ratio was 19% and was at the midpoint of our full year guidance. The declines in our comp and non comp ratios benefited from the strategic actions referenced earlier and we remain confident in our full year guidance. Turning to Slide 7, our capital position remains strong and provides meaningful strategic flexibility. The Tier 1 leverage ratio increased to 11.4% and the Tier 1 risk based capital ratio rose to 18.7%. Based on a 10% Tier 1 leverage target, we ended the quarter with nearly $560 million of excess capital. I’d also highlight that we have thoroughly reviewed the new proposed capital rules. Based on our review, Stifel would obtain some relief across risk based capital requirements, but these rules would have no material impact on our Tier 1 leverage capital. Finally, we repurchased 2.8 million shares during the quarter and have 10.2 million shares remaining under the current authorization. Assuming no additional repurchases and a stable stock price, our fully diluted share count for the second quarter is expected to be approximately 163.1 million shares. And with that, Ron, back to you.

Ron Kruszewski

Thanks Jim. I want to close by saying that I’m generally excited about where Stifel is headed. We have a strong business, an experienced team and a model that has proven itself in good times and in challenging ones. The environment is uncertain. I said that at …

Full story available on Benzinga.com

This post was originally published here

Metro (TSX:MRU) released second-quarter financial results and hosted an earnings call on Wednesday. Read the complete transcript below.

Benzinga APIs provide real-time access to earnings call transcripts and financial data. Visit https://www.benzinga.com/apis/ to learn more.

Access the full call at https://app.webinar.net/lydgeWKezV2

Summary

MRU’s Q2 sales increased by 4.1% to $5.1 billion, driven by new store openings and same-store sales growth.

Food same-store sales grew by 1.8%, while pharmacy same-store sales increased by 5.1%, supported by prescription and front store sales growth.

Gross margin improved slightly to 20.1% of sales, aided by productivity gains and cost control initiatives.

The company’s adjusted EBITDA rose by 6% year over year, while adjusted net earnings increased by 4.4%.

Capital expenditures for Q2 were consistent with last year, totaling $85.3 million.

MRU is managing a strike in Quebec that has impacted sales, with a contingency plan in place to mitigate disruptions.

The company continues to expand its discount store format and sees strong momentum in its pharmacy business.

MRU’s online sales grew by 19.8%, driven by third-party marketplaces and click-and-collect services.

Management remains focused on cost mitigation and offering competitive pricing amidst inflationary pressures.

Future outlook includes continued store expansions, especially in discount formats, and further leveraging of the MOI loyalty program for personalized promotions.

Full Transcript

OPERATOR

Good morning ladies and gentlemen and welcome to The Metro Inc. 2026 Second Quarter Results Conference call. At this time, all lines are in the listen only mode. Following the presentation, we will conduct a question and answer session. And if at any time during this call you require immediate assistance, please press star zero for the operator. Also note that this call is being recorded on April 22, 2026 and I would like to turn the conference over to Sharon Kadosh, Director, Investor Relations and Corporate Finance. Please go ahead.

Sharon Kadosh (Director, Investor Relations and Corporate Finance)

Good morning everyone and thank you for joining us today. Our comments will focus on the financial results of our second quarter which ended on March 14th. With me today is Mr. Eric Laplesse, President and CEO Nicolas Amiot, Executive VP and CFO Marc Giroud, Chief Operating Officer and Jean Michel Couture, President of the Pharmacy Division. During the call we will present our second quarter results and comment on its highlights. We will then be happy to take your questions. Before we begin, I would like to remind you that we will use in today’s discussion different statements that could be construed as forward looking information. In general, any statement which does not constitute a historical fact may be deemed a forward looking statement. Words or expressions such as expect, intend, are confident that will and other similar words or expressions are generally indicative of forward looking statements. The forward looking statements are based upon certain assumptions regarding the Canadian food and pharmaceutical industries, the general economy, our annual budget and our 2026 action plan. These forward looking statements do not provide any guarantees as to the future performance of the company and are subject to potential risks known and unknown as well as uncertainties that could cause the outcome to differ materially. Risk factors that could cause actual results or events to differ materially from our expectations as expressed in or implied by our forward looking statements are described under the Risk Management section in our 2025 annual report. We believe these forward looking statements to be reasonable and pertinent at this time and represent our expectations. The company does not intend to update any forward looking statements except as required by applicable law. I will now turn the call over to Nicolas.

Nicolas Amiot (Executive VP and CFO)

All right, thank you Sharon and good morning everyone. I will go directly to our Q2 results as Eric will later comment on the status of the current strike in our Quebec operations. Q2 sales reached $5.1 billion, an increase of 4.1% versus the second quarter last year. Sales were positively impacted by new store openings, same store sales growth as well as the transfer of one significant pre Christmas shopping day to the second quarter this year. Food same store sales grew by 1.8% in the quarter up 1.5% when adjusting for the Christmas shift. On the pharmacy side, same store sales grew by 5.1%, supported by a 6.1% growth in prescription sales and a 2.8% growth in front store sales. Similar to food. When adjusting for the Christmas shift, front store sales were up 2.3%. Our gross margin reached 1.03 billion, or 20.1% of sales in the quarter. This compares to 20% in Q2 last year. Part of the increase is attributable to productivity gains recorded in our distribution centers. As mentioned on the last call, our operations are back to normal in our Toronto distribution center. Operating expenses were 538.9 million in the quarter, up 3.4% year over year. As a percentage of sales, operating expenses were 10.5% versus 10.6% in the second quarter. Last year reflected continued cost discipline the asset disposals recognized in the second quarter of 2026 generated net gains of 20.4 million, of which 20.1 million was attributable to the disposal of out-of-service warehouses. EBITDA for the quarter amounted to 508.6 million. That’s up 10.3% year over year and represented 9.9% of sales. Excluding the gain on sale from the disposal of out of service warehouses of 20.1 million, adjusted EBITDA stood at 488.5 million, up 6% year over year, reaching 9.6% of sales, an increase of 16 basis points over the second quarter of 2025. Depreciation and amortization expense for the quarter was 144.3 million, up 8.2 million. The increase in depreciation and amortization is mainly due to the increase in retail network investments, including right of use assets as well as ongoing investment in technology. Net financial costs for the quarter were 37.3 million compared to $33.4 million last year. The increase is mainly due to higher interest expense on net debt. On February 25 this quarter, the company tapped the bond market and issued a five year $350 million note bearing interest at a rate of 3.469%. We use the proceeds of the offering to repay debt under our revolving credit facility and for general corporate purposes, including this financing. Our debt to EBITDA ratio stands at about 2.2x. Our effective tax rate of 24.6% which continues to benefit from the Terrebon DC tax holiday, is similar to the effective tax rate of 24.5% in the second quarter last year, adjusted net earnings were 236.5 million in the quarter compared to 226.6 million last year, an increase of 4.4%. While adjusted fully diluted net earnings per share amounted to $1.11 versus $1.02 last year, up 8.8% year over year, our capital expenditures in Q2 totaled 85.3 million, consistent with last year. After 24 weeks on the food retail side, we opened or converted six stores and carried out four major renovation projects for a net increase of 141,000 square feet, or 0.6% of our food retail network square footage. Under our normal course issuer bid program, as of April 2nd, we have repurchased 2.9 million shares for a total consideration of 279.8 million at an average share price of $96.47. In closing, we delivered solid Q2 results supported by strong sales growth and good expense control. On this, I will now turn it over to Eric for additional color on our Q2 results.

Eric Laplesse (President and CEO)

Thank you. Thank you, Nicola and good morning everyone. Before turning to the results, I will now provide an update on the strike that started on March 30th in our Quebec operations and which is impacting produce distribution to our stores in Quebec. We are obviously disappointed by this strike now in its fourth week. We have been back at the bargaining table since April 8 and remain determined to reach an agreement that takes into account the needs of our employees and those of our customers while ensuring the long term competitiveness of our company. As in any situation of this kind, the first days of the labor dispute required adjustments while our contingency plan was being fully implemented. Our contingency plan is now in place and our stores, although not in perfect condition, are …

Full story available on Benzinga.com

This post was originally published here

Robinhood Markets, Inc. (NASDAQ:HOOD) shares jumped on Wednesday as investors reacted to the company’s push to widen retail access to private-market exposure through its venture fund.

Robinhood Ventures Fund I Invests $75M in OpenAI

Robinhood Ventures Fund I (NYSE:RVI) announced a $75 million investment in OpenAI, calling it one of the “frontier” AI companies and framing the deal as one of RVI’s largest investments to date.

The investment was made through the purchase of approximately $75 million in OpenAI common stock.

The fund’s portfolio includes Airwallex, Boom, Databricks, ElevenLabs, Mercor, OpenAI, Oura, Ramp, Revolut, and Stripe, with more names expected over time.

The company statement said the number of U.S. public companies has dropped sharply since 2000, while private companies have surged in both number and value.

Firms are staying private longer, and by 2025, private companies outnumber public ones by more than 6.5 times, with total valuations exceeding $10 trillion, the statement added.

Technical Analysis

Robinhood is currently trading within a strong upward trend, having gained 105.35% over the past …

Full story available on Benzinga.com

This post was originally published here

POET Technologies Inc (NASDAQ:POET) shares climbed on Wednesday. The move extends a recovery following a recent short-seller report from Wolfpack Research.

The Nasdaq is up 0.83% while the S&P 500 has gained 0.74%.

CFO Calls Claims A ‘Nothing Burger’

Executive leadership is fighting back against bearish allegations. POET CFO Thomas Mika addressed claims regarding the company’s Passive Foreign Investment Company status.

Mika told Stocktwits the warning was a “big nothing burger.” He noted the company is in a net loss position, meaning U.S. shareholders have nothing to declare.

Mika called short sellers “maggots” during his discussion. He accused the firm of timing the report to create anxiety before Tax Day.

POET also, for …

Full story available on Benzinga.com

This post was originally published here

TORONTO, April 22, 2026 /CNW/ – On March 26, 2026, a hearing panel of the Canadian Investment Regulatory Organization (CIRO) held a hearing pursuant to the Mutual Fund Dealer Rules and accepted a settlement agreement, with sanctions, between Enforcement Staff and PFSL Investments Canada Ltd. (PFSL).

PFSL Investments Canada Ltd. admitted that:

(a)  In relation to redemptions processed in the accounts of a client, PFSL’s internal supervisory controls did not detect that the …

Full story available on Benzinga.com

This post was originally published here

BankUnited (NYSE:BKU) reported first-quarter financial results on Wednesday. The transcript from the company’s first-quarter earnings call has been provided below.

Benzinga APIs provide real-time access to earnings call transcripts and financial data. Visit https://www.benzinga.com/apis/ to learn more.

The full earnings call is available at https://edge.media-server.com/mmc/p/mmozynmf/

Summary

BankUnited reported first-quarter earnings of $62 million with an EPS of $0.83, an improvement from last year’s $58 million and $0.78 EPS.

The company highlighted the seasonality of its business, noting that deposits and loan production typically decrease in the first quarter but rebound in the second.

Non-broker deposits grew by $277 million this quarter, and over the last 12 months, non-broker deposits increased by $1.4 billion.

The company made significant progress in credit, with non-performing loans down by 26% and criticized and classified loans down by 12%.

Despite geopolitical uncertainties, BankUnited maintained its full-year guidance and is optimistic about achieving its goals, emphasizing strong NIDDA growth as a key driver.

The company’s strategic focus includes being a top-tier performer in NIDDA growth, enhancing payment processing capabilities, and managing deposit costs effectively.

Operational highlights include a share buyback of 1.3 million shares, with $200 million still available for future buybacks.

Management expressed confidence in continuing to reduce NPAs and emphasized the importance of new client acquisitions for future growth.

Full Transcript

OPERATOR

We know for next time. Good day and welcome to the Bank United Inc. S First Quarter 2026 Results Conference Call. All participants will be in listen-only mode. Should you need assistance, please signal a conference specialist by pressing the star key followed by zero. After today’s presentation, there will be an opportunity to ask questions. To ask a question, you may press star then one on a touchtone phone. To ajar your question, please press star then two. Please note this event is being recorded. I would now like to turn the conference over to Jackie Bravo, Corporate Secretary. Please go ahead. Thank you, Chloe. Good morning and thank you everyone for joining us today for BankUnited Inc. S first quarter 2026 results conference call. On the call this morning are Raj Singh, Chairman, President and CEO; Jim Mackey, Chief Financial Officer; and Tom Cornish, Chief Operating Officer. Before we begin, please note that our remarks today may include forward-looking statements within the meaning of the Private Securities Litigation Reform Act of 1995. These statements reflect current expectations and are subject to various risks and uncertainties that could cause actual results to differ materially. The Company does not undertake any obligation to publicly update or review any forward-looking statement, whether as a result of new information, future developments or otherwise. Additional information regarding these risks can be found in the Company’s annual report on Form 10-K for the year ended December 31, 2025 and any subsequent quarterly report on Form 10-Q or current report on Form 8-K which are available at the SEC’s website. With that, I’d like to turn the call over to Mr. Raj Singh.

Raj Singh (Chairman, President and CEO)

Thank you Jackie. Thanks everyone for joining us. I know this is a very busy morning. A lot of banks have these calls going on. So if you joined our call, we appreciate it very much. I know it’s not an easy choice, but before we get into the numbers, I want to take a minute of your time and do my public service announcement which I usually do towards the end of the call, but I’m going to start this time with that. And you heard this announcement from me before at previous earnings releases, at meetings I’ve had with investors, in conferences we’ve done. We’ve been talking about this for some time, but I think it bears repeating. So our business is a fairly seasonal business and that seasonality is well understood by us and has been demonstrated now over several cycles, several year cycles and I’ll talk about that in a little bit. You know, just as a refresher of what that seasonality is. Deposits and loans, I’ll talk about them separately because they behave separately. Our deposit balances, especially NIDDA, they start declining sometime in mid to late December and they bottom out deep in the first quarter. They start to rebound back late in first quarter, towards the end of the first quarter and then they go straight up in second quarter. Usually second quarter is our strongest growth NIDDA growth quarter. They stabilize in third quarter and then in fourth quarter, the cycle again begins with declines in December. Now, we’ve observed this for many, many years. Loan production and again production, not balances Loan production, especially CNI Loan production starts slow in the first quarter. That’s our slowest quarter. It picks up steam in Q2 and Q3 and Q4 tends to be our biggest production quarter. We saw that last year, the year before and we expect to have the same happen this year. There is some seasonality in expenses, but I think that’s not just to us, that’s. Everyone has that with FICA and stuff that happens in the first quarter. So I won’t get into those details. Now. When this happens, especially this big swings in NIDDA, it impacts our margin, it impacts our margin, margin impacts our revenue, that impacts our bottom line. EPS and ROA. So what happens when you look from Q4 to Q1, you see pretty meaningful drop in earnings in ROA and EPS and so on. But then if you look to Q2, it kind of rebounds all the way back, if not generally more than all the way back. So in fact, yesterday as I was writing down my notes on what I’m going to say on this call, I do this the day before. I sit down with a yellow pad and I hand write what I’m going to say. I had this deja vu moment. I think I’ve done this before. I went back and I looked at my notes. Surprisingly, I actually still held onto my notes from my call a year ago. And it wasn’t a deja vu moment, it was that I’ve been there before. This is exactly what happened a year ago. So I just quickly jotted down what happened Q4 last year to first quarter of last year, Q4, 24 going into 25. What happened to earnings, EPS, ROA and all that stuff. And I compared it to what happened this year. Our earnings quarter over quarter declined by 11 million this time last year. This year they’ve declined 10. EPS declined 13 basis points, this year it was 11. ROA declined 10 basis points last year, this year it was 9. Slightly better, but kind of in the same ballpark. That’s just the seasonality of the business. So the moral of the story is don’t look at quarter over quarter, look at year over year or trailing 12 months. I know it’s a fast changing world and we all believe in the here and now. But if you just look at the very short term it will throw you off both in quarters in which seasonality works against us and in quarters in which seasonality works for us which will be the next quarter. So with that PSA out of the way, let me get into the numbers. So earnings for the first quarter came in at $62 million. EPS was $0.83. And I’ll compare this to first quarter of last year. Like I just said, last year earnings were 58 million and EPS was 78 cents. Excuse me, NIM was at 299 last year this time NIM was 281. Pre-Provision Net Revenue (PPNR) was 106 million. Last year Pre-Provision Net Revenue (PPNR) at this time was 95.2 million about 11.5% growth despite seasonal pressure on NIDDA. Like I just mentioned in the quarter deposits did grow. Non broker deposits grew 277 million. We used most of them to pay down brokered so net growth was about 7 million. But again like I mentioned should be looking at annual numbers or trading 12 months numbers. So over the last 12 months non broker deposits grew by $1.4 billion. NIDDA grew by $875 million. I would actually even go further and say period end balances don’t mean as much as average balances do. And average NIDDA grew by more than a billion. I think it was 1:50. I’m looking at Jim to confirm but I think it was a billion 50. Talking of loans, loans over the last year grew by 906 million. This quarter grew only 9 million. Non core loans continue to shrink pretty consistently. That’s been now going on for several quarters. So nothing new over there. Let’s switch to credit. So we made a lot of progress on credit this quarter. NPLs were down 98 million. That’s 26% and criticized and classifieds were down 146 million or 12%. Now that 26 and 12% is just the progress we made in the last three months. That’s not an annualized number. Our coverage ratio of ACL to NPLs improved from 59 to 76%. Switching to provision. With respect to provision we continue to be cautious. The geopolitical landscape has changed in the three months since we last spoke to you and and we did use $8 million in qualitative factors in our provisioning to kind of account for that uncertainty. Tom can talk more about this, but I don’t think we’ve seen any meaningful change from what our customers are telling us in terms of their plans and their capital investments and so on. But I will also say that they are very keenly aware of the situation in the Middle east and are watching it like, you know, as they should. Smart money seems to be betting that, you know, the conflict in the Middle east will wrap up in a matter of days or weeks and not months. But only time will tell how that will play out. So like I said, I’ll go back and say we did use some qualitative factors to the tune of $8 million for that uncertainty. Switching to other aspects of the P and L Nim, like I said, came down to 2.99%. And that number was within sort of the ranges of outcomes that we were expecting when we modeled this and our numbers back in December. All the other numbers are not that notable for me to get into. I’ll leave some of the stuff for Tom and Jim to talk about. Oh, yeah, we did buy back a million three shares as we had promised. So we’re off to a good start on the buyback and we still have just here, under 200 million in dry powder left. And we’ll continue to use that. Lastly, guidance. No change to guidance. So what we gave you stays. That’s a full year guidance that we gave you. And we’re still feeling pretty good about those numbers. I think. Not much has changed actually, since we gave you guidance in our business or in the economy, I guess. In the economy, you could say the conflict in the Middle east is sort of the only new factor. But it looks like it’s moving towards some kind of resolution in the short term. So with that, I will turn it over to Tom.

Tom Cornish (Chief Operating Officer)

Great. Thanks, Raj. Yep. So I have a little bit of my own public service announcement today as well. It’s a day of PSA to follow with Raj. I want to talk about deposits first and sort of deposit strategy before I dig into some of the numbers, some of which Roger’s already covered. I wanted to back up a little bit and just talk about sort of what are we trying to do with the overall deposit and client book and, you know, over a longer period of time and how has that performed. So when I look at it, I would say we have three major goals. One is to be a top tier performer in Nidda growth. And our Nidda, as you know, is largely commercial Nidda. So when I look at that number as Raj said we’re up period to period from first quarter last year, 875 million or 11%, which is a pretty impressive number. On an average basis, we’re up the billion 50 million that Raj mentioned. So, you know, strategy kind of number one of being a high level NIDDA growth organization and that being a central part of our business focus, I think has been well accomplished. The second major emphasis is being a payment processor and transactional bank for our clients and making sure that we maintain good pricing discipline around all the products and services that we sell that flow through commercial NIDDA and making sure that we are effectively cross selling as many products as we can into the client base. So I kind of measure that by, you know, is our service charges on deposit growth greater than our NIDDA growth? And when it is, to me that seems to be a multiplier effect on that. So if we look at service charges on deposits year over year, first quarter to first quarter, we’re up 18.8% versus an 11% deposit growth. So to me, that means we’re executing on the strategy of ensuring that that book is well sold, well priced, and, you know, client relationships are becoming very sticky. The last part, which is really the hardest work, is managing deposit cost. And you’ll see we had a decline in average deposit cost for the quarter. And I’ll go through those numbers. But, you know, the process of managing deposit cost, especially in a period of time where we’re not forecasting a fed funds rate decrease that we can lean into is hard work. And you know, and we are consistently doing that. We just. Roger and I were talking now we have a series of rate cuts that are going in this week on the deposit book. So we are consistently analyzing the deposit book and looking to make it more cost effective. So when I think kind of about those are the big three strategies that we try to execute around when we think about the client book and the deposit book as a whole. So with that a little bit more detail, as Raj mentioned, non broker deposits were up by 277 million from the previous quarter than 1.4 billion from a year ago. NIDDA represents 30% of total deposits. Our average cost of Deposits declined by 6 basis points from the previous quarter from 218 to 212. Wholesale funding declined by 70 million from the previous quarter and 749 million from the previous year. And as I said, service charge revenue is up 18.8% for the quarter. As we look into the second quarter, which is on the deposit side, traditionally our best quarter, you know, we have a high level of conviction around very strong deposit growth and NIDDA growth in the quarter. It’s our best quarter typically and you know, all indications from pipeline and activity and business that’s in closing documentation is that it will be a very strong quarter on the loan side. As Raj noted, it was fairly typical first quarter for us. Cree and mortgage warehouse lending were up 76 million and 77 million respectively. CNI declined by 144 million from the previous quarter. Part of that is declining off of higher utilization rates that we tend to see at the end of the quarter. First quarter, particularly in our larger corporate business tends to always be a bit softer because of the financial statements timing for new business that comes through. RESI continued to decline as part of our emphasis to focus on the commercial lending business. And so I think it was about what we expected to see for the quarter. Few comments on CREE that I typically make. The CREE portfolio is now just under 30% of the overall book. And within the CREE book, if you look at page nine in the detailed analysis, you’ll continue to see that it’s a well balanced portfolio across all asset classes. Virtually all asset classes are somewhere between 20 and 25%. And so maintaining a good quality balance in the CREE book is important. You’ll note that the total weighted average debt service coverage for all property types is 1.84 and the average loan to value is 55.4%. So portfolio continues to perform well. This is probably the last quarter. I’ll actually point this out, but you know, we continue to see improvements in the office book. You’ll note the office book on page nine. The weighted average debt service coverage ratio is now up to 1.78. It’s typically been running in the 1.54, 1.55 range. And you know, what we’re seeing is continued improvements in leasing. We’ve seen a reduction in the office book, which the traditional office book is now only about 16% of the book and about 4% is medical office building. And we’re also each quarter starting to see this narrowing that we’ve talked about in the past, which is the gap between physical occupancy and economic occupancy. As lease rate abatements start to run off, we see a closing of that. So we saw a pretty significant increase in the weighted average debt service coverage over the last few quarters. And you know, 1.78, it’s a pretty strong performing portfolio right now. So that’s my coverage on cre and I think with that I’ll turn it over to Jim.

Jim Mackey (Chief Financial Officer)

Great. Thanks Tom. You know, as Raj walked through, you know, it’s worth mentioning again, our first quarter is our seasonally light quarter for most of our businesses. So therefore comparisons to the fourth quarter are always difficult to make. And I don’t want to repeat a bunch of the numbers that Raj took you through, but I do want to hit just a couple other highlights. So if I just focus on the full year trends, you definitely see steady improvement in most of our key performance indicators that we look at. Net income was up 5%, PPNR was up 10%, ROA was up 6%, EPS was up 6% and NIM was up at 18 basis points. So the trends year over year are really good and definitely in line with the guidance that we gave you at last quarter. So we put in the press release. Just for full transparency, we do want to call out a couple …

Full story available on Benzinga.com

This post was originally published here

Quest Diagnostics Incorporated (NYSE:DGX) on Tuesday reported upbeat earnings for the first quarter on Tuesday.

The company posted first-quarter adjusted earnings of $2.50 per share, beating the consensus of $2.35. The provider of diagnostic information services reported sales of $2.895 billion, up 9.2% year over year, beating the consensus of $2.827 billion. Consolidated organic revenues grew by 9%.

“During the first quarter, we grew revenues over 9%, almost entirely from organic revenue growth, on broad-based demand for our clinical innovations, expansion into new clinical areas, and collaborations with elite healthcare and consumer health organizations,” said Jim Davis, Chairman, CEO, and President.

Quest Diagnostics raised fiscal 2026 adjusted earnings per share guidance from $10.50-$10.70 to …

Full story available on Benzinga.com

This post was originally published here

UnitedHealth Group (NYSE:UNH) posted upbeat first-quarter earnings beat and raised its full-year profit outlook on Tuesday.

UnitedHealth reported adjusted earnings per share of $7.23 for Q1, handily topping the Wall Street consensus of $6.58. Revenue came in at $111.7 billion, up 2% year over year and ahead of the $109.58 billion expected, according to estimates from Benzinga Pro.

UnitedHealthcare President Tim Noel noted that care utilization trends are running “consistent with expectations,” with “modest favorability” in government programs including Medicare Advantage.

UNH raised its full-year 2026 adjusted EPS outlook from greater than $17.75 to greater than $18.25, above the consensus of $17.86.

UnitedHealth shares rose 2.8% to trade …

Full story available on Benzinga.com

This post was originally published here

Northpointe Bancshares (NYSE:NPB) released first-quarter financial results and hosted an earnings call on Wednesday. Read the complete transcript below.

This content is powered by Benzinga APIs. For comprehensive financial data and transcripts, visit https://www.benzinga.com/apis/.

Access the full call at https://event.choruscall.com/mediaframe/webcast.html?webcastid=PRc9lWLG

Summary

Northpointe Bancshares reported earnings of $0.62 per diluted share, with a return on average assets of 1.28% and a return on average tangible common equity of 15.71%.

The company achieved robust growth in its Mortgage Purchase Program (MPP), with balances ending the quarter at $3.9 billion, a 51% annualized growth over the prior period.

The company reaffirmed its guidance for 2026, expecting MPP balances to increase to between $4.1 and $4.3 billion by year-end.

Asset quality improved, with net charge-offs declining significantly and non-performing assets decreasing by $2.0 million from the prior quarter.

The company’s strategic focus remains on expanding its MPP business, optimizing capital ratios, and leveraging digital banking channels to drive deposit growth.

Full Transcript

OPERATOR

Greetings. Welcome to NorthPoint Bank Shares Incorporated First Quarter 2026 Earnings Call. All participants are in a listen-only mode. A question and answer session will follow the formal presentation. If anyone should require operator assistance during the conference, please press Star 0 on your telephone keypad. Please note this conference is being recorded. I will now turn the conference over to Brad Howes, Executive Vice President and Chief Financial Officer. Thank you. You may begin.

Brad Howes (Executive Vice President and Chief Financial Officer)

Good morning and welcome to Northpointe Bancshares’ first quarter 2026 earnings call. My name is Brad Howes and I am the Chief Financial Officer. With me today are Chuck Williams, our Chairman and CEO, and Kevin Comps, our President. Additional earnings materials, including the presentation slides that we will refer to on today’s call are available on Northpointe Bancshares’ investor relations website, ir.northpointe.com As a reminder, during today’s call we may make forward looking statements which are subject to risks and uncertainties and are intended to be covered by the safe harbor provisions of federal securities law. For a list of factors that may cause actual results to differ materially from expectations, please refer to the disclosures contained within our SEC filings. We will also reference non-GAAP financial measures and encourage you to review the non-GAAP reconciliations provided in both our earnings release and presentation slides. The agenda for today’s call will include prepared remarks followed by a question and answer session. With that, I’ll turn the call over to Chuck.

Chuck Williams (Chairman and CEO)

Thank you, Brad. Good morning everyone and thank you for joining. With the first quarter completed, we’re off to a very good start in 2026. Despite the macroeconomic uncertainty, our business model remains resilient and our exceptional team members continue to perform well. For the quarter, we earned $0.62 per diluted share on and with a return on average assets of 1.28% and a return on average tangible common equity of 15.71%. Factoring in the impact of dividends paid, our tangible book value per share increased by over 16% annualized over the prior period. Our first quarter results were anchored by robust growth and continued market share gains in our mortgage purchase program or mortgage purchase program (MPP) business, strong performance in our residential lending channel, a modest reduction in our wholesale funding ratio and an improvement in overall asset quality. We’ve added a new slide which is on page four of our earnings call presentation which I think really tells the story well. We’re proud to be one of the only entirely mortgage focused banks in the country. While certain aspects of our financial performance are naturally sensitive to mortgage rates, our diversification across the mortgage Space has historically insulated us from dramatic income statement volatility typically associated with the mortgage industry. As outlined in the charts, we’ve continued to deliver consistent financial performance and grow tangible book value despite a challenging and volatile interest rate environment. One of the biggest drivers of our performance is the success we’ve achieved in our mortgage purchase program (MPP) business. Let me walk through a few highlights. mortgage purchase program (MPP) balances ended the quarter at 3.9 billion, an impressive growth rate of 51% annualized over the prior period. Total loans funded through the channel was 11.2 billion for the quarter, which is very strong considering the first quarter is typically slower due to normal seasonality in the mortgage business. By comparison, total loans funded was 6.7 billion for the first quarter of 2025. We have funded 4.6 billion in total loans during March, which is our highest volume month on record. I believe our first quarter results combined with the momentum we have gained set us up nicely to meet or exceed our 2026 growth plan. I’d like to now turn the call over to Kevin to provide more details on our business lines.

Kevin Comps (President)

Thanks Chuck Good morning everyone. Let’s start with our MPP business on slide 6. Compared to the prior quarter period, ending MPP balances increased by 435.7 million and average balances increased by 59.3 million, with most of the balance growth occurring towards the end of the quarter. As I’ve discussed on prior calls, these are net of any MPP balances participated up at March 31, 2026. We had participated $412.7 million to our partner banks, down slightly from the level at December 31, 2025. Let me break down our first quarter 2026 growth a bit further. First, we brought in 8 new clients which totaled 205 million in additional capacity. Second, we increased facility size for 11 existing clients which totaled 465 million in additional capacity. And third, the overall utilization of our existing clients remained strong during the quarter averaging 57%. Average MPP yields were 6.59% and fee adjusted yields were 6.82%. During the first quarter of 2026. Our average yield was down 39 basis points from the prior quarter, which is consistent with the decrease in Secured Overnight Financing Rate (SOFR) over that same time period. Turning now to retail banking on Slide 7, I’d like to highlight the results of the 3 main businesses within that segment. Starting with residential lending, which includes both our traditional retail and our consumer direct channels. We closed 693.7 million in mortgages during the first quarter, which is down from 762.0 million in the prior quarter. During the first quarter of 2026, saleable volume was 626.6 million. Of that, 39% was in the consumer direct channel and 61% was in the traditional retail channel. This compares to 671.3 million in saleable volume during the fourth quarter of 2025, with 35% of the volume in the consumer direct channel and 65% in the traditional retail channel. Refinance activity made up 59% of the total salable volume in the first quarter of 2026, up from 51% in the fourth quarter of 2025. In both periods we saw a drop in mortgage rates which spurred additional refinance activity. As we discussed previously, it only takes a 25 to 50 basis point decline in mortgage rates to drive additional refinance activity and we were able to take advantage of that temporary drop in both of the last two quarters. The additional refinance activity helped maintain strong volumes and revenues in what is typically a slower buying season. Mortgage rate lock Commitments increased by 12% over the prior quarter driven by an increase in refinance activity, with purchase activity down modestly from the prior quarter. We sold approximately 68% of the saleable mortgages service released in the first quarter of 2026, which is down from 79% in the prior quarter. We continue to look for opportunities to create additional efficiencies using technology and hire new talented lenders within the channel. During the first quarter we hired seven new mortgage professionals in two new markets to help us continue to grow the channel. In the middle of slide 7 we highlight our digital deposit banking channel where we feature our direct customer platform and competitive product suite. We ended the fourth quarter with 5.0 billion in total deposits, an increase from the prior quarter. The breakout of these deposits is detailed in the Appendix on slide 13. The majority of our deposit growth when compared to the prior quarter was driven by normal seasonality in our custodial deposit balances as well as higher levels of brokered network deposits which had more attractive rates than brokered CDs. On the right side of slide 7, we highlight our specialty mortgage servicing channel where we focus on servicing first lien home equity lines tied seamlessly to demand deposit sweep accounts, including what we commonly refer to as All-in-One (AIO) loans. Excluding the adjustment for the change in fair value of MSRs. We earned 2.2 million in loan servicing fees for Q1, which is flat from the prior quarter, including loans we outsourced to a subservicer we serviced 15,900 loans for others with a total UPB of 5.2 billion as of the first quarter of 2026. Turning lastly to slide 8, we saw a nice improvement in our overall asset quality metrics during the quarter. Consistent with prior quarters, we are not seeing any systemic credit quality or borrower issues in any of our portfolios. We had net charge offs …

Full story available on Benzinga.com

This post was originally published here

Old National (NASDAQ:ONB) held its first-quarter earnings conference call on Wednesday. Below is the complete transcript from the call.

This transcript is brought to you by Benzinga APIs. For real-time access to our entire catalog, please visit https://www.benzinga.com/apis/ for a consultation.

Access the full call at https://events.q4inc.com/attendee/600426932

Summary

Old National reported first quarter 2026 earnings that exceeded both internal expectations and analyst estimates, showing strong loan growth and controlled expenses.

The company focused on organic growth and capital returns, repurchasing shares and investing in talent, with record commercial pipelines and a strong talent pipeline.

Financial highlights include a GAAP EPS of $0.59 and adjusted EPS of $0.61, with an 8% annualized loan growth and a CET1 ratio over 11%.

The company maintained a peer-leading adjusted efficiency ratio of 46% and sees the potential for stable to improving net interest income and margin over 2026.

Old National remains confident in its full-year guidance, expecting high-end loan growth, fee income performance, and continued operating leverage with focused investments in AI for efficiency.

Full Transcript

OPERATOR

Ladies and Gentlemen, welcome to the Old National Bancorp First Quarter Earnings Conference Call. This call is being recorded and has been made accessible to the public in accordance with the SEC’s Regulation FD corresponding presentation slides can be found on the Investor relations page at oldnational.com and will be archived there for 12 months. Management would like to remind everyone that certain statements on today’s call may be forward looking in nature and are subject to certain risks or uncertainties and other factors that could cause actual results or outcomes to differ from those discussed. The Company refers you to its forward looking statement legend in the earnings release and presentation slides. The Company’s risk factors are fully disclosed and discussed within its SEC filings. In addition, certain slides containing non-GAAP measures which management believes provide more appropriate comparisons. These non-GAAP measures are intended to assist investors understanding of performance trends. Reconciliations for these numbers are contained within the appendix of the presentation. I’d now like to turn the call over to Old National’s chairman and CEO Jim Ryan for opening remarks.

Jim Ryan (Chairman and CEO)

Mr. Ryan, good morning. Earlier today Old National reported first quarter 2026 earnings that exceeded our internal expectations and analyst estimates. We carried strong momentum into the year and our performance in the first quarter reinforces our confidence in the full year plan. This quarter demonstrates disciplined execution as we have reliably delivered quarter after quarter. We delivered robust loan growth powered by continued strength in our core deposit franchise and disciplined funding management in a highly competitive market. We controlled expenses and generated strong fee income which helped offset net interest income pressure from typical seasonality and the recent sub debt issuance. Credit performance remains solid supported by healthy liquidity and capital levels. We also acted decisively on capital returns, repurchasing shares during the quarter, including reducing Otto Bremer’s trust position in Old National and we intend to deploy the remaining authorization over the course of the program. Bottom line, we are executing and we expect to keep building from here. Our priorities remain clear, Drive organic growth and return capital shareholders. Organic growth starts with talent and we are investing accordingly. We recently announced a strengthened commercial leadership team, promoting proven internal leaders and adding experienced bankers from several super regional institutions. Our team is focused every day on winning new clients and deepening existing relationships and building the next generation of bankers. Our commercial pipelines are at record levels and our talent pipeline is as strong as it has ever been. We are also accelerating efficiency and scalability through technology and AI investments, supporting positive operating leverage. As a result, we delivered a record adjusted efficiency ratio that remains in the top decile of our industry on the operating environment. The quarter brought higher for longer rate outlook and continued industry uncertainty. Old National is built for this backdrop. Our balance sheet remains neutral to the short end of the curve. Our granular low cost deposit base helps contain funding costs and our strong underwriting and straightforward community banking model positions us to perform through volatility. Importantly, nothing we are seeing changes. Our outlook loan pipelines are at record levels, momentum is building and we remain confident in our full year expectations to close. We’re off to a great start in 2026 and we’re executing against our commitments. Our focus remains on organic growth and disciplined capital return. This is not a time where we need acquisitions to achieve our objectives. I want to thank our team for delivering a strong quarter and for staying relentlessly focused on our clients. With that, I’ll turn the call over to John to walk through the quarter’s financial results in more detail.

John

Thanks. As Jim mentioned and as summarized on slide 4, we delivered another strong quarter and a solid start to the year reflecting continued momentum in organic growth, disciplined expense management, stable credit performance and increased capital return with robust capital levels. Beginning on slide 5, we reported GAAPfirst quarter earnings per share of $0.59 excluding $0.02 of merger related expenses and a non cash expense associated with the final distribution of a legacy First Midwest pension plan. Adjusted earnings per share were $0.61. Results were driven by better than expected loan growth and fee income along with well controlled expenses. Credit remained stable with less than 20 basis points of non pcd charge offs. Our profitability profile as measured by return on assets and on tangible common equity remained top decile versus our peers. Capital finished the quarter with CET1 over 11% and we grew tangible book value per share, 6% annualized and 11% year over year despite absorbing the majority of Bremer one time charges better than expected balance sheet growth and returning capital to shareholders in dividends and share repurchases. Specifically, during the first quarter we returned $151 million to shareholders. On slide 6 you can see our quarterly balance sheet trends underscoring strength in our liquidity and capital positions. Our loan to deposit ratio remained 89% and the CET1 ratio is comfortably north of 11%. Again, we compounded tangible book value per share year over year. Despite the impact of the Bremer close merger charges over the past year and the increased pace of capital return. We repurchased 3.9 million shares during the current quarter and 6.1 million shares over the last year with dividends and repurchases. Our combined Payout ratio was 64% of first quarter adjusted net income to Common as we’ve stated in the last several quarters, the best investment we can make today is ourselves. On slide 7 we show trends in earning assets. Total loans grew 8% annualized from the last quarter, led by 16.9%. Annualized growth in C&I production was diversified across our commercial book and the next few quarters should be supported by record high pipelines of five and a half billion dollars, up nearly 14% from year end levels. The investment portfolio was essentially unchanged from the prior quarter, with portfolio purchases offset by changes in fair values. We expect approximately $2.4 billion in cash flow over the next 12 months. Today, new money yields are running about 83 basis points above back book yields on securities. Strong loan growth, ongoing repricing across both loans and securities, and continued deposit pricing discipline support stable to improving net interest income and net interest margin over the course of 2026. I would point out that the first quarter was impacted by two fewer days, our sub debt issuance in late January and the spread dynamics inherent in this quarter’s loan production, which was skewed decidedly toward near investment grade floating rate C and I Moving to Slide 8 we show trends in deposits. Total deposits increased 4.2% annualized, primarily driven by commercial and retail growth and partially offset by seasonally lower public funds balances. As a reminder, first quarter is the low point for our public funds deposits, with those balances typically rebuilding over the second and third quarters. Non interest bearing deposits declined slightly to 23% of total deposits from 24% in the prior quarter, partly reflecting the seasonal factors I just mentioned. Despite remaining on offense with respect to client acquisition in a competitive deposit environment, we were able to decrease total deposit costs by 8 basis points and lowered interest bearing deposits and even better, 14 basis points. Linked Quarter we achieved an approximate 93% beta in our exception price book in conjunction with the Fed cuts in the fourth quarter. These actions resulted in a spot rate of 170 basis points on total deposits at March 31. Overall, our deposit strategy performed as we expected and we successfully achieved the down rate beta that we had targeted for this rate cycle. Slide 9 shows our quarterly income statement trends. As I mentioned earlier, adjusted earnings per share were $0.61 for the quarter and our profitability remains peer leading. Moving to slide 10, we present details of our net interest income and margin, both of which reflect my prior comments around day count, the nature of this quarter’s loan production and the impact of our sub debt issuance. You’ll note that we remain neutral to short term interest rates and we have a total of nearly $8 billion in fixed rate loans and securities expected to reprice over the next 12 months. Slide 11 shows trends in adjusted non interest income which was $122 million for the quarter exceeding our guidance. While most of our fee businesses performed in line with our expectations, we again saw better than expected performance within mortgage despite typical seasonal patterns in that business and within capital markets. In both cases this was driven by the mid quarter dip in rates continuing to slide. 12. Adjusted non interest expense was $354 million for the quarter. Run rate expenses remain well controlled and we generated positive operating leverage both quarter over quarter and year. Over year we reported a record low 46% adjusted efficiency ratio and we have now realized 100% of the $111 million of annual run rate cost saves that were anticipated with Bremer. On slide 13 we present our credit trends. Total net charge offs were 26 basis points or 19 basis points excluding charge offs on PCD loans. Criticized and classified loans increased $113 million this quarter as Bremer loans transitioned to Old National’s asset quality framework. Consistent with our due diligence expectations. Legacy Old national upgrades partly offset this increase. Non accrual loans to total loans decreased modestly the fourth consecutive quarter of improving performance trends due to active portfolio management. The first quarter allowance for credit losses to total loans including the reserve for unfunded commitments was 122 basis points, down 2 basis points from the prior quarter, primarily driven by charge offs on PCD loans and loan growth in lower risk portfolios. Consistent with the fourth quarter. Our qualitative reserves incorporate a 100% weighting on the Moody’s S2 scenario with additional qualitative factors to capture global economic uncertainty. Lastly, given the continued focus on loans to non depository financial institutions, we’d again like to emphasize that our exposure is de minimis. All said NDFIs are approximately 1% of total loans. All are performing and like other businesses that we bank, most are long standing client relationships. Slide 14 presents key credit metrics relative to peers. As discussed in past calls, we’ve historically experienced a lower conversion rate of non-performing loans to net charge-offs as compared to our peers driven by our approach to credit and client collection. That continues to be the case and we remain comfortable around the credit outlook. On slide 15 you can see our capital position at the end of the quarter. Regulatory ratios in tangible common equity were stable linked quarter as strong retained earnings were offset by the robust quarterly loan growth Share repurchases and merger related charges. Still, tangible book value per share was up 6% linked quarter annualized and 11% year over year. Our peer leading profitability profile continues to generate significant capital which opened the door for capital return late last year. As previously mentioned, we repurchased 3.9 million shares of common stock during the first quarter and have $383 million remaining under our program. Lastly, of note, while not yet finalized, we would clearly expect a capital benefit under the proposed capital rule changes. This would mainly come from reductions in RWA treatment within our mortgage book and changes to the treatment of unfunded commitments over one year. Obviously, these changes, if finalized, could present meaningful capital optionality. In any case, we feel confident in our plans to continue to execute on our buyback plan which runs through the end of February. Slide 16 includes our outlook for the full year 2026 which is unchanged from our prior guidance. We believe our current pipeline supports full year loan growth of 4 to 6% and based on the results of the first quarter we suspect we may trend to the higher end of this range. We anticipate continued success in the execution of our deposit strategy and expect to meet or exceed industry growth in 2026 generally in line with our asset growth. Our NII guidance remains unchanged and our balance sheet remains neutrally positioned to short term interest rates. Obviously, the exact path of NIM and NII in 2026 will depend on growth dynamics, the shape of the yield curve, the absolute level …

Full story available on Benzinga.com

This post was originally published here

Ethereum (CRYPTO: ETH) could hit $250,000 per token if it captures the $31 trillion monetary premium currently held by gold and Bitcoin (CRYPTO: BTC), according to a new report from Etherealize.

The $31 Trillion Math

Gold’s monetary premium sits at approximately $29.7 trillion. Bitcoin’s monetary premium is around $1.5 trillion. Together, they represent roughly $31.1 trillion held by people who want money outside government control.

ETH’s current market cap is approximately $280 billion—less than 1% of that combined premium. 

If Ethereum captured that premium distributed across roughly 121 million ETH in circulation, the implied price would be north of $250,000 per ETH. Today it trades around $2,300.

The Warren Buffett Problem

Warren Buffett identified gold’s fundamental limitation in his 2011 letter to Berkshire Hathaway shareholders: “If you own …

Full story available on Benzinga.com

This post was originally published here

On Wednesday, First BanCorp (NYSE:FBP) discussed first-quarter financial results during its earnings call. The full transcript is provided below.

This transcript is brought to you by Benzinga APIs. For real-time access to our entire catalog, please visit https://www.benzinga.com/apis/ for a consultation.

View the webcast at https://events.q4inc.com/attendee/331310542

Summary

First BanCorp reported net income of $89 million for Q1 2026, an increase of 21% year-over-year, with a return on average assets of 1.9%.

Total loans declined slightly to $13.1 billion due to seasonal factors and a decrease in consumer credit demand, while core deposits grew by 4.9% on a linked quarter basis.

Credit performance remained strong with low levels of non-performing assets and a 24% decline in early stage delinquencies from the prior quarter.

The company maintained a 16.9% CET1 ratio despite a 92% net payout through buybacks and dividends.

First BanCorp sustained its loan growth guidance of 3-5% and reported a 6% increase in total loan originations year-over-year.

The company is focusing on technology investments, including AI, to enhance service delivery and operational efficiency.

Net interest margin expanded by 7 basis points to 4.75%, exceeding original guidance, and non-interest income increased due to seasonal contingent commissions.

Operating expenses remained stable, with projected quarterly expenses for 2026 expected to be in the range of $128 to $130 million.

Management discussed ongoing economic stability in Puerto Rico, with continued commercial activity and a resilient labor market.

First BanCorp plans to focus on capital allocation to support organic growth, competitive dividends, and share repurchases.

Full Transcript

OPERATOR

Good morning and welcome to the first First BanCorp Q1 2026 financial results conference call. All participants are in a listen only mode. After the speaker’s remarks, we will conduct a question and answer session. To ask a question at this time, you will need to press STAR followed by the number one on your telephone keypad. As a reminder, this conference call is being recorded. I would now like to turn the call over to Hermon Rodriguez, corporate strategy and Investor Relations. Thank you. Please go ahead. Thank you.

Julianne

Julianne Good morning, everyone. Thank you for joining First BanCorp’s conference call and webcast to discuss the Company’s financial results for the first quarter of 2026. I’m here with Aurelio Leman, President and chief executive officer and Orlando Verges, chief financial officer. Before we begin today’s call, it is my responsibility to inform you that this call may involve certain forward looking statements such as projections of revenue, earnings and capital structure, as well as statements on the plans and objectives of the Company’s business. The Company’s actual results could differ materially from the forward looking statements made due to the important factors described in the Company’s latest SEC filings. The Company assumes no obligation to update any forward looking statements made during the call. If anyone does not already have a copy of the webcast presentation or press release, you can access them at our website at fbp investor.com at this time I’d like to turn the call over to our CEO Aurelio Aurelio Aleman.

Aurelio Aleman (President and Chief Executive Officer)

Thank you Hermon Good morning. Good morning everyone and thanks for joining our call today. We started 2026 with very strong momentum generating 89 million in net income or 57 cents per share. That is actually up 21% when compared to same quarter last year. Core operating trends remain also very strong during the quarter with pre-tax pre-provision income reaching all time high of 131 million, that is of 5% from a year ago. This performance resulted in a 1.9% return on average assets. This marks our 17th consecutive ROA above 1.5%, definitely demonstrating our commitment to sustain profitability. Moving to the balance sheet, total loans declined slightly to 13.1 billion. That is actually consistent to prior year seasonality and accounts for the expected softening in credit demand within the consumer lending segment that we mentioned before. That said still better than pre pandemic levels when we look at consumer demand. On the other hand, core deposit for the quarter were strong other than broker and public funds which we don’t call core were up by 4,9% 4.9% on a linked Quarter annual basis, reinforcing the strength of the relationship during franchise while allowing us to actively manage funding costs. Driving core client deposit growth is a key priority for us and we’re very encouraged by the execution of during the quarter in terms of new clients and accounts. Credit performance remained a key strength for the franchise during the quarter with charge off very stable, record low levels of non performing assets and very encouraging early stage delinquency trends which actually declined 24% from the prior quarter. And finally, our consistent approach to capital deployment resulted in a net payout of 92% during the quarter achieved through buybacks and dividends. Even after this action, we ended the quarter with a 16.9 CET1 ratio. Let’s turn to slide 5 to talk about the environment and highlights of the franchise. You know, we’re pleased to say that business activity and economic conditions across the market continue stable and progressing in line with our expectation. The labor market continues to show resilience, other economic indicators in the main market such as economic activity index continue to be stabilized and recent great delinquency indicates consumer stability. We are encouraged by what we see around in addition to the restructuring, sorry reconstruction activities, reshoring activity and expanded US military presence in the island. While there is a recovery efforts remain in place expanding on a consumer first quarter industry. Auto sales declined 19% when compared to the first quarter last year. Definitely evidence in the expected reduction in consumer credit demand for auto. That said, it is important to note that retail auto sales continue to be 6.5% above the pre pandemic 10 year average. So still better than the prior cycle. We’re definitely prepared to serve our customers in this environment. Very, very, you know many, many, many parts moving regarding you know, potential impact of oil cost which you are monitoring which could be, you know, rising energy costs and other potential impact on inflation which could impact consumer activity and commercial activity more broadly in the future. Hopefully that ends soon. And while the macroeconomic environment continues to be dynamic, we remain focused on managing what we can control in housing, the service delivery platform, technology investment to be more agile and efficient and focusing on providing the best quality of service that we could. When we look at business highlights, total loan originations were up by 6% when compared to prior year. Seasonally adjusted commercial loan pilots actually remain healthy. Actually if I compare pipeline today with same time prior year, we are actually in a better position. So we sustain our loan growth guidance of 3 to 5% that we initiated that we mentioned in the last call in terms of Omni channel strategy, active data users continue to grow year over year, data transaction volumes continue to grow, self service payment continue to increase, sustaining demonstrating sustained engagement of clients in the platforms. We are even spending time and effort on AI understanding what we can do to improve internal processes and also improve the way we service our clients. We continue to also do franchise investment in our brand channels to continue to optimize how we service our client. We believe that AI will definitely play a key role in the execution of this strategy, providing clients with faster, more personalized service offerings and enabling our colleagues to to spend more time in value added customer interaction rather than dealing with routine transactions and processes. We’re working very close to our key vendors to ensure that we adopt what’s coming in all this new venture overall capital allocation priority remain unchanged. Also. This includes supporting organic growth which is a priority in and paying a competitive common stock dividend and returning excess capital through share repurchase. As always, we thank you for your interest in first bank and your support and with that I’ll turn the call to Orlando and we’ll come back for questions later. Thank you.

Orlando Verges (Chief Financial Officer)

Good morning everyone. This quarter we earned 88.8 million 57 cents per share which compares to 87.1 million or 55 cents a share. Last quarter. Adjusted pre tax pre provision income reached an all time high of 131 million, which is almost 2% higher than last quarter and 5% higher than the first quarter of last year. The return on average assets for the quarter was 1.89%. That compares to 1.81% last quarter. So we had an improvement there. The provision for the quarter was lower. We had some macroeconomic indicators such as the unemployment rate and the commercial real estate (CRE) price index continue to show better trends and that leads to some of the reduction. Also we had reductions in delinquency as Aurelio mentioned, and some of the consumer portfolios. The size of some of the consumer portfolios was down. On the other hand, we had an increase in qualitative reserves to account for the current geopolitical uncertainty in the Middle East. Income tax expense for the quarter was 25 million, which is 5 million higher than prior quarter, mostly related to the higher pre tax income. But also at the end of last year in the fourth quarter we booked an adjustment to the effective tax rate for the final results for 2025. The estimated effective tax rate as of now it’s just slightly higher. It’s 21.9% compared to 21.6% we had in 2025. In terms of net interest income we had a reduction of 1.8 million in the quarter, the net interest income amounted to 221 million. That’s 2.7 million related to two less days in the quarter. But net interest income compared to same quarter last year is 4% higher. Interest income on loans is 6.5 million lower than last quarter which 3.8 million it’s due to the two less days in the quarter and 2.8 million relates to the market interest rate reductions that affected the the commercial portfolio pricing, specifically the floating rate components. Yields on the commercial portfolio decline 18 basis points. On the other hand, interesting common Investment securities increased 2.8 million mostly due to a 22 basis points improvement in yields as we have continued to reinvest cash flows from maturing securities into higher yielding instruments. On the expense side, overall funding cost was 3.5 million which is 1.3 million related. 1.3 million of that reduction relates to the two less days in the quarter and 1.2 million relate to rate reductions. The cost of interest rate checking and savings accounts came down 4 basis points for the quarter to 1.21% which is mostly driven by government deposit cost reductions. But also the cost of time deposits came down 5 basis points and the cost of broker deposits came down 7 basis points. The size of the broker deposit portfolio was also down in the quarter. Net interest margin expanded 7 basis points for the quarter to 475, which is slightly higher than our original guidance of 2 to 3 basis points per quarter. Even though the interest rate environment remains uncertain, particularly in terms of the timing and magnitude of future rate adjustments, our balance sheet continues to be well positioned for additional NIM expansion. In line with our original guidance. In terms of non interest income we reached 37.7 million which is 3.3 million higher than last quarter. Most of the change was related to a 3.6 million collected on seasonal contingent commissions that we usually get in the first quarter of each year. Operating expenses for the quarter were 1:27.1 million, very much in line only an increase of 200,000 from last quarter if we exclude the gains from OREO operation, expenses for the quarter were 128 million, which it’s about the same kind of adjustment of increase of 300,000 which compared to the 127.7 we had last quarter. Expenses were on the lower end of our guidance. Payroll expenses for this quarter were 2.1 million higher. That relates to a seasonal increase in payroll taxes and also we had an increase in share based compensation expense for stock grants that were issued during the quarter the portion of these grants that are attributable to retirement eligible employees is charged to Expense in the quarter. This increase in payroll expense was offset by a decrease in business promotion. Typically, business promotion efforts are lower during the first quarter and pick up on the second and fourth quarter of the year. The efficiency ratio for the quarter was 49.1%, which is slightly below the 49.3 we had in the fourth quarter. As we have mentioned before, based on our projected expense trends for ongoing technology projects and the pickup on business promotion efforts that happen later in the year, we rate the rate. Our quarterly expense base for 26 will be in that range of 128 to 130 million. As we had previously mentioned, this …

Full story available on Benzinga.com

This post was originally published here

EQT (NYSE:EQT) reported first-quarter financial results on Wednesday. The transcript from the company’s first-quarter earnings call has been provided below.

This content is powered by Benzinga APIs. For comprehensive financial data and transcripts, visit https://www.benzinga.com/apis/.

Access the full call at https://events.q4inc.com/attendee/694204138

Summary

EQT reported a record $1.8 billion in free cash flow for Q1 2026, matching the total free cash flow of 2022, despite lower gas prices.

The company’s strategic initiatives, including vertical integration and a low-cost operating model, have significantly enhanced earnings and allowed EQT to capture market volatility benefits.

EQT’s leverage is now below 1x net debt to EBITDA, and the company is on track to meet its long-term $5 billion net debt target by year-end.

Operationally, EQT outperformed peers during Winter Storm Fern, achieving production uptime two times higher than competitors, with Q1 production exceeding guidance.

EQT’s LNG contracts position the company for international growth, projecting a potential $6 billion free cash flow if the LNG portfolio was fully online today.

Management highlighted the strategic importance of U.S. natural gas amid global geopolitical tensions, positioning EQT as a reliable supplier.

The company plans to continue investing in high-return projects, grow its base dividend, and repurchase shares during market weaknesses.

EQT sees strong demand growth potential, particularly from data centers and power projects in Appalachia, which could lead to 8-10 BCF/day of additional demand.

EQT is strategically curtailing production to optimize pricing during low demand seasons, leveraging its integrated asset base.

Management remains optimistic about permitting reform to support necessary infrastructure development despite current regulatory challenges.

Full Transcript

Bella (Operator)

Hello and thank you for standing by. My name is Bella and I will be your conference operator today. At this time I would like to welcome everyone to EQT Q1 2026 Quarterly Results Conference call. All lines have been placed on mute to prevent any background noise. After the speaker’s remarks, there will be a question and answer session we request for today’s session that you please limit to one question only and one follow-up. If you would like to ask a question during this time, simply press star and the number one on your telephone keypad. To withdraw your question, press Star one again. I would now like to turn the conference over to Cameron Horowitz, Managing Director, Investor Relations and Strategy. You may begin.

Cameron Horowitz (Managing Director, Investor Relations and Strategy)

Good morning and thank you for joining our first quarter 2026 earnings results conference call. With me today are Toby Rice, President and Chief Executive Officer, and Jeremie Knopes, Chief Financial Officer. In a moment, Toby and Jeremy will present their prepared remarks with a question and answer session to follow. An updated investor presentation has been posted to the investor relations portion of our website and we will reference certain slides during today’s discussion. A replay of today’s call will be available on our website beginning this evening. I’d like to remind you that today’s call may contain forward looking statements. Actual results and future events could materially differ from these forward looking statements. Because of factors described in yesterday’s earnings release. In our investor presentation, the risk factors section of our most recent Form 10K and in subsequent filings we make with the SEC, we do not undertake any duty to update any forward looking statements. Today’s call also contains certain non GAAP financial measures. Please refer to our most recent earnings release and investor presentation for important disclosures regarding such measures, including reconciliations to the most comparable GAAP financial measures. With that, I’ll turn the call over to Toby. Thanks Cam and good morning everyone. Our historic first quarter results are tangible proof of the differentiated value of EQT’s platform. We generated more than $1.8 billion of free cash flow in the first quarter, another record high for EQT. To put this into perspective, in just 90 days we generated roughly as much free cash flow as we did during the entirety of 2022, a year when gas prices were over $6. This is a powerful illustration of how we’ve strategically transformed EQT over the past several years. Our vertical integration through the Equitrans acquisition and our low cost operating model have fundamentally enhanced the earnings power of this company. That transformation has enabled us to enter this high price environment largely unhedged capturing the full upside of market volatility and accelerating our deleveraging plans. With leverage now below 1 times net debt to EBITDA and our long term $5 billion net debt target within reach by year end, EQT has entered a new chapter one defined by financial strength, durable free cash flow generation and sustainable growth. Our operational performance remains the bedrock of our financial results. Despite the challenging weather conditions presented by Winter Storm Fern, our teams coordinated seamlessly to achieve production uptime that outperformed our peers by a factor of more than two times. Even with some minor volume impacts from the storm, production for the quarter came in above the high end of our guidance range. This is a testament to the strong underlying productivity of our asset base, the durability of our infrastructure, and the outstanding coordination across our upstream midstream and marketing teams to ensure our customers had access to reliable energy when they needed it most. Shifting to the macro environment, Recent geopolitical developments once again highlight the strategic importance of US Natural gas and energy independence. Recent events in the Middle east have triggered the second global energy shock of this decade. Supply disruptions across the region have pushed global natural gas prices sharply higher. In fact, European natural gas prices nearly doubled following the disruption of Qatari LNG supply and in the closure of the Strait of Hormuz. These developments underscore a clear reality Global energy markets remain highly vulnerable to geopolitical risk. While these challenges are significant, they also reinforce the critical role of American energy and position producers like equity to help meet the world’s growing need for reliable supply. And yet, despite this global volatility, US Natural gas prices have remained stable, continuing to provide affordable energy for American consumers. This divergence highlights one of the most important advantages of U.S. natural gas energy security and affordability. While global markets are experiencing sharp price increases, American citizens and businesses continue to benefit from low cost domestic supply thanks to the shale revolution. In fact, in energy equivalent terms, the price of US natural gas today is equal to $16 per barrel of oil. Even with record US LNG exports and data center driven domestic power demand growth, recent events also reinforce another key takeaway, energy reliability matters. Global buyers are increasingly prioritizing secure and dependable sources of supply, and the United States has emerged as the most reliable LNG supplier in the world. This reliability is becoming increasingly valuable to global customers and EQT is positioned to benefit from this dynamic. Our LNG contracts position us to be a supplier of choice internationally, providing secure supply to global buyers who increasingly value reliability and energy security while at the same time providing attractive international market exposure for our investors. In fact, if our LNG portfolio was fully online today with current PTF and JKM spreads to Henry Hub, our projected 2026 free cash flow would be approximately $6 billion. Positioning the company to materially enhance our free cash flow generation with only 15% of our volumes and is a powerful illustration of the value our LNG portfolio could unlock. As global markets continue to prioritize dependable supply, we believe EQT is well positioned to capture demand growth, improve our price realizations and further enhance the durability of our free cash flow generation.

Toby Rice (President and Chief Executive Officer)

This geopolitical landscape reinforces what we believe for a long time low cost, reliable US Natural gas is essential for both American consumers and global energy security and EQT is uniquely positioned at the center of that opportunity. I’ll now turn the call over to Jeremy.

Jeremy Knope (Chief Financial Officer)

Thanks Toby. As Toby mentioned, the company delivered a record first quarter without performance across the board. We delivered sales volumes above the high end of guidance into peak winter pricing while our cash operating expenses and capital costs came in below the low end of guidance due to improved efficiencies. All told, we generated more than $1.8 billion of free cash flow before the effects of $475 million of working capital inflows. As promised, we allocated post dividend free cash flow to strengthening our balance sheet and retired more than $1.7 billion of senior notes during the quarter. We exited the quarter with net debt of just under $5.7 billion. This accelerated deleveraging has already been recognized by the credit rating agencies with Fitch upgrading EQT to BBB during the quarter. This milestone further strengthens our brand while mitigating financial risk as we expand our gas sales portfolio. This rapid deleveraging also enhances our capital allocation flexibility. We are well positioned to continue investing in high return growth projects, build on our track record of base dividend growth and accumulate cash to aggressively repurchase our shares during times of market weakness. Turning to Hedging the benefits of our opportunistic strategy were on display as we captured nearly 100% of the surge in natural gas prices in the first quarter due to the attractive ceilings on the collars we put in place during periods of price strength. In December, as prices have moderated into the spring, we are realizing the benefits with our balance of your hedge book in the money by $180 million. Turning to fundamentals, the global market has tightened meaningfully due to the conflict in the Middle east blasting damage to key LNG infrastructure has reduced near term supply and delayed the timing of Qatar’s large scale expansions. At the same time, Europe is exiting winter with natural gas storage levels at the lowest level since 2022. US LNG exports should be a primary beneficiary in this environment. In the near term, we expect LNG operators will defer maintenance to capture favorable margins, boosting export demand. In the medium term, the risk of an LNG glut in volumes backing up into the US market is effectively gone. This environment also serves as a good case study for our thesis of the asymmetric upside exposure to global natural gas prices that EQT will have through our LNG portfolio. While our LNG contracts are forecasted to generate $500 million in annual free cash flow uplift when they begin in 2030 at the current strip, a repeat of the 2026 level volatility could drive that figure to $2.5 billion. This underscores the significant upside optionality for producers that can access the global markets. Shifting to the US Momentum in natural gas fired power growth is accelerating beyond prior expectations. Recent announcements in our own discussions suggest upside to our base case power demand growth forecast of 6bcf per day with our initial bull case of 10bcf per day looking more like the new base case. This view is informed by the swelling opportunity set in Appalachia with a notable pickup in large scale power midstream and data center projects where EQT is positioned as the preferred partner. This backdrop is increasing our confidence in the view that demand pull projects will further improve Appalachian fundamentals through the end of the decade and create substantial high return upstream and midstream growth optionality for eqt. Turning to the second quarter guidance after surging production volumes into peak order pricing in Q1, we began tactically curtailing volumes this month to optimize price realizations during shoulder season and have embedded 10 to 15 bcf of curtailments into our second quarter production guidance. Our strategic curtailments act as a form of storage keeping gas in the ground during seasonally low periods of demand and surging volumes above baseline when demand rebounds. This approach allows us to leverage the flexibility of our integrated asset base to maximize value in both peak and trough demand seasons. From a CapEx standpoint, the second quarter represents our peak capital investment period of the year. Driven by the timing of growth investments, we expect to see meaningful declines in capital spending into the third and fourth quarters which should further support free cash flow generation in the back half of the year. In closing, this quarter is a tangible demonstration of the value creation possible through EQT’s platform. With an integrated operating model, a peer leading cost structure and a fortress balance sheet, the transformation of EQT is now complete. Our teams are now busy positioning the business to capture robust and sustainable growth opportunities which should lock in the next leg of differentiated value creation for shareholders. And with that, we will now open the line for questions.

Operator

At this time I would like to remind everyone, in order to ask a question, press star, then the number one on your telephone keypad. We do request for today’s session that you please limit to one question only and one follow up. We will pause for just a moment to compile the Q and A roster. Your first question comes from the line of Doug Leggate with Wolf Research. Please go ahead.

Doug Leggate

Good morning guys. Thanks for having me on. I got one macro and one EQT transformation, question just to pick up on Jeremy’s comments there. Toby, I’m always interested in your macro view. Sadly, it seems that with LNG full, the US is back to an incremental cost of supply market, also known as the Permian. The punchline is it seems that gas really hasn’t benefited from all the resets that we’ve seen in terms of domestic demand. So my question is what can you do to improve your realizations and more specifically, can you accelerate your access to LNG on international markets, given your current plan is post 2030? That’s my first one. My second one is specifically for Jeremy. The balance sheet we’ve talked about often, Jeremy, you’ve talked about. The transformation is complete. So when given your inventory depth, why are buybacks the right answer for opportunistic cash flow versus offering equity as a competitive dividend stock? Yeah, Doug, appreciate the questions.

Toby Rice (President and Chief Executive Officer)

I’ll tackle the first set. So when it comes to getting better realized pricing, I think there’s a couple of things we think about, you know,, one, you know,, attracting demand to our backyard I think is going to be really important. That will have the impact of strengthening basis which will benefit our business. We’re really excited about the progress that we’re seeing. You know, I think you look at the slide we put out on data center demand, there’s a lot of activity happening in our backyard as it relates to lng. You know, I think this quarter and what’s happening right now around the world just really shows why the strategy that we took to position the company to get exposure to lng, why it matters because we see the same dynamic that you’re seeing. We see prices around the world rising and we’re not seeing that benefit in The US the only way to solve that is to get exposure to international pricing. So you know,, for us we’re, we’re proud of the decisions we’ve made. We’re excited to start trading with LNG in the 2030 timeframe. You know, as far as accelerating that today we were actually talking about this, that this morning, but I think getting more exposure to that sooner, you’re already taking into account the spreads and you’re paying for that. So it’s not much of an opportunity in the short term. But we’re excited about how we position the company in the long term.

Jeremy Knope (Chief Financial Officer)

Doug, on the second part of your question, look, our base dividend has been and will continue to be a key part of our capital allocation strategy. That is something we intend to grow annually for the foreseeable future. But you know, when we step back and think about what creates the most value in the long term for shareholders and what compounds capital, it’s not necessarily the dividend. You know, we see the most value upside certainly on an after tax basis for shareholders being more so in buybacks, but also bringing back top line growth to the business. And in a capital intensive business we need capital to be able to invest and do that. And so what you’re seeing us do this …

Full story available on Benzinga.com

This post was originally published here

Polymarket CEO Shayne Coplan is regularly late to private meetings, attended at least one of them barefoot and is “easily distracted,” texting and taking phone calls mid-conversation, according to a Bloomberg report.

The quirks would read as startup color if the company weren’t bleeding its lead to rival Kalshi eight days before its biggest backer reports earnings.

Intercontinental Exchange (NYSE:ICE), the parent of the NYSE, has committed up to $2 billion to Polymarket at escalating valuations.

It reports Q1 earnings on April 30, with the consensus analyst target at roughly $194 on a Strong Buy rating. Raymond James raised its target to $222 earlier this month.

Kalshi Pulls Ahead

The two companies’ valuations moved in lockstep for most of the past year. That changed last month, when Kalshi raised $1 billion at a $22 billion valuation …

Full story available on Benzinga.com

This post was originally published here

On Wednesday, AT&T (NYSE:T) discussed first-quarter financial results during its earnings call. The full transcript is provided below.

This content is powered by Benzinga APIs. For comprehensive financial data and transcripts, visit https://www.benzinga.com/apis/.

The full earnings call is available at https://event.choruscall.com/mediaframe/webcast.html?webcastid=IWYJstMn

Summary

AT&T reported strong financial performance in Q1 2026, with revenues up 2.9% year-over-year, driven by gains in fiber and fixed wireless Internet customers.

The company added 584,000 total fiber and fixed wireless advanced Internet customer net additions, marking the sixth consecutive quarter with over half a million net adds.

AT&T aims to grow its fiber reach to over 60 million locations by the end of the decade and is focusing on investment-led strategies in fiber and 5G.

The acquisition of Lumen assets added 1.1 million fiber customers and over 4 million fiber locations, with positive early integration indicators.

The company’s new OneConnect plan is part of a strategic shift to focus more on service rather than device subsidies, aiming to enhance customer loyalty.

AT&T continues to work on copper network retirement, with 30% of its wire centers on a shutdown schedule, aiming for significant cost savings and improved infrastructure.

The company maintains its full-year guidance for consolidated service revenue growth in the low single-digit range and adjusted EBITDA growth of 3-4%.

AT&T expects free cash flow of $18 billion plus for the full year and plans to return $45 billion plus to shareholders through 2028.

Full Transcript

OPERATOR

Good morning and welcome to AT&T’s first quarter 2026 earnings call. At this time all participants are in a listen only mode. Should you need assistance during the call, please press Star then zero and an operator will assist you offline. Following the presentation, the call will be open for questions. If you would like to ask a question, please press Star then one and you will be placed in the question queue. If you are in the question queue and would like to withdraw your question, you can do so by pressing Star then two. As a reminder, this conference is being recorded. I would now like to turn the conference call over to our host, Brett Feldman, Treasurer and Head of Investor Relations. Please go ahead.

Brett Feldman (Treasurer and Head of Investor Relations)

Thank you and good morning. Welcome to our first quarter call. I’m Brett Feldman, Treasurer and Head of Investor Relations for AT&T. Joining me on the call today are John Stanke, our Chairman and CEO, and Pascal Desroche, our CFO. Before we begin, I need to call your attention to our Safe harbor statement. It says that some of our comments today may be forward looking. As such, they are subject to risks and uncertainties described in AT&T’s SEC filings. Results may differ materially. Additional information as well as our earnings materials are available on the Investor Relations website. I also want to note that the quiet period for FCC Spectrum Auction 113 is in effect. During this period. Applicants are required to avoid discussions of bids, bidding strategy and post auction market structure with other auction applicants. And finally, I want to note that the discussion of our operating results and outlook during this call will be on a continuing operations basis. With that, I’ll turn things over to John Stanke.

John Stanke (Chairman and CEO)

Thanks Brett and good morning everyone. I appreciate you joining us today. We executed well in the first quarter, delivering results that were consistent with the outlook we provided while implementing several key strategic initiatives. Last quarter we told you that we had positioned AT&T for improved growth with our investment led strategy in fiber and 5G and there’s clear evidence of this in our first quarter results. We reported 584,000 total fiber and fixed wireless advanced Internet customer Net additions. This is our best ever first quarter result in the sixth consecutive quarter with over half a million consumer and business net adds. We also continue to see accelerated pace of our customers purchasing their wireless and Internet connectivity. Together, 42% of our advanced home Internet customers also choose AT&T wireless. But when excluding the transaction with Lumen, this convergence rate approached 45% on an organic basis during the first quarter. This is more than a 3 percentage point increase compared to last year which is our fastest ever year over year Convergence Growth Rate these results are encouraging but not surprising. It is exactly what customers have told us they want. They’re increasingly choosing what we believe to be the best combined fixed and mobile Internet service in the market. When our customers choose AT&T for their wireless and Internet connectivity, they consistently express stronger brand love, higher Net promoter scores and ultimately stay with us longer. During our analyst and Investor Day in 2024, we shared a few data points highlighting the relative improvements that we see among our converged customers in key operating metrics such as customer lifetime values and churn. These benefits remain robust and we expect that as a greater portion of our customers purchase their wireless and Internet connectivity from AT&T, we’ll demonstrate improved trends in CHURN and additional improvement in account growth. During the first quarter we made further progress AT positioning AT&T as the preferred provider for connecting consumers and businesses to the Internet. We closed our transaction with Lumen ahead of schedule, adding 1.1 million fiber customers and over 4 million fiber locations. We’re pleased with the progress we’re making as we integrate these assets in several major metro areas and position the business for faster growth. Early indicators are positive. We now offer fiber services throughout our distribution channels in these areas, which has driven sales activity well above pre transaction trends. We’re executing the steps to scale, engineering, construction and service delivery in the acquired geographies and expect that as we move into the back half of the year we’ll achieve steady improvement in fiber and wireless customer growth in these areas. When we focus on customers needs and invest in the experience and products they want, we find success and in the first quarter we gave customers more reasons to choose AT&T. We expanded the AT&T guarantee to cover Internet error and launched a new flagship app to deliver a simple digital first experience to customers. We also launched AT&T1 Connect, which enables customers to easily connect all their eligible devices at home and on the go and eliminates the need to buy Internet access twice. We refreshed our unlimited you’d way plans to deliver more value. All these moves are based on a consistent set of principles that drive our approach to serving customers the way they want to be served with offers that deliver on simplicity, value and choice and converged connectivity. After years of industry leading investments in our fiber and wireless network, we believe that we have now established a structural advantage that others will not catch. We reach more than 90 million customer locations across the country with our advanced Internet services over either fiber or 5G. We believe this provides us with more scalable reach and converged connectivity than any of our peers, including a meaningful scale and performance advantage in fiber. This is an advantage we’re growing as we ramp our deployment at a faster pace than anyone else. Today we reach over 37 million customer locations with fiber and we’re on Track to reach 60 million plus locations by the end of the decade. As I discussed last quarter, when we complete our work at a fiber location, we believe we’re able to offer that customer access to the Internet on a lower marginal cost structure than any competitor with superior performance and an industry leading experience on America’s best and fastest home internet. This positions AT&T to compete on performance and value by putting our service at the center of our converged offers and shifting the focus away from expensive device subsidies. You saw us lean into this advantage with the launch of AT&T1 Connect, the industry’s first ever single subscription service for fiber and wireless with a flat, flat monthly price. This is how you should expect us to go to market as we accelerate the expansion of our fiber availability with offers and marketing strategies that yield attractive returns by driving deeper fiber penetration and growth in converged customer relationships. Running these plays has not only strengthened our performance in the consumer market, but they’ve begun to demonstrate that the same strategy can strengthen our business enterprise operations. During the first quarter, Advanced connectivity business service revenues stabilized on a year over year basis for the first time ever. This reflects improved growth in fiber and 5G that is now offsetting declines in transitional services such as vpn. As we drive better sales execution across an expanding footprint of business locations that we can reach with fiber and fix wireless, we’re operating from a position of strength as we lean into the strategic foundation we’ve built. Our investments have positioned us to accelerate and scale the execution of our strategy in 2026 and through the course of the year. You can expect to see the momentum in our operating trends build as we continue our journey forward. Our strategies and capital allocation will remain focused on meeting the advanced connectivity needs of consum, consumers, businesses, the public sector and first responders as they adopt and rely on AI enabled tools and applications. We expect AI to fundamentally transform network requirements beyond download speeds to the ability to support symmetrical capacity, ultra low latency and session control across multiple access technologies under sustained load. And that’s how we’re architecting our converged network. We’ve committed to greater investment than any of our peers in the US connectivity infrastructure and by the end of this decade we expect to operate the most advanced and open communications network in the US built on a foundation of dense Metro fiber and deep nationwide spectrum. With the opportunity to reach more end users in our competition, coupled with our historically scaled Metro and long haul core, AT&T is well positioned to lead our industry in AI ready connectivity. Investment in high performing networking is a critical component of a competitive American AI ecosystem. We continue to appreciate the leadership of FCC Chairman Carr and the Commission’s continued efforts to modernize America’s networks. What we see transpiring on the federal policy front are the absolute right moves for the US to sustain leadership in communications infrastructure at this seminal moment in the birth of the AI economy. I reflect on this moment within the context of @&t’s milestone celebration of the 150th anniversary of the first phone call. For a century and a half we’ve adjusted to shifts in markets, technology and the evolution of public policy. It’s a story of many chapters over 150 years shared by proud and dedicated AT&T employees and retirees consistently rising to our long standing call of the spirit of service. While all the chapters are important, some turn out to be more consequential than others and I believe we’re entering one of those chapters that will be exactly that. I couldn’t be more optimistic given how this company has positioned itself as we enter this defining moment that our best days are ahead of us. With that, I’ll turn it over to Pascal.

Pascal Desroche (Chief Financial Officer)

Thank you John and good morning everyone. At a consolidated level, total revenues were up 2.9% year over year in the first quarter and service revenues were up 1.4%. Our growth is increasingly driven by gains in fiber and fixed wireless Internet customers as well as our success at growing customer accounts that choose AT&T for both Internet and wireless connectivity. We continue to expect we will grow consolidated service revenues and in the low single digit range for the full year, driven by growth in wireless service, fiber and fixed wireless revenues, partially offset by declines in transitional and legacy revenues. Adjusted EBITDA was up 2.3% year over year in the first quarter and adjusted EBITDA margin decreased 30 basis points to 37.4%. As a reminder, our first quarter 2025 results included a benefit to adjust EBITDA of approximately 100 million related to the resolution of vendor settlements. During the first quarter, we made good progress executing against our ongoing transformation initiatives as we work towards achieving our target of 4 billion in annual cost savings by the end of 2028. These include force optimization and vendor rationalization, efficiency gains from further AI enablement, accelerated digitalization efforts, and reductions to our legacy operations and support costs. We expect improved growth in adjusted EBITDA in the second quarter as comparisons normalize, service revenue growth improves and as we implement further cost actions and we continue to expect consolidated adjusted EBITDA growth in the 3 to 4% range for the full year. Free cash flow was $2.5 billion, which is at the high end of the 2 to $2.5 billion outlook we provided in January. Free cash flow declined by roughly $600 million compared to last year, which was driven primarily by higher capital investment of 5.1 billion. As we accelerate the pace of our fiber deployment for the second quarter, we expect free cash flow in the range of4.4 billion to 4.5 billion and we continue to expect $18 billion plus of free cash flows for the full year. Adjusted EPS of $0.57 in the first quarter was up nearly 12% and we continue to expect full year adjusted EPS to be in the $2.25 to $2.35 range. Under our new segment reporting, over 90% of our consolidated revenue and nearly all of our adjusted EBITDA is generated by our advanced connectiv. We believe this new reporting format improves transparency into the growth we are achieving from our investments in fiber and 5G as well as our progress at powering down our legacy copper network. Focusing first on advanced connectivity Service revenues were up 3.6% compared to a year ago. Wireless service revenues grew 1.7% year over year, which is consistent with our guidance that growth in the first quarter would be below the run rate we expect for the full year. Our wireless service revenue growth was primarily driven by growth in our customer base, including 294,000 postpaid phone net adds in the first quarter. Postpaid phone ARPU was flat versus a year ago. This is consistent with the outlook we provided for relatively stable ARPU as we gained customers in underpenetrated categories such as the value segment and grow our base of converged accounts that receive discounts but typically stay with us longer. We expect second quarter year over year wireless service revenue growth to improve from growth reported in the first quarter and maintain our full year outlook for growth in the 2% to 3% range. This is driven by our outlook for customer gains from our new unlimited and converged subscription plans and our expanding opportunity to sell wireless and home Internet services together. It also reflects our recent pricing actions that take effect during the second quarter. Advanced home Internet service revenues grew 27.3% year over year. This includes two months of revenues from fiber customers in geographies we acquired from lumen, which added about 650 basis points to our reported growth rate in the quarter. Similar to wireless, our organic growth in advanced home Internet service revenue was primarily driven by growth in our customer base. Advanced Home Internet Net adds were 512,000, which does not include the 1.1 million customers we acquired from Blumen in early February. This was our best ever first quarter and included 273,000 Fibernet ads and 239,000 Internet Air Net ads. We continue to expect that our fiber reach will grow by about8.8 million locations in 2026, including over 4 million locations we acquired from Lumen. As we ramp our fiber reach, we expect to see improved trends in our fibernet ads over the course of the year while still considering typical seasonality. We are also seeing strong growth in our business fiber and Advanced connectivity service revenues which include business fixed, wireless and value added services. In the quarter These revenues grew 7.2% year over year, which is consistent with the trend last quarter and improved from mid single digit growth a year ago. As John noted, total Advanced connectivity business service revenues were essentially flat year over year for the first time ever. Based on our improved sales, execution and expanding fiber reach, we expect total business service revenues within advanced connectivity segment to remain stable in the near term and continue to grow at a low single digit CAGR. Through 2028, advanced connectivity EBITDA grew 5.6% year over year and we improved EBITDA margin by 30 basis points despite a few notable headwinds. These include high single digit growth in low margin equipment revenues as well as the inclusion of revenues in geographies acquired from Lumen which which did not make a material contribution to EBITDA in the quarter. In addition, about 40% of the adjusted EBITDA benefit from the vendor settlements we called out in the first quarter of 2025 was incurred in the Advanced connectivity segment, so the improvement in Advanced connectivity EBITDA margin was driven by service revenue growth as well as the durable benefit of cost actions that I discussed earlier. Our outlook continues to anticipate an immaterial EBITDA contribution this year from the operating regions acquired from Lumen. This reflects increased spending within these geographies to stand up a business that is positioned for faster growth in fiber and wireless customers as fiber deployment accelerates and as we leverage our existing distribution in these regions. We’re really pleased with how the business is positioned coming out of the first quarter and continue to expect advanced connectivity service revenues to grow 5% plus this year with EBITDA growth of 6% plus. Legacy service revenues declined about 25% year over year, which is consistent with our outlook for 20% plus decline in 2026. We stopped taking new orders for legacy services last year in most of our wireline footprint, and we now have approval to discontinue legacy services in more than 30% of our wire centers. We’re actively working with customers in these areas and helping them upgrade to more advanced services like Internet, air and phone advanced. There is a lag between when customers migrate to more advanced services and when we are able …

Full story available on Benzinga.com

This post was originally published here

Key Takeaways:

  • The recent contraction in China’s overheated new energy vehicle market points to an unavoidable wave of industry consolidation and brand alliances
  • A fast-growing online dating company’s upcoming Hong Kong IPO relies on thousands of human facilitators, bucking the global trend of AI-driven matchmaking

image credit: Bamboo Works

We’re currently witnessing two fascinating shifts in China’s corporate landscape — one involving an overdue pause in a booming tech-driven sector, and the other a surprising rejection of modern technology in favor of traditional methods. On one hand, the country’s skyrocketing new energy vehicle (NEV) market has suddenly tapped the brakes, forcing a hard look at a needed industry consolidation. On the other hand, a rising star in the online dating world is actively bucking the global AI trend, opting instead for real-life human matchmakers.

We’ll start with the NEV sector, which has been all the rage among Chinese consumers but has hit a sudden speed bump this year. According to the China Passenger Car Association, NEV sales plunged 21% in March. That followed an even weaker start to the year, resulting in a 24% drop in the first quarter. While NEVs still accounted for nearly half of all vehicle sales during the quarter — as traditional internal combustion engine cars also fell sharply — the sudden spin into reverse is impossible to ignore.

We believe this pullback isn’t a massive shock. By the end of 2025, at least 50% of all new sales were NEVs. Overall adoption and sales growth have been extraordinary, and it shouldn’t be surprising that the …

Full story available on Benzinga.com

This post was originally published here

U.S. stocks traded higher this morning, with the Dow Jones index gaining more than 400 points on Wednesday.

Following the market opening Wednesday, the Dow traded up 0.87% to 49,575.38 while the NASDAQ rose 0.70% to 24,430.83. The S&P 500 also rose, gaining, 0.69% to 7,112.74.

Leading and Lagging Sectors

Utilities shares jumped by 1.4% on Wednesday.

In trading on Wednesday, financial stocks rose by just 0.1%.

Top Headline

Boeing Co (NYSE:BA) reported better-than-expected results for the first quarter on Wednesday.

The company posted quarterly losses of 20 cents per share which beat the analyst consensus estimate of losses of 84 cents per share. The company reported quarterly sales of $22.217 billion which beat the analyst consensus estimate of $21.779 billion.

Equities Trading UP
           

  • Axe Compute Inc (NASDAQ:AGPU) shares shot up 103% to $9.93 …

Full story available on Benzinga.com

This post was originally published here

On Wednesday, Taylor Morrison Home (NYSE:TMHC) discussed first-quarter financial results during its earnings call. The full transcript is provided below.

Benzinga APIs provide real-time access to earnings call transcripts and financial data. Visit https://www.benzinga.com/apis/ to learn more.

Access the full call at https://events.q4inc.com/attendee/328504597

Summary

Taylor Morrison Home reported strong first quarter results with home closings revenue of $1.3 billion, driven by 2,268 homes delivered at an average price of $578,000 and an adjusted gross margin of 20.6%.

The company invested $503 million in land and development and $150 million in share repurchases, ending the quarter with $1.6 billion in liquidity.

Strategic initiatives included increasing the share of to-be-built orders to 38%, opening 125 new communities in 2026, and enhancing technology and AI applications to improve efficiency and customer satisfaction.

Taylor Morrison Home plans to focus on core, well-located communities, with an emphasis on the Esplanade resort lifestyle brand, expecting it to be a key growth driver.

Management reaffirmed the full-year 2026 guidance, expecting approximately 11,000 home closings, and highlighted a gradual margin improvement in the second half of the year, contingent on market conditions.

Full Transcript

OPERATOR

We will conduct a question and answer session and instructions will be given at that time. As a reminder, this conference call is being recorded. I would now like to introduce Mackenzie Aron, Vice President of Investor Relations. Thank you and good morning everyone.

Mackenzie Aron (Vice President of Investor Relations)

Before we begin, let me remind you that this call, including the question and answer session, will include forward-looking statements. These statements are subject to the Safe Harbor Statement for forward-looking information that you can review in our earnings release on the Investor Relations portion of our website at taylormorrison.com these statements are subject to risks and uncertainties that could cause actual results to differ materially from our expectations and projections. These risks and uncertainties include, but are not limited to, those factors identified in the release and in our filings with the SEC and we do not undertake any obligations to update our forward-looking statements. In addition, we will refer to certain non-GAAP financial measures on the call which are reconciled to GAAP figures in the release where applicable. Now I will turn the call over to our Chairman and Chief Executive Officer, Cheryl Palmer.

Cheryl Palmer (Chairman and Chief Executive Officer)

Thank you Mackenzie and good morning everyone. Joining me is Kurt Van Hechte, our Chief Financial Officer, and Eric Huser, our Chief Corporate Operations Officer. I am pleased to share the results of our first quarter performance and look forward to providing an update on the progress we are making towards our strategic priorities for the remainder of the year. Our first quarter results reflected the effectiveness of our diversified strategy, the quality of our core locations and the disciplined execution of our teams. We delivered 2,268 homes at an average price of $578,000, generating home closings revenue of approximately 1.3 billion at an adjusted home closings gross margin of 20.6%. This drove adjusted earnings per diluted share of $1.12 and 11% year over year growth in our book per share to $64. On the capital front, we invested $503 million in land and development and 150 million in share repurchases and ended the quarter with $1.6 billion in liquidity. As I shared on our last earnings call in February, early signs heading into the spring selling season were positive and the quarter played out largely as we expected, with sales activity building through the quarter and March representing our strongest month. That momentum is consistent with normal seasonal patterns, albeit with slightly less acceleration than we have seen historically, reflecting continued consumer cautiousness. April started off somewhat slower as typical, coinciding with the holiday weekend, but momentum then picked back up and we’re looking forward to a strong end to the month and even with all the headline noise. Most importantly, as we prioritize the balance between price and pace, we achieved our first quarter sales with a significant increase in the share of to be built orders to 38% from 28% in the fourth quarter. As a result, we began to rebuild our backlog which increased 23% from year end to 3465 homes. As we anticipated. This reacceleration in demand for to be built homes suggests that historic buyer preferences are reemerging as excess spec inventory is cleared across the industry and our new community openings support compelling value propositions for our shoppers to personalize their new home. One way in which we are helping drive this shift is through Design Center Open Houses which enjoyed record attendance in the first quarter at over 140 events across the country and drove to be build sales activity with a strong average conversion rate of 23%. We are further supporting this shift with mortgage incentive programs that provide confidence to our build to order customers and enhance their buying power, generally at less cost than incentives required for spec sales. In addition to this favorable mix shift, we also realized more than 100 basis point sequential reduction in incentives on new orders. And lastly, we made significant progress in selling through our finished inventory which declined 30% from year end to 863 homes as we reached targeted spec levels in most of our communities. We have positioned 2026 to be a year focused on setting the stage for re acceleration of growth in 2027 and beyond. This includes a plan to open more than 125 new communities this year, roughly 30% more than we opened in 2025, including about 40 that already opened in the first quarter. Supported by an enhanced community opening framework that is helping our teams execute these openings successfully. Another 40 so communities are scheduled to open this quarter during the remainder of the selling season. These openings support our expectation that we will end the year with between 365 to 370 communities, which would be at 8% at the midpoint compared to 341 communities at the end of 2025. These communities will generally begin contributing closings later in the second half and into 2027. I’m particularly excited that over 20 of these new openings are in Esplanade communities communities. This includes the anticipated grand opening of our first Esplanade communities in Nevada, providing unmatched views of the Las Vegas skyline. This community is already enjoying significant interest with a 1400 plus lead list and is expected to command record lot and option premiums with Esplanade communities consistently generating superior home prices mid to high 20% gross margins and strong demand resiliency. The growth in this unique segment of our portfolio is expected to be an important driver of our future performance. Since we last spoke, the market has been faced with another round of geopolitical turmoil, intensified macro uncertainty and a shift higher in mortgage rates. As we would expect, consumer confidence has been impacted by these developments, exasperating affordability constraints and AI related employment concerns. However, we believe the underlying desire for the homes and communities we build remains strong even as the broader macro environment has given consumers reason to be more deliberate and in their decision making. On the policy front, we continue to have positive dialogue with the administration regarding how we and the industry can contribute to enhanced affordability and housing accessibility. While any solutions are likely to be incremental, we are encouraged by the ongoing focus on this issue and are pleased with the progress we are making in advancing constructive proposals. Eric will touch on read throughs to our Yardley business in just a moment. Before I turn the call over to him, I want to touch on the progress we are making in technology Our online reservation system continues to be a standout example. In the first quarter we recorded over 1000 reservations with a 58% conversion rate. Reservation buyers continue to transact at a higher average selling price with stronger option attachment than our non reservation sales. Encouragingly, we achieved the lowest co broke rate we have seen in years reflecting the power of our reservation platform. On the AI front, we now have more than a dozen AI powered applications in production across finance, sales, purchasing and customer experience and adoption has more than doubled year over year with over 2.4 million internal AI interactions recorded in the first quarter alone compared to approximately 3 million for all of last year. On the customer facing side, our AI powered contact center is delivering real time agent coaching and dynamic scripting on every customer call with automated quality management applied consistently across all interactions, driving improved customer satisfaction and sales outcomes. These investments are translating directly into results with an increase to more than 11,000 online sales appointments generated in the first quarter. We are achieving all of this through technology and automation, not incremental spend, with more than half of these capabilities built in house by our own teams. As a result, our overall technology costs are declining even as these capabilities continue to scale. There are many more initiatives advancing through our Project Management office that I look forward to sharing as they go live in the months ahead. In closing, our ability to reaffirm Our full year 2026 guidance in the face of a more challenging macro environment speaks to the underlying strength of our business and the effectiveness of our diversified strategy. We are concentrating our resources where we have the greatest competitive advantage, managing costs and capital with discipline and positioning Taylor Morrison to establish an even stronger and more differentiated portfolio. I believe the actions we are taking today will separate us in the years ahead as we look to continue creating value for our customers, our communities and our shareholders. With that, let me turn the call to Eric.

Eric Huser (Chief Corporate Operations Officer)

Thanks Cheryl and good morning everyone. At quarter end we owned or controlled 75,626 home building lots of which 51% were controlled off balance sheet. While our controlled ratio has recently declined due to normal course take-downs and our active reevaluation of our deal pipeline against current market conditions, we still intend to manage toward our long term target of at least 65% control based on trailing 12 month home closings. We owned three years of lots out of a total of 6.2 years of a controlled supply which we believe is the right balance in today’s environment. As Cheryl laid out, our land investment strategy is focused on core, well located communities that serve our discerning customer base with approximately $2 billion of planned home building acquisition and development spend in 2026. In the first quarter we invested $503 million comprised of $279 million for lot acquisitions and $224 million for development. As we deploy this capital, we will remain prudent and balanced in our use of land financing tools. These include seller financing, joint ventures, traditional option agreements and land banking and we selectively deploy each as we seek to optimize cost, risk and return at the individual asset level. Our preference is seller financing when available as it tends to be the lowest cost. When it is not. We evaluate JV structures, traditional options or land banking. The result is a diversified and flexible pool of structures that allow us to cost effectively control lots off balance sheet or defer cash outflows to improve our returns and manage our portfolio risk. Given the increased investor focus on land banking, I wanted to share some perspective on this topic. As of quarter end, approximately 10,000 of our control lots were in a land bank, representing approximately 13% of our total lot supply and about 25% of our controlled lots. Our remaining control lots were spread between 33% in JVs, 26% in single take-downs and 16% in traditional lot options. To further put our selective use of land banking in Context, in the first quarter, only 6% of our lots approved by our investment committee were tagged to be financed via a land bank. We believe this balanced approach is a source of competitive advantage and one that is reflected in our relative gross margin performance with only about 25 to 30 basis points of capitalized interest in the first quarter attributable to land banking and seller financing related project financing Turning to another area of focus, our build to rent platform, Yardley develops purpose built single parcel horizontal apartment communities. We have been encouraged by our engagement with policymakers and their general recognition that Yardley’s model is fundamentally distinct from the scattered single family rental activity targeted by our recent legislative discussions and we continue to believe that we are well positioned as that policy dialogue evolves with flexibility around product and execution optionality Operationally, we closed on the sale of one JV-owned Yardley community for approximately $41 million during the quarter. We now have 16 projects actively leasing and an additional 13 projects currently under development supported by our land Bank. Roughly 90% of Yardley’s total units are controlled off balance sheet with a total investment of approximately $320 million at quarter end. While we await greater clarity on the regulatory front, we remain confident in the long term demand dynamics for this unique rental offering that provides affordable housing solutions for those seeking an alternative to traditional multifamily apartments, often before being ready to commit to homeownership. Now I will turn the call to Curtis.

Curtis

Thanks Eric and good morning everyone. I will begin with the details of our first quarter financial performance and then review our guidance Metrics for the first quarter. Reported net income was $99 million or $1.01 per diluted share. Adjusted net income was $109 million or $1.12 per diluted share after excluding inventory impairment charges of $8.2 million and pre acquisition abandonment charges of $5.6 million. This compares to reported net income of $213 million or $2.07 per diluted share and adjusted net income of $226 million or $2.19 per diluted share in the first quarter of 2025. Both closings volume and average selling price came in roughly in line with our guidance with 2,268 homes delivered at an average price of $578,000, generating home closings revenue of approximately $1.3 billion. This was down from $1.8 billion in the first quarter of 2025, driven primarily by lower closings volume. Our adjusted home closings gross margin of 20.6% came in stronger than our guidance of approximately 20%, driven by several factors including favorable costs as well as product and geographic mix during the quarter. On a reported basis, home closings gross margin was 20% inclusive of $8.2 million of inventory impairment charges. This compares to an adjusted gross margin of 24.8% and reported gross margin of 24% in the first quarter of 2025. As anticipated, the decline reflects a higher mix of spec home closings and elevated incentive levels. Looking ahead, we expect that our margin trajectory will be shaped by two offsetting dynamics. On one hand, the recent rise in mortgage rates and a more cautious demand environment are likely to sustain incentive pressure. On the other hand, the progress we are making in rebuilding our to be built sales mix is a tailwind. To be built homes carry higher gross margins than spec closings and as those sales convert to closings, we expect this mix improvement to be the primary driver of margin recovery. On balance, we continue to expect gradual margin improvement beginning in the second half of the year, with the pace and magnitude dependent on how the sales and interest rate backdrop evolve through the remainder of the selling season. This also assumes relatively stable construction costs and mid single digit lot cost inflation. SGA expense was $149 million in the first quarter, or 11.4% of home closings revenue compared to 9.7% in the first quarter of 2025. Due to the deleveraging impact of lower revenue. However, in dollar terms SGA expense was down $28 million or 16% year over year, driven primarily by lower commission expense and payroll costs. As we have effectively managed our overhead structure as closings ramp through the year, we expect the SGA ratio to improve toward our full year target in the mid-10% range now to sales. net orders in the first quarter totaled 2,914 homes, down 14% year over year at an average selling price of $603,000, up 2% versus the prior year. Our monthly absorption pace was 2.7 net orders per community, up from 2.4 in the fourth quarter of 2025 but below 3.3 in the first quarter of 2025. We ended the quarter with 356 active selling communities, up 4% both sequentially and year over year. Cancellation trends remained manageable with our cancellation rate at 10% of gross orders in the quarter, down from 12.5% in the prior quarter and from 11% a year ago. This was the lowest cancellation rate since the third quarter of 2024. Turning to starts, we started 2,371 homes in the first quarter, or approximately 2.2 homes per community per month. This compares to a monthly start space of 2.1 in the prior quarter and 3.3 a year ago, reflecting our management of spec production as we work through existing inventory going forward, we will continue to roughly align our start space with community level sales activity. With cycle times down more than one month year over year, we have greater flexibility to start and close homes including to be built orders within the year. We also made progress in working through our finished spec inventory during the quarter. Finished specs declined 30% sequentially to 863 homes while total specs declined 9% to 2,692 which is roughly in line with …

Full story available on Benzinga.com

This post was originally published here

On Wednesday, Bridgewater Bancshares (NASDAQ:BWB) discussed first-quarter financial results during its earnings call. The full transcript is provided below.

This transcript is brought to you by Benzinga APIs. For real-time access to our entire catalog, please visit https://www.benzinga.com/apis/ for a consultation.

The full earnings call is available at https://event.choruscall.com/mediaframe/webcast.html?webcastid=DP9KwhU9

Summary

Bridgewater Bancshares reported a strong start to 2026, with a net interest margin expansion to 2.99%, nearly reaching their year-end target of 3%.

The company executed strategic sales of securities, resulting in a net gain and improved balance sheet efficiency, contributing to a $7.3 million increase in pre-tax net income for the quarter.

Loan portfolio grew by 5.5% annualized, with a focus on affordable housing, while core deposits increased by 3.2% annualized, demonstrating continued market share gains.

Asset quality remained strong with declines in net charge-offs and non-performing assets, and capital ratios improved, with CET1 increasing by 36 basis points to 9.53%.

The company opened a new branch in Lake Elmo, expanding their footprint in the Twin Cities, and announced an at-the-market offering for up to $50 million of common stock to enhance capital flexibility.

Management expressed confidence in continued net interest margin expansion and loan growth, despite competitive pressures, and emphasized ongoing strategic priorities, including leveraging AI and focusing on affordable housing.

Full Transcript

OPERATOR

Good morning and welcome to the Bridgewater Bancshares 2026 first quarter earnings call. My name is Danielle and I will be your conference operator today. All participants have been placed in listen only mode. After Bridgewater’s opening remarks, there will be a question and answer session. To ask a question, please press Star then one on your touchtone phone. If you are using a speakerphone, please pick up your handset before pressing the keys. To withdraw your question, please press Star then two. Please note that today’s call is being recorded at this time. I would like to introduce Justin Horstman, Vice President of Investor Relations, to begin the conference call. Please go ahead.

Justin Horstman (Vice President of Investor Relations)

Thank you Danielle and good morning everyone. Joining me on today’s call are Jerry Bock, Chairman and Chief Executive Officer Joe Chabowski, President and Chief Financial Officer Nick Place, Chief Banking Officer and Katie Morrell, Chief Credit Officer. In just a few moments we will provide an overview of our 2026 first quarter financial results. We will be referencing a slide presentation that is available on the Investor Relations section of Bridgewater’s website, investors.bridgewaterbankmn.com following our opening remarks, we will open the call for questions. During today’s presentation we may make projections or other forward looking statements regarding future events or the future financial performance of the company. We caution that such statements are predictions and that actual results may differ materially. Please see the forward looking statement, statement disclosure in the slide presentation and our 2026 first quarter earnings release for more information about risks and uncertainties which may affect us. The information we will provide today is as of and for the quarter ended March 31, 2026 and we undertake no duty to update the information. We may also disclose non GAAP financial measures during this call. We believe certain non GAAP financial measures, in addition to the related GAAP measures, provide meaningful information to investors to help them understand the Company’s operating performance and trends and to facilitate comparisons with the performance of our peers. We caution that these disclosures should not be viewed as a substitute for operating results determined in accordance with GAAP. Please see our slide presentation and 2026 first quarter earnings release for reconciliations of non GAAP disclosures to the comparable GAAP measures. I would now like to turn the call over to Bridgewater’s Chairman and CEO Jerry Bock. Thank you Justin and thank you for joining us this morning. Bridgewater is off to a strong start in 2026 with several positive developments during the quarter positioning us well for the rest of the year. First and foremost, I would like to point out Our Net Interest Margin Expansion While we mentioned last quarter that we expected to reach a 3% margin by the end of 2026, we nearly got there in the first quarter as margin expanded to 2.99%, deposit costs declined and loans repriced higher than helping us get there quicker than anticipated. We expect to see slow additional margin expansion over the coming quarters. Because of the net strong net interest margin, we were able to continue growing net interest income. This happened even while our balance sheet shrunk during the quarter due to some strategic sales of securities. These security sales were part of several opportunistic actions taken in the first quarter to enhance our balance sheet efficiency, resulting in both a substantial gain and positioning us for improved profitability moving forward. I want to be clear that this was not the standard balance sheet repositioning many other banks have done recently that involved selling securities at a large loss to increase future margin, but rather a calculated tactic Joe and our treasury team recognized. As interest rates moved in our favor in response to this shift, they executed on an opportunity to improve forward profitability while taking an immediate gain. Joe will provide more details on this in a minute. I’m pleased to report we continued to take market share in the first quarter as the loan portfolio grew 5.5% annualized with much of the growth continuing to come from our commitment to our affordable housing vertical. Core deposit momentum also continued as balances increased 3.2% annualized while the overall deposit mix continued to improve. Asset quality remained positive in the first quarter as net charge offs and nonperforming assets both declined nicely. We continue to feel good about the overall asset quality of our loan portfolio resulting from the strong credit culture we pride ourselves on. In addition, we saw a nice uptick in our capital ratios as CET1 increased 36 basis points to 9.53%. Turning to slide 4 tangible book value growth continues to be a staple of the Bridgewater story and that was no different in the first quarter as tangible book value increased 9.9% annualized to $15.93 per share. This is an important differentiator for Bridgewater. We are proud of our ability to create and sustain shareholder value through tangible book value growth and how consistent this trajectory has been over the past decade. Before I pass it over to Joe, I also wanted to share that we successfully expanded our footprint to the east. In February we opened our De Novo branch in Lake Elmo. This is a growing area in the Twin Cities and we are thrilled with the opportunities it presents to Bridgewater Bank. With that, I’ll turn it over to Joe.

Joe Chabowski (President and Chief Financial Officer)

Thanks Jerry. Before we take a deeper dive into the first quarter results, I wanted to walk through the balance sheet efficiency actions we took in late January and early February which are laid out on slide 5. As Jerry mentioned, this was really a win win for us as our treasury team recognized how we could take advantage of of the volatility in interest rates to not only improve future profitability but also generate substantial near term revenue. As part of the strategy, we sold a portion of our high quality securities portfolio which included the sale of 147 million of treasuries for a net gain of 1.2 million and the sale of 62 million of municipal bonds for a net gain of 6.1 million. By selling these securities that were yielding in the 4 and 5% ranges, we were able to redeploy these dollars into higher yielding loans going forward. In addition to these security Sales, we also prepaid 97.5 million of higher cost FHLB advances that were being used to fund the securities. While this resulted in a prepayment expense of 982,000, it helped to improve our funding mix and reduce our overall cost of funds at the end of the day. We generated an additional 7.3 million of pre tax net income in the first quarter, increased our permanent capital levels and supported future net interest margin expansion by reducing our cost of funds and creating an opportunity to redeploy capital into higher yielding loans. This is another example of how we are actively and thoughtfully managing our balance sheet to drive shareholder value. Turning to Slide 6, we were able to grow net interest income by 3% quarter over quarter despite the average interest earning assets declining 185 million as a result of the balance sheet actions I just mentioned. This is pretty impressive and was driven by 24 basis points of net interest margin expansion in the first quarter to 299. Our expectation had been to get to a 3% net interest margin by the end of 26, but we were very pleased that several factors allowed us to nearly get there in the first quarter. First, we saw the full quarter impact of the fourth quarter rate cuts on both sides of the balance sheet as total deposit costs declined 18 basis points and loan yields were still able to reprice higher by 3 basis points given the fixed rate nature of the portfolio. Notably, deposit betas during this most recent rate cut cycle have outperformed the betas we saw during the prior cycle, primarily due to a larger portion of our deposit base being directly tied to short term rates. Second, loan fees continued to increase as payoffs remained elevated. And third, there was a modest margin impact within the quarter from the balance sheet efficiency actions we took which resulted in a decrease in higher cost borrowings and a smaller balance sheet. Given that we were able to pull forward much of our expected net interest margin expansion for the year into the first quarter, we expect the pace of margin expansion to slow meaningfully going forward. However, we still expect to see some mild margin expansion over the coming quarters even with no additional rate cuts. With net interest margin resetting higher, some margin expansion expected to continue, and earning asset growth set to return, we are well positioned to continue driving net interest income Moving forward. Slide 7 highlights some of the net interest margin drivers the cost of total deposits declined by 18 basis points in the first quarter and is now down 40 basis points over the past two quarters. The decline in the first quarter reflects the full quarter impact of the rate cuts from the fourth quarter of 2025. Absent any additional rate cuts, we would expect to see deposit costs stabilize going forward, although we will continue to look for additional opportunities to lower the rates of deposit accounts where it makes sense. Our Portfolio loan yield increased 3 basis points during the quarter to 5.81. As we have said in the past, we expect our loan portfolio to continue to reprice higher in the current environment. Given the larger fixed rate component which makes up 65% of the portfolio, we have been actively originating more variable rate loans to make the portfolio more rate neutral going forward. Variable rate loans now make up 23% of the loan portfolio, up from 17% a year ago. We would expect this loan repricing to continue to support future margin expansion as our loan portfolio includes 644 million of fixed rate loans scheduled to mature over the next 12 months at a weighted average yield of 573 and another 106 million of adjustable rate loans repricing or maturing at 386. With these lower yields running off the books and new originations in the first quarter going on the books around 6%, we have further repricing upside ahead of us. Turning to Slide 8, we continue to see strong profitability and revenue growth trends as our adjusted return on average assets was just under 1% for the second consecutive quarter. We have also continued to consistently grow total revenue driven by steady net interest income growth. In addition, non interest income has topped $2 million every quarter since the fourth quarter of 2024, even excluding securities gains. This is a result of new fee income sources we have added recently, including swap fees and investment advisory fees, both of which we expect to continue to see throughout 2026. Turning to slide nine we have a strong track record of well managed expense growth as evidenced by our consistently better than peer efficiency ratio excluding the 982,000 of FHLB prepayment expense expenses still a bit elevated in the first quarter which is typically the case due to some seasonality first quarter expenses included, our annual merit increases going into effect across the organization early in the quarter, several key strategic hires related to the …

Full story available on Benzinga.com

This post was originally published here

Wesbanco (NASDAQ:WSBC) released first-quarter financial results and hosted an earnings call on Wednesday. Read the complete transcript below.

This content is powered by Benzinga APIs. For comprehensive financial data and transcripts, visit https://www.benzinga.com/apis/.

The full earnings call is available at https://event.choruscall.com/mediaframe/webcast.html?webcastid=2tR3k5XV

Summary

Wesbanco reported a 38% increase in diluted earnings per share to $0.91 and a 44% increase in pre-tax pre-provision earnings to $114 billion compared to the previous year.

The company achieved a net income of $87 million for common shareholders, excluding merger and restructuring charges, and maintained a solid capital position with a CET1 ratio of 10.7%.

Strategically, Wesbanco exceeded its financial targets for the Premier acquisition, continued its Southeastern expansion with a new team in South Florida, and opened new financial centers in high-growth markets.

Loan growth was recorded at 3.6% year over year, supported by a strong commercial pipeline, despite a $1 billion headwind from commercial real estate project payoffs over the past nine months.

The company anticipates mid-single-digit loan growth for 2026, supported by its expansion in South Florida and the increased commercial pipeline.

Management highlighted successful cost management with a slightly reduced operating expense from the previous quarter and strategic investments in digital capabilities and branch optimization.

Wesbanco plans to further expand its presence in Florida and other markets, with an emphasis on relationship-driven growth and adding local product capabilities.

Full Transcript

OPERATOR

Good day and welcome to the Wesbanco first quarter 2026 earnings conference call. All participants will be in listen only mode. Should you need assistance, please signal a conference specialist by pressing the star key followed by zero. After today’s presentation there will be an opportunity to ask questions. To ask a question, you may press star then one on your telephone keypad. To withdraw your question, please press star then two. Please note this event is being recorded. I would now like to turn the conference over to John Ioannone, Senior Vice President of Investor Relations. Please go ahead.

John Ioannone (Senior Vice President of Investor Relations)

Thank you. Good morning and welcome to Wesbanco Inc.’s first quarter 2026 earnings conference call. Leading the call today are Jeff Jackson, President and Chief Executive Officer and Dan Weiss, Senior Executive Vice President and Chief Financial Officer. Today’s Call, an archive of which will be available on our website for one year, contains forward looking information. Cautionary statements statements about this information and reconciliations of non-GAAP measures are included in our earnings related materials issued yesterday afternoon as well as our other SEC filings and investor materials. These materials are available on the Investor Relations Relations section of our website wesbanco.com all statements speak only as of April 22, 2026 and Wesbanco undertakes no obligation to update them. I would now turn the call over to Jeff.

Jeff Jackson (President and Chief Executive Officer)

Jeff Thanks John and good morning everyone. Today we’ll walk you through our first quarter performance and share our current outlook for the rest of 2026. There are three key takeaways from the quarter. We delivered solid year over year financial results. We exceeded our year one financial targets for the Premier acquisition and we stayed disciplined in executing our strategy to position Wesbanco for long term success. Overall, it was a solid start to the year. Turning to our financials for the quarter ended March 31, 2026, we reported net income available to common shareholders of 87 million excluding merger and restructuring charges. That translated to diluted earnings per share of $0.91, up 38% from a year ago. On a similar basis, we reported pre tax pre provision earnings of $114 billion, an increase of 44% year over year. The strength of our first quarter financial performance was reflected in our returns on average assets and tangible common equity of 1.3% and 17.4% respectively. Our capital position also remains solid with a CET1 ratio of 10.7%. That gives us flexibility to support growth and and navigate the operating environment ahead. As we mentioned last quarter, developers continue to seek permanent financing or the sale of properties during the first quarter. That drove elevated commercial real estate project payoffs which totaled 340 million during the first quarter and created a 1.4% headwind to our year over year loan growth. In fact, we have incurred a significant CRE payoff headwind of of a billion dollars during the last nine months. Despite that headwind, our teams continue to execute at a high level. Loan growth was largely funded by deposit growth and our commercial pipeline has reached all time record levels. Adjusting for the payoff activity, total loans grew 3.6% year over year. The commercial pipeline has increased 35% since year end to a record 1.6 billion and in the few weeks since quarter end the pipeline has grown another 200 million to 1.8 billion. About 45% of that pipeline is coming from existing loan production offices and the former Premier footprint. Impressively, this pipeline does not yet reflect the benefit of our recently announced South Florida expansion. That team has hit the ground running and built an initial $400 million pipeline just in a few weeks. They are on pace to grow that pipeline by a significant amount as the year progresses. Even with elevated CRE payoffs during the first half of the year and the potential of influence of geopolitical events, we continue to expect mid single digit year over year loan growth for 2026, supported by our record pipeline and early momentum from our South Florida markets. A little over a year ago we completed our transformative acquisition of Premier Financial, an acquisition that placed WestBanco among the 50 largest publicly traded banks in the U.S. when we announced the Premier acquisition in July 2024, we laid out clear financial targets for the first year including 40% earnings per share growth, a 1.3 return on average assets and a CET1 ratio of 9.6% along with a tangible book value earned back in under three years. I’m pleased to say we delivered and in many cases exceeded our targets. Over the last 12 months, core EPS growth reached 49% and ROAA was 1.3%. We also exceeded the pro forma CET1 ratio by more than a percentage point and shaved more than a year off the dilution earn back as our first quarter tangible book value per share of $22.45 is well above the June 2024 figure and nearly at the year end 2024 level. In addition, we have been making other strategic investments that demonstrate our commitment to long term sustainable growth. We continuously invest in digital capabilities and products like WestBanco One Account and Treasury Management Services to ensure we serve our customers how, when and where they want. At the same time, we continue to optimize our physical branch network. Over the past four years we’ve closed 64 locations with limited customer traffic, including 10 of them in Northern Ohio that will close next month. We’re selectively opening new financial centers in key markets and consolidating others into more central and higher demand locations. Our loan production office strategy continues to perform well. We’ve opened LPOs in high growth markets including Chattanooga, Indianapolis, Knoxville, Nashville and Northern Virginia. We’re seeing strong results as these teams deepen relationships and bring on new commercial clients. As these offices achieve scale, we add product capabilities locally as well as financial centers to better serve our growing client base. Chattanooga is a great example. We opened that LPO less than three years ago and it has generated strong relationship driven growth. That momentum supports the opening of our first Tennessee Financial center this week. We anticipate that several other of our LPOs will follow this pattern within the next couple of years. I’m very excited about our recent expansion into Florida which is a thoughtful extension of our long stated southeastern expansion strategy. Last month we announced the launch of our commercial banking business across key high growth South Florida markets starting with Palm beach and Broward Counties. We brought on a seasoned team of nearly 20 professionals including market leaders, commercial bankers, credit underwriting and a client relationship support as well as a Treasury management leader. These are attractive high growth markets and ones I’ve come to know well during my banking career. I’ve worked with many of these bankers before and they consistently delivered top performance while maintaining strong credit discipline. Just as importantly, their client focus aligns well with our relationship led approach. Our Florida expansion also provides meaningful organic growth opportunities for our strong healthcare banking vertical. As the regional business which is primarily focused on C and I lending develops, we will evaluate additional services and solutions including retail financial centers, treasury wealth management and mortgage offerings to deliver even a greater value to our clients. I would now like to turn the call over to Dan to walk through the financials and outlook in more detail. Dan thanks Jeff and good morning.

Dan Weiss (Senior Executive Vice President and Chief Financial Officer)

For the first quarter we reported GAAP net income available by common shareholders of $84 million or $0.88 per share and when excluding restructuring and merger related expenses, first quarter net income was $87 million or $0.91 per share. To highlight a few of the first quarter’s year over year accomplishments, we generated strong pre tax pre provisioned core earnings growth of 44%, grew core earnings per share by 38%, improved the net interest margin by 22 basis points and reduced the efficiency ratio by nearly 4 percentage points to 52.5%. Total assets of $27.5 billion include total portfolio loans of 19.1 billion and securities of 4.4 billion. Total portfolio loans increased 2.2% year over year driven by commercial real estate and home equity lending and declined slightly on a sequential quarter basis due to elevated payoffs. We expect commercial real estate payoffs to remain slightly elevated during the second quarter but at a lower level than the first quarter before returning to a more normal historical levels level during the back half of the year totaling 700 to 900 million dollars for the year. While very small, we ended our indirect auto program as it’s not core to our organic growth strategy and at quarter end it represented about half of the $325 million of consumer loan portfolio and anticipate that that portfolio will run off over the next three to five years. Deposits increased 2% year over year to $21.7 billion due to organic growth. We continue to be successful in remixing higher cost certificates deposit into interest bearing demand and of our remaining $2.7 billion certificate of deposit portfolio approximately 1 billion matures in each of the next two quarters with an average rate of 3.48% and 3.2% respectively. Our current seven month certificate of deposit rollover rate is 3.25%. Further, we started the year with $100 million in broker deposits, $50 million paid off early in the quarter while the last of our broker deposits paid off on April 1st. Credit quality continues to remain stable as key metrics have remained low from a historical perspective and favorable to all banks with assets between 20 and 50 billion over the last five quarters. Criticized and classified loans as a percentage of total portfolio loans decreased $49 million or 24 basis points from the sequential quarter to 2.9% while non performing loans increased 53 million sequentially primarily due to three CRE loans across different markets and property types, none of which were office the allowance for credit losses. The total portfolio loans at the end of the first quarter was 1.1% of total loans or $210 million. The decrease from the fourth quarter was primarily due to lower loan balances, faster prepayment speeds and macroeconomic factors. The first quarter margin of 3.57% improved 22 basis points year over year …

Full story available on Benzinga.com

This post was originally published here

Agree Realty (NYSE:ADC) reported first-quarter financial results on Wednesday. The transcript from the company’s first-quarter earnings call has been provided below.

Benzinga APIs provide real-time access to earnings call transcripts and financial data. Visit https://www.benzinga.com/apis/ to learn more.

Access the full call at https://events.q4inc.com/attendee/935659141

Summary

Agree Realty reported its largest quarterly acquisition volume since 2022, investing $403 million in acquisitions and $425 million across three external growth platforms.

The company raised approximately $660 million through forward equity and holds $2.3 billion in total liquidity, with a pro forma net debt to recurring EBITDA of 3.2 times.

The company reiterated its full-year 2026 AFFO per share guidance of $4.54 to $4.58, implying a 5.4% year-over-year growth.

Operational highlights include a sale-leaseback with Hobby Lobby and acquisitions including Home Depot, Wawa, Sherwin Williams, Aldi, and Walmart properties.

Management emphasized the robustness of its external growth pipeline and the strategic focus on high-quality retail portfolio improvements.

Full Transcript

OPERATOR

Good morning and welcome to the Agree Realty first quarter 2026 conference call. All participants will be in listen only mode. Should you need assistance, please signal a conference specialist by pressing the Star key followed by zero. After today’s presentation there will be an opportunity to ask questions. To ask a question, you may press Star then one on your touchtone phone. To withdraw your question, please press Star one again. Please limit yourself to two questions during this call. Note this event is being recorded and at this time I would like to turn the conference over to Reuben Treitman, Senior Director of Corporate Finance. Please go ahead.

Reuben Treitman (Senior Director of Corporate Finance)

Thank you. Good morning everyone and thank you for joining US for Agree Realty’s first quarter 2026 earnings call. Before turning the call over to Joey and Peter to discuss our results for the quarter, let me first run through the cautionary language. Please note that during this call we will make certain statements that may be considered forward looking under Federal securities law, including statements related to our updated 2026 guidance. Our actual results may differ significantly from the matters discussed in any forward looking statements for a number of reasons. Please see yesterday’s earnings release and our SEC filings including our latest annual report on Form 10K for a discussion of various risks and uncertainties underlying our forward looking statements. In addition, we discuss non GAAP financial measures including core funds from operations or core FFO adjusted funds from operations or AFFO and pro forma net debt to recurring EBITDA Reconciliations of our historical non GAAP financial measures to the most directly comparable GAAP measures can be found in our earnings release website and SEC filings. I’ll now turn the call over to Joey.

Joey

Thank you Ruben and thank you all for joining us this morning. I’m extremely pleased with our performance to start the year as we have continued to execute on all fronts. During the quarter we invested nearly 425 million across our three external growth platforms while further strengthening our market leading portfolio. The 403 million of acquisitions completed during the period represents our largest quarterly acquisition volume since 2022 as we continue to source superior risk adjusted opportunities. While the macro backdrop remained highly unpredictable, we have never been better positioned. During the quarter we raised approximately 660 million of forward equity through our ATM. We now enjoy 2.3 billion of total liquidity and more than 1.6 billion of hedge capital including a company record 1.4 billion of outstanding forward equity at quarter end. Pro forma net debt to recurring EBITDA was just 3.2 times giving us meaningful flexibility to execute regardless of customers, capital markets volatility. As a reminder, we have no material debt maturities until 2028. We have married this fortress balance sheet with the highest quality retail portfolio in the country that only continues to improve in a K shaped economy. Our industry leading tenants stand poised to leverage their scale and value propositions to drive further share gains. We are consistently seeing leading retailers with the balance sheets and operating discipline when winning across cycles and expanding their brick and mortar footprints. Our pipeline across all three external growth platforms is robust, yet our approach remains unchanged. We will stay consistent within our established investment parameters without compromising our underwriting standards while our investment and earning guidance remain unchanged. I would note that we have increased our treasury stock method dilution in anticipation of an elevated stock price and as well as the additional forward equity raise during the quarter. We’ll continue to provide updates as the year progresses and Peter will provide additional details on our guidance and input shortly. Turning to our external growth activity, we had an active start to the year leveraging our unique market positioning and deep relationships with retail partners to uncover opportunities across all 3 platforms. During the first quarter, we invested nearly 425 million in 100 properties across these 3 platforms. Of note, during the quarter, we executed a sale leaseback with Hobby Lobby on their corporately owned stores. As we’ve discussed on prior earnings calls, Hobby Lobby is privately owned, has a pristine balance sheet and stands as a clear market leader in the craft and hobby space. They are a terrific operator and partner. As a reminder, we do not impute investment grade or shadow investment grade ratings in our IG percentage. Additional acquisitions during the quarter included a Home Depot, five WAWA ground leases in Pennsylvania and Maryland, a portfolio of 11 Sherwin Williams stores, several Aldi’s, and three Walmarts located in Georgia and South Carolina. The acquired properties had a weighted average cap rate of 7.1% and a weighted average lease term of 11.3 years. Nearly 60% of base rent acquired was derived from investment grade retailers and we continued to add to our ground lease portfolio during the quarter. As previously discussed, we continue to see increased activity across our development and developer funding platforms. During the first quarter, we commenced 2 new development or DSP projects with total anticipated costs of approximately $18 million. Construction continued on nine projects during the quarter with aggregate and anticipated costs of approximately $71 million. We completed four projects during the quarter representing a total investment of approximately 23 million. Our development and DFP pipelines continue to grow significantly and we expect development and DFP activity to meaningfully ramp in the second and third quarters, including several additional Projects that have commenced subsequent to quarter end. Moving on to dispositions, we sold seven properties during the quarter for total gross proceeds of approximately $11 million at a weighted average cap rate of 6.8%. This activity included both the Jiffy Lube and Dutch Brothers that were included in the grocery portfolio acquisition last year. We sold These assets approximately 300 basis points inside of where we acquired them less than one year ago, highlighting our ability to opportunistically recycle capital and harvest value across our portfolio. Our asset management team continues to do an excellent job proactively addressing upcoming lease maturities. We executed new leases, extensions or options on over 876,000 square feet of gross leasable area during the first quarter with a recapture rate of over 104%. This included a Walmart Super center in Whitewater, Wisconsin and a Home Depot in Orange, Connecticut. We remain well positioned for the remainder of the year with just 29 leases or 90 basis points of annualized base rent maturing, which is down 60 basis points quarter over quarter and 260 basis points year over year. We ended the quarter with pharmacy exposure at 3.5% of annualized base rent and it now falls outside of our top 10 sectors, a meaningful milestone given that pharmacy once exceeded 40% of our portfolio. Anchored by assets such as our Walgreens on the corner of the Diag on the University of Michigan’s campus, our CVS on Greenwich Avenue, we are confident in the real estate and performance of our remaining pharmacy assets as of quarter end. Our Best in class portfolio comprised 2,756 properties spanning all 50 states. The portfolio included 261 ground leases comprising over 10% of annualized base rent. Our investment grade exposure stood at over 65% and occupancy is strong at 99.7%, up 50 basis points year over year. Before I hand the call over to Peter, I’d like to thank and compliment the tremendous work he and his team did on the creation of our inaugural supplement. We have taken feedback from a number of constituents and created a first class document that provides investors and analysts with a thorough picture of our portfolio and financials. Peter, thank you and take it away.

Peter

Thank you, Joey. Starting with the balance sheet, we were very active in the capital markets during the first quarter, selling 8.7 million shares of forward equity via our ATM program for anticipated net proceeds of approximately $658 million. This represents yet another company record for equity raised in the quarter and underscores our ability to raise equity at scale via our ATM and in a cost efficient manner. At quarter end we had approximately 18.4 million shares of outstanding forward equity which are anticipated to raise net proceeds of approximately $1.4 billion upon settlement. Additionally, during the period we drew $250 million on our previously announced $350 million delayed draw term loan. As a reminder, we entered into forward starting swaps to fix SOFR through maturity in 2031 and inclusive of those swaps, the term loan bears interest at a fixed rate of 4.02%. We also took further steps to hedge against interest rate volatility, entering into $50 million of forward starting swaps during the quarter. In total, we now have $250 million of forward starting swaps, effectively fixing the base rate for a contemplated 10 year unsecured debt issuance at roughly 4.1%. Combined with the approximately $1.4 billion of outstanding forward equity, we have over $1.6 billion of hedge capital which provides critical visibility into our intermediate cost of capital, particularly amidst recent geopolitical and macro uncertainty. At quarter end we had liquidity of approximately $2.3 billion including the aforementioned forward equity, availability on a revolving credit facility, term loan and cash on hand pro forma for the settlement of all outstanding forward equity. Our net debt to recurring EBITDA was approximately 3.2 times, our total debt to enterprise value is under 29% and our fixed charge coverage ratio which includes the preferred dividend remains very healthy at 4.2 times. Our sole short term or floating rate exposure was comprised of outstanding commercial paper borrowings at quarter end and as Joey mentioned, we continue to have no material debt maturities until 2028. Our balance sheet is extremely well positioned to execute on our robust investment activity across all three external growth platforms. Moving to Earnings Core FFO per share was $1.13 for the first quarter, which represents an 8.1% increase compared to the first quarter of last year. AFFO per share was $1.14 for the quarter, representing a 7.9% year over year increase, which is the highest quarterly AFFO per share growth achieved since the second quarter of 2022. As Joey noted, we are reiterating our full year 2026 AFFO per share guidance of $4.54 to $4.58, which implies approximately 5.4% year over year growth. At the midpoint. We provide parameters on several other inputs in our earnings release including investment and disposition volume, general and administrative expenses, non reimbursable real estate expenses, as well as income tax and other tax expenses. Our current guidance also includes anticipated treasury stock method dilution related to our outstanding forward equity provided that our stock continues to trade around current levels. We anticipate that treasury stock method dilution will have an impact of $0.02 to $0.04 on full year 2026 AFFO per share. This is up from approximately 1 penny in our prior guidance due to both a higher share price and more forward equity outstanding. As always, the impact could be higher or lower if our stock price moves significantly above or below current levels. During the quarter we recorded approximately $2.4 million of percentage rent, up from $1.6 million in the first quarter of last year. Roughly a third of the increase was driven by strong same store sales performance across this group of leases as we have actively targeted leases with potential percentage rent upside. The remainder reflects a timing shift as certain tenants that have historically paid Percentage rent in Q2 contributed in Q1 of this year Our growing and well covered dividend continues to be supported by our consistent and durable earnings growth. During the first quarter we declared monthly cash dividends of 26.2 cents per common share for January, February and March. The monthly dividend equates to an annualized dividend of over $3.14 per share and represents a 3.6% year over year increase. Our dividend is very well covered with a payout ratio of 69% of AFFO per share. For the first quarter, we anticipate having over $140 million in free cash flow after the dividend this year, an …

Full story available on Benzinga.com

This post was originally published here

Annaly Capital Management (NYSE:NLY) released first-quarter financial results and hosted an earnings call on Wednesday. Read the complete transcript below.

Benzinga APIs provide real-time access to earnings call transcripts and financial data. Visit https://www.benzinga.com/apis/ to learn more.

The full earnings call is available at https://event.choruscall.com/mediaframe/webcast.html?webcastid=LgH6ZSW8

Summary

Annaly Capital Management reported a 1.5% economic return for Q1 2026, with earnings available for distribution per share increasing to $0.76.

The company raised $510 million in common equity, deploying most of it into residential credit and mortgage servicing rights (MSR) due to market conditions.

Annaly’s portfolio saw strong performance despite volatility, with a conservative leverage of 5.7 times and maintained a diversified housing finance platform.

The company anticipates continued strong risk-adjusted returns from its investment strategies, driven by favorable market conditions and technicals.

Management highlighted the flexibility to dynamically allocate capital and the resilience of its housing finance platform amid geopolitical and market volatility.

Full Transcript

OPERATOR

Good day and welcome to the first quarter 2026 Annaly Capital Management Earnings Conference Call. All participants will be in listen only mode. Should you need assistance, please signal a conference specialist by pressing the STAR key followed by zero. After today’s presentation, there will be an opportunity to ask questions. To ask a question, you may press Star then one on your telephone keypad. To withdraw your question, please press Star then two. Please note this event is being recorded. I would now like to turn the conference over to Shawn Kensel, Director Investor Relations. Please go ahead

Shawn Kensel (Director Investor Relations)

Good morning and welcome to the first quarter 2026 earnings call for Annaly Capital Management. Any forward looking statements made during today’s call are subject to certain risks and uncertainties which are outlined in the Risk Factors section in our most recent annual and quarterly SEC filings. Actual events and results may differ materially from these forward looking statements. We encourage you to read the disclaimer in our earnings release in addition to our quarterly and annual filings. Additionally, the content of this conference call may contain time sensitive information that is accurate only as of the date hereof. We do not undertake and specifically disclaim any obligation to update or revise this information. During this call we may present both GAAP and non GAAP financial measures. A reconciliation of GAAP to non GAAP measures is included in our earnings release. Content referenced in today’s call can be found in our first quarter 2026 investor presentation and first quarter 2026 financial supplement, both found under the Presentation section of our website. Please also note this event is being recorded. Participants on this morning’s call include David Finkelstein, Chief Executive Officer and Co Chief Investment Officer Serena Wolf, Chief Financial Officer Mike Fannia, Co Chief Investment Officer and Head of Residential Credit VS Srinivasan, Head of Agency and Ken Adler, Head of Mortgage Servicing Rights. And with that, I’ll turn the call over to David. Thank you, Sean Good morning everyone and thank you for joining us on our first quarter earnings call. I’ll open with a brief review of the macro landscape before discussing our performance. Then I’ll provide further detail on each of our three investment strategies and conclude with our outlook. Serena will then discuss our financials before opening up the call to Q and A. Now, starting with the macro backdrop: January and February saw a continuation of many of the trends seen in the second half of 2025, highlighted by a resilient economy as well as modest stabilization in the labor market. Consequently, fixed income markets initially experienced continued strong investor demand and generally muted volatility. Ultimately, however, the war in the Middle East ruptured the calm as it introduced an energy price shock that may challenge the performance of the US Economy as the rest of the year unfolds. Although the US Is better insulated from higher commodity prices than most of Europe and Asia, rising oil and food prices risk further squeezing a consumer that is already facing slowing income growth and persistent affordability constraints. The bond market reacted sharply to the Middle East conflict and higher commodity prices as treasury yields sold off meaningfully in March. Short term rates led the sell off as investors priced higher near term inflation while long term yields rose on increased term premium. Expectations for monetary policy shifted significantly with markets pricing limited probability of any rate cuts this year compared to roughly two and a half cuts priced in at the end of February. For the time being, it appears Fed officials will be best served by waiting to evaluate incoming data for clear signs that inflation pressures are receding or the labor market is more markedly weakening before further lowering rates. This past quarter also saw the release of the Federal Reserve’s reproposed bank capital requirements, which were generally in line with market expectations. The newly proposed capital standards are more market friendly than Both the original 2023 Basel Endgame proposal and current standards, providing the potential for deployment of excess capital from banks into fixed income and housing finance. The reproposal also specifically targets the mortgage market as residential mortgage loan RWAs are estimated to decline by 30%. This could accelerate prime bank loan growth and lower agency MBS securitization rates, a positive technical for prime loans and agency mbs. Also, the elimination of a provision that deducted mortgage servicing rights above a specific threshold from regulatory capital may at the margin lead to slightly higher demand to hold MSRs on the part of banks. Now, with respect to our portfolio performance in the first quarter we delivered an economic return of 1.5% reflecting the strength of our diversified housing finance platform across a volatile market backdrop. Leverage remained conservative at 5.7 turns and we generated 76 cents of earnings available for distribution per share. Capital markets remained supportive in the first quarter and we were able to raise approximately $510 million of common equity through our ATM in Q1. The majority of capital raised was deployed in our residential credit and MSR strategies given the tightening experienced in agency in January and as such, our aggregate capital allocation to RESI and MSR increased from 38% to to 44% at the end of the quarter. Now, turning to our investment strategies and beginning with agency spreads tightened sharply in early January following the GSE purchase announcement before ultimately drifting wider initially simply on tight valuations and later on increased rate volatility following the outbreak of the Iran war. Now, despite the wide intra quarter range, MBS widened only modestly quarter over quarter, with lower coupons outperforming for our agency strategy. The story for the first quarter was about our ability to allocate capital dynamically as relative value shifts. Following the January tightening, we redeployed capital away from agency and into our credit businesses, which exhibited a more attractive return profile. However, the ultimate retracement of MBS spreads back to more reasonable levels later in the quarter left us entering Q2 with a more balanced view of the relative value landscape across our three businesses. The further support for agency currently is the strong technical backdrop the sector is exhibiting as aside from GSE purchase mandate, weekly flows into fixed income funds are strong and CMO issuance continues to absorb over 30% of gross supply as banks have ramped up buying CMO floaters. Moreover, recent changes to bank capital rules encourage banks to retain more loans, which could lower securitization rates and decrease organic growth in agency MBS. In our agency portfolio specifically, we ended the quarter at 92 billion in market value, a marginal decrease from year end. With agency representing 56% of the firm’s capital. We opportunistically repositioned the portfolio during the late quarter, sell off in rates, rotating down in coupon from sixes into 4.5 TBAs, and notably four and a half, provide more durable cash flows and improve the portfolio convexity should rates retest recent lows Also to note, we added modestly to our agency CMBS portfolio in the quarter. We maintained conservative interest rate exposure throughout Q1, with continued focus on protecting book value and managing risk through disciplined measured hedging. Heightened rate macro volatility led to more active tactical hedge adjustments in the quarter as markets moved quickly in response to geopolitical developments. Despite this activity, the net impact by quarter end was modest, with overall hedge levels changing only slightly. We remain comfortable maintaining exposure in swap spreads given the increased clarity around bank capital regulation and the growing presence of mortgage investors who actively hedge using swaps. That said, Treasuries have proven to be a more effective hedge in sharp volatility episodes such as March, which is why they continue to be an important part of our overall hedge composition. Now moving to residential credit, our portfolio ended the first quarter at $10.3 billion in market value, increasing to 23% of the firm’s capital. Driven largely by continued growth in our whole loan correspondent channel. Residential credit spreads tightened at the outset of the year as the strong move in the agency basis drove a rally across securitized products. However, similar to agency, credit spreads gave back their tightening in late February and March with AAA non QM spreads ending the quarter 10 to 15 basis points wider. We acquired 6.7 billion in whole loans on the quarter, approximately 80% sourced via our correspondent channel. Our lock volume was very strong at 7.4 billion, a 16% increase quarter over quarter and 41% increase year over year. Securitization markets remained healthy with Q1 residential credit gross issuance of 79 billion, a 63% increase year over year. Our OBX platform settled eight securitizations for 4.7 billion on the quarter generating 570 million of high quality proprietary assets for Annaly’s balance sheet and our joint venture and subsequent to quarter end we priced an additional four securitizations and now brought 12 transactions to market totaling 6.6 billion. Year to date, Onslow Bay remains the largest non bank securitizer of residential credit and is well positioned to continue to benefit from the growth of the private label market and we maintained our tight credit standards as our quarter end locked pipeline is represented by a764 weighted average FICO a 67% combined LTV with less than 2% of the portfolio greater than 80 LTV now shifting to MSR. Our portfolio ended the first quarter at $4.2 billion in market value and our capital allocation MSR increased 21% of the firm’s capital during the quarter. We committed to purchase $24 billion in principal balance or roughly $388 million in market value of MSR with a weighted average Note rate of 3.4% and these purchases came across four bulk packages as well as our flow channels. We were the second largest buyer of conventional MSR in the first quarter as measured by transfers and we are now ranked as the fifth largest non bank conventional servicer bulk supply in the first quarter roughly 80 billion UPB was above Q1.25 and we expect supply levels to remain ample throughout the balance of the year and we continue to scale our flow MSR capabilities in order to acquire current coupon MSR when attractive and our active flow partners more than tripled quarter over quarter as we purchased 1.9 billion UPB via Flow. Though still a small share of our overall purchases, underlying fundamentals within our MSR portfolio remain strong with prepay speeds muted at 4.2 CPR in Q1. While our credit profile continues to be high quality with serious Delinquencies just under 50 basis points the portfolio’s weighted average note rate of 3.3% continues to provide significant prepayment protection and is the lowest note rate among the top 20 largest agency MSR holders and our MSR valuation multiple increased modestly to a 5.94 multiple, primarily driven by the increase in interest rates. And lastly, to touch on our outlook, we believe each of our investment strategies is well positioned to deliver attractive risk adjusted returns through the remainder of the year, supported by a constructive market and housing finance backdrop. Again, agency spreads are at a more reasonable level today than earlier in the year, offering prospective new money returns in the mid teens. And as I noted earlier, market technicals are …

Full story available on Benzinga.com

This post was originally published here

Bank OZK (NASDAQ:OZK) released first-quarter financial results and hosted an earnings call on Wednesday. Read the complete transcript below.

This content is powered by Benzinga APIs. For comprehensive financial data and transcripts, visit https://www.benzinga.com/apis/.

The full earnings call is available at https://edge.media-server.com/mmc/p/bnjh9nks/

Summary

Bank OZK reported strong growth in its Corporate and Institutional Banking (CIB) division, with nearly two dozen new relationships and upsizing of legacy relationships, despite competitive pressures.

The company maintained a robust net interest margin of 4.20%, focusing on maximizing yield and minimizing costs across its balance sheet.

Bank OZK highlighted its diversified and scalable CIB model, which includes 42 industry niches and is expected to continue expanding its portfolio and fee income capabilities.

The management expressed optimism about 2027, expecting easing of headwinds from Real Estate Specialties Group (RESG) repayments and further growth acceleration in other business lines.

The company maintained a cautious but positive outlook on credit quality, citing a resilient economy and stable performance in consumer and commercial lending portfolios.

Full Transcript

OPERATOR

Good day and thank you for standing by. Welcome to the Bank OZK first quarter 2026 earnings conference call. At this time, all participants are in a listen only mode. After the speaker’s presentation, there will be a question and answer session. To ask a question during the session, you will need to press star 11 on your telephone. You will then hear an automated message advising that your hand is raised to withdraw your question, please press star 11 again. Please be advised that today’s conference is being recorded. I would now like to hand the conference over to your first speaker today, Jay Staley, Managing Director of Investor Relations and Corporate Development. Please go ahead.

Jay Staley (Managing Director of Investor Relations and Corporate Development)

Good morning. I’m Jay Staley, Managing Director of Investor Relations and Corporate development for Bank OZK. Thank you for joining our call this morning and participating in our question and answer session. In today’s QA session, we may make forward looking statements about our expectations, estimates and outlook for the future. Please refer to our earnings release, management comments, financial supplement and other public filings for more information on the various factors and risks that may cause actual results or outcomes to vary from those projected in or implied by such forward looking statements. Joining me on the call to take your questions are George Gleason, Chairman and CEO Brandon Hamblin, President, Cindy Wolf, Chief Operating Officer Tim Hicks, Chief Financial Officer, and Jake Munn, President, Corporate and Institutional Banking. We will now open up the lines for your questions. Let me now ask our operator Tanya to remind our listeners how to queue in for questions.

Tanya (Operator)

Certainly, as a reminder to ask a question, you will need to press Star 11 on your telephone and wait for your name to be announced. To withdraw your question, please press star 11 again. Please stand by while we compile our Q and A roster. And one moment for our first question, which will come from Manon Gosalia of Morgan Stanley. Your line is open.

Manon Gosalia (Equity Analyst)

Hi, good morning. Thanks for taking my question. The first one is just around the cib. Strong growth again this quarter, I guess. Appreciate that you guys are growing in attractive markets, you’re building teams. But at the same time, we continue to hear across the board that competition is growing. I guess the question is how do you assess risk in that business? And I guess what, if anything, would cause you to pull back there?

Jake Munn (President, Corporate and Institutional Banking)

All right, Jake, you want to take that? Thank you for the question. Manon. Yeah, good morning, Manon. Great to catch up with you and hear you. Good question. We continue to grow at a steady clip, as you mentioned, within CIB across all of our major business lines. This quarter we had really some nice success in generating over nearly Two dozen new relationships, upsizing nearly a dozen legacy relationships. And so we continue to see some nice growth across all of those. You know, you have a good point there. What we’re really building here, and you need to remember is it’s a diversified CIB, so it is not a CIB business that’s focused in one niche. These verticals encompass over 42 different industry niches in particular. And so it’s allowing us whether that’s through ablg, cbsf, efg, Fund Finance, lfg, nrg, our franchise capital solutions that we mentioned we launched this last quarter, we’re creating a really diversified book within CIB that allows us to take advantage of opportunities within those specific industries and push into them. So if we see a slowdown or an increased competition or increase or decrease pricing, let’s say in ablg, it affords us the opportunity to push more into our CBSF or NRG business lines. And so that diversification that we’re building with CIB is allowing us to continue to grow at a nice clip in a way where we’re not taking on any undue credit risk.

Manon Gosalia (Equity Analyst)

And are you seeing any spread compression in certain businesses that is causing a pivot into others?

Jake Munn (President, Corporate and Institutional Banking)

We are, exactly, yeah. So in our ABLG are some of our large corporate opportunities there. We have seen some pricing compression and so we’ve switched that and moved downstream a little bit more towards the middle markets and the lender opportunities in particular. If we look at our fund finance business line, we’ve had a pullback a little bit in our capital call subscription facilities just due to increased pressure there, specifically from non bank lenders and then insurance companies who have really entered that market and pushed down a little bit pricing. And then if we’re looking at our lender finance group too, in our lender finance group, we’ve seen some pricing and structure compression there too. So again, there’s been some competition in those business lines, but as a result, it’s allowed us to push in a little bit more within our cbsf, our EFG and our NRG business lines. And so again, the diversification and the nature of which we’re building CIB is affording us the opportunity to continue to grow without giving up yield and without sacrificing credit quality.

Manon Gosalia (Equity Analyst)

Got it. And then just in terms of helping us model out nim, we saw some material securities growth, Q on Q, any color you can provide there on what you’re putting on. And I guess how should we be modeling yields in that portfolio beyond the 460 to 470 that you’ve guided to for next quarter.

Tim Hicks (Chief Financial Officer)

Tim, do you want to jump in there? Tim, go ahead. Yeah, sure will. Thanks Manon. Yeah. We early in the quarter took the opportunity to use some of our excess liquidity and buy a decent amount of investments during the quarter and enhance our yield. About 40% of those are in muni housing bonds and 60% are in mortgage backed securities. Those both have favorable yields. The muni housing bonds are a tax equivalent yield of around 6% and the mortgage backed securities are somewhere around the 4.60% range or better. These are agency mortgage backed, agency mortgage backed. So we saw good growth there. We saw. We gave you some guidance on where we thought the range would be for yields for that portfolio. We had a nice pickup in Q1 and we’ll see another nice pickup in Q2 and then from there we’ll see what the market brings to us on opportunities. But team did a great job of finding good yielding, attractive, high quality investments and. And that’s going to certainly help us on NII during the quarter and will continue to help us throughout the year.

Manon Gosalia (Equity Analyst)

Great. Thank you.

OPERATOR

And our next question will be coming from the line of Stephen Skelton of Piper Sandler. Your line is open.

Stephen Skelton (Equity Analyst)

Yeah, thanks everyone. Good morning. I guess first question would be around commentary within the management comments document around 2027. You guys seem pretty upbeat about the potential for the bank in 2017 both in terms of growth and maybe even resolution progress with RESG and the resumption of growth within that book. So I’m wondering if you could give any additional color as to what kind of driving that confidence, whether anecdotal or more concrete, that would kind of give us a view into that progression.

George Gleason (Chairman and CEO)

Yeah, Stephen, happy to address that. Obviously Jake’s already spoken about CIB and the diversification, the new areas we’re pushing into there. CIB will be the predominant growth engine we would expect in 2027 as it has been last year and will be this year. So we expect that leadership to continue from the CIB group. We’re continuing to add people, we’re continuing to push into other verticals there. RESG may not be a great source of growth in 2027, but we’re looking for a slowing of the headwinds from resg repayments in 2027. It may be 2028 before we actually see significant growth there. We would expect our indirect lending group to continue to grow nicely. It stayed steady at 12 and sort of pushed up to about 13% of our portfolio. That portfolio is a very high end prime, high prime, super prime consumer portfolio and it has continued to just perform very well and very consistently. And we expect to get some more growth out of our commercial banking community banking group next year. So we think, you know, the headwinds from RESG repayments ease quite a bit in 27. We expect these other business lines to actually accelerate a touch more in 27 contributing to that better incremental growth we’re seeing that year. The other thing that I think is important is we’re building a number of other and investing to build a number of other fee generating businesses. We’re putting increased emphasis on trust and wealth. We’ve got a mortgage group that we’ve been building for a couple of years now that continues to gain scale. Although the mortgage business is not hot business right now. We think it will improve and that unit will gain more scale. We’re continuing to grow our fee income through treasury management and improving what we’re doing there a lot. And probably the biggest source of fee income opportunity just as far as growth is in our CIB group where there are a number of fee based businesses and opportunities we’re tapping into. And I think you’ll begin to see that incrementally add some non interest income in subsequent quarters this year and really hit a good pace in 2027. So we’re fairly optimistic about 2027.

Stephen Skelton (Equity Analyst)

Got it. Really helpful color George. And I guess my other question would be maybe similar to Manon’s question in a way but thinking about cib, I mean with resg we’ve all known you guys to have a best in class platform for the last 20 years or so that you’ve shown a differentiated model. How do you give investors confidence around the pace of growth within CIB and that there is a more differentiated model there as well, that we should have the same level of confidence as you grow that this rapidly similar to the results you’ve delivered in RESG over the life of that business.

George Gleason (Chairman and CEO)

Great question. Thank you for that. I’m going to let Jake answer part of that question, but before he does, I’m going to tell you a couple of things. Number one is talent and leadership are critically important in our company and Jake will talk a little bit about talent and as he answers your question. And the other thing is we’ve really built CIB aligned with the way we have built and approached resg and that is you’re going to look at a whole universe of opportunities all over the country. You’re going to focus on a very narrow subset of that universe that meet your criteria for quality of credit, profitability and relationship building. And then you’re going to close those transactions with very intentional bank protective documentation. You’re going to service and manage those assets in a very engaged way so that you see early warning signs, you’re able to influence behaviors and move those transactions in a way that is conducive with bank standards and objectives. So Jake, I’m going to let you talk about your team and why, given the growth you’re experiencing and projecting to experience, you’re comfortable with what we’re doing.

Jake Munn (President, Corporate and Institutional Banking)

Yeah, George, I appreciate that. And Steven, good morning. A good question as usual. You know, it’s really about building an infrastructure that’s scalable to George’s point. So when we got over here and we started to develop CIB in a very similar form and fashion resg it started with building out a really strong portfolio management and operations team. And so our portfolio management, our underwriting, our quarterly status reporting on every single credit we do within this book of business, our four operations teams that sit within PMO that ensure from beginning to end, it’s a clean and crisp process for our clients as they’re onboarded and serviced through the life of their relationship with us. And then it’s also building out something that’s scalable from a cross sell and a products and capabilities standpoint. George mentioned that answering your last question about fee income. But if you go back a couple years ago to where we are now, we’ve really developed some nice additional business lines that support the needs of our clients and our communities but also will assist in generating some really nice non interest income. So whether that’s our syndications desk that’s afforded us and blessed us with the opportunity to now lead more deals as admin agent. Whether that’s our interest rate hedging capabilities, our foreign exchange capabilities, whether that’s our capital markets program that we have that allows companies to access the capital markets with our partnership that we have there, or whether that’s our great treasury management platform that Cindy and Chad continue to develop and build out. We really have the products and the capabilities now to grow with a company and scale with the company over the long term horizon within the CNI space. Then to top it all off and really the most important part that that George hit on it’s all about talent. At the end of the day we’re in the business of people. We’re banking people, we’re banking communities, we’re banking businesses. And so attracting the Right. Talent who has a like mind for credit, who has the fire in their bellies to say to get in here and roll up their sleeves and make a difference. That talent is really what’s been differentiating us. And so put it all together. We’ve developed all the products and capabilities that are needed to scale this business. We have a great foundation with our portfolio management operations team and then you know, we’ve sat here and developed and bolted on complementary business lines. So whether it’s our asset based lending or corporate banking and sponsor finance, our equipment finance, our lender finance, our fund finance, our natural resources group and now our franchise capital solutions, you know we’re just getting started. There’s a great market out there. We’re being highly selective in what we’re doing. To George’s point, our pull through rate on our more mature businesses is still around 14, 15%. And so we are passing on 80, 85% of the deals we see in the market whether it’s a credit or pricing driven pass. But being highly selective in who we bring on, being highly selective in the products and services that we’re launching into the market to ensure that they’re best in class. It’s all really working out well for us and we’re seeing nice continued growth and true franchise growth. Really built one relationship at a time. Got it.

OPERATOR

That’s extremely helpful. Color and positioning it like Resg was built is something I wasn’t fully aware of. So thank you for going into that detail. I appreciate you. Thank you. And our next question will be coming from the line of Brian Martin of Marine Capital. Your line is open. Brian.

Cindy Wolf (Chief Operating Officer)

Hi. Good morning guys. Good morning Brian. Say maybe just one on the margin. I know you gave a little commentary in the management comments but just thinking about if we don’t see a change, …

Full story available on Benzinga.com

This post was originally published here

U.S. stocks were higher, with the Dow Jones gaining over 350 points on Wednesday.

Shares of GE Vernova Inc (NYSE:GEV) rose sharply after the company reported better-than-expected first-quarter financial results and raised its FY26 sales guidance above estimates.

Adjusted EPS was $2.06, topping the $1.88 estimate, while revenue of $9.339 billion exceeded the $9.173 billion consensus. GAAP diluted EPS was $17.44.

Revenue rose 16% year over year, with organic growth of 7%, while net income reached $4.7 billion, including $4.5 billion in pre-tax M&A gains primarily from Prolec GE.

GE Vernova shares jumped 14.1% to $1,131.00 on Wednesday.

Here are some other big stocks recording gains in today’s session.

  • Inhibrx Biosciences Inc (NASDAQ:INBX) shares jumped 32.8% to $111.71 after announcing updated interim data from Phase1/2 ozekibart combination with folfiri evaluation.
  • POET Technologies Inc (NASDAQ:POET) gained 22.3% to $12.53.
  • Voyager Acquisition Corp (NASDAQ:VACH) gained 20.5% to …

Full story available on Benzinga.com

This post was originally published here

Kalshi has selected Pyth Network (CRYPTO: PYTH) as the resolution source for its Commodities Hub, a dedicated section for event contracts tied to gold, silver, Brent crude, natural gas, copper, corn, soybeans and wheat.

Pyth price data will power contract resolutions, and Pyth Pro, the network’s institutional data tier, will provide direct feeds to Kalshi’s market makers, according to a press release.

The Commodities Hub on Kalshi covers event contracts across physical markets.

Second Major Prediction Market To Pick Pyth In Three Weeks

The Kalshi deal follows Polymarket’s April 2 integration with Pyth to resolve new daily up-or-down and closing-price contracts on major equity indices, commodities, and more than a dozen U.S. stocks. That list includes Tesla Inc (NASDAQ:TSLA), Coinbase Global (NASDAQ:COIN), Palantir Technologies

Full story available on Benzinga.com

This post was originally published here

Intuitive Surgical Inc (NASDAQ:ISRG) reported upbeat financial results for the first quarter of 2026 after the market close on Tuesday.

Intuitive Surgical reported revenue of $2.77 billion for the first quarter, beating analyst estimates of $2.62 billion, according to Benzinga Pro. The robotic-assisted surgery company reported first-quarter adjusted earnings of $2.50 per share, beating analyst estimates of $2.10 per share.

“We are pleased with company performance this quarter, which was marked by expanded adoption of our da Vinci, Ion, and digital platforms,” said Dave Rosa, CEO of Intuitive Surgical.

Intuitive Surgical expects full-year 2026 worldwide da Vinci procedures to increase approximately 13.5% to 15.5%, up …

Full story available on Benzinga.com

This post was originally published here

ASM International (OTC:ASMIY) held its first-quarter earnings conference call on Wednesday. Below is the complete transcript from the call.

Benzinga APIs provide real-time access to earnings call transcripts and financial data. Visit https://www.benzinga.com/apis/ to learn more.

The full earnings call is available at https://event.choruscall.com/mediaframe/webcast.html?webcastid=NaDtdlpN

Summary

ASM International reported Q1 2026 revenue of 863 million euros, a 16% increase year-on-year and 26% quarter-on-quarter growth, driven by strong performance in logic foundry and memory segments.

The company’s gross margin remained robust at 53.3%, supported by a favorable product mix and cost reduction initiatives, with expectations for margins to remain at the higher end of the 47-51% target range for the year.

Strategically, ASM International is focusing on AI-driven semiconductor demand, with plans to expand in advanced packaging and maintain strong momentum in advanced logic foundry and memory sales.

The company anticipates revenue growth in Q2 2026 to approximately 980 million euros, with the second half of the year expected to be stronger than the first.

Management highlighted ongoing supply chain challenges but expressed confidence in managing these issues while also benefiting from increased demand, particularly in China and the advanced logic foundry sector.

Full Transcript

Victor Barinho (Head of Investor Relations)

Thank you, operator. Good afternoon and thank you for joining our Q1 earnings call. With me today are our CEO Misha Massad and our CFO Paul Hagen. ASM issued its first quarter 2026 results yesterday at 6:00pm Central European Time. For those of you who have not yet seen the press release, it is available on our website together with our latest investor presentation. As always, we remind you that today’s conference call may contain forward looking statements in addition to historical information. For more details on risk factors relating to such forward looking statements, please refer to our press releases and financial reports, all of which are available on our website. Please also note that during this call we will refer to profitability metrics, primarily on an adjusted basis. Reconciliations to reported numbers can be found in the press release and in the investor presentation. And with that, I’ll now turn the call over to our CEO, Hisham.

Hisham

Thank you Victor and thanks to everyone for attending our first quarter 2026 results conference call. We’ll follow the usual agenda for today’s call. Paul will begin with a review of our first quarter financial results. I will then discuss market trends and our outlook, followed by the Q and A session. I will now turn it over to you, Paul.

Paul Hagen (Chief Financial Officer)

Thank you Sam and thanks everyone for joining our call today. Let me first walk you through the Q1 financial results. Our revenue in the first quarter of 2026 amounted to 863 million euro, which was at the high end of our guided range of 830 million plus or minus 4% on a constant currency basis. Revenue increased by 16% year on year and by 26% compared to Q4 2025. Equipment sales increased by 14% at constant currency and were left by ALD, Spares and Services continued to deliver very strong performance with a 23% year on year growth at constant currency. This was the result of continued expansion of our outcome based services and stronger spares demand in an environment of elevated FAB utilization rates. In terms of customer segments, revenue is led by Logic Foundry which accounted for the clear majority for the full year. Advanced Logic Foundry sales are expected to show significant growth this year, however due to quarterly phasing they were down from the very strong first quarter last year. Mature Logic Foundry for the largest part from customers in China increased compared to Q1 last year and rebounded strongly compared to the relatively low level in Q4. Memory sales showed sequential growth compared to Q4 last year and are also expected to grow significantly for the full year, mainly in dram. Sales in the memory segment were predominantly driven by applications for high performance DRAM in HBM related applications. Sales in the power analog wafer segment increased compared to the first quarter of last year, mostly in silicon based solutions, but from a low base. Gross margin in the first quarter amounted to a strong 53.3%. This was virtually unchanged compared to 53.4% in Q1 of last year up from 49.8 in Q4. Gross margin was supported by a favorable product and customer mixed including an increased sales contribution from China which rebounded strongly compared to the lower level in Q4. The gross margin also benefited from a gradual impact from cost reduction programs that we have been implementing over the past few years. We expect the gross margin to be at the higher end of the target range of 47 to 51% for the full year as GA expenses increased by 8% year on year at constant currency, mostly due to higher variable expenses, but dropped slightly as a percentage of sales, demonstrating our own growing focus on cost control. For the full year, we continue to expect as a generated percentage of sales to drop below 9%. Net RMB increased 11% year on year at constant currency. In Q1, We we continue to step up R&D investments to support customer transitions to next generation nodes and to advance our expanding pipeline of opportunities. For the full year, we intend to keep the net R&D within our target range of a low double digit percentage of revenue. Operating profit increased by a solid 21% year on year at constant currency and the operating margin reached a new record of 33.1%. If you look at the main movements below the operating line, financial results included the currency translation gain of 10 million euro in Q1.26 compared to a translation loss of 14 million in the first quarter of last year As a reminder, we hold a large part of our cash in US dollars and the related translation differences are included in our financial results. Our share of income from investments, reflecting our stake of approximately 25% in ASMPT, amounted to 7 million euros in the first quarter, up 2 million euro in the year ago period. Next the balance sheet and cash flow. ASM’s financial position remains solid and we ended the quarter with a cash position of close to a billion. Free cash flow was 48 million euros, negative, mainly reflecting a working capital outflow and a quarter marked by a sharp ramp in activity levels. Days of working Capital increased to 69 at the end of March, up from 45 at the end of December. The main driver for the increase was higher accounts receivable due to strong sales increase compared to the relatively low level in Q4 as well as back end loaded distribution of sales during the quarter. Capex amounts to 38 million Euro in the first quarter, up from 13 million in the same quarter of last year. And for the full year we expect CAPEX to be around or to be somewhat above the higher end of the guided range of 150 to 250 million Euro, with the largest part related to the construction of a new site in Scottsdale which remains on track for completion in Q1 2027. And with that I’ll turn the call back over to hichemen.

Hisham

Thank you Paul let’s now continue with the review of the market trends. The first quarter again confirmed that AI is the main driver of semiconductor demand. Customers continue to add capacity to support the ongoing expansion of AI data centers and the broader infrastructure buildout. This is keeping demand strong in the areas where we are most exposed, especially logic foundry, and we saw this demand strengthening further during the quarter. We have also noted a continuing proliferation and diversification of the AI workloads into the CPU and the power markets. For this reason we see AI driving strength in all segments of our business advanced larger quantity, mature logic foundry, memory and especially DRAM and to a lesser extent power wafer analog market. Looking ahead, our strategic view remains unchanged. As AI adoption broadens and demand continues to scale, compute capacity is increasingly the limiting factor in semiconductors. This is translating into tighter capacity needs for advanced logic foundry and memory devices, driving higher investment intensity and increasing the urgency of tool deliveries. Against this backdrop, our focus is on execution as we continue to support our customers expansion plans. The pace of demand is putting additional pressure on the supply chain, but so far we have been able to manage these rising challenges in close cooperation with both suppliers and customers reflected in the sharp step up in our quarterly sales from 700 million euro in Q4 of last year to a level approaching 1 billion euros projected for Q2. Turning now to customer segments, Logic Foundry again led our performance in Q1, supported by continued strength at the advanced nodes and a sequential rebound in mature logic foundry demand. Our view is unchanged that Logic Foundry will be a strong driver of our sales in 2026 and also going into 2027. The structural outlook for this segment remains strong AI driven compute requirement and the ongoing shift to more complex 3D device architecture and new materials continue to increase ALD and epitaxy intensity. As we progress through the year, we expect momentum to build further with ongoing capacity addition at the 2 nanometer technology node. Accounting for the largest part of advanced logic foundry sales in 2026, this first generation of GATE all around device technology is shaping up to be a large node enabling new applications in high performance computer including AI as well as advanced mobile and other leading applications. We continue to benefit from the step up in our served available market at 2 nanometer supported by a broadened position in epitaxy and sustained strong market share in ALD. In addition, we have seen a healthy uptick in demand related to the nodes from 3 nanometer to 7 nanometer driven by agentic AI. The demand is outstripping supply which has led to renewed capacity investment. Looking ahead to the industry’s next node transition to 1.4 nanometer, we expect pilot line investment to begin later this year. We are deeply engaged with key customers as they prepare for that transition and we expect the first meaningful contribution to our sales in the second half of 2026. As we have highlighted before, we expect the SAM uplift of the 1.4 nanometer to be even larger than what we saw at 2 nanometer node. At 2 nanometer the industry’s main priority was to get the first generation GATE all around architecture into high volume manufacturing. With GATE all around now in production and ramping, customers have more room to include additional performance boosters and for asm that translates into more functional layer in the transition stack to further optimize power and performance, including additional dipole layers to enable multi VT options alongside the higher SAM opportunity. We have already secured several key product penetration which supports our expectation for a higher ALD market share in the 1.4 nanometer node. Public disclosure from some leading customers suggests that the 1.4 nanometer node is designed to deliver clear improvement in performance, power efficiency and density versus today’s 2 nanometer node. This is well aligned with ever increasing AI token demand and the associated compute and power constraints in data centers. As our customers move toward high volume manufacturing in 2027 and 2028, we expect 1.4 nanometer become a meaningful driver for ASM. Next looking at memory demand in Q1 was solid with robust momentum in the most advanced DRAM technologies used in HBM related applications. Continued investment in AI infrastructure is keeping demand for high performance memory strong and supporting ongoing expansion of advanced DRAM capacity for the full year. We continue to expect healthy growth in our memory business. Looking further out, DRAM remains a meaningful and strategic opportunity for ASM from a technology perspective, our customer R and D engagement in memory continue to expand, including development work around new ALDI and epitaxy applications that support the transition to 4F Squared and PERI FinFET DRAM. As we highlighted at investor day, the transition to 4X Squared is expected to drive a step up in ALD and epitaxy intensity and expand our served available market by approximately 400 to 450 million USD based on 100k wafer start per month capacity. Turning over to power analog wafer market segment, the contribution in Q1 remained relatively low reflecting the soft market condition in broader parts of automotive and industrials. That said, we have seen some pockets of strength in selected area, particularly in power application for AI data centers. For 2026, our view is unchanged that this segment should recover gradually from a low base. We remain well positioned to benefit once demand conditions improve more broadly. Moving on to China, the increase in Q1 was largely driven by the mature logic foundry segment where we saw higher activity across a broader set of customers, reflecting improving market conditions and to a lesser extent the power analog segment. In addition, I’d like to highlight ASM’s ongoing success in winning new positions which also contributed to our strong performance in China. This demonstrated the continued competitiveness of our solution and the strength of our local team. Based on current visibility, we expect sales in China to increase for the full year with a stronger contribution in the first half. Now let’s talk about advanced packaging. As we have discussed during the investor day, we are looking into advanced packaging as another midterm growth area for asm. We believe that this market is ripe for disruptive solution in new materials and interface engineering playing into ASM strengths. We are engaged with multiple customers on advanced packaging and we are seeing some encouraging traction for our innovative solutions. That brings me to the outlook. At current currency, we project revenue to increase in Q2 2026 to 980 million Euro plus or minus 5% and we continue to expect revenue in the second half of 2026 to be higher than in the first half. As mentioned, China sales are expected to be first half weighted. This means that our other business segments are expected to strengthen from the first to the second half, including continued solid momentum in Advanced Logic Foundry, higher sales in memory, and a gradual recovery in Power analog. While it’s too early to provide specific guidance for the full year, based on our guidance in Q2 and a further increase in the second half, it should be clear that 2026 is going to be a strong year for ASM. And with that, we have finished our introduction.

Paul Hagen (Chief Financial Officer)

Thank you, Hisham. Let’s now move on to the Q&A and A session to ensure that everyone has an opportunity to participate. Please limit your questions to no more than two at a time. Operator, we are ready for the first question please.

Operator

Thank you. This is the Chorus Call conference operator we will now begin the question and answer session. Anyone who wishes to ask a question may press N1 on their touchtone telephone. To remove yourself from the question queue, please press N2. Please pick up the receiver when asking questions. Anyone who has a question may press N1 at this time. We will pause for a moment as participants are joining the queue. First question is from Andrew Gardiner, City

Andrew Gardiner (Equity Analyst)

Good afternoon, Hisham Good afternoon Paul. Thanks for taking the question. Hisham, if I could just sort of pick up on the point you were making at the end of your prepared comments there. You’re saying you will have growth in the second half of the year versus the first half, but obviously the visibility isn’t perfect to quantify it for us yet. Previously you’d been willing to talk about your performance relative to the wafers have equipment market broadly and that ASM would outperform that. Clearly WFE expectations are moving quite rapidly as well at the moment. Could you give us an update on how you see the broader market in terms of wfe and can you confirm that you will still outgrow that in 2026? Thank you.

Hisham

Thank you very much for the question. Yes, we talked about that in our previous conference call that we were going to at least perform as good as the Wafer Fab Equipment (Wafer Fab Equipment (WFE)) market or better. Yes, we have seen improvement in the WFE market. I mean we follow very closely what Gartner and VLSI talking about and we can reconfirm again that our growth in our market, in our revenue in 2026 will at least outgrow the WFE market …

Full story available on Benzinga.com

This post was originally published here

WR Berkley (NYSE:WRB) reported mixed results for the first quarter after the closing bell on Tuesday.

The company posted quarterly earnings of $1.30 per share which beat the analyst consensus estimate of $1.15 per share. The company reported quarterly sales of $3.690 billion which missed the analyst consensus estimate of $3.759 billion.

WR Berkley shares gained 2.4% to trade at $66.94 on Wednesday.

These analysts made changes to their price targets on WR Berkley following earnings announcement.

  • Truist Securities analyst Mark Hughes maintained …

Full story available on Benzinga.com

This post was originally published here

JBizNews Desk | April 22, 2026

American drivers paying roughly $3.45 per gallon may feel squeezed when oil prices rise—but compared with much of the world, they are still paying significantly less. As of April 2026, the global average gasoline price stands near $1.50 per liter, placing the United States well below most advanced economies, a gap driven largely by tax policy, domestic production strength, and long-standing political decisions.

The biggest dividing line is taxation. According to the U.S. Energy Information Administration (EIA), the federal gasoline tax remains fixed at 18.3 cents per gallon, unchanged since 1993. In contrast, European governments impose substantially higher levies. The European Commission mandates a minimum excise duty of €0.359 per liter—roughly $1.60 per gallon—with most countries charging above that threshold. Combined with value-added taxes, fuel taxes account for more than half of pump prices across the European Union, with Italy (55%), Germany (54.5%), France (53%), and Spain (45%) among the highest, according to Commission data.

Jacob Macumber-Rosin, Excise Tax Policy Analyst at the Tax Foundation, has noted that Europe’s baseline fuel tax alone exceeds the total gasoline tax burden in most U.S. states. Even in California, which has the highest combined federal and state gas taxes in the U.S., the total reaches about $1.25 per gallon—still below European minimums.

Beyond taxes, the United States benefits from a powerful structural advantage: it produces much of its own oil. The EIA’s Short-Term Energy Outlook shows U.S. crude production hit a record 13.6 million barrels per day in 2025, led by the Permian Basin, which accounted for nearly half of total output. That domestic capacity reduces reliance on imports and limits exposure to transportation costs that weigh heavily on Europe and Asia.

Energy economists say that production economics also support sustained output. Data from the Federal Reserve Bank of Dallas Energy Survey indicates breakeven costs in key U.S. shale regions hover around $61–$62 per barrel, allowing producers to remain profitable even during price downturns. Garrett Golding, Assistant Vice President for Energy Programs at the Dallas Fed, has emphasized that this cost discipline is a key factor underpinning U.S. energy resilience.

Industry groups point to the broader transformation of the U.S. energy sector. The American Energy Alliance has highlighted that advances in hydraulic fracturing and horizontal drilling have turned the U.S. into the world’s largest oil producer and a net petroleum exporter, strengthening supply security and helping stabilize domestic prices relative to global markets.

Looking ahead, price forecasts remain sensitive to geopolitical developments. The EIA’s April 2026 outlook projects gasoline prices will average $3.70 per gallon in 2026 and $3.46 in 2027, up from $3.10 in 2025, while diesel is expected to remain elevated near $4.80 per gallon due to tighter global supply. Steve Nalley, Acting Administrator of the EIA, has said the agency expects prices to moderate over time, though recent Middle East tensions have pushed projections higher.

Trade policy is another variable shaping the outlook. According to the American Fuel & Petrochemical Manufacturers, about 60% of U.S. crude imports come from Canada and 7% from Mexico. The Trump administration’s tariffs—25% on Mexican crude and 10% on Canadian crude—have so far had limited impact due to a global supply surplus, but could become more consequential if markets tighten.

Ultimately, the price Americans pay at the pump reflects policy as much as market forces. While countries draw from the same global oil supply, governments determine final costs through taxes, subsidies, and regulatory frameworks. European leaders have long defended higher fuel taxes as tools for funding infrastructure and advancing climate goals, while U.S. policymakers have historically avoided significant increases due to political sensitivity.

As Garrett Golding has observed, gasoline prices tend to rise quickly and fall slowly—“like a falling feather”—with much of the profit concentrated upstream among producers and refiners rather than at retail stations. The takeaway is clear: relatively low U.S. gasoline prices are not accidental, but the result of deliberate policy choices, robust domestic production, and a sustained political preference for keeping fuel affordable.

— JBizNews Desk

Palantir Technologies Inc. (NASDAQ:PLTR) shares are up during Wednesday’s premarket session as the company has announced a significant partnership with the U.S. Department of Agriculture (USDA) to enhance support for farmers.

Palantir said this collaboration aims to modernize USDA services and improve agricultural security.

What Happened

Palantir has signed a $300 million Blanket Purchase Agreement with the USDA to support the National Farm Security Action Plan. This initiative focuses on modernizing service delivery for farmers and enhancing food supply security, reflecting the company’s commitment to leveraging technology for national agricultural resilience.

“America depends on its farmers, and USDA is moving fast to give them the technology they need,” said Ali Monfre, Federal Engineering Lead at Palantir. “They are raising the bar for what government can deliver for farmers, and we are honored to partner in that work.”

Technical Analysis

Palantir is currently trading within its 52-week range, with a high of $207.52 and a low of $89.31, suggesting it is positioned …

Full story available on Benzinga.com

This post was originally published here

On CNBC’s “Halftime Report Final Trades,” Joshua Brown, co-founder and CEO of Ritholtz Wealth Management, named eBay Inc. (NASDAQ:EBAY) as his final trade.

Supporting his view, BofA Securities analyst Justin Post, on Tuesday, raised the price target on the stock from $102 to $110, while Cantor Fitzgerald analyst Deepak Mathivanan increased the price target from $90 to $100.

Rob Sechan, CEO of NewEdge Wealth, picked ServiceNow, Inc. (NYSE:NOW) ahead of quarterly earnings.

ServiceNow is expected to release earnings results for the first quarter, after the closing bell on Wednesday. Analysts expect the company to report quarterly earnings at 97 cents …

Full story available on Benzinga.com

This post was originally published here

Feeling safe is more than a state of mind; it is the foundation of freedom for countless women around the country. Without the confidence to move freely, women tend to limit their activities, change when and where they travel and curtail their social interactions. For some women, a lack of personal safety can be paralyzing, preventing them from living a full and independent life.

That is particularly true among women between the ages of 18 and 25. A recent survey by LogicMark, Inc. (OTC:LGMK), a leading provider of personal emergency response systems and developer of the Aster safety app, found that 44% of women between the ages of 18 and 25 reported moderate to significant limitations to their lives due to safety concerns. That includes avoiding routes, activities, travel and social events. Overall, 38% of women surveyed said safety concerns limit their daily activities. These concerns can quietly shape careers, fitness and social choices. After all, women may forgo pursuing a specific field because of late-night shifts or travel requirements, opt not to jog out of safety concerns and skip evening social events if it means traveling home alone.

Over time, everyday decisions compound into something much larger: a gradual erosion of mobility, independence and overall quality of life. When safety anxiety consistently dictates where someone can go, when they can leave or how they get home, it limits not just …

This post was originally published here

Best Buy (NYSE:BBY) shares are up during Wednesday’s premarket session as the company announced a leadership transition plan.

Jason Bonfig will succeed Corie Barry as CEO, following her planned departure at the end of the third quarter.

The leadership change comes as Barry, the “second-longest tenured” CEO in Best Buy’s history, prepares to step down on October 31.

Bonfig has been with the company since 1999. He currently oversees key areas such as merchandising and e-commerce, is expected to drive growth and innovation moving forward.

“I’ve worked closely with Jason for many years and can confidently say he’s the right person, with the right vision, to accelerate the company’s strategy and take Best Buy into the future,” Barry said.

Technical Analysis

Best Buy is currently trading near the upper end of its 52-week range, suggesting a strong position in the market. The stock is trading 6.7% above its 20-day simple moving average (SMA) and 1% above its 100-day SMA, indicating short-term strength while still facing resistance at higher levels.

The 50-day SMA is below the 20-day …

Full story available on Benzinga.com

This post was originally published here

Job satisfaction has fallen to a record low in the United States, according to the New York Federal Reserve’s SCE Labor Market Survey released on Tuesday, with workers reporting the weakest appetite for switching employers since 2021.

The share of workers expecting to move to a new employer fell to 9.7%, the lowest in five years. Satisfaction with wage compensation and promotion opportunities both hit their lowest levels since the survey began in 2014.

The number actively searching for a job also slipped, declining to 22.5% from 23.8% in November 2025, with the steepest pullback among workers under 45 and women.

Nowhere To Go

Workers without a college degree drove the pullback in job mobility. Yet workers are not willing to move cheaply. The average reservation wage rose to a series high of $84,762 in March, the largest increases coming …

Full story available on Benzinga.com

This post was originally published here

Top Wall Street analysts changed their outlook on these top names. For a complete view of all analyst rating changes, including upgrades, downgrades and initiations, please see our analyst ratings page.

  • BMO Capital analyst Andrew Bauch initiated coverage on Chime Financial Inc (NASDAQ:CHYM) with an Outperform rating and announced a price target of $30. Chime Financial shares closed at $23.43 on Tuesday. See how other analysts view this stock.
  • Compass Point analyst Michael Donovan initiated coverage on SharonAI Holdings Inc (NASDAQ:SHAZ) with a Buy rating and announced a price target of $50. SharonAI shares …

Full story available on Benzinga.com

This post was originally published here

U.S. trade representative Jamieson Greer has proposed that allies pay a premium on minerals sourced from a proposed group of reliable trading partners, including Europe, to break China’s dominance.

Greer, in an interview with the Financial Times on Wednesday, attributed the Western reliance on China for key minerals to countries’ fixation on business costs.

In February, the U.S. proposed a bloc of countries that would trade critical minerals among themselves at agreed floor prices, ensuring mining and processing projects remain profitable and attractive for investment while reducing reliance on China-dominated supply chains.

To enforce this framework, the plan could involve imposing tariffs or other trade barriers on minerals from outside the group, particularly from China, to prevent low-cost producers from undercutting prices and discouraging Western investment

“There is a premium we pay, and I call it the national security premium, and we will all pay a national security premium to have a secure supply chain,” Greer, who is involved in drafting details of the plan, told the FT.

The proposal, however, has raised concerns among allies about higher costs and potential retaliation from China, underscoring the difficulty of countering …

Full story available on Benzinga.com

This post was originally published here

Tesla, Inc. (NASDAQ:TSLA) will release earnings for its first quarter after the closing bell on Wednesday, April 22.

Analysts expect the Austin, Texas-based company to report quarterly earnings of 30 cents per share, up from 27 cents per share in the year-ago period. The consensus estimate for Tesla’s quarterly revenue is $22.17 billion (it reported $19.34 billion last year), according to Benzinga Pro.

The company has beaten analyst estimates for revenue in three straight quarters and in four of the last 10 quarters overall.

Tesla shares fell 1.6% to close at $386.42 on Tuesday.

Benzinga readers can access the latest analyst ratings on the Analyst Stock Ratings page. Readers can sort by stock ticker, company name, analyst firm, rating change or other variables.

Let’s have a look at how Benzinga’s most-accurate …

Full story available on Benzinga.com

This post was originally published here

Top Wall Street analysts changed their outlook on these top names. For a complete view of all analyst rating changes, including upgrades, downgrades and initiations, please see our analyst ratings page.

  • BTIG analyst Vincent Caintic downgraded Synchrony Financial (NYSE:SYF) from Buy to Neutral. Synchrony Financial shares closed at $77.63 on Tuesday. See how other analysts view this stock.
  • B of A Securities analyst Koji Ikeda downgraded Gitlab Inc (NASDAQ:GTLB) from Buy to Neutral and slashed the price target from $58 to $27. GitLab …

Full story available on Benzinga.com

This post was originally published here

On Wednesday, Rogers Communications (TSX:RCI) discussed first-quarter financial results during its earnings call. The full transcript is provided below.

This content is powered by Benzinga APIs. For comprehensive financial data and transcripts, visit https://www.benzinga.com/apis/.

View the webcast at https://event.choruscall.com/mediaframe/webcast.html?webcastid=WsTsunZb

Summary

Rogers Communications reported strong Q1 2026 results with increased service revenue and adjusted EBITDA, reduced capex, improved free cash flow, and decreased debt leverage.

The company maintained industry-leading margins in wireless and cable, with positive net additions in wireless and retail Internet services.

Strategic initiatives included introducing new 5G plans, planning to complete the purchase of the remaining 25% minority interest in MLSE, and reducing capital spending by 30% to focus on debt reduction.

Rogers Communications expects free cash flow growth of $4.1 to $4.3 billion in 2026 and aims to maintain a lower capex run rate beyond 2026.

Management emphasized the importance of prudent capital management in a low-growth environment and criticized government policies that disincentivize investment.

Full Transcript

Paul Carpino (Vice President of Investor Relations)

Thank you Gaylene and good morning everyone and thank you for joining us today. I’m here with our President and Chief Executive Officer Tony Staffieri and our Chief Financial Officer Glenn Brandt. As a reminder, we will be holding our Annual General Meeting (AGM) this morning at 11:00am and you can pick up that webcast through the Investor Relations website. To accommodate the Annual General Meeting (AGM), this call will last approximately until 8:45, so we ask that you limit yourself to one question and a quick follow up so we can accommodate as many questions as possible. We will follow up with you on any other questions later today. Today’s discussion will include estimates and other forward looking information from which our actual results could differ. Please review the cautionary language in today’s earnings report and in our 2025 annual report regarding the various factors, assumptions and risks that could cause actual results to differ. With that, let me turn it over to Tony.

Tony Staffieri

Thank you Paul and good morning everyone. I’m pleased to report that Rogers delivered solid results in a very active first quarter. Service revenue and adjusted EBITDA were up, CapEx and CapEx intensity were notably down, free cash flow accelerated and debt leverage was further reduced. Wireless and retail Internet net adds were positive. We continued to deliver. Industry leading margins in both wireless and cable and media delivered strong top line growth and a significant improvement in EBITDA overall. This was another quarter of solid execution based on our clear disciplined Strategy. In wireless, Q1 is typically a quiet quarter. This year we saw aggressive wireless promotional activity from competitors driven by supply rather than demand. Heading into the quarter we expected the market would be flat year over year with no population growth and potentially no new net adds. We did not lead on pricing aggression. As we’ve stated before, our priority is and remains on financials. This is even more important in a low growth environment. We were intentional and decided to lead with our value propositions, notably the best 5G network, terrific multi line value, the most coverage with Rogers Satellite accelerated rewards with a Rogers Red Credit Card, exclusive access to the best sports and entertainment experiences with Rogers beyond the Seat along with competitive pricing as the quarter carried on, we saw increasing aggressive wireless promotional activity. In the second half of the quarter we decided to participate selectively and when we decided to match the competition on price, we saw that our brand and value proposition resonated strongly. We finished the quarter with 33,000 net adds and from a financials perspective we improved Q1 wireless margins by 40 basis points to 65% and maintained stable service revenue. Yesterday we introduced new 5G plans with new features to further strengthen our network differentiation and increased value. In cable, we applied the same disciplined approach. We delivered positive Internet loading with 7,000 retail net additions. Service revenue and adjusted EBITDA were both up 1%, but after adjusting for the sale of our data centers last year, both service revenue and EBITDA were up organically a solid 2%. We improved Q1 cable margins by 30 basis points to deliver industry leading margins of 58%. In media, we delivered strong results in what has historically been a seasonally soft quarter reflecting the benefit of our MLSE investment. The scale and profitability of our sports and media operations is impressive. Revenue in Q1 was up 82% to just under $1 billion. Adjusted EBITDA was at break even largely as a result of the timing of rights fees, but nonetheless a $60 million year over year improvement. 2026 will be a transformative year for sports and media. We expect to complete the purchase of the remaining 25% minority interest in MLSE in the second half of this year. Following the close, we plan to combine our assets into one of the most significant sports ownership, media and entertainment entities globally. We are committed to unlocking the significant and unrecognized value with these premier sports assets and we will look to create additional revenue and EBITDA synergies. We plan to bring in external investors for a minority interesting in an entity we estimate will have a value in excess of $25 billion. We plan to use the proceeds from the sale of this minority interest to pay down debt. We believe these assets will provide long term growth opportunities and significant value even as we operate in the current low growth telecom business. Importantly, our sports assets operate with significantly lower CapEx commitment and we have a proven 25 year track record as strong operators of sports and media assets. Before turning the call over to Glenn, I want to touch on our capital reprioritization and increased free cash flow for 2026. In the current low growth environment, it is critical to prudently manage leverage and maintain our investment Grade balance sheet as we complete our major multi year investment cycle, we operate in a very capital intensive sector. Returns on investments can take years and sometimes even decades. This means we need government policies that reward investment and maintain certainty, especially in a slow growth environment. The government has introduced policies that do the opposite and this means we need to adjust our spending and be highly disciplined and deliberate stewards of of our capital. Today we announced a reduction in our capital spending by 30% versus last year. Our updated guidance range for CapEx is now 2.5 to $2.7 billion in 2026, translating to a capital intensity ratio of approximately 12%. Correspondingly, we expect free cash flow growth of 4.1 to $4.3 billion in 2026, an increase of approximately $800 million from last year. Given the macro environment, we are focusing on deleveraging our balance sheet. In Q1 we reduced our debt leverage ratio to 3.8 times, down another 10 basis points from 3.9 times at year end. With the additional free cash flow, we plan to accelerate debt reduction in 2026 and beyond. Overall, we are executing our plan with discipline in the current low growth telecom market and we are managing capital prudently. In this punitive regulatory environment, we are showing strong execution on capital efficiency and debt deleveraging as we move towards surfacing value by monetizing our sports and media asset portfolio. I want to thank our team for their terrific execution in the competitive environment and their ongoing focus on our key long term priorities. I’ll now turn the call over to Glenn.

Glenn Brandt (Chief Financial Officer)

Thank you Tony and good morning everyone. Thank you for joining us. As you’ve just heard from Tony, we have delivered strong results for the first quarter and with this morning’s report we are very substantially upgrading our 2026 full year guidance on capital expenditures and free cash flow. More on this momentarily. Let me first turn to the quarter. Against the backdrop of continued low growth and heightened competition for the sector, Rogers first quarter results are strong. Once again we delivered service revenue and EBITDA growth, margin expansion, capital expenditure reduction, free cash flow growth, positive wireless and Internet loading and additional delevering. And what’s more, each of our three businesses contributed positively to our results for the quarter. In wireless, service revenue was stable year over year and adjusted. EBITDA was up 1% driven by our continued focus on cost efficiencies, moving margin up by 40 basis points year over year to 65% for the quarter. In a highly competitive market with zero to low wireless revenue growth, our long standing track record for driving industry leading cost efficiencies and margins is even more critical and standout. We added 33,000 total mobile phone net additions in what is usually a seasonally quiet first quarter, including 28,000 net new postpaid subscribers, up 17,000 year over year and above our initial expectations. This past quarter was anything but seasonally quiet with our peers having continued their holiday level of discounting into 2026. Throughout the first quarter, throughout January and into February, we very deliberately opted not to discount our prices, seeking to restore sector pricing away from holiday level discounts. However, our competitors stayed with their aggressive discounting throughout the quarter and so we moved to selectively match their discounts with short time limited offers targeted to insulate our customer base from all of this. Our mobile phone Average Revenue Per User (ARPU) was 5560 for the quarter, down from last year by roughly $1.3 or 2.4%, and postpaid mobile phone churn of 1.22% was up by 21 basis points. Not surprisingly, in a seasonally quiet quarter, the discounts have only served to weaken performance metrics across the sector and are reflected in sector share price performance. With three quarters still to go in 2026, we are hopeful market competition will resettle around value for premium services rather than undisciplined discounting. Moving to cable, we once again delivered positive Internet subscriber net additions, grew service revenue and EBITDA and delivered industry leading margins. Cable service revenue and adjusted EBITDA were each up by 1% year over year, continuing the positive trend our team has delivered for several quarters now. Moreover, adjusting to exclude the impact of the December 2025 sale of our data center business, the organic growth for cable service revenue and adjusted EBITDA would have been plus 2% year over year. Our cable adjusted EBITDA margin in the first quarter increased to 58%, up 30 basis points year over year, consistently among the very best cable margins globally. And finally, retail Internet net additions of 7,000 reflected positive loading in a seasonally quiet but highly competitive quarter. Turning …

Full story available on Benzinga.com

This post was originally published here

(Editor’s note: The futures, ETFs data, earnings and headline were updated.)

U.S. stock futures rose on Wednesday following Tuesday’s decline. Futures of major benchmark indices were higher after President Donald Trump extended the Iran ceasefire.

On Tuesday, the Dow Jones index closed about 293 points lower after President Trump initially said that there would not be an extension to the Iran ceasefire and that Iranian negotiators have no choice but to come to an agreement.

Meanwhile, the 10-year Treasury bond yields stood at 4.286%, and the two-year bond was at 3.766% at the time of writing. The CME Group’s FedWatch tool‘s projections show markets pricing a 99.5% likelihood of the Federal Reserve leaving the current interest rates unchanged in April.

Index Performance (+/-)
Dow Jones 0.63%
S&P 500 0.62%
Nasdaq 100 0.79%
Russell 2000 0.88%

The SPDR S&P 500 ETF Trust (NYSE:SPY) and Invesco QQQ Trust ETF (NASDAQ:QQQ), which track the S&P 500 index and Nasdaq 100 index, respectively, were higher in premarket on Tuesday. The SPY was up 0.58% at $708.19, while the QQQ surged 0.69% to $648.79.

data-variant=”list”
data-news-mode=”manual”

>


Read Also:

Singapore’s Top Diplomat Warns Hormuz Is ‘Dry Run’ For Possible US-China Clash

This post was originally published here

OFG Bancorp (NYSE:OFG) reported upbeat earnings for the first quarter on Tuesday.

The company posted quarterly earnings of $1.26 per share which beat the analyst consensus estimate of $1.02 per share. The company reported quarterly sales of $185.800 million which beat the analyst consensus estimate of $166.544 million.

José Rafael Fernández, Chief Executive Officer, said, “Business momentum and disciplined strategy execution drove strong first quarter results, supported by proactive balance sheet management and core deposit strength. Our operating model continues to deliver, with ongoing loan growth, high quality credit performance, and consistent execution across the franchise. During the quarter, we repurchased $44.5 …

Full story available on Benzinga.com

This post was originally published here

JBizNews Desk | April 22, 2026

U.S. equity futures moved higher early Wednesday after President Donald Trump extended the ceasefire with Iran, reversing a two-day selloff on Wall Street fueled by concerns the truce would collapse without a diplomatic breakthrough.

S&P 500 futures climbed 0.55%, Nasdaq 100 futures advanced 0.73%, and Dow Jones Industrial Average futures gained roughly 207 points, or 0.44%, signaling a rebound in risk appetite following heightened geopolitical volatility.

The shift came after Trump announced Tuesday that the ceasefire would remain in place, pointing to what he described as a “seriously fractured” Iranian leadership and indicating negotiations could continue until Tehran presents a unified proposal. The move marked a reversal from his earlier stance, when he had signaled reluctance to extend the truce, injecting fresh uncertainty into markets earlier in the week.

Investors are now recalibrating expectations around energy markets and global growth. WTI crude pulled back to about $89.07 per barrel, down 0.67%, in early trading, as traders priced in a reduced risk of immediate supply disruption. The retreat follows a sharp spike in the prior session, when Brent crude briefly approached $98.50 per barrel, reflecting fears that escalating tensions could choke critical shipping lanes and trigger a broader energy shock.

Despite the relief rally, risks remain elevated. A continued U.S. naval blockade of Iranian ports has drawn sharp criticism from Tehran. Iran’s foreign minister has characterized the move as an “act of war,” underscoring the fragile nature of the ceasefire. Adding to tensions, an Iranian gunboat reportedly fired on a commercial container vessel near the Strait of Hormuz shortly after the extension was announced, highlighting the persistent threat to one of the world’s most critical energy corridors.

Market participants are closely watching whether diplomatic momentum can translate into sustained de-escalation. Any disruption in the Strait of Hormuz — through which roughly a fifth of global oil supply passes — could rapidly reverse the current pullback in crude prices and reignite inflationary pressures globally.


Premarket Movers — April 22, 2026

Gainers

Kyverna Therapeutics (NASDAQ: KYTX) surged more than 25% in premarket trading after the company reported positive clinical trial results for its lead cell therapy candidate, miv-cel, strengthening investor confidence in its autoimmune disease pipeline.

Adobe Inc. (NASDAQ: ADBE) rose over 2% after the company’s board approved a $25 billion share repurchase program running through April 2030, signaling confidence in long-term cash flow generation and capital return strategy.

United Airlines Holdings (NASDAQ: UAL) edged up about 1%, even after issuing weaker forward guidance. The carrier projected full-year 2026 adjusted earnings of $7 to $11 per share, down from prior guidance of $12 to $14. Second-quarter expectations of $1 to $2 per share also fell short of the $2.08 FactSet consensus, though first-quarter results exceeded analyst estimates.

Losers

Apple Inc. (NASDAQ: AAPL) remained under pressure after falling 2.52% in the prior session following the announcement that CEO Tim Cook will step down on September 1. Cook, 65, is set to transition to executive chairman, with Senior Vice President of Hardware Engineering John Ternus named as his successor. The leadership transition briefly pushed Apple’s market capitalization below the $4 trillion threshold.

Capital One Financial Corp. (NYSE: COF) declined after reporting first-quarter earnings of $4.42 per share on revenue of $15.23 billion, missing Wall Street estimates of $4.55 and $15.36 billion, respectively. Total net revenue fell 2% year-over-year, raising concerns about margin pressure in the consumer lending environment.


On Watch

Tesla Inc. (NASDAQ: TSLA) is set to report first-quarter 2026 earnings after the bell at 5:30 PM ET, with investors bracing for volatility. The company reported 358,023 vehicle deliveries, missing the 365,645 consensus estimate by roughly 7,600 units. Analysts note that Tesla shares have historically reacted sharply to earnings, with last year’s comparable release triggering a 12% overnight move.


Outlook

While the extension of the Iran ceasefire has temporarily stabilized markets, investors remain highly sensitive to geopolitical headlines. The interplay between diplomacy, energy prices, and inflation expectations is likely to drive near-term market direction.

A sustained easing in tensions could support equities and relieve pressure on central banks navigating persistent inflation risks. However, any renewed escalation — particularly involving shipping disruptions in the Persian Gulf — could quickly reverse gains and reintroduce volatility across global markets.

— JBizNews Desk

The global aluminum market is currently experiencing a significant “black swan” event due to disruptions caused by the ongoing conflict in the Middle East, said a top metal analyst.

“The scale of the supply shock we’re seeing in the aluminum market is probably the largest single supply shock a base metals market has suffered in the post-2000 era,” Nick Snowdon, Mercuria’s head of metals and mining research, told Reuters at the sidelines of the FT Commodities Global Summit in Lausanne on Tuesday.

The Middle East region contributes around 7 million metric tons of annual aluminum smelting capacity, which is nearly 9% of the estimated global supply for this year, according to Mercuria.

Mercuria told the publication that Middle East aluminum is hard to replace, with China capped on output and limited spare capacity in the U.S. and Europe, leaving them vulnerable to supply shocks.

data-variant=”banner”
data-news-mode=”manual”

This post was originally published here

International Business Machines Corporation (NYSE:IBM) will release earnings for its first quarter after the closing bell on Wednesday, April 22.

Analysts expect the Armonk, New York-based company to report quarterly earnings of $1.81 per share, up from $1.60 per share in the year-ago period. The consensus estimate for IBM’s quarterly revenue is $15.64 billion (it reported $14.54 billion last year), according to Benzinga Pro.

The company beat analyst estimates for revenue in five straight quarters and in eight of the last 10 quarters overall.

IBM shares gained 0.8% to close at $255.68 on Tuesday.

Benzinga readers can access the latest analyst ratings on the Analyst Stock Ratings page. Readers can sort by stock ticker, company name, analyst firm, rating change or other variables.

Let’s have a look at how Benzinga’s most-accurate

Full story available on Benzinga.com

This post was originally published here

American Express Company (NYSE:AXP) will release earnings for its first quarter before the opening bell on Thursday, April 23.

Analysts expect the company to report quarterly earnings of $3.99 per share. That’s up from $3.64 per share in the year-ago period. The consensus estimate for American Express quarterly revenue is $18.61 billion (it reported $16.97 billion last year), according to Benzinga Pro.

Ahead of quarterly earnings, a Morgan Stanley analyst on April 16 maintained American Express at an Equal-Weight rating and cut the price target from $395 to $385.

With the recent buzz around American Express, some investors may be eyeing potential gains from the company’s dividends too. As of now, American Express has an annual dividend yield of 1.15%, which is a quarterly dividend amount of 95 cents per share ($3.80 a year).

To figure out how to earn $500 monthly from American Express, we …

Full story available on Benzinga.com

This post was originally published here

Beyond Meat Inc. (NASDAQ:BYND) shares surged Wednesday morning. The move follows a volatile Tuesday session. Retail traders are again targeting heavily shorted equities.

Short Squeeze Dynamics In Play

Short interest in the plant-based protein company climbed. Data shows a rise from 133.53 million to 141.73 million shares. This represents 30.82% of the company’s publicly available float.

Current trading volume averages 26.97 million shares per day. At this pace, short sellers need 5.25 days to cover positions.

Meme-Stock Momentum Returns

The stock is joining a broader meme basket narrative. Traders are focusing on names with structural …

Full story available on Benzinga.com

This post was originally published here

U.S. stock futures were higher this morning, with the Dow futures gaining around 250 points on Wednesday.

Shares of Sonoco Products Co (NYSE:SON) fell sharply in pre-market trading after the company reported worse-than-expected first-quarter financial results.

Sonoco reported quarterly earnings of $1.20 per share which missed the analyst consensus estimate of $1.21 per share. The company reported quarterly sales of $1.676 billion which missed the analyst consensus estimate of $1.713 billion.

Sonoco Products shares dipped 5.7% to $53.55 in pre-market trading.

Here …

Full story available on Benzinga.com

This post was originally published here

In today’s rapidly evolving and fiercely competitive business landscape, it is crucial for investors and industry analysts to conduct comprehensive company evaluations. In this article, we will undertake an in-depth industry comparison, assessing Apple (NASDAQ:AAPL) alongside its primary competitors in the Technology Hardware, Storage & Peripherals industry. By meticulously examining crucial financial indicators, market positioning, and growth potential, we aim to provide valuable insights to investors and shed light on company’s performance within the industry.

Apple Background

Apple is among the largest companies in the world, with a broad portfolio of hardware and software products targeted at consumers and businesses. Apple’s iPhone makes up a majority of the firm sales, and Apple’s other products like Mac, iPad, and Watch are designed around the iPhone as the focal point of an expansive software ecosystem. Apple has progressively worked to add new applications, like streaming video, subscription bundles, and augmented reality. The firm designs its own software and semiconductors while working with subcontractors like Foxconn and TSMC to build its products and chips. Slightly less than half of Apple’s sales come directly through its flagship stores, with a majority of sales coming indirectly through partnerships and distribution.

Company P/E P/B P/S ROE EBITDA (in billions) Gross Profit (in billions) Revenue Growth
Apple Inc 33.69 44.31 9.12 52.0% $54.07 $69.23 15.65%
Western Digital Corp 36.28 18.30 13.21 27.66% $2.11 $1.38 25.24%
Seagate Technology Holdings PLC 63.27 273.27 12.36 299.49% $0.85 $1.18 21.51%
Everpure Inc 125.76 15.81 6.48 7.04% $0.15 $0.74 20.35%
NetApp Inc 18.76 19.05 3.38 31.16% $0.51 $1.21 4.39%
Super Micro Computer Inc 20.75 2.44 0.66 5.93% $0.55 $0.8 123.36%
Logitech International SA 20.58 6.16 3.07 11.36% $0.31 $0.61 6.06%
Diebold Nixdorf Inc 33.27 2.67 0.83 4.49% $0.11 $0.28 11.66%
Turtle Beach Corp 15.05 1.77 0.74 14.73% $0.02 $0.05 -18.69%
Immersion Corp 11.12 0.70 0.13 3.98% $0.06 $0.14 5.51%
Average 38.32 37.8 4.54 45.09% $0.52 $0.71 22.15%

Full story available on Benzinga.com

This post was originally published here

Amidst the fast-paced and highly competitive business environment of today, conducting comprehensive company analysis is essential for investors and industry enthusiasts. In this article, we will delve into an extensive industry comparison, evaluating Airbnb (NASDAQ:ABNB) in comparison to its major competitors within the Hotels, Restaurants & Leisure industry. By analyzing critical financial metrics, market position, and growth potential, our objective is to provide valuable insights for investors and offer a deeper understanding of company’s performance in the industry.

Airbnb Background

Airbnb is the world’s largest online alternative accommodation travel agency; it also offers booking services for boutique hotels, experiences, and hotel-like services. Airbnb’s platform offers over 9 million active accommodation listings. Listings from the company’s 5 million-plus hosts are spread over almost every country in the world. In 2025, 42% of revenue was from North America, 39% from Europe, the Middle East, and Africa, 10% from Latin America, and 9% from Asia-Pacific. Transaction fees for online bookings account for all its revenue.

Company P/E P/B P/S ROE EBITDA (in billions) Gross Profit (in billions) Revenue Growth
Airbnb Inc 35.40 10.43 7.26 4.06% $0.27 $2.29 12.02%
Royal Caribbean Group 17.39 7.25 4.15 7.49% $1.57 $2.02 13.21%
Carnival Corp 12.05 2.91 1.44 2.04% $1.27 $2.23 6.11%
Viking Holdings Ltd 31.64 33.16 5.58 31.67% $0.45 $0.71 27.76%
Expedia Group Inc 27.91 26.13 2.45 15.64% $0.59 $3.2 11.4%
Norwegian Cruise Line Holdings Ltd 21.01 3.98 0.94 0.65% $0.55 $0.92 6.4%
Choice Hotels International Inc 15.22 30.50 3.51 38.3% $0.12 $0.21 0.1%
Hilton Grand Vacations Inc 54.38 3.05 0.88 3.59% $0.25 $2.34 3.82%
Global Business Travel Group Inc 28.18 2.02 1.12 5.29% $0.14 $0.45 34.01%
Average 25.97 13.62 2.51 13.08% $0.62 $1.51 12.85%

Full story available on Benzinga.com

This post was originally published here

In the fast-paced and cutthroat world of business, conducting thorough company analysis is essential for investors and industry experts. In this article, we will undertake a comprehensive industry comparison, evaluating Adobe (NASDAQ:ADBE) in comparison to its major competitors within the Software industry. By analyzing crucial financial metrics, market position, and growth potential, our objective is to provide valuable insights for investors and offer a deeper understanding of company’s performance in the industry.

Adobe Background

Adobe provides content creation, document management, and digital marketing and advertising software and services to creative professionals and marketers for creating, managing, delivering, measuring, optimizing, and engaging with compelling content multiple operating systems, devices, and media. The company operates with three segments: digital media content creation, digital experience for marketing solutions, and publishing for legacy products (less than 5% of revenue).

Company P/E P/B P/S ROE EBITDA (in billions) Gross Profit (in billions) Revenue Growth
Adobe Inc 14.40 8.74 4.25 16.39% $2.66 $5.73 11.97%
Palantir Technologies Inc 231.70 47.26 83.67 8.71% $0.58 $1.19 70.0%
AppLovin Corp 47.13 74.54 29.52 61.09% $1.34 $1.47 65.88%
Salesforce Inc 23.99 2.59 4.31 3.26% $3.27 $8.69 12.09%
Intuit Inc 26.34 5.88 5.67 3.61% $1.14 $3.61 17.36%
Cadence Design Systems Inc 80.26 16.43 16.81 7.27% $0.59 $1.25 6.2%
Synopsys Inc 71.77 2.93 10.18 0.22% $0.69 $1.77 65.52%
Autodesk Inc 46.94 17.01 7.32 10.64% $0.58 $1.79 19.4%
Datadog Inc 417.06 12.26 13.71 1.3% $0.08 $0.77 29.21%
Roper Technologies Inc 25.56 1.87 4.97 2.15% $0.86 $1.43 9.67%
Workday Inc 49.87 4.25 3.63 1.74% $0.39 $1.92 14.52%
Zoom Communications Inc 14.72 2.73 5.74 7.06% $0.28 $0.95 5.31%
PTC Inc 20.76 4.36 5.94 4.34% $0.25 $0.57 21.36%
Trimble Inc 39.19 2.74 4.64 2.69% $0.25 $0.7 -1.38%
IREN Ltd 31.36 5.97 17.79 -5.77% $-0.23 $0.11 59.02%
Tyler Technologies Inc 47.42 3.91 6.41 1.79% $0.12 $0.26 6.29%
HubSpot Inc 267.98 5.88 3.92 2.78% $0.1 $0.71 20.42%
Guidewire Software Inc 63.82 7.90 9.18 3.95% $0.08 $0.23 24.05%
Average 88.58 12.85 13.73 6.87% $0.61 $1.61 26.17%

Full story available on Benzinga.com

This post was originally published here

In the fast-paced and cutthroat world of business, conducting thorough company analysis is essential for investors and industry experts. In this article, we will undertake a comprehensive industry comparison, evaluating Analog Devices (NASDAQ:ADI) in comparison to its major competitors within the Semiconductors & Semiconductor Equipment industry. By analyzing crucial financial metrics, market position, and growth potential, our objective is to provide valuable insights for investors and offer a deeper understanding of company’s performance in the industry.

Analog Devices Background

Analog Devices is a leading analog, mixed-signal, and digital-signal processing chipmaker. The firm has a significant market share lead in converter chips, which are used to translate analog signals to digital and vice versa. The company serves tens of thousands of customers; more than half of its chip sales are to industrial and automotive end markets. ADI’s chips are also incorporated into wireless infrastructure equipment.

Company P/E P/B P/S ROE EBITDA (in billions) Gross Profit (in billions) Revenue Growth
Analog Devices Inc 68.61 5.42 15.80 2.46% $1.52 $2.04 30.42%
NVIDIA Corp 40.79 30.88 22.69 31.11% $51.28 $51.09 73.21%
Broadcom Inc 78.40 23.84 28.66 9.12% $11.15 $13.16 29.47%
Micron Technology Inc 21.21 6.99 8.76 21.0% $18.48 $17.75 196.29%
Advanced Micro Devices Inc 109 7.36 13.44 2.44% $2.86 $5.58 34.11%
Texas Instruments Inc 42.78 13.04 12.04 7.03% $2.07 $2.47 10.38%
Qualcomm Inc 27.33 6.27 3.31 13.57% $4.11 $6.68 5.0%
Marvell Technology Inc 49.29 9.25 16.06 2.79% $0.75 $1.15 22.08%
Monolithic Power Systems Inc 118.81 21.25 26.45 4.95% $0.21 $0.41 20.83%
NXP Semiconductors NV 28.24 5.64 4.65 4.53% $0.98 $1.81 7.2%
ON Semiconductor Corp 299.69 4.45 5.97 2.33% $0.45 $0.55 -11.17%
Astera Labs Inc 157.35 23.96 40.43 3.41% $0.07 $0.2 91.77%
GLOBALFOUNDRIES Inc 37.26 2.73 4.87 1.68% $0.73 $0.51 0.0%
Credo Technology Group Holding Ltd 100.73 18.29 31.88 10.03% $0.16 $0.28 201.49%
Tower Semiconductor Ltd 111.48 8.36 15.69 2.78% $0.2 $0.12 13.69%
MACOM Technology Solutions Holdings Inc 129.28 15.84 20.98 3.64% $0.07 $0.15 24.52%
First Solar Inc 13.13 2.10 3.84 5.62% $0.7 $0.67 11.15%
Lattice Semiconductor Corp 5849 22.42 30.90 -1.08% $0.01 $0.1 24.16%
Rambus Inc 61.86 10.35 20.15 4.81% $0.09 $0.15 18.09%
Average 404.2 12.95 17.26 7.21% $5.24 $5.71 42.9%

Full story available on Benzinga.com

This post was originally published here

In today’s rapidly changing and highly competitive business world, it is vital for investors and industry enthusiasts to carefully assess companies. In this article, we will perform a comprehensive industry comparison, evaluating Automatic Data Processing (NASDAQ:ADP) against its key competitors in the Professional Services industry. By analyzing important financial metrics, market position, and growth prospects, we aim to provide valuable insights for investors and shed light on company’s performance within the industry.

Automatic Data Processing Background

ADP is a global technology company providing cloud-based human capital management solutions, enabling clients to better implement payroll, talent, time, tax, and benefits administration. Additionally, ADP provides human resources outsourcing solutions that permit customers to offload some of their traditional HR tasks. The company operates through two segments: employer services and professional employer organization services. Employer services consist of the company’s HCM products as well as a la carte HRO solutions. PEO services contain ADP’s comprehensive HRO solution, where it acts as a co-employer with its customer. As of fiscal 2025, ADP serves over 1.1 million clients and pays over 42 million workers across 140 countries.

Company P/E P/B P/S ROE EBITDA (in billions) Gross Profit (in billions) Revenue Growth
Automatic Data Processing Inc 19.49 12.78 3.89 16.64% $1.65 $2.47 6.16%
Paychex Inc 20.68 8.36 5.34 14.2% $0.92 $1.38 19.87%
Paycom Software Inc 16.14 3.59 3.57 6.61% $0.21 $0.46 10.2%
Paylocity Holding Corp 24.38 5.08 3.45 4.56% $0.1 $0.28 10.39%
Korn Ferry 13.28 1.73 1.22 3.27% $0.12 $0.64 7.17%
Robert Half Inc 21.74 2.32 0.54 2.48% $0.04 $0.49 -5.79%
Trinet Group Inc 12.68 34.65 0.40 -1.22% $0.03 $0.17 -2.27%
Upwork Inc 13.18 2.29 1.98 2.48% $0.04 $0.15 3.62%
Barrett Business Services Inc 14.53 3.08 0.64 6.82% $0.02 $0.07 5.35%
Kforce Inc 16.93 4.86 0.44 4.02% $0.01 $0.09 -3.42%
Fiverr International Ltd 18.79 0.92 0.91 2.83% $0.04 $0.09 3.38%
Mastech Digital Inc 129.10 0.86 0.40 1.1% $0.0 $0.01 -10.42%
Average 27.4 6.16 1.72 4.29% $0.14 $0.35 3.46%

Full story available on Benzinga.com

This post was originally published here

Transportation Secretary Sean Duffy has touted the revamped Air Traffic Control system in the U.S. aviation sector, sharing that the Donald Trump administration was retiring dated technology amid its modernization program.

Leaps And Bounds Of Progress

In a post on the social media platform X on Tuesday, the White House’s Rapid Response handle posted a video of Duffy’s interview with Fox News, where the Transportation Secretary showcased how the revamp had made paper flight strips, which contain information like flight name, destination, assigned altitude and more, obsolete.

He showcased how the revamp efforts had made floppy disks redundant. He also slammed previous administrations for failing to build out new systems despite promising to do so. “In six-and-a-half months, we have made leaps and bounds of progress in building out this new [air traffic control] system,” Duffy said, outlining the original date when he’d appealed for funds to modernize the air traffic control system.

Duffy also outlined needing additional …

Full story available on Benzinga.com

This post was originally published here

Robinhood Markets Inc. (NASDAQ:HOOD) stock saw a sharp surge in its momentum score, jumping from 15.45 to 77.07 on a week-over-week basis.

A momentum score is a metric used to gauge how strongly a stock’s price is trending over time by analyzing recent price movements and trading volume, reflecting the strength of its current market trend.

SEC Ends $25,000 Day-Trading Limit

The U.S. Securities and Exchange Commission approved FINRA-proposed changes that removed the Pattern Day Trader rule, including the $25,000 minimum equity requirement and related trading classification.

Previously, accounts under $25,000 were limited to four day trades within five business days, but that restriction had been eliminated under the new framework.

The updated system shifted to real-time, risk-based margin requirements that applied to all investors.

Regulators also said public feedback strongly supported the overhaul.

Robinhood’s Chief Brokerage Officer Steve Quirk called the update a major step forward for retail investors, while Webull’s group president Anthony Denier had described the reforms as long overdue.

The change was expected to boost trading activity and engagement across retail platforms, supporting revenue tied to trading volume.

Benzinga’s Edge Stock Rankings

Full story available on Benzinga.com

This post was originally published here

The most oversold stocks in the industrials sector presents an opportunity to buy into undervalued companies.

The RSI is a momentum indicator, which compares a stock’s strength on days when prices go up to its strength on days when prices go down. When compared to a stock’s price action, it can give traders a better sense of how a stock may perform in the short term. An asset is typically considered oversold when the RSI is below 30, according to Benzinga Pro.

Here’s the latest list of major oversold players in this sector, having an RSI near or below 30.

Northrop Grumman Corp (NYSE:NOC)

  • On April 21, Northrup Grumman reaffirmed its FY26 adjusted EPS guidance below estimates and its FY26 sales guidance with its midpoint below estimates. The company’s stock fell around 10% over the past five days and has a 52-week low of $450.13.
  • RSI Value: 25.9
  • NOC Price Action: Shares of Northrop Grumman fell 7% to close …

Full story available on Benzinga.com

This post was originally published here

Wastewater discharge from Elon Musk-led Tesla Inc.‘s (NASDAQ:TSLA) Texas Lithium refinery reportedly contains toxic metals despite securing a discharge approval and compliance from the Texas Commission on Environmental Quality (TCEQ).

Arsenic, Carcinogens In Wastewater

On Tuesday, Electrek reported that the Nueces County Drainage District No. 2, which is responsible for managing the wastewater released by the refinery, released a cease-and-desist letter after independent lab testing conducted by Eurofins Environment Testing found traces of hexavalent chromium, which is a known carcinogen, alongside traces of arsenic and elevated levels of lithium. The ditch receives over 23,1000 gallons of water daily.

Tesla, Nueces County and Eurofins didn’t immediately respond to Benzinga‘s request for comment.

Lab testing found 0.0104 mg/L of Hexavalent Chromium, which is the same substance from the famed Erin Brokovich case, the report said, while over 0.0025 mg/L of Arsenic was also detected. Notably, the report says that the …

Full story available on Benzinga.com

This post was originally published here

As of April 22, 2026, two stocks in the materials sector could be flashing a real warning to investors who value momentum as a key criteria in their trading decisions.

The RSI is a momentum indicator, which compares a stock’s strength on days when prices go up to its strength on days when prices go down. When compared to a stock’s price action, it can give traders a better sense of how a stock may perform in the short term. An asset is typically considered overbought when the RSI is above 70, according to Benzinga Pro.

Here’s the latest list of major overbought players in this sector.

Steel Dynamics Inc (NASDAQ:STLD)

  • On April 20, Steel Dynamics reported better-than-expected first-quarter sales results. “The teams executed well, delivering a strong first …

Full story available on Benzinga.com

This post was originally published here

Psyence Biomedical Ltd (NASDAQ:PBM) shares are trading lower in Wednesday’s premarket session. Nasdaq futures are up 0.71% while S&P 500 futures have gained 0.56%.

Investors Pivot to Profit-Taking

The stock is currently experiencing a sharp reversal after soaring over 250% on Thursday. This massive rally was triggered by news that the White House is preparing an executive order to promote research into ibogaine. Investors appear to be engaging in profit-taking after the stock’s recent vertical climb.

Trump Executive Order Boosts Sector

The rally was sparked by President Donald Trump signing an executive order to accelerate mental illness treatments. The order specifically targets faster reviews for psychedelic drugs and includes a reported $50 million commitment for ibogaine research.

Full story available on Benzinga.com

This post was originally published here

During times of turbulence and uncertainty in the markets, many investors turn to dividend-yielding stocks. These are often companies that have high free cash flows and reward shareholders with a high dividend payout.

Benzinga readers can review the latest analyst takes on their favorite stocks by visiting Analyst Stock Ratings page. Traders can sort through Benzinga’s extensive database of analyst ratings, including by analyst accuracy.

Below are the ratings of the most accurate analysts for three high-yielding stocks in the utilities sector.

Alliant Energy Corp (NASDAQ:LNT)

  • Dividend Yield: 3.01%
  • BMO Capital analyst James Thalacker maintained an Outperform rating and raised the price target from $78 to $79 on April 17, 2026. This analyst has an accuracy rate of 79%
  • Barclays analyst Nicholas Campanella maintained an Equal-Weight rating and increased the price target from $67 to $74 on April 15, 2026. This analyst has an accuracy rate of 70%.
  • Recent News: Alliant Energy said it will release its first quarter earnings on Thursday, …

Full story available on Benzinga.com

This post was originally published here

With U.S. stock futures trading higher this morning on Wednesday, some of the stocks that may grab investor focus today are as follows:

  • Wall Street expects Tesla Inc (NASDAQ:TSLA) to report quarterly earnings at 37 cents per share on revenue of $22.71 billion after the closing bell, according to data from Benzinga Pro. Tesla shares rose 0.7% to $388.99 in after-hours trading.
  • Capital One Financial Corp. (NYSE:COF) reported downbeat first-quarter results after Tuesday’s closing bell. Capital One reported quarterly earnings of $4.42 per share, which missed the Street estimate of $4.55, according to Benzinga Pro data. Quarterly revenue of $15.23 billion missed the consensus …

Full story available on Benzinga.com

This post was originally published here

Anthony Scaramucci, founder of global investment firm SkyBridge Capital, explained how the “power of compounding” is key to building wealth.

Scaramucci’s $10K Versus Penny 30-Day Face-Off

In a post on X on Tuesday, Scaramucci presented the showdown between “$10,000 per day or a magic penny that doubles every day” for 30 days.

While the fixed cash amount ($300,000) looks attractive, the penny has exploded to be worth $5.4 million over the past 30 days. “That’s compounding,” Scaramucci wrote, “and that’s why I teach this to every young person I meet.”

Full story available on Benzinga.com

This post was originally published here

Shares of Kyverna Therapeutics Inc (NASDAQ:KYTX) rose sharply in pre-market trading after releasing positive registrational trial results for miv-cel in stiff person syndrome at the American Academy of Neurology Annual Meeting in Chicago.

Miv-cel, the single-dose CAR T-cell therapy met its primary endpoint, delivering a statistically significant 46% median improvement in the Timed 25-Foot Walk at 16 weeks.

Kyverna Therapeutics shares jumped 25.8% to $12.21 in pre-market trading.

Here are some other stocks moving in pre-market trading.

Gainers

  • Huachen AI Parking Mgmt Tech Hldg Co Ltd (NASDAQ:HCAI) gained 97% to $13.37 in pre-market trading after gaining more than 23% on Tuesday.
  • eLong Power Holding Ltd (NASDAQ:ELPW) gained 42.1% to $2.23 in pre-market trading after falling 9% on Tuesday.
  • AlphaTON Capital Corp (NASDAQ:ALP) rose 35.4% to $0.38 in pre-market trading.
  • FST Ltd (NASDAQ:KBSX) jumped 30.4% to $0.37 in pre-market trading. FST announced preliminary 31% FY 2025 revenue increase from $36.5 million to $47.97 million.
  • Aspire Biopharma Holdings Inc (NASDAQ:ASBP) rose 19.2% to $0.23 in pre-market trading …

Full story available on Benzinga.com

This post was originally published here

Teleflex Inc. (NYSE:TFX) shares jumped 8.22% to $135.00 in pre-market session on Wednesday, after private equity firms CVC Capital Partners and GTCR submitted a joint bid to take the medical device maker private.

The offer is currently under evaluation, and there is no certainty that a deal will be finalized, Reuters reported, citing a source.

TFX closed the regular session down 5.46% at $124.75, according to Benzinga Pro data.

CVC Capital Partners and GTCR did not immediately respond to Benzinga’s request for comment.

Activist Pressure Preceded The Approach

The bid follows criticism from activist investor Irenic Capital Management, which in March pressured Teleflex’s board for resisting engagement with potential acquirers.

CVC On An Acquisition Spree In 2026

Amsterdam-listed CVC has been highly active in early …

Full story available on Benzinga.com

This post was originally published here

Coinbase Global Inc.‘s (NASDAQ:COIN) advisory board on quantum computing released its first paper on Tuesday, detailing which parts of cryptocurrency security a future quantum machine could threaten and why the industry should begin upgrades now.

Coinbase Advocates Early Quantum Preparedness

The board, consisting of leading researchers from Stanford, UT Austin and the Ethereum (CRYPTO: ETH) Foundation, expressed “high confidence” that a quantum computer capable of breaking cryptography that secures digital assets will be built eventually, even if that capability doesn’t exist yet.

“The board’s view is straightforward: the time to start preparing is now, not when it’s urgent,” the Coinbase blog read.

Vulnerable Spots

The paper draws a line between network-level components and user-level key exposure, saying the biggest weak spot is the digital signatures used to prove ownership.

It added that Bitcoin’s mining process, hashing, and the immutability of prior blocks are not “meaningfully threatened” by quantum attacks.

For Bitcoin, the board estimated about 6.9 million BTC …

Full story available on Benzinga.com

This post was originally published here

Singapore’s Foreign Minister Vivian Balakrishnan said Wednesday that rising tensions in the Strait of Hormuz could serve as a “dry run” for a potential conflict between the United States and China in the Pacific, highlighting the growing strategic importance of global maritime chokepoints.

“What you’re witnessing now in the Strait of Hormuz is just a dry run … The biggest variable is not just what happens in the Middle East, but what happens in the Pacific,” Balakrishnan said at CNBC’s CONVERGE LIVE event in Singapore.

Singapore To ‘Refuse To Choose

When asked if the city-state was under pressure from the U.S. and China to choose between them, Balakrishnan reiterated that Singapore will not align exclusively with either Washington or Beijing despite deep …

Full story available on Benzinga.com

This post was originally published here

OpenAI CEO Sam Altman criticized the cybersecurity marketing strategy of rival company, Anthropic for its newly launched cybersecurity product, Claude Mythos.

During a Core Memory podcast interview where he appeared alongside OpenAI President Greg Brockman on Tuesday, Altman called the tactic “fear-based marketing” aimed at restricting the dissemination of artificial intelligence (AI) technology to a select few, reported Tech Crunch.

“You can justify that in a lot of different ways,” said Altman.

Altman further used a metaphor to illustrate his point, likening Anthropic’s strategy to selling a bomb shelter while threatening to drop a bomb.

‘We have built a bomb, we are about to drop it on your head. We will sell you a bomb shelter for $100 million,” he added.

data-variant=”banner”
data-news-mode=”manual”

>


Read Also:

Trump …

This post was originally published here

Trump Media & Technology Group (NASDAQ:DJT) appointed Kevin McGurn as its interim Chief Executive Officer on Tuesday, succeeding former congressman Devin Nunes, who has led the Truth Social parent since 2022.

McGurn, a seasoned executive with past roles at Hulu, Vevo, and T-Mobile US Inc. (NASDAQ:TMUS), has been advising Trump Media since December 2024. 

In a statement, McGurn said the company is “poised to take off.” He added that Truth Social embodies President Donald Trump‘s distinctive vision and represents an exceptionally powerful and influential brand and voice.

Meanwhile, Nunes, in a statement on Truth Social, expressed his faith in McGurn’s leadership, highlighting his extensive experience in media, mergers, and acquisitions.

Nunes also noted that his exit from the CEO role at TMTG will enable him to concentrate on his position as Chairman of the President’s Intelligence Advisory Board and other ventures.

Trump Media & Technology did not explain the …

Full story available on Benzinga.com

This post was originally published here

AGNC Investment (NASDAQ:AGNC) released first-quarter financial results and hosted an earnings call on Tuesday. Read the complete transcript below.

This transcript is brought to you by Benzinga APIs. For real-time access to our entire catalog, please visit https://www.benzinga.com/apis/ for a consultation.

View the webcast at https://edge.media-server.com/mmc/p/nsj4s5pg/

Summary

AGNC Investment Corp reported a comprehensive loss of $0.18 per common share in Q1 2026, with an economic return on tangible common equity of negative 1.6%.

The company highlighted increased geopolitical and macroeconomic risks, leading to widened mortgage-backed securities (MBS) spreads, but noted that agency MBS outperformed US Treasuries and investment-grade corporate bonds.

AGNC Investment Corp maintained a leverage of 7.4 times tangible equity, with liquidity of $7 billion in unencumbered cash and agency MBS.

The management expressed optimism about the attractive return profile of agency MBS at current spread levels and highlighted improved demand and supply outlooks.

The company executed $401 million in common equity issuance through an at-the-market offering program, emphasizing its strategy to manage capital actively and generate accretion for stockholders.

AGNC Investment Corp remains cautiously optimistic about the future outlook, with expectations of favorable conditions for agency MBS and potential actions by the administration to improve housing affordability.

Full Transcript

OPERATOR

Good morning and welcome to the AGNC Investment Corp. First quarter 2026 shareholder call. All participants will be in listen only mode. Should you need assistance, please signal a conference specialist by pressing the star key followed by zero. After today’s presentation there will be an opportunity to ask questions. To ask a question, you may press Star then one on your touchtone phone. To withdraw your question, please press Star then two. Please note this event is being recorded. I would now like to turn the conference over to Katie Turlington in Investor Relations. Please go ahead.

Katie Turlington (Investor Relations)

Thank you all for joining AGNC Investment Corp’s first quarter 2026 earnings call. Before we begin, I’d like to review the safe Harbor Statement. This conference call and corresponding slide presentation contain statements that, to the extent they are not recitations of historical fact, constitute forward looking statements within the meaning of the Private Securities Litigation Reform act of 1995. All such forward looking statements are intended to be subject to the safe harbor protection provided by the Reform Act. Actual outcomes and results could differ materially from those forecasts due to the impact of many factors beyond the control of AGNC. All forward looking statements included in this presentation are made only as of the date of this presentation and are subject to change without notice. Certain factors that could cause actual results to differ materially from those contained in the forward looking statements are included in AGNC’s periodic reports filed with the Securities and Exchange Commission. Copies are available on the SEC’s website at SEC.gov. We disclaim any obligation to update our forward looking statements unless required by law. Participants on the call include Peter Federico, President, Chief Executive Officer and Chief Investment Officer Bernie Bell, Executive Vice President and Chief Financial Officer and Sean Reed, Executive Vice President, Strategy and Corporate Development. With that, I’ll turn the call over to Peter Federico.

Peter Federico (President, Chief Executive Officer, and Chief Investment Officer)

Good morning and thank you all for joining our first quarter earnings conference call. Agency MBS performance in the first quarter was driven by two very divergent investment themes. In January and February, the Administration’s focus on reducing interest rate volatility, maintaining mortgage spread stability and improving housing affordability drove strong performance across the fixed income markets. Agency MBS performance was particularly strong during this period as The Administration’s January 8th directive instructing the GSEs to purchase $200 billion of agency mortgage backed securities pushed spreads through the lower end of the recent three year trading range. In March, however, uncertainty associated with the war in Iran and the potential for a more widespread conflict in the Middle East caused interest rate volatility to increase, investor sentiment to turn negative and Agency MBS spreads to widen significantly. As a result, AGNC’s economic return in the first quarter was negative 1.6%. Despite the spread widening to swaps quarter over quarter, agency MBS outperformed US Treasuries and investment grade corporate bonds in the first quarter, again demonstrating the diversification benefits of this unique high credit quality fixed income asset class. At the beginning of the year, I discussed a number of factors that we believe would benefit agency MBS performance in 2026. Among these were low interest rate volatility and an accommodative monetary policy stance. In the first quarter. However, the Middle east conflict caused interest rate volatility to increase and Fed rate cuts to become more uncertain. While the duration and economic implications of the conflict are still unknown, recent developments are encouraging and these factors could once again be positive catalysts for agency MBS performance. More importantly, many of the other factors that I discussed actually improved in the first quarter and now further strengthened the outlook for agency mbs. Most notably, at current spread levels, the return profile on agency MBS is more attractive. At the time of our fourth quarter earnings conference call, the spread differential between current coupon MBS and a blend of swaps was 135 basis points. Over the last two months, that spread has ranged between 150 and 175 basis points. As a result of heightened geopolitical and macroeconomic risks, we believe agency MBS in this spread range represent compelling value on both an absolute and relative basis. The supply outlook for agency MBS also improved in the first quarter. At the start of the year, the net new supply of agency MBS was expected to be approximately $250 billion. Assuming a mortgage rate of just below 6%. With mortgage rates now about 50 basis points higher, MBS supply could be 50 to $70 billion lower this year. The demand outlook for agency MBS improved in the first quarter as well. Money manager demand for MBS increased materially in the first quarter as bond fund inflows came in about double the pace of the previous two years. US bank regulators also released their proposed bank regulatory capital framework for comment. As expected, the proposal includes lower capital requirements for high quality mortgage credit. These favorable capital requirements could lead banks to retain a greater share of mortgage credit in whole loan form or to utilize the private label securitization path to a greater extent, thereby reducing the GSE footprint over time. Finally, with mortgage spreads wider and the mortgage rate now in the low to mid 6% range, the administration may take further actions to improve housing affordability. Such actions could include more aggressive GSE purchases or increases in GSE portfolio size limits. Either or both of these actions would benefit mortgage performance. In addition, while the funding markets for agency MBS are deep and liquid, further actions by the Fed to improve the functionality and accessibility of the standing repo program could also be catalysts for tighter mortgage spreads and lower mortgage rates. In summary, although the sharp increase in geopolitical and macroeconomic risk creates a more challenging investment environment over the near term, the return profile and technical backdrop for agency mortgage backed securities and improved in the first quarter. In addition, actions by the administration to improve housing affordability are more likely. As we are continually reminded, market conditions change quickly. A prompt resolution to the Middle east conflict, while at times difficult to predict, could lead to a substantial reduction in volatility and inflationary pressures. Collectively, these conditions support our favorable outlook for agency mortgage backed securities. Moreover, AGNC remains well positioned to capitalize on these favorable conditions and build upon our lengthy track record of generating strong risk adjusted returns for our stockholders over a wide range of market cycles. With that, I’ll now turn the call over to Bernie Bell to discuss our financial results in greater detail.

Bernie Bell (Executive Vice President and Chief Financial Officer)

Thank you, Peter for the first quarter, AGNC reported a comprehensive loss of $0.18 per common share. Our economic return on tangible common Equity was negative 1.6% for the quarter, consisting of 36 cents of dividends declared per common share and a 50 cent decrease in tangible net book value per share driven by wider mortgage spreads to benchmark rates. As of late last week, our tangible net book value per common share was up approximately 6% for April or 5% net of our monthly dividend accrual. With the recovery in April through the end of last week, our tangible net book value has now largely reversed the first quarter decline we ended the first quarter with leverage of 7.4 times tangible equity, up slightly from 7.2 times as of Q4, while average leverage for the quarter was unchanged at 7.4 times. We also ended the quarter with a significant liquidity position of 7 billion of unencumbered cash and agency MBS representing 60% of tangible equity. Net spread and dollar roll income was $0.42 per common share for the quarter, up $0.07 from the fourth quarter. The increase was largely due to a 25 basis point increase in our net interest spread, which was driven by a combination of a greater allocation of interest rate swaps in our hedge portfolio, lower repo funding cost, more favorable TBA implied financing levels and a modest increase in the yield on our asset portfolio. Our quarter over quarter results also benefited from reduced compensation expense as Our fourth quarter results included year end incentive compensation accrual adjustments. The average projected life CPR of Our portfolio increased 70 basis points to 10.3% at quarter end from 9.6% as of Q4. The increase was largely due to prepayment model updates implemented in the first quarter and portfolio composition changes partly offset by higher mortgage rates. Actual CPRs averaged 13.2% for the quarter compared to 9.7% in the prior quarter. Lastly, during the first quarter we issued $401 million of common equity through our at the Market Offering program at a significant premium to tangible net book value per share, continuing our active capital management strategy and generating meaningful accretion for our common stockholders. And with that I will now turn the call back over to Peter to discuss our portfolio.

Peter Federico (President, Chief Executive Officer, and Chief Investment Officer)

Thank you Bernie Agency MBS performance varied. meaningfully by coupon and hedge type in the first quarter. Low coupon MBS meaningfully outperformed high coupon MBS due to heavy index buying from money managers in response to outsized bond fund inflows. This variation in performance by coupon was significant with lower coupon MBS tightening about 10 basis points to Treasuries during the quarter while higher Coupon MBS widened about 5 basis points on average. MBS performance also varied materially by hedge type as swap spreads tightened during the quarter. 10 year swap spreads, for example tightened by almost 10 basis points. As a result, an MBS position hedged with a 10 year pay fixed swap versus …

Full story available on Benzinga.com

This post was originally published here

General Motors Co. (NYSE:GM) will reportedly suspend development efforts of its next-generation EV pickup truck as the U.S. auto sector scales back on all-electric mobility.

GM To Suspend EV Pickup Development

The Detroit-based automaker will be delaying the development of the EV pickup at its Factory Zero plant in Michigan indefinitely, according to a report by Crain’s Detroit Business on Tuesday, which cited anonymous sources familiar with the matter.

GM did not immediately respond to Benzinga‘s request for comment.

The report also said that the company was planning an update to its full-size pickup truck line by 2028, with plans to introduce lower-cost variants. GM had earlier ended the production of its most affordable EV, the Chevrolet Bolt EV, which retailed for $29,990.

The company had last year recorded …

Full story available on Benzinga.com

This post was originally published here

President Donald Trump, on Tuesday, floated the idea of federal aid for the struggling carrier Spirit Aviation Holdings Inc(OTC:FLYYQ).

“I’d love somebody to buy Spirit, it’s 14,000 jobs, and maybe the federal government should help that one out,” the president said in a CNBC interview.

Trump, however, voiced his disapproval of a potential merger between United Airlines Holdings (NASDAQ:UAL) and American Airlines Group (NASDAQ:AAL).

“I don’t like having them merge,” Trump said on Tuesday. His comments were in response to a question about the proposed deal, which has been criticized by Senators from both parties. Trump revealed that he had only recently learned about the merger proposal, but was already against it.

While Trump doesn’t oppose mergers in general, he expressed concern about the consolidation of the aerospace industry, suggesting it leads to less competition and can cause companies to become “lazy.” He also added that both United Airlines and American Airlines are “doing very well.”

Notably, American Airlines dismissed merger …

Full story available on Benzinga.com

This post was originally published here

GE Vernova Inc. (NYSE:GEV) will release earnings for its first quarter before the opening bell on Wednesday, April 22.

Analysts expect the Cambridge, Massachusetts-based company to report quarterly earnings of $2.02 per share. That’s up from 91 cents per share in the year-ago period. The consensus estimate for GE Vernova’s quarterly revenue is $9.26 billion (it reported $8.03 billion last year), according to Benzinga Pro.

On March 16, GE Vernova announced a new agreement with Hitachi to explore deploying a BWRX‑300 small modular reactor in Southeast Asia.

Shares of GE Vernova rose 0.1% to close at $991.30 on Tuesday.

Benzinga readers can access the latest analyst ratings on the Analyst Stock Ratings page. Readers can sort by …

Full story available on Benzinga.com

This post was originally published here

Silver is back in the spotlight with the metal witnessing a surge in demand, especially in China, per the report. This could provide a boost to silver prices and its ETFs – iShares Silver Trust (NYSE:SLV) and abrdn Physical Silver Shares ETF (NYSE:SIVR) tracking the bullion.

China Silver Demand Hits Record High

According to a Wednesday post on X by The Kobeissi Letter, China silver imports reached a record high of approximately 836 tonnes in March, up 78% from February and 173% above the 10-year seasonal average for March. Year-to-date, silver imports are up to approximately 1,626 tonnes, the highest on record.

The surge was driven by strong retail and solar demand. Investments in small silver bars climbed as substitutes for high-priced gold, according to the market commentator’s post. The solar …

Full story available on Benzinga.com

This post was originally published here

Boston Scientific Corporation (NYSE:BSX) will release earnings for its first quarter before the opening bell on Wednesday, April 22.

Analysts expect the Marlborough, Massachusetts-based company to report quarterly earnings of 79 cents per share. That’s up from 75 cents per share in the year-ago period. The consensus estimate for Boston Scientific’s quarterly revenue is $5.17 billion (it reported $4.66 billion last year), according to Benzinga Pro.

On March 28, Boston Scientific announced data from its HI-PEITHO clinical trial evaluating the EKOS Endovascular System in patients with pulmonary embolism.

Shares of Boston Scientific fell 2.4% to close at $59.52 on Tuesday.

Benzinga readers can access the latest analyst ratings on the Analyst Stock Ratings page. Readers can sort by stock ticker, company name, analyst firm, rating change or other variables.

Let’s have a look at how Benzinga’s most-accurate

Full story available on Benzinga.com

This post was originally published here

The CNN Money Fear and Greed index showed a decline in the overall market sentiment, while the index remained in the “Greed” zone on Tuesday.

U.S. stocks settled lower on Tuesday, with the Nasdaq Composite falling more than 100 points during the session amid a fresh surge in crude oil prices.

Pakistan’s information minister said a formal response from Iran confirming whether it will send a delegation to the Islamabad peace talks was still awaited as of midday, leaving traders pricing an uneasy middle ground between a potential diplomatic breakthrough and a re-escalation in the Strait of Hormuz.

In earnings, GE Aerospace (NYSE:GE) posted better-than-expected earnings for the first quarter on Tuesday. UnitedHealth Group Inc. (NYSE:UNH) shares gained 7% on Tuesday …

Full story available on Benzinga.com

This post was originally published here

Beyond Meat, Inc. (NASDAQ:BYND) shares were under pressure in after-hours trading following Tuesday’s session, extending losses after closing the regular trading day at $1.04, down nearly 10%.

The stock slipped further to around $1.00 in after-hours trading, a drop of about 4%, continuing a volatile stretch for the plant-based food company.

Why It’s Trending

The move comes as Beyond Meat was trending in broader market commentary, highlighting a renewed meme-stock and short-squeeze theme across heavily shorted equities.

The stock was cited alongside names such as Avis Budget Group (NASDAQ:CAR) and Navitas Semiconductor …

Full story available on Benzinga.com

This post was originally published here

Automotive analyst Lei Xing said the international expansion of Chinese automakers is a “natural evolution” for companies facing mounting pressure at home, as fresh industry data showed a sharp rise in vehicle exports and a widening push into overseas markets.

Domestic Pressure Pushes Carmakers Beyond China

Xing, an independent consultant and co-host of the China EVs & More podcast, told The Wire China that the current globalization drive is the logical next step after many companies reached operational maturity in China. “The domestic market has been feeling the pressure,” Xing said. “It’s just a natural evolution now that a lot of these companies are becoming global.”

Reiterating that view in an X post on Tuesday, he added, “I think we …

Full story available on Benzinga.com

This post was originally published here

Kyverna Therapeutics Inc. (NASDAQ:KYTX) shares jumped 24% after hours to $12.04 Tuesday after releasing positive registrational trial results for miv-cel in stiff person syndrome at the American Academy of Neurology Annual Meeting in Chicago.

Miv-cel, the single-dose CAR T-cell therapy met its primary endpoint, delivering a statistically significant 46% median improvement in the Timed 25-Foot Walk at 16 weeks.

All 26 patients discontinued chronic immunotherapies and 81% achieved a clinically meaningful improvement, with at least a 20% improvement from baseline in walking speed.

No Approved Therapies

Kyverna Therapeutics stated SPS affects roughly 6,000 U.S. patients with no Food and Drug Administration-approved treatments currently available.

CEO Warner Biddle said, “We see compelling evidence that a one-time therapy can reset the immune system, …

Full story available on Benzinga.com

This post was originally published here

AIOS Tech (NASDAQ:AIOS) shares declined sharply in after-hours trading on Tuesday following the company’s announcement of a major 20-for-1 share consolidation and related capital restructuring plan aimed at maintaining its Nasdaq listing.

Share Consolidation Plan

The company disclosed that its board approved a 20-for-1 reverse stock split, effective April 27, 2026, as part of efforts to regain compliance with Nasdaq’s minimum bid price requirement under Marketplace Rule 5550(a)(2).

Under the consolidation, every 20 existing shares will be combined into 1 share, with proportional adjustments made to authorized and issued share capital. The company stated no fractional shares will be issued, with shareholders receiving adjusted holdings in place of any fractions.

Simultaneously, AIOS will significantly …

Full story available on Benzinga.com

This post was originally published here

An ex-diplomat from Canada, who China detained earlier, expressed concerns about the influx of Chinese-made EVs in the Canadian market on Tuesday, outlining that Ottawa’s deal could put Canada on the back foot.

Drive Out Local Competition

Michael Korvig, who was imprisoned by Beijing for three years following his 2018 arrest, said the deal could see Chinese companies “drive out local competition and make Canada dependent on importing Chinese EVs,” according to a Bloomberg report quoting Korvig at a summit in Ottawa.

He also shared that Chinese companies could bring in knockdown kits in Canada to assemble, which would not result in any development of Canada’s technology or supply chains. “They want to control the tech stack and then use control of that tech for geopolitical dominance and leverage,” he said.

Opposition To Stellantis’ Plans

Korvig isn’t the only one who has expressed opposition to Chinese EVs in …

Full story available on Benzinga.com

This post was originally published here

Tron (CRYPTO: TRX) founder Justin Sun said on Tuesday he has sued the Trump family-backed World Liberty Financial cryptocurrency platform to defend his “legal rights” as a WLFI token holder.

Crypto Billionaire Sues

Sun filed a lawsuit in a California federal court, claiming he was left with “no choice.”

“I have tried in good faith to resolve this situation with the World Liberty project team without resorting to litigation.  But the project team has refused my requests to unfreeze my tokens and restore my rights as a token holder,” the cryptocurrency billionaire said.

Sun alleged that the team even “threatened” to destroy his tokens by burning them.

Full story available on Benzinga.com

This post was originally published here

Tesla Inc. (NASDAQ:TSLA) sales fell by 24.3% in the first quarter of 2026 in California, illustrating a wider pullback in EV demand in the state.

EV Market Share Crashes In California

On Tuesday, the California New Car Dealers Association (CNCDA) released its outlook for the state’s auto sector during the first quarter of 2026, where electric vehicles’ market share declined to 13.7% in the quarter, its lowest since 2021. For context, the market share for EVs during the same period last year was 20.9%.

Tesla Sales Fall

The data also showed Tesla sales falling considerably in the state as the EV maker reported 31,958 units sold, representing a sales deficit of more than 10,000 units from last year’s 42,211 units it sold during the same period. However, Tesla’s Model Y SUV continued to be the best-selling EV in the state at 22,907 units.

Tesla’s market …

Full story available on Benzinga.com

This post was originally published here

Elon Musk-led SpaceX is reportedly cautioning investors looking to participate in the upcoming IPO that the company’s orbital datacenter goals, as well as plans to colonize Mars, rely on technology not yet proven, casting doubt over the projects’ commercial benefits.

Filing Shows SpaceX Taking Cautious Approach

The company laid out a far more cautious approach in filings with the SEC, saying that the “initiatives” for datacenters in orbit and “interplanetary industrialization” were in preliminary stages, Reuters reported on Tuesday.

SpaceX also said that the goals involved “significant technical complexity and unproven technologies,” while also acknowledging that the projects “may not achieve commercial viability.”

Companies are required by law to share risk factors associated with their businesses, alongside finances, via S-1 filings. The cautious approach is in contrast with Musk’s public comments on space-based AI compute and plans to colonize Mars.

SpaceX also said that orbital datacenters were going to operate in the “harsh environment of space,” which would …

Full story available on Benzinga.com

This post was originally published here

CBL International Limited (NASDAQ:BANL) shares surged 24.98% in after-hours trading to $0.64 on Tuesday after the marine fuel logistics provider reported 8% sales volume growth and a 22.8% narrowing of net loss for the fiscal year 2025.

On Apr. 17, for the year ended Dec. 31, 2025, the company posted consolidated revenue of $538.49 million, down 9.1% from $592.52 million in 2024, largely reflecting lower global bunker fuel prices following a year-on-year drop in Brent crude prices.

Sales volume rose 8.0%, driven by new customer acquisition, deeper penetration with existing clients, and diversification into bulk carriers and oil and gas tankers, according to CBL .

What Investors Need To Know?

Key liquidity inflection point for investors:

Metric 2025 (Current Year) 2024 (Prior Year)
Net Loss $2.99 million $3.90 million
Operating Expenses $6.91 …

Full story available on Benzinga.com

This post was originally published here

U.S. stocks closed lower on Tuesday, with the Dow Jones Industrial Average falling 0.59% to 49,149.38, while the S&P 500 and Nasdaq each dropped 0.63% and 0.59% to 7,064.01 and 24,259.96, respectively.

These are the top stocks that gained the attention of retail traders and investors through the day:

Intuitive Surgical, Inc. (NASDAQ:ISRG)

Intuitive Surgical’s stock fell 3.07% to close at $451.29, reaching an intraday high of $471.08 and a low of $451.29. The stock’s 52-week range is $603.88 to $427.84.

Intuitive Surgical reported first-quarter 2026 revenue of $2.77 billion and adjusted EPS of $2.50, both beating estimates, with revenue rising 23% year-over-year, driven by higher procedure volumes and increased placements of da Vinci systems. Worldwide procedures grew about 17%, with 431 systems placed and the installed base reaching 11,395.

The company raised its full-year outlook, expecting procedure growth of 13.5%–15.5% and projecting gross margins of 67.5%–68.5%, reflecting continued adoption of its robotic surgery platforms.

Faraday Future Intelligent Electric Inc. (NASDAQ:FFAI)

Faraday Future saw a significant rise of 85.52%, closing at $0.53, with an intraday high of $0.59 and a low of $0.29. The stock’s 52-week range is $3.61 to $0.21. In the after-hours trading, the stock slipped 9.01% to $0.48.

Faraday Future shares surged after the company announced a partnership with U.S.-based Triple I to …

Full story available on Benzinga.com

This post was originally published here

On Tuesday, WR Berkley (NYSE:WRB) discussed first-quarter financial results during its earnings call. The full transcript is provided below.

This content is powered by Benzinga APIs. For comprehensive financial data and transcripts, visit https://www.benzinga.com/apis/.

View the webcast at https://events.q4inc.com/attendee/647597137

Summary

WR Berkley reported record net investment income and strong underwriting profits, contributing to a return on beginning equity of 21.2% for Q1 2026.

Net income was $515 million, or $1.31 per share, with a calendar year combined ratio of 90.7%.

The company is seeing increasing competition, particularly in the reinsurance and property markets, but remains focused on cycle management to navigate these challenges.

Growth in gross premiums written was 4.5% in the insurance segment, while net investment income increased by 12.2% to a record $404 million.

Management expressed a cautious yet optimistic outlook, indicating potential for growth in certain niche areas while maintaining disciplined underwriting practices.

The company repurchased 4.5 million shares for $302 million and paid $34 million in dividends, highlighting strong capital management.

WR Berkley is managing its investment portfolio with a focus on high credit quality and a potential for improved yields, given current market conditions.

The company is selectively expanding in areas with attractive margins, particularly in certain casualty lines, while being cautious in more competitive markets.

Full Transcript

OPERATOR

Star one to raise your hand to withdraw your question, please press Star one again. The Speaker’s remarks may contain forward looking statements. Some of the forward looking statements can be identified by the use of forward looking words including without limitation, believes, expects or estimates. We caution you that such forward looking statements should not be regarded as a representation by us and that the future plans, estimates or expectations contemplated by us will in fact be achieved. Please refer to our annual report on Form 10-K for the year ended December 31, 2025 and our other filings made with the SEC for a description of the business environment in which we operate and the important factors that may materially affect our results. WR Berkley Corporation is not under any obligation and expressly disclaims any such obligation to update or alter its forward looking statements, whether as a result of new information, future events or otherwise. I would now like to turn the call over to Mr. Rob Berkeley. Please go ahead sir.

Rob Berkeley

Alexandra thank you very much and good afternoon to all. Thank you for finding time in your calendars to join us. My colleagues and I, we appreciate your interest in the company. So speaking of colleagues joining me on this end of the phone, we also have Executive Chairman Bill Berkley as well as Group Chief Financial Officer Rich Baio. We’re going to follow a similar path to what we have used in the past, where I’m going to offer a few more quick comments. Then Rich is going to provide us a summary on the quarter. I will follow behind with a few additional thoughts and then we will be very pleased to take your questions and the conversation in any direction you wish to take it. Before I do hand it over to Rich, just a couple of observations from me, perhaps a bit stating the obvious one is, let there be no confusion, this continues to be very much a cyclical industry. As we’ve discussed in the past, the cycle is driven by two human emotions, greed and fear. And without a doubt these days it would seem as though the fear is fading and the greed is fully percolating in many of the corners of the marketplace today. One of the things that we’ve talked about in the past couple of quarters is where is some of this competition coming from or much of this competition coming from? We’ve talked about MGAs and MGUs delegated authority, a lot of that capacity coming from a variety of different sources, in particular the reinsurance market as well as we talked about Lloyd’s as a marketplace providing a lot of capacity to delegated authority. One of the things that we’ve taken note of over the past 90 days or so is a notable shift in the appetite of the standard market. In particular national carriers who seem to be broadening their appetite and having reached a new level of, I would suggest, competitive nature that we haven’t seen in some number of years, though it tends to be focused in certain pockets A couple other comments on the marketplace couple other comments on the marketplace Focusing on the reinsurance market for a moment, I think no surprise property and property CAT within the reinsurance space it has been more and more competitive. We’re not surprised with it directionally, but we have been taken aback a bit by the pace of change and how that level of competition has really taken hold at an accelerating pace. In addition to that, the casualty market or the liability market within the reinsurance space never seemed to have gotten much of the bounce that we saw in the property market. Nevertheless, it remains very competitive and we remain concerned for the health and well being of that marketplace over time as there is more competition in the property market that will undoubtedly, at least history would suggest, create more irrational behavior that will be plentiful in both the property cap market as well as the liability market. Couple of thoughts on the insurance marketplace Speaking of property and how it can turn into a marketplace that quickly erodes, we are definitely seeing that particularly with CAT exposed property. On the insurance side, General Liability and Umbrella I would suggest are areas where rate is still available with good reason. Professional, as we’ve talked about in the past, continues to be a mixed bag. Directors and Officers (D&O) remains one that we are very focused on and seems to be continuing to flirt with the bottom. On the other hand, Employment Practices Liability Insurance (EPLI) in certain jurisdictions is an area from our perspective to be very cautious. I would call out California, particularly Southern California, as one that we are paying close attention to. Speaking of California as it relates to workers compensation we’ve talked about in the past and we remain convinced that California this time around is out in front of much of the broader workers comp market and without a doubt all eyes remain on the Workers’ Compensation Insurance Rating Bureau (WCIRB) and what is to come in the not too distant future and at the possibility of I guess finishing on a bit of a low note. I guess automobile would continue to be an area of great concern from our perspective. It’s unclear to us that the marketplace has really wrapped their head around loss cost trend and what action needs to be taken. The punchline before I hand it over to Rich is that at the intersection of a cyclical industry and a focus on risk adjusted return undoubtedly is a concept that we subscribe to and hopefully others do, known as cycle management. The good news for us as we exercise cycle management. The decoupling of product lines as to where they are in the cycle combined with the breadth of our offering allows us to be more resilient than many of our peers that have a narrow offering. So why don’t I pause there? And speaking of resilience, rich, over to you please.

Rich Baio (Group Chief Financial Officer)

Great. Thanks, Rob Good afternoon everyone. First quarter marked an Excellent start to 2026 with record net investment income and strong underwriting profits contributing to a return on beginning of year stockholders equity of 21.2%. Net income for the quarter was $515 million or $1.31 per share, while record operating income was $514 million or $1.30 per share. Other drivers benefiting the quarter compared to the prior year included lower catastrophe losses and an improved effective tax rate, starting with underwriting performance. Current accident year combined ratio excluding cat losses was 88.3% and the calendar year combined ratio was 90.7%. The difference was current accident year cat losses of 2.4 loss ratio points or $76 million, compared with the prior year of $111 million or 3.7 loss ratio points. Unlike last year, which was heavily influenced by California wildfires, in the first quarter this year the industry experienced significant winter storm activity occurring in January and February. The current accident year loss ratio excluding catastrophe losses for 2026 is 59.7% compared with 59.4% for the prior year, which reflects a shift in business mix as we look to maximize profitability. The insurance segment’s current accident year loss ratio excluding catastrophe losses increased 10 basis points to 60.9%, while the reinsurance and monoline excess segment increased to 51.1%. The expense ratio of 28.6% is comparable to the recent sequential quarters and reflects a small impact from the decline in net premiums earned from the reinsurance and monoline excess segment. We continue to believe that the 2026 expense ratio will be comfortably below 30%, barring any material changes in the marketplace on top line production. Despite heightened competition in certain pockets of the market, the insurance segment grew gross premiums written by 4.5% to $3.4 billion and net premiums written by 3.2% to $2.8 billion. As you can see from the supplemental information on page 7 of the earnings Release, net premiums written grew in all lines of business apart from workers compensation. The reinsurance and monoline excess segment reported net premiums written of $395 million, reflecting decreases in property and casualty lines of business Net Investment income increased 12.2% to a record $404 million, driven by growth in the core portfolio of 11.8% to $354 million and an increase in investment fund income of 46.3% to $40 million. As a reminder, we report the investment funds under 1/4 lag and an average quarterly range for investment fund income is 10 to 20 million dollars. We expect that strong operating cash flow of 668 million in the current quarter should continue to contribute to the growth in that investment income. The duration of our fixed maturity portfolio, including cash and cash equivalents, increased during the quarter to 3.1 years, which remains below the average life of our insurance reserves. The credit quality of the investment portfolio continues to improve to a very strong AA-. The effective tax rate in the first quarter was lower than our normalized run rate of 23% plus or minus, which is usually attributable to higher taxes on foreign earnings and the ability to utilize such foreign tax credits. In the current quarter we reflected a net non recurring tax benefit, reducing our effective tax rate from 22.8% to 16.3% as reported. We expect the remainder of 2026 will return to our normalized run rate. During the quarter we repurchased approximately 4.5 million shares common shares amounting to $302 million and paid regular dividends of $34 million. Stockholders equity increased to approximately 9¼ billion dollars despite the significant capital management. In summary, another positive quarter with meaningful growth in earnings and 21% plus return on beginning equity. Rob, I’ll turn it back to you.

Rob Berkeley

Thank you Rich, A little disappointed that this isn’t our new run rate on the tax front. You got a whole quarter to figure that out, so let me just offer a couple of more quick sound bites and then we’ll move on to Q and A. First off, you would have taken note on the rate came in reasonably healthy at the 7.2 times compared. Just as another perhaps relevant data point, the renewal retention ratio continues to sit at around 80%. Now that thing fluctuates between 78 and a half and 81 and a half. It doesn’t move very much and I look at it as one barometer to really understand whether we are turning the book or not in our efforts to get rates. So that’s an encouraging sign from my perspective. The Just another quick sound bite on the topic of rate and we touched on this briefly when we had our fourth quarter call and I think you’re going to see it come into more and more focus. We’ve taken a tremendous amount of rate over not just the past couple of quarters, the past few years. I think there are many pockets of the organization where we’re feeling very good with what the margin is and the I suppose the need for rate is perhaps not going to be as strong going forward. So what’s the punchline? We are actively rethinking what the balance is between rate versus growth and over the coming quarters you may see us take our foot slightly off the rate pedal and look to push harder on the growth in particular lines where we see the margin is particularly attractive and exposure growth is of more interest to us than rate. Rich talked about the top line overall growth. It was obviously some pretty separate and distinct pieces and it does map back, at least in my mind, to the topic of cycle management. You would have seen we took a pretty firm position which quite frankly given our comments in the Q4 call and earlier last year shouldn’t have surprised anyone. We all know what’s been going on with the rate. We’ve been very transparent about our view on the casualty or liability lines and the discipline that we’ll be exercising there. And kudos to our colleagues that are actually putting that discipline into practice. The other side of the coin, as Rich pointed out, we are still finding opportunities to grow within the insurance space. Clearly a bit of a mixed bag. I think the note between the gross versus net again highlights hopefully in the eyes of those that are observing that this is probably a moment, generally speaking where it’s better to be a buyer of reinsurance than a seller of reinsurance. Hence the delta between the gross and the net. I do think Just a final quick comment on the top line in the insurance space, there is a reasonable chance that we will see a bit more growth as the year unfolds and we are revisiting this notion or balance between growth and rate pivoting over quickly to the loss ratio. I think in a nutshell it’s winter storms. We had more exposure to that than some. That having been said, we think it is still a good trade. The comments on the expense ratio. I share very much Richard’s view that we’ll be keeping it below 30. The movement that you would have seen in the reinsurance and excess segment was primarily a result of a reduction in premium on the reinsurance front. Switching over to the investment portfolio for a moment and you know, Rich flagged for you all the strength of the quality with a very strong double A minus almost Flirting with a double A. But a couple other points that I would flag is that the book yield on the portfolio is about 4.7 percent, new money rate is 5 percent plus. So we still got some room there for improvement. In addition to that, the duration as Rich pointed out is sitting at 3.1 years. As a friendly reminder, the average life of our loss reserves, which is a big part of what we’re investing, is a hair inside of four years. So what’s the punchline? The punchline is a couple of things. One, the quality is high, there’s opportunity with the book yield moving up and we have flexibility around pushing that duration out, which is A plus as well. So even if you discount the growth in the portfolio due to the strength of the cash flow that Rich was referencing, which is there is real and you see it quarter after quarter. But even if you put that aside, there is meaningful upside on the depending on whether you look at the overall including cash 28 billion or if you want to back out the cash 25 and a half billion, there’s meaningful upside from there, both because of growth of investable assets as well as the new money rate which again with the duration we have flexibility. On the topic of flexibility and I promise last topic for me at least for the moment is capital. And I know it’s not something that we spend a lot of time talking about on these calls, but I did want to draw folks attention to it and that is our financial leverage which is sitting at about 22.6% these days, which is a. I don’t know if it’s an all time low, but it’s an all time low in my some number of decades at the organization. I think it’s important to take note of that for a couple of reasons. Number one, when you look at the returns that we’re generating, we’re generating it with a much higher level of capital or equity for that matter. More specifically in the business. Number two, I would draw your attention to the fact that we as an organization do not have an expectation for 22.6 to keep going down from here. This is a very comfortable place. We think we got lots of room if an opportunity presented itself. So what does that mean? That means if you look at this business that’s earning, I don’t know, between a billion, 7, 50 and 2 billion and something a year, give or take. And you think about where our leverage ratios are, what that means is we are generating capital significantly more quickly than we can consume it and that we will have significant amounts of capital to return to shareholders for the foreseeable. And to that end, even with us doing that, we still have a tremendous amount of flexibility to take advantage of whatever unforeseen opportunities may be coming our way. So I flag that because what you saw in the quarter with the repurchase, what you’ve seen us do with special dividends and recognizing the earnings …

Full story available on Benzinga.com

This post was originally published here

On Tuesday, Capital One Finl (NYSE:COF) discussed first-quarter financial results during its earnings call. The full transcript is provided below.

Benzinga APIs provide real-time access to earnings call transcripts and financial data. Visit https://www.benzinga.com/apis/ to learn more.

View the webcast at https://edge.media-server.com/mmc/p/co5dphz7/

Summary

Capital One Finl reported Q1 2026 earnings of $2.2 billion or $3.34 per share, with adjusted EPS at $4.42 after accounting for Discover integration and other items.

Revenue declined 2% sequentially, while non-interest expenses decreased by 9%, and pre-provision earnings increased by 6% on an adjusted basis.

The provision for credit losses was stable at $4.1 billion, with net charge-offs at $3.8 billion and an allowance build of $230 million.

The company completed its acquisition of BREX for $4.5 billion, which will impact the CET1 ratio by over 40 basis points in Q2.

Capital One Finl’s net interest margin declined to 7.87% due to seasonal effects and elevated cash levels.

The Discover integration continues with the successful conversion of debit customers, and the company expects to see growth opportunities post-integration.

Management reiterated their investment focus on AI, technology, and expanding the Discover and Brex franchises, with a long-term view on revenue synergies.

Future guidance maintains a focus on strong earnings power and strategic investments, with a CET1 capital level assumption of 12.5%.

Full Transcript

OPERATOR

Good day and thank you for standing by. Welcome to the Capital One Q1 2026 earnings call. Please be advised that today’s conference is being recorded. After the speaker’s presentation, there will be a question and answer session. To ask a question, please press star 11 on your telephone and wait for your name to be announced. To withdraw your question, please press star 11 again. I would now like to hand the conference over to your speaker today, Jeff Norris, Senior Vice President of Finance. Please go ahead.

Jeff Norris (Senior Vice President of Finance)

Thanks very much, Josh and welcome everyone. To access the webcast of this call, please go to the Investors section of Capital One’s website at CapitalOne.com. A copy of the earnings presentation, press release and financial supplement can also be found in the Investors section of Capital One’s website at CapitalOne.com by selecting Financials and then quarterly earnings release. With me this evening are Mr. Richard Fairbank, Capital One’s Chairman and Chief Executive Officer, and Mr. Andrew Young, Capital One’s Chief Financial Officer. Rich and Andrew will walk you through the presentation summarizing our first quarter results for 2026. Please note that this presentation may contain forward-looking statements, information regarding Capital One’s financial performance and any forward-looking statements contained in today’s discussion and the materials speak only as of the particular date or dates indicated in the materials. Capital One does not undertake any obligation to update or revise any of this information, whether as a result of new information, future events or otherwise. Numerous factors could cause our actual results to differ materially from those described in forward-looking statements and for more information on those factors, please see the section titled Forward Looking Statements in the earnings release presentation and the Risk Factors section of our annual and quarterly reports which are accessible at Capital One’s website and filed with the SEC. With that, I’ll turn the call over to Andrew.

Andrew Young (Chief Financial Officer)

Thanks Jeff and good afternoon everyone. I will start on Slide 3 of tonight’s presentation. In the first quarter, Capital One earned $2.2 billion or $3.34 per diluted common share. Included in the results for the quarter were adjusting items related to the ongoing Discover integration and purchase accounting impacts which are outlined on the slide.. Of these adjusting items, first quarter earnings per share or $4.42 relative to the fourth quarter revenue declined 2% while non interest expense declined 9%. Pre provision earnings in the quarter decline increased sequentially by about $530 million or 8% on an adjusted basis. Pre provision earnings increased about $430 million or 6%. Our provision for credit losses was roughly flat at $4.1 billion in the quarter. Included in the provision costs is about $3.8 billion of net charge offs and an allowance build of 230 million. Turning to Slide 4, I’ll cover the allowance in greater detail. The $230 million allowance build in the quarter brought the allowance balance to $23.6 billion. Our total portfolio coverage ratio increased 12 basis points and now stands at 5.28%. I’ll cover the drivers of the changes in allowance and coverage ratio by segment on Slide 5. In our domestic card segment, the allowance balance was flat at $18.8 billion. Favorable observed credit in the quarter was offset by greater consideration to downside economic scenarios related to heightened geopolitical uncertainty. The coverage ratio increased 23 basis points to 7.4%, largely driven by the paydown of fourth quarter seasonal balances. In our consumer banking segment, we built $155 million of allowance. The allowance build was primarily driven by strong growth in the auto business, a slightly higher subprime mix in that growth, and a modestly lower outlook for vehicle values. The coverage ratio ended the quarter at 2.36%, 13 basis points higher than the fourth quarter. And finally, in our commercial banking segment, we built $83 million of allowance. The allowance build was primarily driven by a very small number of specific reserves in our real estate portfolio as well as a modest increase in our criticized rate. The commercial banking coverage ratio increased 7 basis points quarter over quarter to 1.7%. Turning to Page 6, I’ll now discuss liquidity. Total liquidity reserves ended the first quarter at about $165 billion, up about 21 billion from the prior quarter. Our cash position increased by $19 billion and ended the quarter at approximately 76 billion. The increase was driven by continued strong deposit growth in our retail banking business and the paydown of seasonal card balances. Our preliminary average liquidity coverage ratio was 166%. Turning to page seven, I’ll cover our net interest margin. Our first quarter net interest margin was 7.87%, 39 basis points lower than the prior quarter. The decline was driven by several factors. First, two fewer days in the quarter drove 18 basis points of the decline. Second, we had the normal seasonal effect of lower average card balances. And third, average cash levels were elevated due to a combination of the typical seasonal increase, strong deposit growth in the quarter and the full quarter impact of last quarter sale of the Discover Home Loans portfolio. Turning to Slide 8, I will end by discussing our capital position. Our common equity tier 1 capital ratio ended the quarter at 14.4% 10 basis points higher than the fourth quarter income in the quarter and the seasonal decline in risk weighted assets were partially offset by $2.5 billion in share repurchases. Before I pass the call over to Rich, I also want to highlight that we closed our acquisition of BREX shortly after the quarter closed. The consideration paid to shareholders was approximately $4.5 billion. As a reminder, the BREX transaction is expected to decrease the CET1 ratio by a little over 40 basis points in the second quarter. Given the recency of the close, we are still working through the purchase accounting marks and will provide a breakout of those impacts in the second quarter earnings call. With that, I will turn the call over to Rich. Rich

Richard Fairbank (Chairman and Chief Executive Officer)

Thanks Andrew and good evening everyone. Slide 10 shows first quarter results in our Credit Card business Credit card segment results are largely a function of our domestic card results and trends which are shown on Slide 11. In the first quarter, the domestic card business posted another quarter of top line growth and strong credit results year over year. Purchase volume growth for the quarter was 40%, driven primarily by the addition of Discover purchase volume as well as continued strong growth in our heavy spender franchise. Excluding Discover, year over year, purchase volume growth was about 8%. Ending loan balances increased 69% year over year, also largely as a result of adding Discover card loans. Excluding Discover ending loans grew about 3.9% year over year. The legacy Discover card loans continued to contract slightly and will likely continue to face a temporary growth headwind in the near term due to Discover’s prior credit policy cutbacks and some additional credit policy changes we’ve made since closing the acquisition. We continue to see good opportunities to grow the Discover card business on the other side of our tech integration where we can implement growth expansions powered by our unique technology and underwriting. Revenue was up about 58% from the first quarter of 2025, largely driven by the addition of Discover revenue. Excluding Discover, year over year, revenue growth was about 6.8% driven by underlying growth in purchase volume and loans. Revenue margin for the quarter was 16.9%. The domestic card charge off rate for the first quarter was 5.1%, up 17 basis points from the prior quarter. In line with normal seasonality, the charge off rate improved by 109 basis points year over year, about half. This improvement is the result of incorporating Discover’s card portfolio into our domestic card business. The rest is driven by the steady improvement of charge offs we’ve seen over the past year for both the Legacy Capital One and Legacy Discover portfolios. Our domestic card delinquency rate was 3.7%, down 29 basis points from the prior quarter and down 55 basis points from a year ago. On a sequential quarter basis, the delinquency rate trend was a bit better than normal seasonality Domestic card non interest expense was up 51% compared to the first quarter of 2025, driven by the addition of Discover. Operating expense and marketing both increased year over year. Our choices in domestic card are the biggest driver of total company marketing, but choices in our consumer banking business have an increasing impact as well. Total company marketing expense in the quarter was about $1.5 billion, up 25% year over year, driven by the addition of Discover as well as higher legacy Capital One. Direct marketing in our domestic card and consumer banking businesses increased media spend and continuing investments in premium benefits. As is usually the case, first quarter marketing was seasonally low and that seasonal trend was amplified this year as the timing of some of our planned marketing investments for the year shifted out of the first quarter into the second quarter and subsequent quarters. This year. Pulling up our marketing continues to deliver strong new account originations to build an enduring franchise with heavy spenders at the top of the domestic credit card market and to grow checking accounts on a national scale. In our consumer banking business, we expect to increasingly lean into marketing to take advantage of these compelling market opportunities. Slide 12 shows first quarter results in our consumer banking business. Global payment network transaction volume for the quarter was steady at about $174 billion as the typical seasonal decline was mostly offset by transaction volume growth related to the completion of our conversion of Capital One debit customers to the Discover network. Auto originations were up 21% from the prior year quarter. Competitor activity in the quarter remained high, but we continue to be in a strong position to pursue resilient growth in the current marketplace. Consumer banking ending loan balances increased $8 billion, or about 10% year over year. Average loans were up 9% compared to the year ago. Quarter ending consumer deposits grew about 35%, driven largely by the addition of Discover deposits. Average deposits were up 34%. Looking through the Discover impact, our digital first national consumer banking business continues to grow and gain traction. Consumer banking revenue for the quarter was up about 37% year over year, driven predominantly by the addition of Discover operations as well as Discover revenue synergies and growth in auto loans. Non interest expense was up about 26% compared to the first quarter of 2025, driven largely by the addition of Discover as well as by higher marketing to drive Growth in our national consumer banking business increased auto originations and continued technology investments. The auto charge off rate for the quarter was 1.64%, up 9 basis points year over year and down 18 basis points from the sequential quarter. In line with expected seasonality, auto charge offs have been stable at near pre pandemic levels for the past year. The auto delinquency rate decreased seasonally from the linked quarter down 102 basis points to 4.21%. On a year over year basis, our auto delinquencies improved by 72 basis points. Slide 13 shows first quarter results for our commercial banking business. Compared to the linked quarter, both ending and average loan balances were up about 1%. Ending and average deposits were both down about 1% from the linked quarter. The commercial banking annualized net charge off rate for the first quarter decreased 14 basis points from the sequential quarter to 0.29%. The commercial criticized performing loan rate was 4.99% up 31 basis points. Compared to the linked quarter. The criticized non performing loan rate was up 4 basis points to 1.4%. In closing first quarter results continued to reflect solid top line growth and strong credit performance. We made expected progress on the Discover integration and synergies in the quarter including the successful conversion of Capital One’s debit customers to the DSCover network. We remain on track to deliver the expected synergies following the quarter. We achieved two important strategic milestones in April. We closed the Brex acquisition on April 7. Acquiring Brex accelerates our quest to build a banking and payments company that’s positioned to win where the world of business payments is going. As we mentioned at the announcement, we will be leveraging Capital One assets and increasing investment levels to drive enhanced growth at Brex. And also in April we brought the technology and capabilities that power Capital One Travel in house. We now fully own the technology that we have built in partnership with Hopper and the Hopper talent we’ve worked with will join Capital One. We also launched the new Capital One Travel app and we’re excited to bring our award winning travel experience to more consumers and businesses as we continue to grow our travel business. Brex and Capital One Travel are just two of the opportunities we are investing in. For years we’ve been working backwards from the coming dramatic transformation of the business marketplace with modern technology, data and AI. We are in the 14th year of our technology transformation from the bottom of the tech stack up. This has involved going 100% into the cloud, building a modern data ecosystem and rebuilding the company in modern technology platforms that can handle big data and AI in real time. We are way down that path, but we are still investing in some very powerful capabilities. All companies will be able to take advantage of AI, but the leverage is vastly greater when AI is embedded in the company’s ecosystem. Our entire technology is architected to enable these capabilities at scale embedded in our modern ecosystem. We continue to invest in building AI infrastructure and specific AI experiences. We also continue to invest in growing our heavy spender franchise at the top of the market, including rewards, lounges, unique access to experiences and breakthrough digital capabilities. And we also continue to lean in to our unique quest to organically build a digital first full service national bank. Many of our opportunities are enhanced by the Discover acquisition, which of course also brings the new opportunity to grow and scale our own global payments network. We continue to invest in network acceptance, we brand and technology. As we’ve discussed, these investments will continue to be reflected in the efficiency ratio, but they are also the engine that powers long term growth and returns. And of course our numbers starting in the second quarter will include Brex and the insourcing of our travel business as well. Pulling way up we continue to build momentum from the game changing acquisition of Discover. Even though some individual variables in our deal model have moved since the announcement and we have acquired Brex and the Hopper travel infrastructure, we still expect our earnings power on the other side of the DSCover integration to be consistent with what we expected at the time we announced the deal. And now we will be happy to answer your questions.

Jeff Norris (Senior Vice President of Finance)

Jeff thank you Rich. We will now start the Q and A session. As a courtesy to other investors and analysts who may wish to ask a question, please limit yourself to one question plus a single follow-up. And if you have any follow up questions, after the Q and A session, the investor relations team will be available. Josh, please start the Q and A.

OPERATOR

Thank you. As a reminder to ask a question, please press star 11 on your telephone and wait for your name to be announced. To withdraw your question, please press Star one one Again, one moment for questions. Our first question comes from Terry Mull at Barclays. You may proceed. Hi.

Terry Mull (Equity Analyst at Barclays)

Thank you. Good evening, Rich. I’m just curious to get your thoughts on the state of the consumer. There’s obviously concern around the impact of higher energy prices on the health of the consumer, but your credit results are still very good across both card and auto. So maybe just talk about what you’re seeing across your businesses.

Richard Fairbank (Chairman and Chief Executive Officer)

Thank you, Terry. So the US Consumer remained healthy and the overall economy remained resilient through the first quarter. The unemployment rate improved slightly in the quarter. Despite some high profile headlines about layoffs. The total volume of job losses and new jobless claims remains low and stable income growth continued to run ahead of inflation. Consumer spending remained robust because of last year’s budget bill. Tax withholdings are lower than a year ago and tax refunds are higher in our domestic card business. Our credit metrics continue to improve on a year over year basis in the quarter. You know, on a sequential quarter basis, our charge off rate moved in line with seasonality. While our delinquencies improved relative to what we would expect from normal seasonality. Our auto credit metrics remained strong as well. Auto losses were slightly higher on a year over year basis in Q1, but this was consistent with a modest increase in the subprime mix of that portfolio over the past year. Our auto losses have been back near pre pandemic levels for over a year and our auto credit is supported by strong performance of recent originations and generally stable vehicle prices. Of course, the new conflict in the Persian Gulf represents a significant cloud on the horizon. We’ve already seen energy prices spike sharply over the past six weeks. Inflation moved higher in March largely because of the higher gas prices. So if energy prices remain elevated for an extended period of time, that would be a real headwind for consumers and probably a drag on the overall macroeconomy. But so far we’ve not seen any adverse effects on our portfolio even in our, you know, either in our credit or in our spend metrics. You know, we’ve judgmentally incorporated elevated macroeconomic risk into our allowance through qualitative factors. But you know, we continue to, you know, really feel very good about not only our portfolio performance, but good for the credit outlook of consumers and good for the opportunity to continue to lean in to origination and credit line growth in our business. So, you know, once again, it seems like every quarter we’re having a conversation just like this. There’s a lot of noise in the external environment, but the consumer is showing quite a bit of resilience. And I want to comment for just one second back to the credit card delinquencies moving just a little bit better than seasonality. I don’t think we’re ready to declare that it’s diverging from, you know, where it is, but it’s certainly good to see that. Of course, you know, there’s little, you know, a little uncertainty in reading things in a world of tax refunds and other things, but certainly we think our recent credit number is just another indication of the strength of the consumer and particularly the strength of our portfolio and some of the choices that we’ve made in credit. Next question please.

OPERATOR

Thank you. Our next question comes from Sanjay Sikrani with kbw. You may proceed.

Andrew Young (Chief Financial Officer)

Thank you. I wanted to start with a question on expenses. The adjusted efficiency ratio came in a little under 50%. Understanding that marketing was a little bit lighter than it typically would be, I guess as we look ahead. I know Rich, you mentioned Brex and Hopper will come into the expense run rate. How should we think about that expense ratio or the efficiency ratio sort of migrating over the course of the year. So thank you, Sanjay. So as you mentioned Brex and Hopper, those are two investments that are not in the current efficiency ratio and not all of our investments are in the first quarter. Certainly those being the biggest highlights of those that are not in there. But we …

Full story available on Benzinga.com

This post was originally published here

On Tuesday, Peoples Bancorp (NASDAQ:PEBO) discussed first-quarter financial results during its earnings call. The full transcript is provided below.

This content is powered by Benzinga APIs. For comprehensive financial data and transcripts, visit https://www.benzinga.com/apis/.

View the webcast at https://app.webinar.net/9w1XG6qR0aN

Summary

Peoples Bancorp Inc announced a merger agreement with Citizens National Corporation, which will expand their presence in Kentucky and is expected to close in the second half of 2026.

The company reported first-quarter diluted earnings per share of $0.81, surpassing analyst estimates of $0.80, with a net interest margin expansion of 4 basis points.

Loan growth was $13 million, with significant commercial and industrial loan growth offsetting reductions in other loan categories.

Peoples Bancorp Inc’s non-performing loans and delinquency levels improved, while non-interest-bearing deposits grew by over $41 million.

The company’s tangible equity to tangible assets ratio increased to 8.91%, and all regulatory capital ratios improved.

Guidance for 2026 includes a net interest margin of 4-4.2%, quarterly fee-based income of $28-30 million, and quarterly total non-interest expenses between $73 million and $75 million.

The merger with Citizens is expected to result in $0.20 EPS accretion in 2027, with 40% cost savings anticipated from the transaction.

Management highlighted strategic flexibility for further mergers and acquisitions, with a focus on both large and smaller deals.

Full Transcript

OPERATOR

Good morning and welcome to Peoples Bancorp Inc’s conference call. My name is Chuck and I’ll be your conference facilitator. Today’s call will cover a discussion of the results operations for the quarter ended March 31, 2026. Please be advised that all lines have been placed on mute to prevent any background noise. After the speaker’s remarks, there will be a question and answer period. If you would like to ask a question during this time, simply press Star then one on your telephone keypad and questions will be taken in the order they are received. If you would like to withdraw your question, please press Star then two. This call is also being recorded. If you object to the recording, please disconnect at this time. Please be advised that the commentary in this call will contain projections and other forward looking statements regarding people’s future financial performance and future events. These statements are based on management’s current expectations. The statements in this call, which are not historical fact, are forward looking statements and involve a number of risks and uncertainties detailed in the People’s securities and Exchange Commission filings. Management believes that the forward looking statements made during this call are based on reasonable assumptions within the bounds of their knowledge of people’s business and operations. However, it is possible actual results may differ materially from these forward looking statements. Peoples disclaims any responsibility to update these forward looking statements after this call, except as may be required by applicable legal requirements. Peoples First Quarter 2026 Earnings Release and Earnings conference call presentation were issued this morning and or available@peoplesbanccorp.com under Investor Relations. A reconciliation of the Non Generally Accepted Accounting Principles or GAAP financial measures discussed during this call to the most directly comparable GAAP financial measures is included at the end of the earnings release. This call will include about 15 to 20 minutes of prepared commentary followed by a question and answer period which I will facilitate. An archived webcast of this call will be available@peoplesbancorp.com in the Investor Relations section for one year. Participants in this call today are Mr. Tyler Wilcox, President and Chief Executive Officer, along with Ms. Katie Bailey, Chief Financial Officer and Treasurer and each will be available for questions following opening statements. Mr. Wilcox, you may begin the conference.

Tyler Wilcox (President and Chief Executive Officer)

Thank you, Chuck Good morning everyone and thank you for joining our call today. Earlier this morning we announced that we entered into an agreement to merge with Citizens National Corporation Citizens have approximately $700 million in assets and operates 12 branches in eight counties in Kentucky. We expect to close the merger in the second half of 2026. We are excited about this partnership which expands our presence in Kentucky markets that both overlap and complement our existing footprint. Citizens’ is a deposit rich franchise that shares a similar philosophy in serving the needs of clients and communities. We look forward to welcoming their shareholders’, employees and clients to become part of the Peoples team. We believe this merger will improve shareholder value and benefit associates of both Citizens’ and Peoples while offering clients of Citizens more diversified products. I will go into more details on the planned merger later in the call and you can refer to our accompanying slides for additional details. Now I would like to highlight our results issued this morning. We reported diluted earnings per share of $0.81 for the first quarter. Our results included several improvements compared to the linked quarter. For the first quarter, our net interest margin expanded 4 basis points driven by lower deposit costs. We had a $400,000 increase in fee based income. We had loan growth of $13 million when we had originally anticipated loan growth to be flat due to expected paydowns. During the first quarter, our non performing loans and delinquency levels improved while we also experienced reductions in our criticized and classified loan balances. Our non interest bearing deposits grew over $41 million or 3%. Our loan to deposit ratio improved to 88.5%. Our tangible equity to tangible assets ratio increased 12 basis points to 8.91%. Our book value per share grew 1% on an annualized basis compared to year end, while our tangible book value per share improved 3% on an annualized basis. All of our regulatory capital ratios improved and our diluted EPS of $0.81 exceeded consensus analyst estimates of $0.80. As we’ve noted previously, we typically have annual first quarter one time expenses that occur which include stock based compensation expense related to the annual forfeiture rate, true up on stock vested during the first quarter along with upfront expense on stock grants to retirement eligible employees which combined for a total of $764,000 and negatively impacted diluted EPS by $0.02 per share and Employer Health Savings Account contributions of $689,000 which reduced diluted EPS by $0.02per share. For the first quarter, our provision for credit losses totaled $9.7 million, increasing our allowance for credit losses as a percent of total loans to 1.16% from 1.12% at year end. Our provision for credit losses for the quarter was driven by a deterioration in macroeconomic conditions used within our models and is not indicative of issues we are seeing within our portfolio. However, we are cautious and disciplined within our underwriting and portfolio management as we assess the impact of the Iran conflict on oil prices and inflationary pressure on prospects and existing clients. Our annualized quarterly net charge off rate improved to 40 basis points compared to 44 basis points for the linked quarter. Our small ticket lease charge offs totaled $3.8 million for the first quarter and contributed 23 basis points of our annualized quarterly net charge off rate. While we experienced a reduction in our net charge offs for the first quarter, from a dollar perspective, we do anticipate our second quarter net charge offs to be consistent with recent quarters. We continue to project that the net charge offs will come down in the second half of 2026 compared to recent quarterly levels. We continue to reduce the size of our high balance accounts in our small ticket leasing business, which totaled around $9 million at March 31, down from nearly $13 million at year end. For more information on our small ticket leasing business and related net charge offs, please refer to our accompanying slides. Our non performing loans declined over $3 million compared to the linked quarter, mostly due to reductions in several categories of loans 90 plus days past due and accruing. We also had improvements in our criticized loans which were down $12 million compared to the linked quarter end and our classified loans were down $5 million. On March 31, our criticized loan balances as a percent of total loans improved to 3.31%, while our classified loans as a percent of total loans declined to 2.1%. Our delinquency levels improved and at March 31, 98.9% of our loan portfolio was considered current compared to 98.6% at year end. Moving on to loan balances, we generated loan growth of $13 million. We had significant commercial and industrial loan growth of over $111 million, which was partially offset by reductions in construction and commercial real estate loans of about $55 million combined. We also had declines in premium finance and leases of $24 million and $15 million respectively. We experienced some of the payoffs we had anticipated for the first quarter, however, some of those migrated to the second quarter. I will now turn the call over to Katie for a discussion of our financial performance.

Katie Bailey (Chief Financial Officer and Treasurer)

Thanks, Tyler. Our net interest income declined $629,000 compared to the linked quarter, while our net interest margin expanded 4 basis points. Most of the reduction in net interest income was driven by declines in accretion income, which totaled $1.3 million compared to $1.8 million for the fourth quarter, contributing 6 basis points and 8 basis points respectively. We had 2 fewer days in the first quarter than in the fourth quarter, which also contributed to the decline in net interest income. The improvement in our net interest margin was partially driven by a 12 basis point reduction in our core deposit costs which exclude brokered CDs. We also had a decrease in our brokered CD position which helped to increase our net interest margin. From a total balance sheet perspective, we have worked to minimize our interest rate risk exposure and are in a relatively neutral interest rate risk position. As it relates to our fee based income. We had growth of $400,000 compared to the linked quarter. We recognized $1.2 million related to our annual performance based insurance commission which we typically receive in the first quarter of each year. This income was partially offset by lower electronic banking income and deposit account service charges which are seasonally higher in the fourth quarter of each year. Our non interest expenses were up $341,000 compared to the linked quarter. As Tyler mentioned, we typically recognize additional employee related expense during the first quarter of each year which drove the increase compared to the fourth quarter. If you exclude our additional one time expenses from the first quarter, our non interest expense is actually down compared to the fourth quarter. Our reported efficiency ratio was 58.6% for the first quarter and 57.8% for the linked quarter. Increase in our ratio was driven by the one time expenses from the first quarter coupled with lower accretion income. Looking at our balance sheet at quarter end, our loan to deposit ratio improved to 88.5% compared to 88.8% at year end. As our influx of deposits outpaced our loan growth for the first quarter. Our investment portfolio as a percent of total assets declined slightly to 20.3% at March 31 compared to 20.5% at year end. Our core deposit balances which exclude brokered CDs increased $192 million compared to the linked quarter end. This improvement was due to $102 million of governmental deposit deposit growth coupled with an increase of $41 million in non interest bearing deposits. This growth was partially offset by $154 million of declines in our brokered CDs as we reduced our position opting for lower short term borrowing rates as a funding source. As a note, our governmental deposits are seasonally higher in the first quarter of each year so we anticipate seeing some of that money flow out in the second quarter. Our demand deposits as a percent of total deposits were flat at 35% for both quarter end and year end. Our non interest bearing deposits to total deposits grew to 21% at March 31 compared to 20% at year end. Moving on to our capital position, all of our regulatory capital ratios improved compared to the linked quarter end. Our tangible equity to tangible assets ratio improved 12 basis points to 8.9% at quarter end compared to 8.8% at year end. Our book value per share grew to $33.85 while our tangible book value per share improved to $22.95 or 3%. Annualized we increased our quarterly dividend rate for the 11th consecutive year to 42 cents per share. This results in an annualized dividend yield of 4.84%. Finally, I will turn the call over to Tyler for his closing comments.

Tyler Wilcox (President and Chief Executive Officer)

Thank you Katie Looking to our results for the full year of 2026 we expect the following which excludes the impact of non core expenses and the proposed merger. We expect to achieve positive operating leverage for 2026 compared to 2025. We anticipate our net interest margin will be between 4 and 4.2% for the full year of 2026 which includes one 25 basis point rate cut. Each incremental 25 basis point reduction in rates from the Federal Reserve is …

Full story available on Benzinga.com

This post was originally published here

OpenAI is one of the most valuable private companies in the world, and retail investors keep running into the same wall when they try to own a piece of it. The maker of ChatGPT closed the largest private funding round in history on March 31, 2026, lifting its post-money valuation to $852 billion and leapfrogging SpaceX for the top spot in private markets. There is no OpenAI ticker, no prospectus, and no way to place a standard buy order at your brokerage.

That has not stopped individual investors from finding creative paths to exposure, and a handful of those paths have genuinely opened up over the last six months. Here is what actually works, what only partially works, and where the risks hide.

Why OpenAI Shares Don’t Trade On The Nasdaq

OpenAI’s corporate structure is deliberately unusual, and that is the root of the access problem. The OpenAI Foundation, a nonprofit, holds a controlling equity stake in OpenAI Group PBC, the for-profit public benefit corporation that runs ChatGPT and the enterprise business. Any transfer of shares in the PBC requires board approval, and direct investment in OpenAI or the venture funds backing it is legally restricted to accredited investors, who must meet income or net-worth thresholds set by the Securities and Exchange Commission.

OpenAI is also in no rush to list. CEO Sam Altman has said he is “zero percent excited” about running a public company, and while he has reportedly pushed internally for a Q4 2026 IPO, CFO Sarah Friar believes a 2027 listing is more realistic given the organizational work required. Until then, retail investors have to go sideways.

The Microsoft Workaround

The cleanest indirect route runs through Microsoft (NASDAQ:MSFT). Microsoft holds roughly 27% of OpenAI Group PBC on an as-converted diluted basis, an investment valued at approximately $135 billion as of the late-2025 recapitalization. Microsoft also receives 20% of OpenAI’s revenue under an agreement that runs through 2032.

The appeal is obvious. You buy Microsoft on any brokerage, pay no special fees, and get proportional upside if OpenAI grows. The limitation is just as obvious. At Microsoft’s market capitalization, the OpenAI stake represents roughly 8% of the total, which means OpenAI performance gets diluted against Azure, Office, LinkedIn, gaming, and everything else Satya Nadella runs. If your thesis is “OpenAI specifically,” Microsoft …

Full story available on Benzinga.com

This post was originally published here

Private equity firm EQT has raised $15.6 billion for its private equity Asia Fund, as investors seek diversification across both asset classes and regions. 

The fund, which received capital from 75 new investors, had originally sought to raise $12.5 billion when it was launched in 2024, Bloomberg reported. 

Roughly three-quarters of the fund’s capital originated from investors outside Asia, as many global backers increasingly look to the region amid growing geopolitical uncertainty and instability in other markets, Asia Chairman Jean Salata told Bloomberg.

He added that investors are “very interested in the Asia region as a place to invest.”

Private Equity Firms Circle APAC Region

In April 2021, KKR & Co. closed its fourth Asia-Pacific focused fund, the …

Full story available on Benzinga.com

This post was originally published here

A 9% dividend yield looks like a gift until the quarterly declaration notice lands and the check is half the size it used to be. Dow Inc. (NYSE:DOW) investors lived that exact moment in July 2025, when the chemical giant slashed its quarterly dividend by 50% and watched the stock drop another 11.5% in a single session. Walgreens Boots Alliance did it first in January 2024, ending a 47-year streak of dividend hikes by cutting the payout 48%. Intel (NASDAQ:INTC) went further and suspended its dividend outright after a 30-year track record of payments.

None of those cuts were shock events for anyone running the numbers. The warning signs were sitting in public filings months ahead of each announcement. What follows is a 5-point framework any retail investor can apply in under 15 minutes to a dividend stock’s financials, using the same signals that Morningstar analysts, dividend-focused research desks, and institutional credit teams watch.

1. The Payout Ratio Reality Check

Start with the ratio of dividends paid to earnings. A payout ratio under 60% generally leaves room for reinvestment, down cycles, and future increases. Once a company crosses 100%, it is paying shareholders more than it earns, and the dividend is being funded by the balance sheet, new debt, or asset sales instead of operating profits.

Dow is the textbook case. Morningstar noted after the cut that the company had paid out more than three times its 2023 EPS and roughly 180% of its 2024 EPS as dividends, and that even the most optimistic 2025 estimates would have produced a payout ratio above 100% at the old rate. That kind of math does not survive a prolonged downturn, and it did not.

For retail screening, pull the trailing twelve-month payout ratio from any free data source like Finviz, Stock Analysis, or the Yahoo Finance key statistics tab. Anything above 80% for a non-REIT, non-MLP name deserves a second look. Anything above 100% is a red flag …

Full story available on Benzinga.com

This post was originally published here

Hancock Whitney (NASDAQ:HWC) reported first-quarter financial results on Tuesday. The transcript from the company’s first-quarter earnings call has been provided below.

This content is powered by Benzinga APIs. For comprehensive financial data and transcripts, visit https://www.benzinga.com/apis/.

The full earnings call is available at https://events.q4inc.com/attendee/231849470

Summary

Hancock Whitney reported a solid start to 2026 with improved key metrics: Adjusted ROA at 1.43%, ROTCE at 14.64%, and EPS at $1.52, showing over a 10% increase in adjusted EPS from the same quarter last year.

The company welcomed 27 net new revenue producers, anticipated to drive balance sheet growth and profitability, maintaining a mid-single-digit loan growth guidance for the year.

Net interest margin expanded by 7 basis points due to higher securities yields from bond portfolio restructuring, with expenses well-managed despite a 1% rise.

Deposits declined by $198 million due to seasonal public fund outflows, but the company maintains a positive outlook with expectations for low single-digit deposit growth from 2025 levels.

Capital returns to shareholders were highlighted by the repurchase of 1.4 million shares and an 11% increase in the quarterly cash dividend to $0.50 per share.

The company completed a bond restructuring in January, which is expected to contribute positively to NIM throughout the year.

Management remains optimistic despite market volatility, emphasizing strong capital positions and liquidity to support growth in 2026.

Full Transcript

OPERATOR

Good day ladies and gentlemen and welcome to Hancock Whitney Corporation’s first quarter 2026 earnings conference call. At this time all participants are in a listen only mode. Later we will conduct a question and answer session and instructions will follow at that time. As a reminder, this call may be recorded and I would now like to introduce your host for today’s conference, Catherine Mistich,, Investor Relations Manager. You may begin..

Catherine Mistich (Investor Relations Manager)

Thank you and good afternoon. During today’s call we may make forward looking statements. We would like to remind everyone to carefully review the safe harbor language that was published with the earnings release and presentation and in the Company’s most recent 10K and 10Q, including the risks and uncertainties identified therein. You should keep in mind that any forward looking statements made by Hancock Whitney speak only as of the date on which they were made. As everyone understands, the current economic environment is rapidly evolving and changing. Hancock Whitney’s ability to accurately project results or predict the effects of future plans or strategies, or predict market or economic developments is inherently limited. We believe that the expectations reflected or implied by any forward looking statements are based on reasonable assumptions but are not guarantees of performance or results and our actual results and performance could differ materially from those set forth in our forward looking statements. Hancock Whitney undertakes no obligation to update or revise any forward looking statements and you are cautioned not to place undue reliance on such forward looking statements. Some of the remarks contain non GAAP financial measures. You can find reconciliations to the most comparable GAAP measures in our earnings release and financial tables. The presentation slides included in our 8k are also posted with the Conference Call webcast link on the Investor Relations website. We will reference some of these slides in Today’s Call. Participating in Today’s Call are John Harrison, President and CEO Mike Ackery, CFO Chris Saluka, Chief Credit Officer and Shane Loper, Chief Operating Officer. I will now turn the call over to John Hairston.

John Hairston

Thank you Catherine and thanks to everyone for joining us this afternoon. We are pleased to report a solid start to 2026. Our adjusted ROA was 1.43%, ROTCE was 14.64% and EPS was $1.52, all improved from prior quarter. Adjusted EPS compared to the same quarter last year increased over 10%. We are very excited to welcome 27 net new revenue producers to our strong banking team and we expect to build on the momentum we have to generate meaningful balance sheet growth and profitability improvement. Over the rest of 2026 we achieved another quarter of solid earnings with NIM expansion. An efficiency ratio of about 55%, consistent strong fee income and well managed expenses. Net interest margin expanded 7 basis points this quarter due to higher securities yields following our bond portfolio restructuring and lower cost of funds that outpaced the impacts of lower loan yields and in this rate environment loans grew 33 million or 1%. Annualized loan production totaled 1.2 billion, down from last quarter but up 365 million compared to the same quarter last year. Historically, first quarter loan growth is seasonally softer, but average balances were up 250 million over fourth quarter. We anticipate average growth to improve as the year progresses. With a strong pipeline and continued success in adding bankers, our guidance of mid single digits for the year for loan growth is unchanged. Deposits were down 198 million or 3% annualized due to seasonal public funds outflows. Interest bearing public funds decreased 280 million and public fund DDAs decreased 75 million. Excluding the impact of public fund DDA outflows, DDAs would actually have been up 45 million. DDA mix ended the quarter at a very strong 36%. Interest bearing transaction and savings accounts were up 261 million with higher balances driven by competitive products and pricing. Retail time deposits were down 149 million due to maturities during the quarter. We continue to enjoy a healthy CD renewal rate of about 85%. We have not changed our guidance on deposits as we still expect balances to be up low single digits from 2025 levels this quarter. We continue to proactively return capital to shareholders through repurchasing 1.4 million shares of our common stock and increasing our quarterly cash dividend 11%, now standing at $0.50 per share. Additionally, we deployed capital through the previously announced bond restructuring effort which was completed in January. We ended the quarter with a solid TCE of 9.93% and a common equity tier 1 ratio of 13.3%. Despite market volatility and an emerging scenario of flat rates, we remain optimistic and confident for our growth prospects for the rest of 2026. We’re closely monitoring macroeconomic trends and indicators, including both nationally and within our footprint. While the environment remains dynamic, our ample liquidity, solid allowance for credit losses of 1.43% and very strong capital keep us well positioned to navigate challenges and support our clients in really any economic scenario. With that, I’ll invite Mike to add additional comments.

Mike Ackery (Chief Financial Officer)

Thanks, John. Good afternoon everyone. As John said at the onset, the company’s performance in the first quarter was exceptional, adjusted for the net loss in the bond portfolio Restructuring net income for the first quarter was 125 million or $1.52 per share, compared to 126 million or $1.49 per share in the fourth quarter. As shown on slide 20 of the Investor Deck, we remain confident in the guidance provided at the beginning of the year and have not made any changes this quarter. We are however now assuming no rate cuts throughout 2026 with no significant impact to NII or our NIM. PPNR for the company was down slightly from the prior quarter or about 1% to 173 million, expressed as a return on average assets that continues to be a solid 1.98%. Net interest income increased 1% this quarter. Our fee income business continues to perform exceptionally and expenses were up but remained well controlled. Fee income, adjusted for the net loss on the bond portfolio restructuring was essentially flat with Last quarter down only 1 million. The slight decrease was driven by lower specialty income which tends to be somewhat unpredictable. Quarter to quarter expenses remained well controlled, only up 1% from last quarter. Much of this increase was from seasonal increases in payroll taxes and related benefits. We remain focused on making thoughtful investments in revenue generating activities while balancing expense growth with top line revenue creation. As expected, Our NIM was up 7 basis points this quarter to 3.55% driven by a reduction in our cost of deposits and a higher yield on our bond portfolio partly offset by lower loan yields. Following two rate cuts in the fourth quarter of last year, our overall cost of funds was down 8 basis points to 1.44% due to a lower cost of deposits and a better funding mix. Our cost of deposits was down 10 basis points to 1.47% for the quarter with the cost of deposits down to 1.46% in the month of March. During the quarter we reduced promotional rate pricing on our interest bearing transaction accounts and retail CDs. In 2026, we expect CDs will continue to mature and renew at lower rates, although the rate advantage will diminish over the year in a flat rate environment. Our earning Asset yield was down 1 basis point with loan yields down 13 basis points following the rate cuts in the fourth quarter quarter, our bond yields were up 25 basis points Related to the quarter’s restructuring transaction. Average earning assets were up 100 million driven by higher average loans partly offset by a lower level of adrift bonds. The yield on the bond portfolio as mentioned was up 25 basis points to 3.23 related to the quarter’s restructuring transaction. The transaction contributed 4 basis points to our NIM expansion this quarter. As a reminder, the first quarter did not include a full quarter’s impact from the transaction. We expect the full quarterly increase in bond Yields will approach 32 basis points and the annual contribution to NIM will be about 7 basis points. Aside from the restructuring transaction, we reinvested 181 million back into the bond portfolio at higher yields. Loan yields, as mentioned, were down 13 basis points following the rate cuts in the fourth quarter of 2025. The total fixed rate was unchanged from last quarter at 5.28% and the total variable rate was down about 14 basis points. Total new loan rates were down 10 basis points quarter over quarter, but that was partly offset by an increase in average loans of about 250 million linked quarter for the fifth consecutive quarter, our criticized commercial loans improved, decreasing 13 million to 522 million. Non accrual loans increased 6 million to 113 million. Net charge offs came in at 19 basis points, so down from the prior quarter’s 22 basis points. Our loan loss reserves are solid and unchanged at 1.43% of loans. We expect net charge offs to average loans will come in at about 15 to 25 basis points for the full year. Lastly, a comment on capital Our capital ratios remained remarkably strong even with the proactive capital deployment we completed during the quarter through the bond restructuring transaction, share repurchases and an increase in our common cash dividend. We expect that share repurchases will continue at similar levels throughout the year. Changes in the growth dynamics of our balance sheet, economic conditions and share valuation could impact that view. I will now turn the call back to John.

John Hairston

Thanks Mike. Let’s open the call for questions

OPERATOR

and thank you. We’ll now begin the question and answer session. If you have dialed in and would like to ask a question, please press Star one on your telephone keypad to raise your hand and join the queue. If you would like to withdraw your question, simply press Star one again. If you’re called upon to ask your question and are listening via speakerphone on your device, please pick up your handset and ensure that your phone is not on mute when asking your questions. Again, it is Star one if you would like to join the queue and our first question comes from the line of Michael Rose with Raymond James. Your line is open.

Michael Rose (Equity Analyst)

Hey, good afternoon everyone. Thanks for taking my questions. Maybe we can just start on loan growth. I think that’s the one piece of the story that investors are really looking forward to seeing pick up here as we move through the year. Certainly understand the Elevated pay downs. Looks like originations were still pretty good in what is typically a seasonally weaker quarter. But it does look like a lot of the growth was maybe driven this quarter by higher SNC balances. So maybe. John, is there a way to kind of map out what we should expect for loan growth in the back half of the year? I know you have the guidance, but more specifically, what gives you confidence that you can actually begin to see some real net growth and for it to pick up here? Because I think that’s a big linchpin for investors. Thanks.

John Hairston

Sure Michael, thanks for the question. I’m going to let Shane tackle that question.

Shane Loper (Chief Operating Officer)

Thanks Michael. Our first quarter loan growth was 33 million and that I believe reflects solid underlying momentum. You know, we produced about a billion two in loans and that’s up from 850 from a year ago and really saw strength across business, banking, commercial, middle market, healthcare, commercial finance and cre. That net growth as you articulated was moderated though by some normal portfolio dynamics. So we had mortgage and consumer amortization and some planned paydowns in some of our larger credits across cre, health care and our specialty lines. That all was anticipated. And from the outset we’ve talked about indicating growth would be more weighted towards the mid and back half of the year. So if you look forward, I think we’re positioned to deliver the mid single digit full year growth. Geographic markets are continuing …

Full story available on Benzinga.com

This post was originally published here

Blackstone’s (NYSE:BX) private credit fund experienced increased pressure on its portfolio due to markdowns of dental-implant company Affordable Care (ACI Group Holdings) and software company Medallia.

The latest regulatory filing noted that these two holdings were marked down to 60.3 and 69.8, respectively. As a result, the fund saw a spike in non-accrual loans in April.

ACI, headquartered in North Carolina and founded in 1975, operates as a dental support organization specializing in tooth replacement solutions. Medallia provides a software platform that leverages artificial intelligence to …

Full story available on Benzinga.com

This post was originally published here

Interactive Brokers Group (NASDAQ:IBKR) released first-quarter financial results and hosted an earnings call on Tuesday. Read the complete transcript below.

This transcript is brought to you by Benzinga APIs. For real-time access to our entire catalog, please visit https://www.benzinga.com/apis/ for a consultation.

Access the full call at https://edge.media-server.com/mmc/p/sqxktfic/

Summary

Interactive Brokers Group reported record net revenues and strong financial metrics, including a pre-tax profit margin of 77% and a 19% increase in commission revenues.

The company has been incorporating AI tools to enhance client experiences and operational efficiencies, with initiatives like Investment Themes and Connections tools, Ask IBKR tool improvements, and AI-powered client service chatbots.

The future outlook remains positive with continued growth in new accounts, particularly internationally, and strategic investments in marketing and AI integration, despite geopolitical and market volatility.

Operational highlights include a record $169 billion in client uninvested cash balances, a 38% increase in client equity to $789 billion, and a 20% rise in futures contract volumes.

Management expressed confidence in the business model and growth potential, raising the dividend by 35 cents annually, and highlighted the elimination of the SEC’s pattern day trader rule as a potential growth opportunity.

Full Transcript

OPERATOR

Thank you for standing by. Welcome to the Interactive Brokers Group first quarter 2026 earnings call. At this time, all participants are in a listen only mode. After the presentation there will be a question and answer session. To ask a question during the session you will need to press star 11 on your telephone. You will then hear a message advising. Your hand is raised to withdraw your questions. Please press star 11 again. Please be advised that today’s conference is being recorded Now. It is my pleasure to hand the conference over to the Director of Investor Relations, Nancy Stubby. Please proceed, Nancy.

Nancy Stubby (Director of Investor Relations)

Thank you. Good afternoon and thank you for joining us for our first quarter 2026 earnings call. Joining us today are Thomas Petterfy, our Founder and Chairman, Milan Gallick, our President and CEO and Paul Brody, our CFO. I will be presenting Milan’s comments on the business and all three will be available at our Q&A. As a reminder, today’s call may include forward looking statements which represent the company’s belief regarding future events which by their nature are not certain and are outside of the Company’s control. Our actual results and financial condition may differ possibly materially from what is indicated in these forward looking statements. We ask that you refer to the disclaimers in our press release. You should also review a description of risk factors contained in our financial reports filed with the SEC. In the first quarter, markets began with a strong January supported by solid equity performance, optimism around corporate earnings, expanding market breadth and resilience. Despite geopolitical risks, however, that momentum did not persist. Most global market indices declined in February and fell further in March, broadly mirroring the kind of price movement we saw in the first quarter of 2025. The S&P 500 ended the quarter down 5%. Notably, each of the Magnificent Seven technology stocks declined by more than the broader market, resulting in relative outperformance by the rest of the index. Despite this backdrop, we continue to see strong interest from both institutional and individual investors globally in opening and funding accounts. Client engagement remained healthy, trading activity increased and clients gradually took on more risk since last year’s tariff driven market decline as reflected in higher darts and increased risk exposure fees over the past several quarters. We continue to set records across key metrics including net revenue, total accounts and account adds. Growth in new accounts has driven higher clients uninvested cash balances which increased 35% year over year to a record $169 billion. Client equity rose 38% to $789 billion and was up 1% sequentially despite the 5% decline in the market. As continued account funding offset market performance across products, stocks, options and futures all deliver double digit year over year growth. Of note, futures contract volumes increased 20% to a quarterly record, driven by higher volatility and increased demand for hedging. Turning to our strategic initiatives, we have been incorporating AI across the organization. We had introduced Investment Themes and Connections tools, which use AI to streamline research and visualize relationships among trends, companies and securities to give our clients actionable investment ideas. This quarter, we expanded international company coverage and integrated themes into market screeners, watch lists and news summaries. We continued enhancing our Ask IBKR tool, which enables clients to query their portfolios for insights such as sector exposure, performance, tax lots, corporate actions and fundamentals. It now provides more direct and relevant responses. We also expanded the number of news sources we are authorized to summarize using AI within client service. Our AI powered chatbot continues to improve, successfully addressing a growing share of client inquiries in multiple languages. We continue to increase its accuracy and coverage while enabling our reps to focus on more complex issues. We are also applying AI to further automate processes across areas like onboarding, compliance and other operational areas. Expanding the use of AI remains a priority across the firm, both to enhance the client experience and to improve internal efficiency. While we have made meaningful progress, we see significant opportunities to extend it further. Our efforts translated into strong financial performance. Quarterly commission revenue and total net revenues both reached record levels at the same time. We remained disciplined on expenses. Our pre tax profit margin was 77%, maintaining our position as an industry leader and marking the sixth consecutive quarter with margins above 70%. In recognition of this, and as a sign of confidence in the strength of our business model, its growth potential and of our capital base, we revisited our allocation of capital and decided to increase the amount of dividend we paid 35 cents a year. Turning to our customer segments, our introducing broker pipeline remains exceptionally strong. We continue to maintain a robust pool of prospects while onboarding a substantial number of new introducing brokers and supporting the growth of existing ones. For larger introducing brokers, we offer customized solutions and have made it easier for them to launch with a wide range of configurable features. Many international brokers require specialized functionality to address their local investment, tax and regulatory requirements. We have user interface enhancements in development that we look forward to discussing in future quarters. Within our hedge fund segment, our hitouch prime brokerage offering continues to gain traction and we are particularly encouraged by referrals to new clients from existing clients. We’ve also received positive feedback on our ability to handle complex requirements and several clients have launched additional strategies on our platform. We had a productive quarter for new product introductions in cryptocurrency. We expanded our offering to clients in the EEA, significantly broadening our footprint. We also introduced crypto transfer capabilities, allowing clients to consolidate external holdings into their IBKR linked accounts. In addition, we launched access to the Coinbase Derivatives Exchange, providing trading in nano sized crypto contracts and perpetual style futures. Our prediction markets have been live and trading 24/7 in anticipation of increased interest ahead of the 2026 US midterm elections, we introduced Election Board, a discovery and trading tool that helps clients browse and trade political event contracts. You may also seen our client outperformance advertising campaign. As we shared previously, in 2025, the average account across each of our client segments outperformed the S&P on a net basis after fees and commissions. Our average individual account returned 19.2% versus 17.9% for the S&P, while our average hedge fund account returned 28.9%. The campaign began with digital channels and has since expanded into print and television globally. These outperformance results reflect our low cost offering and high interest paid on client cash, the strength of our platform and our focus on best execution. This focus means that we seek to maximize client outcomes by routing orders directly to the venues offering the best price rather than selling order flow to third parties. We continue to see growth in overnight trading, which is increasingly important for our global customer base. Overnight trading volumes nearly tripled year over year in the first quarter, increasing to 8.1 million trades from 2.8 million and up from 6.2 million in the fourth quarter. We remained highly active across all areas of the business with multiple initiatives underway across platforms and client segments. We look forward to sharing further updates in the coming quarters. With that, I will turn the call over to Paul Brody.

Paul Brody (Chief Financial Officer)

thank you Nancy and good afternoon. Thanks everyone for joining the call. We will start with our revenue items on page three of the release. We are pleased with our financial results this quarter as we again produced record net revenues and strong results in our key operating Metrics. Commissions rose 19% versus last year’s first quarter, reaching over $600 million. For the first time, we w robust trading volumes from our growing base of active customers across stocks, options and futures. Net interest income rose 17% year on year to 904 million, driven by higher balances and partially offset by lower benchmark interest rates. We w strength from margin borrowing and from our segregated cash portfolio, partially offset by interest we paid …

Full story available on Benzinga.com

This post was originally published here

Manhattan Associates (NASDAQ:MANH) reported first-quarter financial results on Tuesday. The transcript from the company’s first-quarter earnings call has been provided below.

Benzinga APIs provide real-time access to earnings call transcripts and financial data. Visit https://www.benzinga.com/apis/ to learn more.

View the webcast at https://event.choruscall.com/mediaframe/webcast.html?webcastid=azbi09OU

Summary

Manhattan Associates reported a strong start to 2026 with 24% growth in cloud revenue and a notable increase in services revenue.

Strategic initiatives focusing on go-to-market effectiveness have started to pay off, contributing to a 24% increase in RPO to $2.35 billion.

The company experienced a strong performance in new customer bookings, with over 55% generated from net new logos, and significant contributions from products beyond Active Warehouse.

The Active Agent pilot program is off to a promising start, with customers reporting improved operational efficiencies and ROI.

Financial performance exceeded expectations with total revenue of $282 million and an adjusted operating margin of 32.4%.

The company raised its full-year 2026 guidance, expecting total revenue growth of 11% excluding license and maintenance attrition.

Manhattan Associates continues to see opportunities for growth across its diverse product suite and industries, supported by strong pipeline and customer interest in AI capabilities.

Full Transcript

OPERATOR

Good afternoon, My name is Joe and I will be your conference facilitator today. At this time I would like to welcome everyone to The Manhattan Associates first quarter 2026 earnings conference call. All lines have been placed on mute to prevent any background noise. After the speaker’s remarks, there will be a question and answer period. If you would like to ask a question during this time, simply press Star and then the number one on your telephone keypad. If you would like to withdraw your question, press Star and then the number two. And as a reminder, ladies and gentlemen, this call is being recorded today, April 21, 2026. I would now like to introduce you to our host, Mr. Michael Bauer, head of investor relations of Manhattan Associates. Mr. Bauer, please go ahead.

Michael Bauer (Head of Investor Relations)

Great. Thanks Joe. And good afternoon everyone. Welcome to Manhattan Associates 2026 first quarter earnings call. I’ll I will review our cautionary language and then turn the call over to our President and Chief Executive Officer Eric Clark. During this call, including the Q and A session, we may make forward looking statements regarding future events or Manhattan Associates future financial performance. We caution you that these forward looking statements involve risks and uncertainties are not guarantees of future performance and actual results may differ materially from the projections contained in our forward looking statements. I refer you to Manhattan Associates SEC reports for important factors that could cause actual results to differ materially from those in our projections, particularly our annual report on Form 10K for fiscal year 2025 and the risk factor discussion in that report and any risk factor updates we provide in our subsequent Form 10Qs. Please note that the turbulent global macro environment could impact our performance and cause actual results to differ materially from our projections. We are under no obligation to update these statements. In addition, our comments include certain non GAAP financial measures to provide additional information to investors. We have reconciled all non GAAP measures to the related GAAP measures in accordance with SEC rules. You’ll find reconciliation schedules in the Form 8K we filed with the SEC earlier today and on our website@manh.com now. I’ll turn the call over to Eric.

Eric Clark (President and Chief Executive Officer)

Great. Great. Thank you, Mike. Good afternoon everyone and thank you for joining us as we review our first quarter results and discuss our increased full year 2026 outlook. Manhattan is off to a strong start to 2026, navigating a volatile global macro reporting record better than expected results on solid demand. Our Q1 revenue growth accelerated highlighted by 24% growth in cloud revenue and our services Revenue growth also continues to steadily improve throughout 2025. We spoke about the strategic investments that we’re making to improve our go to market effectiveness and accelerate our selling velocity. And while results from these initiatives will certainly not be linear, these investments have started to pay off in the first quarter and contributed to RPO increasing 24% to 2.35 billion. New customer bookings remain strong as over 55% of new cloud bookings were generated from net new logos, with the largest Q1 deal influenced Google Cloud Marketplace. We also experienced notable deal volume improvements across all deal types as well as a larger contribution from products beyond Active Warehouse, including Active Omni, Active Transportation and Active Planning, and we had strong bookings from all regions. Our win rate metric continues to be consistently above 70% and our renewal performance was solid and supportive of the plan that we highlighted last quarter. All of this provides a glimpse into the large opportunity that we have across all of our industry leading solutions. In summary, bookings Momentum continued in Q1, aligning with our goal of accelerating both ramped ARR and cloud revenue growth. From a vertical sales perspective, our end markets are diverse and we have healthy established footprints across numerous subsectors which include retail, grocery, food distribution, life sciences, industrial technology, airlines, third party logistics and more. For example, Q1 deals included a global retailer that became a new logo, Active Warehouse and Active Transportation Customer. One of the world’s largest retailers became a new logo. Active Omni Customer, a large auto parts distributor, became a new logo, Active Warehouse and Active Omni Customer, an H Vac focused distributor, became a new logo, Active Warehouse and Active Transportation Customer. A global wellness retailer converted from On Prem to Active Warehouse and a multinational food distributor that was an existing Active Transportation customer expanded to become an Active Warehouse customer. In addition to Several other impressive Q1 deals, our active Agent pilot program is off to a better than expected start. As I mentioned last quarter, our Active Agent offering consists of two primary elements, a set of base agents ready to be activated immediately and our Agent Foundry offering, which enables our customers to quickly build and deploy their own agents within the Active platform. And because we build all these agents directly into the Active platform, our customers don’t need to implement costly and complex external data lakes to make them work. Our Unified Cloud Native API first architecture enables us to deploy agents with almost no configuration or additional upfront effort, embedding AI agents directly into the workflow. No data lakes, no latency, deployed in minutes, not months, creating value for our customers in real time. And although our AI product set has only been in the market for one full quarter, we have an impressive list of pilot and paying customers that stretches across our diverse end markets and include some of the world’s most distinguished and identifiable organizations. For perspective, these customers include a global manufacturer and distributor of engineered components, a global 3 PL, a global energy management and industrial automation company, a global manufacturer and distributor of beauty products, a global healthcare services company, as well as several more tier 1 retail brands, grocery chains and others. We’re very excited that these existing active customers are interested in beginning their agentic journey with Manhattan, and we’re focused on helping them drive higher productivity, ROI and improve levels of customer satisfaction as we expand active agents across our customer basis. For this quarter’s product update, I’d like to go a bit deeper on our active agent Foundry and some of the strong deployment results which provide a bit more insight into why we believe AI is a significant opportunity for Manhattan and and why we are uniquely positioned to win. Core to our agentic AI philosophy is the concept of embedding both interactive and autonomous agents directly within the workflows of our key users. Rather than wave planners and shipping supervisors trying to incorporate standalone disconnected AI platforms, our active agents meet them where they live all day within our waving screens, within fulfillment progress monitors, and within Labor Planning UIs. By making AI ever present and highly available, our AI capabilities feel natural. They’re steeped in both domain expertise and real time operational data, always making suggestions and ready to take action autonomously. Our teams of forward deployed engineers assist our customers to activate our base agents and to build their own agents using our agent Foundry. As we look across the early success stories, we see an even balance in the value created by base and custom agents and we believe believe that trend will persist. One of the real advantages of building with Foundry is the ability to quickly target specific pockets of opportunity within a particular customer operation. For example, one of our retail customers here in the US saw a 5% improvement in order cycle times and reduced labor requirements in their largest distribution center via the use of a foundry developed custom agent. In this case, the agent dynamically reallocates resources to ensure replenishments are completed in time for orders to be fully picked and shipped. The continual matching of work to be completed within the requisite resources available is one of the most challenging issues a DC operator deals with nonstop each day. Unlike a manufacturing facility with a steady and predictable flow of work, DCs experience continuous peaks and valleys of different types of activity. This variability is driven by the inherent unpredictability of customer ordering and the high variability of what actually makes up those orders. In this case, the active agent looks both upstream and downstream, dynamically determining the work that needs to be done in each zone and continuously optimizes the assignments to ensure orders are complete and to maximize order shipment volume. The next example of a foundry created agent comes from one of our healthcare customers. From an operational standpoint, it’s often just a few unfilled units which stand in the way of large orders being ready to ship. This customer worked with our forward deployed engineers to create an agent which actively seeks out these aging units, ensuring that tasks are created and prioritized to get shipments completed faster. The use of this agent resulted in a double digit percentage reduction in loading times and improvement in on time shipment departures. On the base agent front, a number of our customers are using our wave coordinator agent to make sure orders are effectively turning into executable tasks. This agent finds and repairs any data conditions within items, orders, tasks or users which prevent the optimal flow of work to the floor, ensuring every unit on every line on every order has a path to clean execution. Specifically, this agent resulted in improved on time shipments for one of our food distribution customers as exceptions requiring triage were reduced by up to 75%. And for one of our industrial distribution customers, this very same agent increased line shipped by over 30% and improved order cycle times by over 25%. Now these are meaningful improvements that drive revenue and ROI for our customers. By leveraging case studies like this in Q1, we saw strong demand for active agents. We now have dozens of customers in various stages of AI maturity, exploring and realizing benefits as we leverage our FDE teams to continue to build additional agents for these customers and introduce the Active Agent Foundry to more of our active customers. As you’d imagine, Active agents will feature prominently at our Momentum User conference next month. Each of our product tracks will feature the latest in our agentic AI capabilities and we’ll have a number of customers giving testimonials to the power of our embedded Active agents. One of the important additions to this year’s conference will be an Active Agent boot camp. The day before the conference begins, we’ll host an interactive session where customers can get hands on experience with Foundry. They’ll choose a relevant issue from their own operations and work in a live sandbox guided by our FDE team to build and test their agents. This hands on experience is key to moving quickly from interest to production use cases. We’re happy to give as many customers as we can an opportunity to experience the ease and power of our Active Agent foundry and we can’t wait to see what they come up with in Las Vegas next month. I’ll close out my product updates by providing a bit more detail on two important wins that I highlighted earlier. First, we closed a substantial new logo order management deal with one of the world’s largest retailers. This deal represents our largest ever OMS bookings deal and speaks to the ongoing power of having the most capable and scalable OMS product in the industry. While historically this customer chose to build their E commerce tech stack in house, their E commerce business grew in scale and complexity to the point where they no longer believed it made sense to build the back end intelligence layer on their own. So we’re proud to welcome them into the Manhattan family. And finally, the power of solution unification continues to deliver for us both during the sales process and in our implementation results. We’re bringing solutions to life only possible when Warehouse and Transportation are truly unified we closed a large unified warehouse and transportation deal at a major retailer in Q1 in large part due to the power and simplicity of running a single application that for distribution and logistics. That unified approach lowers integration complexity and accelerates time to value. This win adds to the growing list of customers recognizing the value of the unified Active platform. Next month at Momentum, our customers and prospects will hear directly from one of our large retail customers as they share the valuable benefits they’re already achieving from having warehouse and transportation live together on the active platform. So with a strong pipeline across our product suite, numerous opportunities to drive growth, and our unique ability to consistently deliver leading innovation to the supply chain commerce universe, we’re very optimistic about our long term growth opportunity. So that concludes my business update and as you all know, we have a new cfo. So before I introduce Linda, I’d like to thank Dennis Storey for all of his contributions over the past 20 years. And now I’d like to introduce you to our new cfo, Linda Penny. As many of you know, Linda previously served as our Global Corporate Controller and Chief Accounting Officer and with her 20 plus years of experience right here at Manhattan, she brings a wealth of company specific industry and financial expertise that I’m sure all of you will appreciate. So with that, I’ll hand it over to Linda to report on her financial performance and outlook and then I will close out our prepared remarks before we open it up to Q and A. So Linda, over to you.

Linda Penny (Chief Financial Officer)

All right, great. Thanks Eric. Before I jump into the numbers, I’d like to thank Eric and the board for the opportunity to lead our talented finance team. I look forward to helping Eric and the rest of the team execute on the enormous …

Full story available on Benzinga.com

This post was originally published here

TORONTO, April 21, 2026 /CNW/ – Fidelity Investments Canada ULC today announced the April 2026 cash distributions for the Fidelity ETFs (“Fidelity ETFs“) and ETF Series of Fidelity mutual funds (“Fidelity Funds”) listed below.

For Fidelity ETFs, unitholders of record as of April 28, 2026, will receive a per-unit cash distribution payable on April 30, 2026, as detailed in the table below:

Fidelity ETF Name

Ticker

Symbol

Cash

Distribution

Per Unit (C$)

CUSIP

ISIN

Payment

Frequency

Exchange

Fidelity Canadian High Dividend ETF

FCCD

0.27558

31608M102

CA31608M1023

Monthly

Toronto Stock Exchange

Fidelity U.S. High Dividend ETF

FCUD/

FCUD.U

0.13494

31645M107

CA31645M1077

Monthly

Toronto Stock Exchange

Fidelity U.S. High Dividend Currency Neutral ETF

FCUH

0.11376

315740100

CA3157401009

Monthly

Toronto Stock Exchange

Fidelity U.S. Dividend for Rising Rates ETF

FCRR/ FCRR.U

0.11775

31644M108

CA31644M1086

Full story available on Benzinga.com

This post was originally published here

Beta Bionics (NASDAQ:BBNX) reported first-quarter financial results on Tuesday. The transcript from the company’s first-quarter earnings call has been provided below.

This content is powered by Benzinga APIs. For comprehensive financial data and transcripts, visit https://www.benzinga.com/apis/.

View the webcast at https://edge.media-server.com/mmc/p/23g86ces/

Summary

Beta Bionics reported Q1 2026 net sales of $27.6 million, a 57% year-over-year increase, driven by new patient starts and a growing installed base accessing the pharmacy channel.

The company’s gross margin improved to 59.5%, attributed to the efficiency of the pharmacy business model and lower manufacturing costs.

Full-year 2026 revenue guidance was raised to $131-$136 million, with expectations of 37-39% new patient starts reimbursed through the pharmacy channel.

Operating expenses increased by 47% year-over-year to $40.7 million, driven by sales force expansion and R&D investment in the Mint and Bihormonal programs.

Beta Bionics is addressing an FDA warning letter with corrective actions and continues to advance its Mint Patch Pump and bihormonal system development, aiming for a full commercial launch of Mint by 2027.

Full Transcript

OPERATOR

Good afternoon and welcome to the Beta Bionics first quarter 2026 earnings conference call. At this time, all participants are on the listen-only mode. After the speakers’ presentations, there will be a question and answer session and instructions will follow at that time. As a reminder, please be advised that today’s conference is being recorded. I would now like to hand the conference over to Blake Bieber, Head of Investor Relations. You may begin, sir.

Blake Bieber (Head of Investor Relations)

Good afternoon and thank you for tuning in to Beta Bionics first quarter 2026 earnings call. Joining me on today’s call are Chief Executive Officer Sean Saint and Chief Financial Officer Steven Fidder. Both the replay of this call and the press release discussing our first quarter 2026 results will be available on the Investor Relations section of our website. Information recorded on this call speaks only as of today, April 21, 2026. Therefore, if you are listening to the replay, any time sensitive information may no longer be accurate. Also on our website is our supplemental first quarter 2026 earnings presentation and updated corporate presentation. We encourage you to refer to those documents for a summary of key metrics and business updates. Before we begin, we would like to remind you that today’s discussion will include forward looking statements within the meaning of the Private Securities Litigation Reform Act of 1995. These statements reflect management’s expectations about future events, our product pipeline development timelines, financial performance and operating plans. Please refer to the cautionary statements in the press release we issued earlier today for a detailed explanation of the inherent limitations of such forward looking statements. These documents contain and identify important factors that may cause actual results to differ materially from current expectations expressed or implied by our forward looking statements. Please note that the forward looking statements made during this call speak only as of today’s date and we undertake no obligation to update them to reflect subsequent events or circumstances except to the extent required by law. With that, I’d now like to turn the call over to Sean.

Sean Saint

Thanks Blake. Good afternoon everyone and thank you for joining. We’re pleased to share with you all today our financial results for the first quarter as well as positive updates to our full year guidance for 2026. In Q1, the company continued to progress rapidly across our key initiatives both commercially in terms of driving adoption of the islet and expanding pharmacy channel access and developmentally in terms of advancing our Mint Patch Pump program and our bihormonal program. Our teams continue to execute relentlessly to deliver life changing solutions to the diabetes community today and over the long term. Diving into a brief overview of our Q1 performance, we delivered $27.6 million in net sales, which grew 57% year over year. Q1 revenue growth was driven predominantly by growth in new patient starts as well as our growing installed base of users who continued to access their monthly supplies for the islet through the pharmacy channel and who we continue to retain at a high level. The percentage of new patient starts that were reimbursed through the pharmacy channel grew to a high 30% compared to a low 30% in Q4 and a low 20% in Q1 2025. Our gross margin was 59.5%, expanding over 860 basis points year over year. Stephen will discuss our gross margin dynamics shortly in more detail, but I wanted to highlight this exceptional performance as evidence that the pharmacy business model is working, as is our ability to drive leverage and manufacturing costs as we scale. I’m proud of these results and eager to build on them as we progress throughout the year. With that, I’ll hand the call over to Steven to provide some additional color on our first quarter performance and our full year 2026 guidance.

Steven Fidder (Chief Financial Officer)

Stephen thanks Sean. Our Q1 performance exceeded our expectations across the board. Revenue performance was mainly driven by new patient starts and the recurring revenue generated from our growing pharmacy installed base. Q1 revenue saw modest contribution from pharmacy and DME stocking, but the stocking benefit in Q1 declined relative to Q4 in both channels. I’d now like to highlight some of our Q1 commercial metrics. New patient starts declined more than 10% but less than 20% compared to Q4 2025 consistent with our expectations. Given typical seasonal Demand patterns from Q4 to Q1, a high 30s percentage of our new patient starts in Q1 accessed islet through the pharmacy channel. The increase compared to the prior quarter exceeded our expectations. It is important to note that most pharmacy plan changes occur at the beginning and midpoint of the calendar year. Thus we do not expect an uptick from Q1 to Q2. Our pharmacy strategy continues to deliver strong financial results for the business driven by the advantaged recurring revenue model, low out of pocket costs for patients, a streamlined process for healthcare providers, and our ability to retain patients utilizing the product. Lastly, we continue to expand the insulin pump market as approximately 70% of our new patient starts came from people with diabetes using multiple daily injections prior to starting the islet. Moving on to gross margin, Q1 gross margin was 59.5% representing an increase of 52 basis points relative to the prior quarter and an increase of 864 basis points relative to the prior year the primary driver here is our pharmacy installed base which generates high margin recurring revenue and where we continue to see strong user retention. Previously, I’ve shared a simple way to think about how the pharmacy channel impacts our overall gross margin. The framework I introduced was that when our pharmacy installed base in a given quarter exceeds three times the the number of new patient starts through pharmacy in that same quarter, the pharmacy channel generates higher gross margin than the DME channel and becomes accretive to our overall gross margin. We crossed that threshold in Q1 and we expect further gross margin expansion as our pharmacy installed base continues to grow. The other key driver of strong margin performance this quarter was lower cost of materials for the islet relative to the prior quarter and year. We also benefited from a couple of one time gross margin tailwinds in the quarter, including higher than planned islet production and modest contribution from pharmacy islet revenue. While we don’t expect those one time tailwinds to repeat, I expect our core gross margin to remain a key area of strength going forward and an important driver of our ability to generate free cash flow at an earlier stage as compared to our diabetes peers. Total operating expenses in the first quarter were $40.7 million, an increase of 47% compared to $27.6 million in the first quarter of 2025. The increase in sales and marketing expenses relative to the prior year was driven by expansion of our field sales team, which we made excellent progress on in Q1 towards our previously stated goal of expanding by at least 20 sales territories in 2026. Newly onboarded territories generally take at least a quarter of to begin contributing meaningfully to sales, so we’re excited for those additions to take shape throughout the year. On R and D expenses, the increase relative to the prior year is driven by the Mint and Bihormonal projects. The increase in G and A expenses relative to the prior year is driven by continued efforts to scale the company in support of commercial growth and pipeline initiatives. As of March 31, 2026, we we have approximately $240 million in cash, cash equivalents and short and long term investments. We believe we are sufficiently capitalized to fund all of our key initiatives and remain well positioned to generate free cash flow well ahead of historical diabetes peers. We feel that all of the key indicators that we monitor suggest we are building a sustainably successful and profitable business, including strong product market fit, solid sales force productivity, growing pharmacy traction, healthy gross margins and continued operational discipline. I’d now like to discuss our Revised full year 2026 guidance which we’re raising across the board, we now project total revenue for the year to be 131 to $136 million, up from our prior guidance of 130 to $135 million. On pharmacy mix, we now expect 37 to 39% of our new patient starts to be reimbursed through the pharmacy channel versus our prior guidance of 36 to 38%. Our increased revenue and pharmacy mix guidance reflects our higher expectations for new patient starts driven by strong Q1 performance and the success we’ve had in onboarding new sales territories where we’re on track toward our goal of adding at least 20 territories in 2026. On gross margin, we are raising our outlook to 57.5 to 59.5% for the full year versus our prior guidance of 55.5 to 57.5%. Our gross margin outlook reflects the strong performance in Q1 normalized for one time tailwinds and our expectation of continued contribution from our pharmacy installed base along with increasing leverage from manufacturing scale over over the course of the year. To briefly comment on operating expenses, we expect year over year growth to accelerate for the remainder of the year compared to Q1 driven by continued expansion of the sales force, increased investment in brand and direct to consumer marketing, and spending related to Mint and our bihormonal programs. With that, I’ll hand the call back over to Sean.

Sean Saint

Thanks Steven. To wrap up the call, I’ll briefly touch on our remediation efforts regarding the FDA warning letter we received in late January and then highlight the progress we’re making in our innovation pipeline. Regarding the warning letter, the Company is continuing to take this matter very seriously. Our teams and leadership are conducting thorough systemic reviews of our quality management system and instituting corrective actions that we believe address the agency’s observations. The Company is responding quickly to the Agency’s concerns and we’ve been providing periodic updates to the FDA regarding changes to our processes and documentation that we believe address many of the FDA’s concerns. As stated in the warning letter. One example of our progress thus far is our efforts to remediate old complaints under our new complaint handling system and definitions for reportable complaints. We recently completed that work well ahead of schedule, which we believe is a good representation of our organization’s commitment to resolving the warning letter in an effective and timely manner. We still have work to do in other areas to fully address the agency’s concerns and we look forward to continuing to work together with the FDA to resolve this. Now for the pipeline, let’s Start with a quick update on Mint, our patch pump and development in Q1 we continued to advance Mint toward our goal of an unconstrained commercial launch by the end of 2027. We remain confident in our ability to gain FDA clearance for Mint, manufacture the product at scale and ultimately realize the opportunity to make Mint the market leading product in automated insulin delivery that we believe it has the potential potential to be for our bihormonal system development. In Q1 we initiated a Phase 2 a feasibility trial to stress test and iterate the system. Our phase 2A trials have helped us to identify further areas for system optimization and preparation for the more advanced stages of development inclusive of a phase 2B feasibility trial and phase 3 pivotal trials. I’m excited by our continued progress with the bihormonal system as it represents what we believe has the potential to be a transformative innovation for people with diabetes. Our industry talks a lot about moving towards fully closed loop algorithms which the industry generally defines as algorithms that don’t require any engagement from the user. Another topic that’s always top of mind for the industry is health outcomes. The ADA’s Glycemic Goals for most non pregnant adults with diabetes is less than 7% A1C and greater than 70% time and range which the vast majority of people with diabetes aren’t achieving today. When we look at the body of evidence of insulin only fully closed loop algorithms, we believe that they will not enable the majority of people with diabetes to achieve the ADA’s glycemic goals, but bihormonal may be different. We believe that the existing body of evidence of bihormonal fully closed loop algorithms shows the potential for the majority of people with diabetes to achieve the ADA’s glycemic goals. That is such a big reason why bihormonal has game changing potential for the industry at large and why our commitment to the program has never been stronger. At the end of Q1 we also launched a key new feature called Bionic Insights within our healthcare provider portal. This is a one of its kind intelligent data analytics and reporting feature within the industry. Bionic Insights surfaces clinically relevant indicators, user activities and system events and packages them into actionable insights that that help healthcare providers make more informed and personalized treatment recommendations for their patients. Early feedback on the feature has been overwhelmingly positive and we’re extremely excited by its potential to further improve experiences and outcomes with Islet. Lastly on our innovation pipeline I want to cover type 2 diabetes. In Q1 we continued to see some healthcare providers prescribe Islet to their type 2 patients off label. We estimate that 25 to 30% of our new patient starts in Q1 for from type 2. While we’re not committing to a specific timeline, we remain eager to pursue the type 2 diabetes indication through the FDA. I want to leave you all with one key message from today’s call. We are building a business that we believe is uniquely positioned to succeed over the short, medium and long term. Fueled by our exceptional commercial product, pharmacy channel strategy, operational efficiency, and what we believe to be the most innovative pipeline in the diabetes industry. We’re excited and motivated to deliver. Thank you all for joining today’s Call. We’ll now open up the call for Q and A.

OPERATOR

Thank you, ladies and gentlemen. As a reminder to ask a question, please press star one one on your telephone, then wait for your name to be announced. To withdraw your question, please press start 11 again. Please stand by while we compile the Q and A roster. Our first question comes from the line of of Mike Kratke with Lee Rink Partners. Your line is open.

Mike Kratke (Equity Analyst)

Hi, everyone. Thanks for taking my questions and congrats on the strong quarter, I guess, To start, it was really encouraging to see the high 30s percent of new starts through the pharmacy channel, but your updated guidance of 37 to 39% seems to suggest it could hang out there over the next few quarters. So is there any fundamental reason driving that assumption or, Or anything you’re seeing from a competitive standpoint that may be tempering expectations there?

Sean Saint

Hey, Mike, appreciate the question, and happy belated birthday, by the way. Forgot that I missed that. So, nothing notable about the calendar year other than the biggest step ups in pharmacy coverage happen at the start of the year …

Full story available on Benzinga.com

This post was originally published here

East West Bancorp (NASDAQ:EWBC) reported first-quarter financial results on Tuesday. The transcript from the company’s first-quarter earnings call has been provided below.

This content is powered by Benzinga APIs. For comprehensive financial data and transcripts, visit https://www.benzinga.com/apis/.

View the webcast at https://event.choruscall.com/mediaframe/webcast.html?webcastid=v1covp8b

Summary

East West Bancorp reported a record quarter for loans, deposits, and fee income, with total deposits growing 9% year over year and non-interest-bearing deposits increasing by $800 million.

The company experienced 7% year-over-year loan growth, driven primarily by an increase in commercial and industrial (C&I) loans and higher line utilization.

East West Bancorp’s net interest income increased to $671 million, with a focus on reducing deposit costs and maintaining a strong capital position with a tangible capital ratio of 10.3%.

Management highlighted a strong performance in wealth management, contributing to a 12% year-over-year increase in fee income.

Future guidance includes a revised net interest income growth of 6-8% for 2026 and maintaining a loan growth guidance of 5-7%, with an expectation of continued pressure on deposit pricing.

Full Transcript

OPERATOR

Good day and welcome to the East West Bancorp’s first quarter 2026 earnings call. All participants will be in a listen only mode.. Should you need assistance, please signal a conference specialist by pressing the star key followed by zero. After today’s presentation there will be an opportunity to ask questions. To ask a question you may press star, then one on a touchtone phone. To withdraw your question please press Star and then two. Please note this event is being recorded. I would now like to turn the conference over to Adrian Atkinson, Director of Investor Relations. Please go ahead.

Adrian Atkinson (Director of Investor Relations)

Thank you operator. Good afternoon and thank you everyone for joining us to review East West Bancorp’s first quarter 2026 financial results. With me are Dominic Ng, Chairman and Chief Executive Officer Chris Del Moral-Niles, Chief Financial Officer and Irene Oh, our Chief Risk Officer. This call is being recorded and will be available for replay on our investor relations website. The slide deck referenced during this call is available on our investor relations site. Management may make projections or other forward looking statements which may differ materially from the actual results due to a number of risks and uncertainties. Management may discuss non GAAP financial measures. For a more detailed description of the risk factors and a reconciliation of GAAP to non GAAP financial measures, please refer to our filings with the securities and Exchange Commission including the Form 8-K filed today. I will now turn the call over to Dominic.

Dominic Ng (Chairman and Chief Executive Officer)

Thank you Adrian Good afternoon and thank you for joining us for our first quarter earnings call. I’m pleased to report that East West had another record quarter for loans, deposits and fee income. Our consumer and commercial depositors continue to place their trust in us, helping grow total deposits by 9% year over year. Growth in non interest bearing deposits was particularly strong this quarter up nearly 800 million driven by our continued focus on providing solutions to retail and small business customers. We also delivered 7% year over year loan growth. C&I loans increased by more than 900 million quarter over quarter driven by a higher line utilization particularly among capital call borrowers. We also achieved a record quarter of fee income growing 12% year over year. We saw strong momentum in wealth management this quarter as we stayed closely engaged with clients. We continue to see opportunity to grow and diversify our fee revenues over time. Credit performance remains stable. Net charge offs and nonperforming assets were low in absolute terms consistent with our expectations and reflecting our disciplined approach to risk management. Our capital position remains a key advantage for East West. With a tangible capital ratio of 10.3%. We maintained this capital level while growing our balance sheet, increasing our dividend and opportunistically repurchasing shares. We continue to be focused on being disciplined stewards of our customers trust and our shareholders capital. I will now turn the call over to Chris to provide more details on our first quarter financial performance.

Chris Del Moral-Niles

Chris thanks Dominic. Let’s start with deposit growth on slide 4. Our end of period deposits grew by 1.8 billion quarter over quarter average DDA growth was up 12% year over year and nearly half a billion on an average basis. This checking account growth led us to price our Lunar New Year CD campaign more conservatively this year, allowing us to focus on CD balance retention and drive a better mix of deposit costs for the quarter and going into the rest of 2026. Money market deposits were also up 9% year over year as we continue to further diversify away from CDs and other higher cost deposits turning to loans on slide 5 as we have emphasized before, our focus has been and continues to be on growing Our C&I portfolio and CNI was the primary driver of growth in Q1. Most of the increase was driven by net line draws from existing customers while utilization ticked up across a range of industries. As Dominic mentioned, capital call related borrowing made up the lion’s share of the first quarter’s net growth. The quarter’s net draws on capital call lines reflected broad based increases in M and M&A and real estate property acquisitions across the quarter. While some of these lines have already been paid down here in the second quarter, private equity markets and real estate markets remain active and we expect to continue to participate in this activity during the remainder of the year. Residential Mortgage experienced a seasonally slower Q1 than we expected, but our pipelines have grown and continue to grow into Q2 and and we expect residential mortgage to be a consistent contributor to our overall loan growth during the year. We also grew commercial real estate balances this quarter. Our priority continues to be on supporting our long standing real estate relationship clients. Given the level of net growth we saw in the first quarter and the pipelines we see going into Q2, we are comfortable reiterating our guidance for the full year loan growth to be in the range of 5 to 7%. Now turning to 6, our loan portfolio remains well diversified with over 70% of our loans to commercial customers across a broad range of industries and commercial real estate asset types. CNI now represents 34% of our total loans reflecting the results of our focus and emphasis on balanced growth across our balance sheet. Our CRE portfolio remains diversified by a number of product types with an emphasis on multifamily retail and industrial projects. As we look ahead, we remain focused on growing the portfolio in a disciplined way that enhances diversification and remains aligned with our overall risk Appetite. Turning to Slide 7, we provided incremental disclosure on our Non-Deposit Financial Institution (NDFI) portfolio. Growth in this portfolio this quarter has been driven primarily by capital call lines. Our Non-Deposit Financial Institution (NDFI) portfolio is granular with diversification across industry and category types. 99.99% of our Non-Deposit Financial Institution (NDFI) loans are current and in the past decade there have been virtually no net charge offs in this portfolio. Approximately 30% of this portfolio is made up of capital call lines. Capital call is not a regulatory classification and our capital call loans are spread across a range of private equity, mortgage credit and business credit borrowers. I’ll now turn to net interest income and margin discussion on Slide 8 Quarterly dollar net interest income increased to 671 million reflecting our ability to grow our balance sheet while overcoming the headwinds of rate cuts in Q4 and two fewer days in Q1. Our short term liability sensitivity on deposit pricing dynamics and our positive deposit remixing during the quarter allowed us to continue to reduce our deposit costs driving period end costs down a further 6 basis points quarter over quarter. Looking back to the start of the cutting cycle, we have decreased interest bearing deposit costs by 111 basis points points comfortably exceeding our 50% beta guidance shared in prior periods. Moving on to fees on Slide 9, fee income grew 12% year over year to a new record $99 million for the quarter with significant growth in wealth management fees driven by structured note and annuity sales and deposit related fees driven by higher customer activity. We will remain focused on driving this growth and further diversifying our revenue overall and are quite encouraged by the pace of growth in fee revenues so far this year. We continue to aspire to deliver double digit year over year growth in fee income in 2026. Now turning to expenses on slide 10, East west continues to deliver industry leading efficiency or while investing for future growth. The Q1 efficiency ratio was 36.2%. Total operating non interest expense was 258 million for the first quarter and included seasonally higher payroll related costs, some increased stock based compensation costs and higher incentive comps reflecting increased commissions for our wealth management activity. Nonetheless, overall we continue to expect expenses will come in line with our guidance for the year. Now let me hand the call over to Irene for comments on credit and capital.

Irene Oh (Chief Risk Officer)

Thank you Chris Good afternoon to all on the call. As you can see on Slide 11, our asset quality metrics held stable and continue to broadly outperform the industry quarter over quarter. Non performing assets remained stable at 26 basis points as of March 31, 2026. We recorded net charge offs of just 9 basis points in the first quarter of 2026 or 12 million compared to 8 basis points in the fourth quarter. We recorded a higher provision for credit losses of 36 million in the first quarter compared with 30 million for the fourth quarter. We remain vigilant and proactive in managing our credit risk. Turning to Slide 12, the allowance for credit losses increased 26 million to 836 million or 1.44% of total loans as of March 31, reflecting quarter over quarter loan growth and the portfolio mix shift. We believe we are adequately reserved for the content of our loan portfolio given the current economic outlook. Turning to slide 13, all of east west regulatory capital ratios remain well in excess of regulatory requirements, requirements for well capitalized institutions and well above regional and national bank averages. East west common equity tier 1 capital ratio stands at a robust 15.1% while the tangible common equity ratio now sits at 10.3%. These capital levels continue to place us amongst the best capitalized banks in the industry in the first quarter. East west repurchased approximately 938,000 shares of common stock during the first quarter for 98 million. We currently have 117 million of repurchase authorization that remains available for future buybacks. East west also distributed approximately 111 million to shareholders via quarterly dividends. East West’s second quarter 2026 dividend will be payable on May 18, 2026 to stockholders of record on May 4, 2026. I will now turn it back to Chris to share our outlook.

Chris Del Moral-Niles

Thank you, Irene. We’ve assumed the forward curve as of March 31, which models no rate cuts and therefore we’re updating our full year 2026 net interest income guidance to grow between 6 to 8% up from our prior expectations of growth between 5 and 7%. We’re also updating our net charge offs and now projected to fall between 15 and 25 basis points for the full year. With that, we’ll be happy to open the call for questions. Operator thank you.

OPERATOR

We will now begin the question and answer session. To ask a question, you may press Star …

Full story available on Benzinga.com

This post was originally published here

Calix (NYSE:CALX) released first-quarter financial results and hosted an earnings call on Tuesday. Read the complete transcript below.

Benzinga APIs provide real-time access to earnings call transcripts and financial data. Visit https://www.benzinga.com/apis/ to learn more.

View the webcast at https://event.choruscall.com/mediaframe/webcast.html?webcastid=ZhIixHxK

Summary

Calix reported record revenue of $280 million in Q1 2026, with strong demand and a 3% sequential increase.

The company completed migrating all customers to its third-generation platform on Google Cloud, enhancing capabilities and market reach.

Future revenue guidance for Q2 2026 is set between $287 million and $293 million, with an annual growth expectation of 15% to 20%.

Non-GAAP gross margin was 57.2%, with a slight sequential decline due to dual cloud costs, but a year-over-year increase of 100 basis points.

Calix repurchased 3.3 million shares for $171 million and announced an additional $100 million for share buybacks.

The company anticipates reaccelerating RPOs in the second half of 2026 due to the Calixone platform’s momentum.

Calix is hosting its first Investor Day in four years to outline strategy, innovation, and long-term growth prospects.

Management expressed confidence in handling memory component cost challenges through surcharges and strategic purchasing.

Full Transcript

OPERATOR

Oh my God. Greetings everyone and welcome to the Calix First Quarter 2026 Earnings Conference Call. At this time, all participants are in a listen only mode. A Q&A session will follow the brief prepared remarks. If anyone should require operator assistance during the conference, please press Star-0 on your telephone keypad. As a reminder, this conference is being recorded. It is now my pleasure to introduce your host, Nancy Fazioli, Vice President of Investor Relations. Nancy, please go ahead.

Nancy Fazioli (Vice President of Investor Relations)

Thank you Alicia and good afternoon everyone. Thank you for joining our first quarter 2026 earnings call today. On the call we have President and CEO Michael Weaning and Chief Financial Officer Corey Sindelar. As a reminder, today after the market closed, Calix issued news releases which were furnished on a Form 8K along with our stockholder letter and were also posted on the Investor Relations SECtion of the Calix website. Today’s conference call will be available for webcast replay in the Investor Relations SECtion of our website. Before I turn the call over to Michael for his opening remarks, I want to remind everyone that on this call we will refer to forward-looking statements including all statements the company will make about its future financial and operating performance, growth strategy and market outlook and that actual results may differ materially from those contemplated by these forward looking statements. Factors that could cause actual results and trends to differ materially are set forth in the first quarter 2026 letter to stockholders and in the annual and quarterly reports filed with the SEC. Calix assumes no obligation to update any forward looking statements which speak only as of their respective dates. Also in this conference call we will discuss both GAAP and non GAAP financial measures. A reconciliation of GAAP to non GAAP measures is included in the first quarter 2026 letter to stockholders. Unless otherwise stated, all financial information referenced in this call will be non-GAAP. With that Michael, please go ahead.

Michael Weaning (President and CEO)

Thank you Nancy. It was another incredible execution quarter for the Calix team. Record revenue with strong demand continuing into 2026 with customers. At the end of March we completed the migration of all existing customers to the third generation of the Calix platform, launching on Google Cloud, thereby enabling the expansion of our capabilities and the markets that we target. As important, those customers who expand their partnerships with Calix on CalixOne begin to see the benefits rapidly as agent workforce and our AI native platform comes to life. The impact of AI will now start contributing to our customers success by helping them transform their operations, allowing their teams to add capacity and capability with AI and accelerate experiences that they need to differentiate in the markets. They serve, thereby enabling their teams to compete and win. Today’s call is focused on the quarter and our 2026 outlook. Tomorrow at Investor Day, we’ll go deeper on how Calixone expands the opportunity of our model with proof directly from customers who will attend the event and are ready to share. With that, I’ll turn it over to Corey to walk through the results and guidance and then we’ll take your questions.

Corey Sindelar (Chief Financial Officer)

Corey, over to you. Thank you, Michael in the first quarter of 2026, Calix delivered yet another quarter of record revenue of $280 million, marking a sequential increase of 3% driven by continued strong demand for our platform. This quarter we welcomed 14 new customers, reinforcing our ongoing efforts to grow our customer base while supporting their expansion within the local communities they serve. Remaining performance obligations were $376 million, down 2% sequentially and up 11% year over year. The sequential decline related to a robust fourth quarter comparison and our focus on completing the migration of customers to the new third generation platform. Current RPOs in the first quarter were a record $157 million, representing a 3% sequential increase and a 22% rise from the same period last year. We anticipate that RPOs will reaccelerate in the second half of 2026 as we gain momentum with CalixOne, underscoring the strength of our business model as customers focused on delivering exceptional experiences, adopt our platform, add incremental offerings and win new subscribers. Non GAAP gross margin was 57.2%, down 80 basis points sequentially due to investment in our dual cloud environments as we migrated customers to our third generation platform. Compared to last year, non GAAP gross margin increased 100 basis points. Our balance sheet remains strong. DSO at the end of the first quarter was 36 days. Inventory turns remain steady at 3, reflecting continued inventory investments to address robust demand and building supply continuity and we generated free cash flow in the quarter of $7 million. We also invested $171 million to buy back 3.3 million shares of our common stock at an average price of $51.34. Furthermore, the board today authorized another $100 million to be added to this program. This investment speaks to our belief in the tremendous opportunity ahead and our commitment to creating lasting value for our stockholders. We finished the quarter with a strong cash and investment balance of $243 million. Turning to guidance, our revenue guidance for the second quarter of 2026 is between 287 and $293 million, representing a 4% increase at the midpoint over the prior quarter. This reflects continued robust demand trends and a modest benefit from recapturing a portion of the higher memory cost via a memory surcharge. For the year, we expect revenue to grow between 15 and 20%. With demand supply disconnect so large related to memory components, there will inevitably be some companies that will come up short. Our first priority is to ensure that we have adequate supply such that our customers can continue to add subscribers and and take market share. Our advanced purchasing had allowed us to avoid higher memory component costs during the first quarter. However, that advanced supply has run its course and we now face market prices. We are partnering with our customers to share in the higher memory costs by initiating a surcharge, albeit it is a partial cost recovery and without adding gross profit is one way we can help our customers in this unfortunate memory supply environment. Our gross margin guidance for the second quarter of 2026 is between 24 and a quarter and 20 sorry, 54 and a quarter and 57 and a quarter percent reflecting the effects of higher memory component costs, the impact from surcharges and the customer and product mix. The decline in appliance gross margin is expected to be offset by improvement in software …

Full story available on Benzinga.com

This post was originally published here

Intuitive Surgical (NASDAQ:ISRG) released first-quarter financial results and hosted an earnings call on Tuesday. Read the complete transcript below.

This transcript is brought to you by Benzinga APIs. For real-time access to our entire catalog, please visit https://www.benzinga.com/apis/ for a consultation.

Access the full call at https://edge.media-server.com/mmc/p/rwnbqatp/

Summary

Intuitive Surgical reported a 23% increase in Q1 2026 revenue to $2.77 billion with a significant rise in procedure volume, driven by 17% total procedure growth.

The company saw strong adoption of Da Vinci 5, SP, and Ion platforms, with notable growth in Da Vinci procedures in the U.S. and Europe, despite challenges in Asia.

The company updated its 2026 full-year guidance, expecting Da Vinci procedure growth of 13.5% to 15.5%, and improved non-GAAP gross profit margin guidance to 67.5% to 68.5%.

Intuitive Surgical highlighted strategic investments in digital infrastructure and AI capabilities to enhance surgical outcomes and operational efficiency.

Management emphasized continued international expansion, including acquisitions of distributors in Europe, and addressed competitive pressures and regulatory challenges in different regions.

Full Transcript

OPERATOR

Good day and thank you for standing by. Welcome to the intuitive first quarter 2026 earnings conference call. At this time, all participants are in a listen only mode. After the speaker’s presentation, there will be a question and answer session. To ask a question during this session, you will need to press star 11 on your telephone. You will then hear an automated message advising your hand is raised to withdraw your question. Please press star 11 again. Please be advised that today’s conference is being recorded. I would now like to hand the conference over to your speaker today, Dan Conley, Vice President, Investor Relations. Sir, please go ahead.

Dan Conley (Vice President, Investor Relations)

Good afternoon and welcome to Intuitive’s first Quarter Earnings Conference Call. Joining me today are Dave Rosa, our CEO, and Jamie Samath, our CFO. Before we begin, I would like to remind you that comments made on today’s call may contain forward looking statements. Actual results may differ materially from those expressed or implied as a result of certain risks and uncertainties. These risks and uncertainties are described in our Securities and Exchange Commission filings, including our most recent Form 10K filed on February 3, 2026. Our SEC filings can be found through our website intuitive.com or at the SEC’s website. Investors are cautioned not to place undue reliance on such forward looking statements. Please note that this conference call will be available for audio replay on our website in the Events section under our Investor Relations page. We are experiencing technical difficulties with distribution of today’s press release. You can find today’s 8K, including our press release on our website or at the SEC’s website. The Q1 2026 financial data tables have been posted to our website as well. Our format for this afternoon’s earnings conference call is as follows. Dave will review business and operational highlights. Jamie will provide a review of our financial results and procedure highlights. I will review clinical highlights and discuss our updated financial outlook for 2026. And finally, we will host a question and answer session. With that I will turn it over to Dave.

Dave Rosa (Chief Executive Officer)

Good afternoon and thank you for joining us. Q1 was a solid start to the year for intuitive, driven by 17% total procedure growth and broad based adoption across DaXiinci and Ion platforms as customers continue to advance minimally invasive care. In Q1, Da Xiinci procedures grew 16% to 847,000 and ion procedures increased 39% to 43,000. Performance was strong in the US and Europe with mixed results in Asia. In the United States, Da Xiinci procedures grew 14% year over year, led by strength. In general surgery growth was supported by a 31% increase in after hours procedures and higher overall utilization. DaXiinci Xi utilization continues to exceed that of Da Xiinci Xi, driving U.S. utilization growth to 4%. Outside the U.S. Da Xiinci procedures grew 19%, led by continued strength in general surgery and gynecology as adoption expands beyond urology. The lower growth rate relative to prior quarters reflects ongoing challenges in China and Japan. In China, the environment remains largely consistent with recent quarters, reflecting relatively low tender activity across the category, domestic competition and policy driven pricing pressure. Given our belief in the long term opportunity, we continue to make investments to improve procedure growth, establish favorable patient charge codes and support other market access activities. In Japan, procedure growth improved sequentially but remained below historical levels following fewer system placements in 2025. We are encouraged by recent policy developments including incremental financial support for higher volume robotic programs and new reimbursement for seven additional procedures, both policies to be effective starting in June 2026. Jamie will describe these changes in more detail shortly. I have confidence in our ability to execute our international strategy. Investments in our organizational capabilities, clinical trials and research and market access efforts are yielding supportive robotic surgery policies and reimbursements in many of the countries we serve. The arc of progress is evident with with OUS procedures now representing 38% of total Da Xiinci volume, up from 25% a decade ago, we are well positioned to expand access and drive deeper adoption in these countries with the addition of Xi to our system portfolio and our overall ecosystem of technologies, training and services. Turning to Capital, we placed 431 DaXiinci Systems in Q1, including 232 DaXiinci 5 Systems, 34 Single Port (SP) Systems and 34 Xi Systems. We also placed 52 Ion Systems in the quarter. As DaXiinci Xi moves into broader clinical use globally, customer adoption and feedback remain very encouraging. Customers are building experience with the DaXiinci Xi ecosystem, resulting in increased clinical throughput and expanded access to DaXiinci surgery. At the recent annual SAGES conference, several clinical abstracts demonstrated objectively lower tissue forces using Da Xiinci Force Feedback instrumentation across multiple procedure types. We continue to believe that objective knowledge of applied forces in surgery will lead to improved surgical outcomes and are investing to demonstrate this at scale. In March, we received FDA 510(k) clearance for additional uses of our force feedback instruments. Five of six instruments are now cleared for 15 uses, while our Mega SutureCut Needle driver is cleared for 10 uses. Combined with multi year investments in supply chain and manufacturing, this clearance supports broader availability in Q2 that will increase over the rest of the year. We expect adoption of force feedback instrumentation to progress steadily through 2026 and beyond. Turning to our digital ecosystem, we continue to invest in the data and digital infrastructure that underpins our longer term innovation. Roadmap. DaXiinci5 captures real world surgical data at greater scale and fidelity, enabling deeper insight into how procedures are performed in practice. That insight, paired with clinical context from connected electronic medical records, provides better understanding of variation, workflow and outcomes and informs current and planned digital and AI enabled capabilities. My Intuitive plus continues to play an expanding role in training and program support with growing adoption of intuitive telepresence capabilities that enable proctoring, mentoring and collaboration across surgeons and sites. Collectively, these efforts are foundational to to our long term digital and AI roadmap where we expect to add telesurgery, deeper decision support and augmented dexterity, including aspects of future automation, all in pursuit of Advancing the quintuple aim I’m excited by the progress our development teams are making turning to our single port platform. Single Port (SP) momentum continued in the quarter with procedures growing 68% year over year. Growth was driven by expansion in Korea and the US and ongoing early adoption across select international markets. Recently, US surgeons performed the first non ide nipple sparing mastectomy cases as we advance our measured rollout focused on training and support of our customers. We also moved our single port stapler into broad launch which will support deeper penetration in thoracic and colorectal procedures as customers expand their programs. Our teams are focused on new product and procedure launches, expanding our customer base and securing new geographic clearances over the midterm. Single Port (SP) will incorporate much of the DaXiinci 5 ecosystem, including current and future digital and AI capabilities. We’re excited about the potential of Single Port (SP) to drive meaningful improvement in the quintuple aim. Moving to Ion we’re pleased with the results and progress this quarter. Ion’s North Star is to help physicians improve lung cancer patient survival. Clinical publications continue to reinforce progress here, including a recent Mayo Clinic publication of approximately 2000 patients which demonstrated that use of ION supports earlier identification of malignancy with the potential to improve patient survival. Dan will walk through the study in more detail later in the call. Our teams are making progress on our rapid on site tissue evaluation technology or Rapid On-Site Evaluation (ROSE) and endobronchial ultrasound integration as we look to further streamline the time from detection to diagnosis. Looking ahead, our company priorities for 2026 are unchanged. First, the global expansion of our platforms, digital feature releases and ecosystem enhancements. Second, increased adoption for focused procedures by country through training, commercial activities and market access efforts. Third, building industrial scale, enhancing product quality and achieving manufacturing optimization and finally advancing innovation to reach more patients in current and new disease states. Before I turn the call over to Jamie, I want to recognize an important leadership transition at Intuitive. Dr. Miriam Curette is retiring this quarter after more than 20 years as Intuitive’s Chief Medical Officer. I’d like to thank Miriam for all her efforts in advancing our mission as a physician, a patient advocate and a business leader. I’m also pleased to announce Dr. Jamie Wong’s promotion to Chief Medical Officer and member of our executive leadership team. Jamie provides combines a deep clinical background as a practicing Da Xiinci urologist with his experience of more than a decade at Intuitive leading a variety of functions. As cmo, he will lead our global medical office overseeing customer training, clinical evidence generation and research and reimbursement and market access efforts. And with that, I’ll turn the time over to Jamie to take you through our finances in greater detail.

Jamie Samath (Chief Financial Officer)

Good afternoon. I’ll describe our performance on a non-GAAP basis and I will summarize our GAAP results later in my remarks. A reconciliatIon between our non-GAAP and GAAP results is available on our website. All references to Total procedures and their related growth rates include both Da Vinci and Ion procedures. Before detailing our quarterly results, I would like to briefly address the cyber incident that occurred during the first quarter which resulted in unauthorized access to some customer business and contact informatIon as well as certain Intuitive employee and corporate data contained in certain of our it business applicatIons. The incident did not disrupt our business or manufacturing operatIons and did not affect our products. it also did not have a significant impact on our first quarter financial results. We have contained the incident, notified customers, and informed appropriate data privacy regulators. We are also taking additIonal steps to further strengthen our CyberSecurity protocols. In Q1, total procedures grew 17%, reflecting 16% growth in Da Vinci procedures and 39% growth in Ion procedures. Quarter one revenue increased 23% to $2.77 billIon, with recurring revenue also higher by 23% to $2.4 billIon, accounting for 86% of total revenue on a constant currency basis, revenue growth was 22%. Non GAAP operating margin was strong at 39%, primarily reflecting leverage of fixed costs. The strength of our financial results reflected continuing global expansIon and procedure adoptIon of our Da Vinci XiiON and Single Port platforms. Turning to the clinical side of our business in the US, total procedures increased 15%, reflecting 14% growth in Da Vinci procedures and 37% growth in Ion procedures. For our Da Vinci platforms, we continue to see strong growth in cholecystectomy and appendectomy procedures which combined grew by 31%, driven in part by by continued expansIon of use of Da Vinci during after hours and on weekends. We are starting to see emerging evidence that a broad set of clinical outcomes for appendectomy are improved with Da Vinci surgery as compared to laparoscopy. Over the last year in the US We’ve invested in incremental clinical support for surgeons performing benign gynecology procedures given the opportunity to improve patient outcomes. While total US gynecology procedures grew 10% in Q1, investments in this area drove a 19% increase in non hysterectomy benign procedures including sacrocopopexy endometriosis, oophorectomy and myomectomy during the quarter. Da Vinci bariatrics procedures in the US Continue to be impacted by the growth in use of GLP1s declined approximately 10%. Da Vinci utilizatIon in the US increased 4% in Q1 higher than recent quarters, driven by a growing in store base of Da Vinci 5 systems where utilizatIon is approximately 11% higher than Xi with respect to the expiratIon of subsidies for enhanced premiums under aca. While we did not see any significant impact on procedure volumes in Q1 at this time, we remain cautious as to what the potential impact, if any, might be outside the US total procedures grew 20% with Da Vinci procedure growth of 19%, reflecting strong results in India, Canada, the UK, Korea and Taiwan and solid growth in distributor markets Italy and Germany. The market in China continues to be challenging. In Q1, procedure growth was below the corporate average, reflecting lower tenders and competitive and pricing pressures. There are ongoing discussIons with provinces regarding potential new charge code and reimbursement policies in China for robotic procedures. We are actively engaged with policymakers but do not expect clarity on the outcome of these matters until 2027. Procedure Growth in Japan was also below the corporate average, reflecting lower capital placements over the last several quarters in Q1. The Japanese Ministry of Health, labor and Welfare or MHLW recently introduced incremental reimbursement for hospitals that exceed robotic procedure volumes of 200 qualifying cases per year. In additIon, seven new procedures have been granted robotic reimbursement starting in June of 2026. Furthermore, rectal resectIon has been granted premium reimbursement when performed robotically. While we are encouraged by these steps, we remain cautious in our outlook for the Japanese market in the short term, given the financial positIon of public hospitals in recent periods. Globally, we continue to see healthy procedure growth for our Single Port platform at 68% for Q1 with strength in Korea and continuing robust early stage growth in Europe, Japan and Taiwan. In the US Single Port average system utilizatIon continued to accelerate following recent additIonal clearances, growing 22% as compared to quarter one of last year. During the quarter we moved our new Single Port Stapler into broad launch in the US where it was used in almost 40% of cases where we would expect a stapler to be used. We are planning to move the Single Port Stapler into measured launch in Korea and Europe in Q2 as we expand manufacturing capacity as a result of our clinical performance. Total INA revenue in quarter one grew 23% to $1.7 billIon. Da Vinci INA revenue per procedure was approximately $1,880 compared to $1,780 last year, driven by customer ordering patterns, a higher mix of Single Port and Da Vinci 5 procedures and FX, partially offset by lower bariatric and hilarcholecystectomy procedures. Turning to capital performance and starting with our Da Vinci business, we placed 431 Da Vinci Systems in quarter one, a 17% increase from the 367 systems placed in the same quarter last year. 232 of the 431 placements were Da Vinci 5, including 40 in OUS markets. The install base of Da Vinci 5 is now almost 1500 systems used by almost 13,000 surgeons since launch. Customers acquired 34 refurbished Xi systems in Q1 compared to 2 in the year ago period. 26 of the 34 placements were in OUS markets in segments where we see greater cost sensitivity. There were 119 trading transactIons in quarter one, up from 67 a year ago, primarily driven by US customers upgrading to Da Vinci 5. In the US we placed 226 systems, up from 204 last year to driven by adoptIon of Da Vinci 5. Outside the US we placed 205 systems, an increase of 26% compared to the 100 and 63 systems placed last year. OUS placements included 117 systems in Europe, 62 in Asia and 26 in the rest of the world compared to 88, 52 and 23 respectively last year. Relative strength in Europe was driven primarily by the UK where we placed 34 systems. As the NHS closed out its budgetary year, we placed 13 systems in Japan and …

Full story available on Benzinga.com

This post was originally published here

U.S. equity markets closed sharply lower Tuesday as investors reacted to escalating geopolitical risk, mounting uncertainty around Federal Reserve leadership, and a major corporate transition at Apple. The S&P 500 fell 0.63% to 7,064.02, the Dow Jones Industrial Average dropped 292.96 points to 49,149.60, and the Nasdaq Composite declined 0.59% to 24,259.97, while the Russell 2000 slid 1.16% to 2,760.47. The CBOE Volatility Index (VIX) surged 9.75% to 20.71, signaling heightened hedging activity. “The market is repricing geopolitical risk in real time,” said Art Hogan, Chief Market Strategist at B. Riley Financial.

The primary driver of the selloff was the deteriorating outlook for U.S.-Iran ceasefire negotiations ahead of a critical deadline. Iranian Foreign Ministry spokesperson Esmaeil Baghaei said Tehran’s hesitation stems from “contradictory messages, contradictory behaviors, and unacceptable actions by the American side,” according to statements carried by Iranian state media. Meanwhile, Pakistan Information Minister Attaullah Tarar said “a formal response from the Iranian side… is still awaited,” underscoring uncertainty around the planned talks in Islamabad.

At the White House, senior officials moved into emergency discussions as the timeline narrowed. President Donald J. Trump said it is “highly unlikely” he would extend the ceasefire, adding he expects “to be bombing” if no agreement is reached—remarks that intensified market anxiety. Oil prices surged in response, with U.S. crude rising 5.00% to $91.79 per barrel, reflecting fears over continued closure of the Strait of Hormuz. “Energy markets are reacting directly to the risk of supply disruption,” said Helima Croft, Global Head of Commodity Strategy at RBC Capital Markets.

Simultaneously, investors tracked a contentious confirmation hearing on Capitol Hill for Kevin Warsh, nominated to serve as Chair of the Federal Reserve. Testifying before the Senate Banking Committee, Warsh stressed that “central bank independence is essential,” as lawmakers pressed him on the implications of a Justice Department investigation into current Fed Chair Jerome Powell. “The economy’s potential is growing quite quickly,” Warsh added, pointing to artificial intelligence-driven productivity gains as a factor that could support lower rates.

The hearing quickly turned confrontational. Sen. Elizabeth Warren (D-Mass.) warned that the investigation into Powell is “designed to threaten all the members of the Fed to do Trump’s bidding,” while Sen. Thom Tillis (R-N.C.) stated, “Let’s get rid of this investigation, so I can support your confirmation.” With Powell’s term nearing its end on May 15, the unresolved probe leaves the nomination timeline uncertain and injects further instability into monetary policy expectations.

Adding to the day’s pressure, Apple (AAPL) shares fell 2.7% after the company announced a sweeping leadership transition. In an official statement, Apple confirmed that Tim Cook will become Executive Chairman, with John Ternus, Senior Vice President of Hardware Engineering, stepping in as CEO effective September 1, 2026. “It has been the greatest privilege of my life to be the CEO of Apple,” Cook said in the release.

Apple’s board emphasized continuity but acknowledged the magnitude of the shift. Arthur Levinson, Apple’s Chairman, said Cook’s “integrity and values are infused into everything Apple does,” while incoming CEO John Ternus said he is “humbled to step into this role,” pledging to uphold the company’s long-standing principles. “Leadership transitions at this scale inevitably introduce uncertainty in the near term,” said Dan Ives, Managing Director at Wedbush Securities.

By the closing bell, markets were contending with three converging risks: a potential breakdown in Middle East diplomacy, uncertainty at the Federal Reserve’s highest levels, and leadership change at one of the world’s most influential companies. “When geopolitical, policy, and corporate risks align, markets tend to de-risk quickly,” said Mark Haefele, Chief Investment Officer at UBS Global Wealth Management.

With the ceasefire deadline approaching and no confirmed diplomatic breakthrough, traders are bracing for near-term volatility. The next catalyst could arrive within hours—either a last-minute agreement that stabilizes energy markets or an escalation that further disrupts global risk sentiment heading into the next phase of earnings season.

JBizNews Desk

Israel’s surging currency is forcing investors to confront a key question: does the sharp decline in the shekel-dollar exchange rate present a buying opportunity for U.S. assets, or signal a longer-term shift toward a structurally stronger shekel?

The shekel’s rally over the past year has significantly eroded returns for Israeli investors holding dollar-denominated assets. Even as U.S. equities posted strong gains, currency movements offset much of the upside when converted back into shekels. “Currency can dominate returns in global portfolios,” said Jonathan Katz, Chief Economist at Leader Capital Markets, noting that exchange-rate moves have become a central driver of investor outcomes.

For example, investments tracking major U.S. indices delivered strong returns in dollar terms, but those gains were substantially reduced once adjusted for currency. The dynamic has led to capital outflows from some foreign investment tracks, reflecting investor frustration with the currency drag.

Several structural factors are supporting the shekel’s strength. Israel’s current account surplus, steady inflows from the technology sector, and a decline in perceived geopolitical risk have all contributed to sustained demand for the local currency. “Israel continues to attract significant foreign capital,” said Harel Kodesh, former CEO of SAP Israel and tech investor, pointing to ongoing deal activity as a key source of dollar inflows.

Large-scale transactions in the technology sector have amplified the trend. High-profile acquisitions—such as major cybersecurity deals—have injected substantial foreign currency into the Israeli economy, reinforcing appreciation pressure on the shekel. At the same time, global weakness in the U.S. dollar has further strengthened the relative position of Israel’s currency.

“The shekel is benefiting from both domestic strength and global dollar softness,” said Francesco Pesole, FX Strategist at ING, adding that Israel has emerged as one of the stronger currencies in the current global cycle.

The recent move below NIS 3 per dollar is particularly notable. While the exchange rate reached similar levels decades ago, analysts emphasize that today’s environment is driven primarily by market forces rather than policy intervention. “This is a fundamentally different backdrop,” said Yossi Fraiman, CEO of Prico Risk Management, noting that the move reflects structural flows rather than temporary distortions.

Still, whether the current level represents an opportunity remains a matter of debate among market participants. Some analysts argue that the weaker dollar presents an attractive entry point for investors seeking exposure to U.S. assets, particularly given ongoing strength in the American economy.

“For investors with dollar liabilities or planned spending, this is a reasonable time to increase exposure,” said Eran Yaron, Head of Markets Strategy at a leading Israeli financial institution, emphasizing the practical benefits of locking in favorable exchange rates.

Others are more cautious, warning that holding dollars purely as a currency position may not deliver meaningful returns over time. “Cash in foreign currency is not an investment—it’s a hedge,” said Saar Weintraub, Deputy CIO at Altshuler Shaham, adding that long-term fundamentals continue to favor shekel strength.

Weintraub noted that capital inflows into Israel are likely to persist, driven by the country’s technology sector and improving economic outlook. “The level itself is less important than the underlying forces,” he said, suggesting that the recent move below NIS 3 per dollar may not represent a lasting floor.

At the same time, global factors could still shift the balance. U.S. interest rates, Treasury market dynamics, and broader risk sentiment remain key variables influencing currency markets. “The dollar’s trajectory will depend heavily on bond markets,” said Kit Juckes, Chief FX Strategist at Société Générale, highlighting the role of yields in shaping currency flows.

For investors, the decision ultimately comes down to strategy. Those seeking diversification or exposure to U.S. markets may view the current environment as an opportunity, while others may remain cautious given the structural strength of the shekel.

Looking ahead, the interplay between local fundamentals and global macro conditions will determine whether the shekel’s rally continues or stabilizes. For now, the debate reflects a broader uncertainty in currency markets: whether recent moves represent a temporary imbalance—or the beginning of a longer-term shift.

JBizNews Desk

This S-1 filing isn’t just a roadmap for an IPO; it’s a peek into the high-stakes ‘Game of Thrones’ currently being played by Big Tech over the future of the power grid. While the headline of Fervo Energy Company‘s filing is the 3-gigawatt target, the fine print tells a story of strategic dominance. Alphabet Inc‘s (NASDAQ:GOOGL) (NASDAQ:GOOG) Google isn’t just acting as a customer—it has effectively built a legal fence around Fervo to ensure its rivals stay on the outside looking in.

Here is the breakdown of the ‘Golden Handcuffs’ deal.

1. The Competitor Blockade

The most striking revelation in the S-1 filing on page 47 is the GFA (Geothermal Framework Agreement) clause that essentially gives Google veto power over who Fervo hangs out with. The agreement restricts Fervo from accepting investment or financing from a “broad category of entities defined as competitors” of Google’s.

This is a strategic masterstroke. By locking Fervo out of rival capital, Google ensures that Microsoft Corp (NASDAQ:MSFT), Amazon.com, Inc.

Full story available on Benzinga.com

This post was originally published here

Tractor Supply (NASDAQ:TSCO) shares are tumbling on Tuesday, down 8.85% at last check, as first-quarter financial results reveal a decrease in net income and diluted earnings per share.

The stock’s decline comes as the broader market is experiencing a slight downturn, with the S&P 500 down 0.31% and the Consumer Discretionary sector down 0.06%, adding pressure to shares as markets edged lower.

  • The company reported:
  • First-quarter earnings per share of 31 cents, missing the analyst consensus estimate of 35 cents.
  • Quarterly sales of $3.592 billion (+3.6% year over year) missed the Street view of $3.639 billion.
  • A comparable store sales increase of 0.5% year over year.
  • Gross profit rose 3.6% to $1.30 billion from $1.26 billion a year earlier.
  • Gross margin remained flat at 36.2% compared to the prior-year quarter.
  • Margin gained from cost control, while pricing strategy was a little offset by higher tariffs and delivery costs.
  • Operating income decreased 6.3% to $233.4 million from $249.1 million in the first quarter of 2025.

New store openings and, to a lesser extent, comparable-store sales drove growth. The company opened 40 new Tractor Supply stores and closed one Petsense by Tractor Supply store in Q1.

Outlook

The firm reaffirmed 2026 GAAP EPS guidance of $2.13 to $2.23, compared with the $2.21 analyst estimate.

Tractor Supply also maintained its 2026 sales outlook of $16.145 billion to $16.455 billion, versus the $16.330 billion estimate.

The broader market is experiencing mixed performance, with major indices like the Nasdaq and Dow Jones also showing losses. This context suggests that while Tractor Supply’s results …

Full story available on Benzinga.com

This post was originally published here

President Donald Trump told CNBC Tuesday he doesn’t want United Airlines Holdings Inc. (NASDAQ:UAL) and American Airlines Group Inc. (NASDAQ:AAL) to merge. “American is doing fine, and United is doing very well. I don’t like having them merge,” Trump said.

CEO Scott Kirby had pitched the combination to the Trump administration in February. American called itself “not interested” some days later.

UAL reports Q1 earnings after today’s close with a call tomorrow morning.

The Kalshi contract pricing Kirby’s word choices reads defensively.

Six of the top nine priced outcomes are problems: Newark, Middle East, Weather, Oil, ATC and Union. Starlink at 87% is the only growth word traders treat as near-certain.

What The Top Of The Board Says

“Newark” is at 89%. The airport has operated under a FAA-imposed 72-operations-per-hour cap through October …

Full story available on Benzinga.com

This post was originally published here

On Tuesday, Wintrust Financial (NASDAQ:WTFC) discussed first-quarter financial results during its earnings call. The full transcript is provided below.

This transcript is brought to you by Benzinga APIs. For real-time access to our entire catalog, please visit https://www.benzinga.com/apis/ for a consultation.

View the webcast at https://edge.media-server.com/mmc/p/dcrfskey/

Summary

Wintrust Financial reported a fifth consecutive quarter of record net income, achieving $227 million, up from $223 million last quarter.

The company saw an 8% annualized increase in deposits and a 7% rise in loan growth, with net interest margin holding at 3.56%.

Non-interest income grew, led by wealth management, while expenses were well-managed and credit quality remained stable.

Strategic priorities include exceptional customer service, disciplined growth, and prudent risk management, with plans to open several new branches and invest in digital capabilities.

Future outlook anticipates strong loan growth in Q2, particularly in the property and casualty premium finance business, with an expectation of mid to high single-digit loan growth for the year.

Full Transcript

OPERATOR

Welcome to Wintrust Financial Corporation’s first quarter 2026 earnings conference call. A review of the results will be made by Tim Crain, President and Chief Executive Officer David Dykstra, Vice Chairman and Chief Operating Officer and Richard Murphy, Vice Chairman and Chief Lending Officer. As part of their reviews, the presenters may make reference to both earnings press release and the earnings release presentation. Following their presentations, there will be a formal question and answer session. During the course of today’s call, Wintrust Management may make statements that constitute projections, expectations, beliefs or similar forward looking statements. Actual results could differ materially from the results anticipated or projected in any such forward looking statements. The company’s forward looking assumptions that could cause the actual results to differ materially from the information discussed during this call are detailed in our earnings Press release and in the Company’s Most recent form, 10-K. Also, our remarks may reference certain non-GAAP financial measures. Our earnings press release and earnings release presentation include a reconciliation of each non-GAAP financial measure to the nearest comparable GAAP financial measure. As a reminder, this conference call is being recorded. I will now turn the conference call over to Mr. Tim Crane.

Tim Crane

Good morning and thank you for joining us for Wintrust first quarter 2026 earnings call. In addition to the introductions that Latif made, I’m joined by our Chief Financial Officer Dave Starr, our Chief Legal Officer Kate Boge. We’ll follow our usual format this morning. I’ll begin with a few highlights, Dave Dykstra will review the financial results, Rich will share some thoughts on loan activity and credit quality, and I’ll be back with some closing thoughts, including a look at expectations for the second quarter and generally for the remainder of the year. As always, we’ll be happy to take your questions. Before we begin, I would like to bring your attention to some changes to the presentation document that accompanies the release of our result. We’ve modified the design, making some updates to how we present the data based on valuable feedback we’ve received from many of you. We hope you find the format helpful and informative as we continue to try and provide clear information that highlights our strong market position and our disciplined operating approach. Looking at the first quarter 2026 results, I’m very pleased that we delivered a fifth consecutive quarter of record net income. Overall, it was a very solid and straightforward quarter. We continue to focus on our strategic priorities of providing an exceptional customer experience, delivering disciplined and strategic growth across our businesses with a focus on prudent risk management and investing to build upon our foundation to drive a successful future that said. Despite two fewer days in the quarter, we achieved net income of $227 million, up from $223 million last quarter and $189 million in the first quarter of 2025. While Dave and Rich will provide more detail. In summary, net interest income, net interest margin and both loan and deposit growth were in line with our expectations. We delivered solid growth in non interest income led by our wealth management business expenses were well managed and credit quality remained stable. I would highlight that all of our growth is organic. We continue to see good new customer acquisition and market momentum and as our clients appreciate our differentiated approach and relentless focus on customer service. In fact, during the quarter we were recognized Once Again by J.D. power for Illinois Banking Services and by Coalition Greenwich with multiple awards for our commercial middle market banking services. These awards are evidence of our continued success in delivering for our clients in ways that many of our competitors cannot Overall, a Solid quarter. Let me turn it over to Dave. Great.

Dave Dykstra

Thanks Tim. Let me start with the balance sheet. Specifically, deposit growth was right at $1.2 billion during the quarter, representing an 8% increase over the prior quarter on an annualized basis. This deposit growth helped to Fund continued solid first quarter loan growth of approximately $1 billion, representing a 7% growth rate on an annualized basis. Yields and rates on the major balance sheet categories were slightly lower because of the recent market declines in short term interest rates, with loan yields moving down 13 basis points in the first quarter from the prior quarter, while interest bearing deposit costs declined 16 basis points from the prior quarter, thus resulting in a slightly improved gross spread. I’d like to note that loan growth during the quarter was heavily back end loaded and accordingly, period end loans are approximately $1.2 billion higher than average loans for the first quarter. That’s giving us a great start on achieving higher average earning assets in the second quarter of 2026. Turning to the income statement, this was a very solid operating quarter producing record levels of quarterly net income. Net interest income declined slightly compared to the fourth quarter of 2025. The benefit to net interest income from an increase of $555 million in average earning asset growth and and a 2 basis point increase in the net interest margin was almost enough to offset having two fewer days in the quarter. The net interest margin was 3.56% for the first quarter and the two fewer days in the quarter positively impacted net interest margin by 2 basis points. The net interest margin has ranged from 3.50 to 3.59% during the last nine quarters, exhibiting sustainability over at an interest margin. The provision for credit losses was relatively consistent with prior quarters remaining in the 20 to 30 million dollars range experienced in all the quarterly periods of 2025. As the overall credit environment our asset quality has remained stable as we enter 2026. Regarding other non interest income and non interest expense sections, total non interest income amounted to $134.1 million in the first quarter, which was an increase from the $130.4 million recorded in the prior quarter. The increase was primarily a result of strong wealth management and operating lease revenues. Mortgage banking activity continued to be subdued and production related volumes and revenue were essentially unchanged from the prior quarter as the non interest expense categories. Total non interest expenses for $382.6 million in the first quarter, which was slightly lower than the $384.5 million recorded in the prior quarter. Increases in salaries and employee benefits were primarily due to annual merit increases that were offset by lower OREO expenses, travel and entertainment and various other small expense decreases. Overall expenses were very well controlled. Additionally, both the quarterly net overhead ratio and efficiency ratio improved slightly relative to the priority prior quarter. In summary, I’ll reiterate this was a very solid quarter. The company accomplished good loan and deposit growth, a stable net interest margin, a record level of net income, sustained growth and tangible book value per share and a continued low level of non performing assets. So with that I’ll conclude my comments and turn it over to Rich Murphy to discuss credit.

Rich Murphy (Vice Chairman and Chief Lending Officer)

Thanks Dave. As detailed on Slide 6 of the Investor presentation, the solid loan growth of approximately $966 million or 7% on an annualized basis was broad based. Commercial loans grew by 719 million, including growth in mortgage warehouse of approximately 286 million. Commercial real estate loans grew by 222 million. The Wintrust Life Finance team continued to build their portfolio by 173 million and our residential mortgage group also had a very solid quarter. From a credit quality perspective as detailed on Slide 14, we continue to see strong credit performance across the portfolio. This can be seen in a number of metrics. Non performing loans decreased slightly from 1.85.8 million or 0.35% of total loans to 182.8% or 182.8 or 34% of total loans and remain at very manageable levels. Charge offs for the quarter were 14 basis points down from 17 basis points in the prior quarter. We believe that the level of non-performing loans (NPLs) and charge offs in the first quarter reflect a stable credit environment as evidenced by the chart of historical non performing asset levels on slide 15 and the consistent level of our special mention and substandard loans on slide 14. This quarter is another example of our commitment to identify problems early and charging them down where appropriate. Our goal, as always, is to stay ahead of any credit challenges. Turning to Slide 21, I want to briefly highlight our exposure to non depository financial institutions which totals approximately $3.2 billion or about 6% of our overall loan portfolio. Importantly, the majority of this exposure is in areas where we have long standing experience and strong performance. Of our 3.2 billion exposure, approximately 1.8 billion is tied to our mortgage warehouse business, a line of business we’ve been into for over 30 years with deep client relationships, robust operating systems and well established risk management practices. In addition, about $341 million consists of capital call facilities which are structured with strong underlying investor support and have historically demonstrated very favorable credit characteristics. The balance of the portfolio is broadly diversified across a granular group of relationships with leasing companies, Canadian captive finance companies, associated with commercial borrowers, insurance carriers and broker dealers. Overall, we view this portfolio as well diversified and aligned with our disciplined approach to specialty finance focused on areas where we have expertise, strong structures and a track record of consistent performance. Also, as noted in the last few earnings calls, we continue to be highly focused on our exposure to commercial real estate loans which comprise roughly one quarter of our total loan portfolio. As detailed on Slide 18, we continue to see signs of stabilization during the first quarter as commercial real estate (CRE) non-performing loans (NPLs) remained at very low levels, decreasing from 0.18% to 0.12% and commercial real estate (CRE) charge offs continue to remain at historically low levels. On slide 24, we continue to provide enhanced detail on our commercial real estate (CRE) office exposure. Currently, this portfolio remains steady at 1.7 billion or 11.7% of our total commercial real estate (CRE) portfolio and only 3.1% of our total loan portfolio. We monitor this portfolio very closely and we will continue to perform deep dive analysis on a quarterly basis. The most recent deep dive analysis showed very consistent results when compared to prior quarters. Finally, as we have discussed on previous calls, our team stayed very close contact with our customers and those conversations continue to reflect measured optimism around the business climate. That concludes my comments on credit and I’ll turn it back to Tim.

Tim Crane

Great, thank you Rich. At the beginning of the call I briefly mentioned our three strategic priorities delivering exceptional customer service, generating disciplined and strategic growth across our businesses with prudent risk management, and I would add through all market cycles and investing in our foundation and the future of our bank. I want to spend just one minute on the first one. Whether high tech or high touch, we offer a more personalized level of service than our larger bank or money center bank competitors, and relative to our smaller competitors, we offer more tools and sophistication to meet their needs. As a result, we occupy a unique and advantaged position in what we believe to be attractive markets and in attractive businesses. In the second half of the year, we will open several branches to continue to expand market share and to build franchise value in key communities. We will also supplement that with combined continued investment in the digital capabilities that provide flexibility and convenience for our customers. For us, it’s all about the customer and this unwavering focus is largely what has led to the consistent results we have delivered. So what does this mean for the second quarter and to a degree for the remainder of the year? We expect outsized loan growth in the second quarter largely from our property and casualty premium finance business which is seasonally very strong in Q2. Longer term, our pipelines are solid and we expect to deliver mid to high single digit loan growth for the remainder of the year. Combined with the stable margin Dave mentioned earlier at around 3.5%, we expect solid net interest income growth in the coming quarters. As always, we will work hard to fund our loan growth with a similar level of deposit growth, expanding our base of deposit clients and building franchise value expenses will be seasonally higher in Q2 as a result …

Full story available on Benzinga.com

This post was originally published here

Companies are rushing to price initial public offerings before Elon Musk’s SpaceX lands a potentially $2 trillion deal on Wall Street and sucks up the oxygen.

As much as $17.3 billion in US listings could hit the tape this month alone, the busiest stretch since December.

“If I’m any company and I want to have a chance of attracting investors that invest in IPOs, I’d probably rather do it before that deal comes,” Bob Doll, chief executive of Crossmark Global Investments, told Bloomberg.

Bankers think they have until June. Polymarket traders agree.

Polymarket Traders Are Pricing June

Polymarket’s main contract on SpaceX’s IPO month gives June a 65% probability, with July at 12% and a “no IPO before 2027” tail at 6%.

SpaceX reportedly filed confidentially with the SEC on April 1, targeting a $1.75 trillion valuation and a $75 billion raise. That would be the largest IPO in history, bigger than Saudi Aramco.

Polymarket traders think there is a 91% chance …

Full story available on Benzinga.com

This post was originally published here

U.S. stocks traded lower midway through trading, with the S&P 500 falling around 0.2% on Tuesday.

The Dow traded down 0.04% to 49,420.86 while the NASDAQ fell 0.08% to 24,383.88. The S&P 500 also fell, dropping, 0.20% to 7,095.18.

Leading and Lagging Sectors

Energy shares climbed by 0.7% on Tuesday.

In trading on Tuesday, real estate stocks fell by 1.5%.

Top Headline

GE Aerospace (NYSE:GE) posted better-than-expected earnings for the first quarter on Tuesday.

The company posted adjusted EPS of $1.86, beating market estimates of $1.60. The company’s sales came in at $12.392 billion versus estimates of $10.718 billion.

Equities Trading UP
           

  • UnitedHealth Group Inc (NYSE:UNH) shares shot up 9% to $353.83 after the company reported better-than-expected first-quarter financial results and issued FY26 EPS guidance above estimates.
  • Shares of Valmont Industries Inc (NYSE:VMI) got a boost, surging 14% to $467.00 as the company upbeat first-quarter …

Full story available on Benzinga.com

This post was originally published here

POET Technologies Inc (NASDAQ:POET) shares jumped over 21% on Tuesday, reaching a new 52-week high of $11.09. This rally follows a recovery from a recent short-seller report by Wolfpack Research.

CFO Slams Short Sellers, Addresses ‘Tax Nightmare’ Claims

POET CFO Thomas Mika called short sellers “maggots” during a discussion with Stocktwits. He accused the firm of timing its report to create anxiety before Tax Day.

Wolfpack alleged POET’s status as a Passive Foreign Investment Company would create a “tax nightmare.” Mika told Stocktwits

Full story available on Benzinga.com

This post was originally published here

International Business Machines Corporation (NYSE:IBM) shares are slightly higher during Tuesday’s session as the company said it is introducing industry solutions for AI-powered experience orchestration in collaboration with Adobe Inc. (NASDAQ:ADBE).

This move comes as IBM aims to enhance customer engagement by addressing the growing expectation for brands to anticipate customer needs.

IBM’s new consulting strategies, powered by AI-driven experience orchestration, are designed to help organizations unify data and streamline workflows, particularly in sectors like healthcare and airlines. The company’s research indicates that businesses lose an average of $29 million annually due to slow responses to customer demands.

“Together, we’re pairing Adobe’s Customer Experience Orchestration capabilities, like Adobe Real-Time CDP, with IBM’s agentic AI expertise, orchestration tools like Adobe Experience Platform Agent Orchestrator and IBM watsonx Orchestrate, and responsible governance to help companies identify customer intent quickly and act before the moment passes,” IBM said.

Technical Analysis

IBM is currently trading within its 52-week range, positioned at 255.50, which is approximately 21% below its 52-week high of $324.90. The stock is trading 5.3% above its 20-day …

Full story available on Benzinga.com

This post was originally published here

Fraudsters impersonating Iranian officials are demanding Bitcoin (CRYPTO: BTC) and Tether (CRYPTO: USDT) from shipping companies whose vessels are stranded in the Strait of Hormuz, Greek maritime risk management firm MARISKS warned Monday.

The Scam Messages

The fraudsters ask for vessel ownership documents, cargo manifests, and crew lists. After reviewing the paperwork, they send a payment demand—often hundreds of thousands to millions of dollars in Bitcoin or USDT, Reuters reported.

“After providing the documents and assessing your eligibility by the Iranian Security Services, we will be able to determine the fee to be paid in cryptocurrency,” the fraudulent message reads. “Only then will your vessel be able to transit the strait unimpeded.”

MARISKS said these messages are scams and were not sent by Iranian authorities.

One Ship Paid And Got Shot At

At …

Full story available on Benzinga.com

This post was originally published here

Micron Technology Inc. (NASDAQ:MU) shares are trading lower on Tuesday. The semiconductor giant faces pressure as broader market sentiment shifts.

While the Nasdaq remains slightly positive, the S&P 500 has retreated into the red as geopolitical risks remain persistent, with negotiating teams from the U.S. and Iran meeting in Islamabad.

Analysts Flag Memory “Softness”

Recent commentary from Taiwan Semiconductor Manufacturing Co. Ltd. (NYSE:TSM) is also weighing on the sector. Jim Cramer noted on CNBC’s Mad Dash that TSM executives acknowledged a “little softer market” for memory.

Cramer …

Full story available on Benzinga.com

This post was originally published here

Brookfield Corporation (NYSE:BN) shares edged higher Tuesday after European regulators cleared a renewable energy joint venture involving major global investors.

The approval marks another step in Brookfield’s strategy to expand its footprint in clean energy infrastructure.

The European Commission approved the creation of a jointly controlled entity, Mustang AIV LP, alongside British Columbia Investment Management Corporation and Norges Bank Investment Management, stating the deal poses no competition risks.

As of Dec. 31, 2025, Brookfield Corporation had cash and equivalents worth $30.033 billion.

Following the development, Morgan Stanley analyst Michael Cyprys maintained an Overweight rating, raising the …

Full story available on Benzinga.com

This post was originally published here

Alaska Air Gr (NYSE:ALK) released first-quarter financial results and hosted an earnings call on Tuesday. Read the complete transcript below.

Benzinga APIs provide real-time access to earnings call transcripts and financial data. Visit https://www.benzinga.com/apis/ to learn more.

The full earnings call is available at https://edge.media-server.com/mmc/p/wu6oat3c/

Summary

Alaska Air Gr reported a first quarter GAAP net loss of $193 million and an adjusted net loss of $192 million, primarily driven by sharply higher fuel prices and disruptions in key markets like Hawaii and Puerto Vallarta.

The company is making significant progress with its Alaska Accelerate strategy, including completing preparations for a single passenger service system cutover, expanding its network with new routes to Rome, London, and Reykjavik, and enhancing its loyalty program with a new agreement with Bank of America.

Despite near-term challenges, Alaska Air Gr maintains a positive long-term outlook, focusing on expanding its premium and international offerings and maintaining strong demand and revenue resilience, aiming for a $10 EPS target in the future.

Full Transcript

OPERATOR

Good morning ladies and gentlemen and welcome to the Alaska Air Group 2026 first quarter earnings call. At this time, all participants have been placed on mute to prevent background noise. Today’s call is being recorded and will be accessible for future playback at alaskaair.com after our speaker’s remarks, we will conduct a question and answer session for analysts. I would now like to turn the call over to Alaska Air Group Vice President of Finance, Planning and Investor Relations, Ryan St.

Ryan St. John (Vice President of Finance, Planning and Investor Relations)

Thank you Operator and good morning. Thanks for joining us today to discuss our first quarter 2026 earnings results. Yesterday we issued our earnings release along with several accompanying slides detailing our results which are available at investor.alaskaair.com on today’s call, you’ll hear updates from Ben, Andrew and Shane. Several others of our management team are also on the line to answer your questions. During the Q&A portion of the call, we reported a first quarter GAAP net loss of $193 million excluding special items. Air Group reported an adjusted net loss of $192 million. As a reminder, forward looking statements about future performance may differ materially from our actual results. Information on risk factors that could affect our business can be found within our SEC filings. We will also refer to certain non-generally accepted accounting principles financial measures such as adjusted earnings and unit cost excluding fuel. And as usual, we have provided a reconciliation between the most directly comparable generally accepted accounting principles and non-generally accepted accounting principles measures in today’s earnings release.

Ben

Over to you Ben. Thanks Ryan and good morning everyone. To start, I want to thank our more than 30,000 employees across Alaska, Hawaiian and Horizon for their continued focus, professionalism and commitment to taking care of our guests through another unpredictable start to the year. The operating backdrop shifted rapidly this quarter. Sharply higher fuel prices driven by geopolitical events created uncertainty across global markets and and meaningful pressure on the airline industry. At the same time, our network faced more disruption than normal from once in a generation rain storms in Hawaii to civil unrest in Puerto Vallarta. Through it all, our teams have demonstrated remarkable resilience. Their response day in and day out remains the foundation of our performance and the long term success. While these events created close-in challenges, we remain convicted and excited about our strategy and the future we’re building at Air Group as we continue to unlock the initiatives we laid out under Alaska. Accelerate. Throughout our history we have leaned into periods of disruption to strengthen the company. After the 2001 downturn, we built a transcontinental network. Coming out of the 2008 financial crisis, we established our Hawaii franchise and most recently following the COVID pandemic, we acquired Hawaiian Airlines, secured more than 50% market share in Hawaii and launched Long Haul International Travel out of Seattle. Each of these moments shaped who we are today. The near term pressure facing the industry today is real. Fuel costs were more than $100 million higher in the first quarter and we expect incremental fuel costs of $600 million or more in the second quarter. That represents approximately a 70 cent impact to earnings per share in Q1 and over $3 in Q2. Offsetting some of that pressure is a strong demand backdrop with fair increases holding. Andrew will share more in his comments. Importantly, our position of strength allows us to manage through environments like this while continuing to build long term earnings power. Today’s backdrop reinforces why we designed Alaska Accelerate the way we did to create a structurally stronger, more diversified and more resilient airline capable of delivering value across cycles for our owners, employees and guests. Scale, relevance and loyalty with an emphasis on premium experiences and international travel remains central to that foundation. And while fuel volatility may dominate near term headlines, the initiatives most critical to our trajectory remain firmly within our control and we will continue to execute on them because it is the right strategy. Now turning to the business, we continue to make meaningful progress on Alaska, accelerated, advancing our priorities and not standing still even in a challenging environment. From an integration standpoint, we’ve completed preparations for our single passenger service system cutover, our final major guest facing milestone. Beginning tomorrow, our systems will operate on a single platform, eliminating the friction of a dual environment. This is a significant moment for Air Group. We’re moving forward with our combined and globally expanding network, an award winning loyalty program and premium offerings across our entire fleet. Along with the PSS cutover, Hawaiian Airlines has officially joined OneWorld expanding benefits for our loyal guests in Hawaii, attracting new OneWorld guests onto the Hawaiian brand and extending our global reach to meet the full range of business and leisure travel needs. Our network continues to grow as we connect our guests to the world. We launch Rome next week and London and Reykjavik later this spring, all tracking toward full flights. I could not be more excited to see the Alaska brand set foot in Europe for the first time in our 94 year history, marking a major milestone in becoming the fourth global carrier in the United States. At the same time, our premium and guest experience continues to improve. Premium retrofits on our 737 fleet are now more than 90% complete, increasing our share of premium seats across the network and driving higher premium revenue. Our entire regional fleet is now retrofitted with free Starlink wi-fi and Boeing 737 installations are underway, further enhancing our end to end guest experience. Guest satisfaction has already improved 15 points across all Starlink equipped aircraft and nearly 30 points on regional jets. Another core pillar of Alaska accelerated Our loyalty platform continues to gain momentum. We recently agreed to a multi year extension with enhanced economics and a deeper partnership with bank of America, supporting continued growth in our loyalty ecosystem and reinforcing loyalty as one of the most powerful earnings drivers in our business. We’re also pleased to have reached an agreement with Amazon that eliminates losses under the legacy Hawaiian terms and creates mutual value as the relationship evolves. With still more to do and finally, despite winter weather and severe rainstorms in Hawaii, we delivered the industry’s number one on time performance in the first quarter along with very high Net Promoter Scores, another indicator that integration friction is in the rearview mirror for Air Group. Collectively, these initiatives are reshaping the composition of our revenues and making our business more durable. Today, more than half of our revenues come from outside the main cabin, driven by premium products, loyalty cargo and ancillary streams, and we expect that share to keep growing to close. Alaska is operating from a position of strength. We have a healthy balance sheet, strong liquidity and a fleet and network that provide flexibility as conditions evolve. I want to reiterate my confidence in our people, our strategy and our future. We are navigating this environment with discipline, clarity and purpose. The challenges we’re navigating today do not change our longer term trajectory, our ability to achieve a $10 EPS target, or remain a top margin producing airline. While the path is rarely linear, the direction is clear and our conviction in where we’re headed has not wavered. Airlines with caring and committed people, strong brands, loyal guests, disciplined cost structures and financial flexibility are best positioned to emerge stronger and I firmly believe Air Group fits that profile. And with that I’ll turn it over to Andrew.

Andrew

Thanks Ben and good morning everyone. Today I’ll walk through our first quarter financial performance, our perspective on the near term demand and revenue environment, and the significant progress we’re realizing on the core initiatives that underpin Alaska accelerate. Total Q1 revenues reached $3.3 billion, up 5% year over year on capacity growth of just 1.7%. Our unit revenues were up 3.5% in line with our initial expectations for the quarter and building on a strong prior year comparison. From a demand and revenue perspective, performance in the first quarter was resilient despite the volatile macro backdrop and material demand headwinds uniquely impacting our spring break revenue given our network. Specifically, we experienced significant headwinds in Hawaii and Puerto Vallarta, which together represent approximately 30% of our system capacity. In Hawaii, unprecedented storms with rainfall reaching as much as 3,000% of normal historical levels during March disrupted travel plans and drove a spike in cancellations and near term book away. In Puerto Vallarta, where Air Group is the largest US Carrier, civil unrest leading up to the spring break travel period had a meaningful impact on demand as well. Together, These impacts reduced first quarter unit revenues by nearly 1 point, with effects continuing into April and May. In response, we’ve reduced Puerto Vallarta flying by approximately 30% in the second quarter to better align capacity with demand in Hawaii, we have maintained near term capacity as the severe weather was transitory. We are busy taking great care of local travelers and welcoming visitors with the Hawaiian experience they know and love and this past week saw bookings return to last year’s level on strong fare increases. Setting aside these regions, we saw broad based strength across our network. Premium demand continued to outperform the System and was up 8% year over year. With over 90% of our premium fleet retrofits complete, we’re on track to sell all 1.3 million incremental premium seats across the network ahead of the peak summer travel season. Encouragingly, first class revenue continues to produce positive unit revenues even as capacity increases 5%. Internationally, the relevance of our network continues to drive strong results as guests are choosing to fly with us in in more ways than ever before. Seattle Tokyo reached profitability in March, less than a year after its launch and load factors for both Seattle to Tokyo and Seoul exceeded 90%. We’re extending this momentum with the launch of Rome next week, followed by London and Reykjavik next month. Early booking trends are tracking in line with expectations with demand building nicely and premium cabins performing particularly well. Notably, more than 70% of guests booked on our new roam service are Alaska Mileage Plan members, materially higher than the rest of our network. Managed corporate travel was exceptionally strong, up 19% in the first quarter. Our international expansion has meaningfully increased Alaska’s relevance with corporate customers. As a result, we are competing for and in some cases exceedingly our fair market share in business travel on these long haul routes, particularly in the US Point of sale. We’re also seeing improved domestic corporate relevance as global connectivity strengthens our value proposition for corporate travelers. Managed corporate demand remains robust in the Q2 with held revenue over the next 90 days up almost 30%. We are seeing broad based strength across all industries, in particular manufacturing, financial services and technology and are beginning to see traction through greater sign ups for small and medium businesses in our Alaska Mileage Plan for Business platform. Turning to loyalty growth remains a priority for Alaska. Every major initiative we’re executing on is driving relevance and growth for our members. These large scale enablers such as the Hawaiian acquisition and resulting domestic and international network expansion, the launch of our Alaska Mileage Plan Rewards platform, issuance of a premium co-brand card and free Starlink WI fi on board for Alaska Mileage Plan members are all designed to accelerate growth across our portfolio and deepen engagement with our most valuable guests. And it’s working. In the first quarter we generated $615 million in cash remuneration from our co-brand cards. That’s up 12% year over year while active membership in the Alaska Mileage Plan program grew by 13% year over year. Importantly, we’re seeing particular strength in our Hawaii loyalty metrics with double digit year over year growth across members, new cardholders and card spend. Over 70% of the Hawaii adult resident population is now enrolled in Alaska Mileage Plan Rewards reflecting the strong value proposition of our combined network and and loyalty program. With two beloved airline brands and oneworld’s expansive global connectivity, spend from our Hawaii based cardholders increased 19% year over year and now accounts for nearly 6% of the state’s Gross Domestic Product. Our top rated Atmos rewards program is clearly resonating, attracting more guests, keeping them within our ecosystem and reinforcing the strength of our loyalty flywheel as we look to further accelerate the growth and relevance of our Atmos Rewards program. Yesterday we announced a long term extension of our multi decade relationship with bank of America. This newly expanded agreement delivers improved economics, all new capabilities and a significant step up in marketing investment as we move to a single issuer of at most branded CO brand products through 2030. The agreement secures an additional $1 billion of total cash remuneration while offering what we believe will be a step change in portfolio growth. These economics are incremental to what we shared as part of the Alaska Accelerate vision and go meaningfully beyond the $150 million of loyalty profit we targeted by 2027. We’re grateful to the team at bank of America for their long standing and continued partnership. Turning to our outlook, we ended the year with one of the most prudent growth plans in the industry. The vast majority of our 2026 growth is concentrated in long haul flying out of Seattle as we continue to build our new global hub and generate new revenue streams at the same time. In response to current fuel environment, we’ve proactively trimmed nearly a point of capacity in May and June, including reductions in Mexico and select late night departures in high frequency markets. We now expect second quarter capacity to be up approximately 1% year over year, again among the lowest growth rates in the industry, comprised entirely of our long haul international service out of Seattle. While our North America capacity is down slightly year over year, the overwhelming majority of our capacity remains deployed in core hubs where we have scale, relevance and strong loyalty. As conditions evolve, we will continue to prioritize margins consistent with the disciplined actions we took last year with when we were the first large airline to reduce capacity. In response to a challenging macro environment, demand has shown resilience in the face of higher fares. Incoming yields for continental US markets have sustained an increase of 20% plus year over year in recent weeks, pushing held unit revenues in these regions to up double digits for the back half of the quarter. Given that we still have 35% of revenue to book in the quarter and provided this demand continues, we would expect to see the system achieve high single digit unit revenue gains with a path to 10% in Q2 despite an overall 2 point drag from Hawaii. Specific impacts in the quarter to wrap up While the near term environment remains volatile, we continue to make strong strides on the initiatives that matter most to the long term value of this business. And importantly, we are not standing still, as evidenced by our new co brand agreement with bank of America and the transition to a single passenger service system this week which will unlock the depth and breadth of our guest products and services seamlessly across our global network. We’re executing against Alaska Accelerate, improving the durability and quality of our revenue, maintaining prudent capacity, discipline and investing in areas that strengthen our earnings power over time. I remain confident that the actions we’re taking today position Alaska Air Group to emerge stronger as conditions evolve. And with that I’ll pass it over to Shane.

Shane

Thanks Andrew and good morning everyone. While we entered 2026 with strong momentum, geopolitical events have quickly disrupted that trajectory, driving an acute run up in fuel prices that has put pressure on the entire industry. In moments like this, it’s important to separate what has changed from what has not. Fuel has moved sharply higher and remains volatile. Demand for air travel has remained both resilient and strong and we have continued to execute on both our integration and the Alaska Accelerate Plan which is focused on building strength into the business for the long term. While we are once again navigating an unexpected and challenging backdrop, we know that successful airlines will be those with scale, relevance and loyalty The Alaska Accelerate Plan delivers in each of those areas and also broadens our commercial model as we expand internationally and in our premium offerings, two areas of the industry where demand continues to grow rapidly. As we navigate the near term, we will double down on our core business model, operational excellence, high productivity and providing award winning service to our guests while also delivering on continued investment in the initiatives that will grow our earnings over time. Against that backdrop, our first quarter adjusted loss per share of $1.68 came in better than the midpoint of our revised guidance, reflecting both the resilience of demand and the discipline with which we’re managing the business. Absent fuel, which alone accounted for approximately $0.70 of incremental EPS pressure versus our original plan and the impactful though transitory events in Puerto Vallarta and Hawaii that Andrew mentioned, we would have been well above the midpoint of our original guide. Our financial …

Full story available on Benzinga.com

This post was originally published here

Mainstream coverage spent months cycling through contenders for Tim Cook’s replacement, with former COO Jeff Williams and software chief Craig Federighi near the top of most lists.

Polymarket was not so indecisive. The Next CEO of Apple (NASDAQ:AAPL) contract had John Ternus as the favorite since January, logging $985,647 in volume before resolution.

Ternus, 50, is a 25-year Apple veteran who ran hardware engineering for the iPhone, Mac, iPad, Apple Watch, AirPods and Vision Pro.

Polymarket’s active Apple markets suggest traders think the hardware guy sticks to hardware.

Hardware Bets Lead The Board

A contract on whether Apple ships a foldable iPhone before 2027 is trading at 79% YES on $129,005 in volume.

The device is reportedly on track for a September debut …

Full story available on Benzinga.com

This post was originally published here

Psyence Biomedical Ltd (NASDAQ:PBM) shares are trading lower on Tuesday by more than 12%, a sharp reversal after a massive rally on Monday. Investors appear to be engaging in profit-taking after the stock’s recent vertical climb.

The stock surged nearly 72.63% during Monday’s regular trading hours. At the time, the psychedelic sector received a major boost.

President Donald Trump signed an executive order to accelerate mental illness treatments. This order specifically targets faster reviews for psychedelic drugs. It also includes a reported $50 million commitment for ibogaine …

Full story available on Benzinga.com

This post was originally published here

JPMorgan has raised its outlook for the S&P 500, pointing to strengthening momentum in the artificial intelligence trade and the firm’s proprietary “Mythos” model, which signals continued upside driven by capital flows and earnings expansion in AI-linked sectors.

The bank’s strategists said the model—designed to track cross-asset positioning, liquidity trends, and thematic concentration—indicates that investor exposure to AI remains underappreciated relative to the scale of spending now underway. “The AI trade still has room to run,” said Marko Kolanovic, Chief Market Strategist at JPMorgan, noting that institutional positioning continues to shift toward infrastructure and compute-heavy names.

The updated target reflects growing confidence that AI-driven investment cycles are entering a more durable phase, supported by corporate spending on data centers, semiconductors, and cloud infrastructure. Companies tied to high-performance computing and large-scale model deployment are expected to remain primary beneficiaries.

“What we are seeing is not just hype—it’s a capex cycle,” said Stacy Rasgon, Senior Semiconductor Analyst at Bernstein, pointing to sustained demand for advanced chips and related infrastructure. “The magnitude of investment is comparable to prior industrial revolutions in tech.”

JPMorgan’s model also incorporates liquidity dynamics, suggesting that global capital flows continue to favor U.S. equities, particularly mega-cap technology firms. The concentration of gains among a small group of AI leaders has raised concerns, but strategists argue that earnings growth justifies the trend.

“Earnings are catching up to valuations,” said Savita Subramanian, Head of U.S. Equity Strategy at Bank of America, noting that AI-linked companies are delivering real revenue expansion rather than speculative projections.

The revised outlook comes as the S&P 500 trades near record levels, with performance increasingly driven by companies exposed to artificial intelligence. Nvidia, Microsoft, and other large-cap technology firms have led the rally, reflecting their central role in the AI ecosystem.

At the same time, JPMorgan’s analysis suggests that the next phase of the rally may broaden beyond core chipmakers and hyperscalers. “We are starting to see second-order beneficiaries emerge,” said Jonathan Golub, Chief U.S. Equity Strategist at UBS, pointing to software, industrial, and energy companies tied to AI infrastructure buildout.

Still, risks remain. Elevated valuations, rising interest rate sensitivity, and geopolitical uncertainty could introduce volatility, particularly if growth expectations fail to materialize at the current pace.

“The bar is high,” said Mike Wilson, Chief U.S. Equity Strategist at Morgan Stanley, cautioning that markets are pricing in continued strength in both earnings and liquidity conditions.

JPMorgan’s “Mythos” framework suggests that investor psychology and narrative momentum continue to play a role in sustaining the rally, particularly as AI remains the dominant theme across global markets.

Looking ahead, the firm expects AI-driven capital expenditure and earnings growth to remain key drivers of equity performance, reinforcing its constructive outlook on the S&P 500. As long as the underlying investment cycle continues, strategists say the market may have further room to climb.

JBizNews Desk

Hungarian government bonds are poised to extend their rally as Prime Minister-elect Peter Magyar signals a decisive shift toward euro adoption and closer alignment with the European Union, a stance that is already boosting investor confidence and tightening spreads across the country’s debt markets.

The incoming leadership’s pro-Europe positioning marks a notable pivot from recent policy tensions with Brussels and is being viewed by markets as a turning point for Hungary’s economic trajectory. Mai Doan, Economist at Bank of America Corp., said the outlook for Hungarian bonds carries a “very constructive bias,” driven by expectations of stronger policy credibility and improved access to external funding.

“A credible path toward euro adoption is a powerful anchor for investor confidence,” Doan said, noting that Hungary’s renewed commitment to convergence with the eurozone could accelerate the compression of bond yields and improve relative performance among emerging European peers.

Analysts say the euro accession push is more than symbolic. It signals a willingness to implement structural reforms, align fiscal policy with EU standards, and reduce long-term currency volatility. “Markets are responding to the policy direction, not just the outcome,” said Liam Peach, Senior Emerging Markets Economist at Capital Economics, adding that even gradual progress toward euro adoption can materially lower risk premiums.

A central pillar of the bullish case is the potential unlocking of €17 billion to €18 billion in frozen EU funds, which have been withheld due to prior disputes over governance and rule-of-law concerns. Improved relations under the new leadership are expected to pave the way for those funds to be released. “Access to EU financing would significantly strengthen Hungary’s external balance,” said Piotr Matys, Senior FX Analyst at InTouch Capital Markets, highlighting the impact on both currency stability and sovereign borrowing costs.

Investor positioning has already begun to shift. Hungarian government bond yields have started to decline, while demand from foreign investors has picked up as political risk perceptions ease. “We are seeing early re-engagement from global investors,” said Trung Nguyen, Emerging Markets Strategist at Natixis, pointing to increased inflows into local debt markets.

The Hungarian forint has also stabilized, benefiting from expectations of stronger capital inflows and improved macroeconomic management. “Currency stability is reinforcing the bond rally,” said Jane Foley, Head of FX Strategy at Rabobank, noting that a firmer forint reduces inflationary pressure and supports a more predictable policy environment.

Hungary’s central bank remains a key factor in sustaining momentum. Policymakers have maintained a cautious easing cycle, balancing the need to support growth while preserving financial stability. “Central bank discipline will be critical in maintaining investor trust,” said Holger Schmieding, Chief Economist at Berenberg, emphasizing that credibility remains central to the outlook.

Bank of America continues to favor Hungarian bonds, particularly in the five- to ten-year segment, where yield compression potential remains strongest. Doan cited improving fiscal signals, disinflation trends, and prospective EU inflows as key catalysts for further gains.

Still, external risks remain. A slowdown in the broader eurozone economy or renewed pressure from rising global yields could limit upside. “Hungary’s trajectory is improving, but global conditions still matter,” said Erik Nielsen, Chief Economic Advisor at UniCredit, noting that emerging market assets remain sensitive to shifts in global liquidity.

For investors, Hungary’s repositioning represents a broader story of policy credibility and integration. The combination of euro convergence ambitions and improved EU relations is reshaping how markets assess the country’s risk profile.

Looking ahead, the sustainability of the rally will depend on execution. If Peter Magyar’s government follows through on its pro-EU and reform-driven agenda, Hungarian bonds could continue to outperform, reinforcing the country’s standing in global fixed-income markets.

JBizNews Desk


WASHINGTON — The Senate Banking Committee on Tuesday pressed Kevin Warsh, President Trump’s nominee to lead the Federal Reserve, in a closely watched confirmation hearing unfolding against a backdrop of rising geopolitical tensions and market volatility. Opening the session, Senator Tim Scott (R-S.C.) said the next Fed chair must restore price stability while sustaining growth. “The stakes are extremely high given current conditions,” said Michael Gapen, Chief U.S. Economist at Bank of America, noting that leadership at the Fed is now directly tied to market confidence.

Democrats raised immediate concerns over independence, with Senator Elizabeth Warren (D-MA) warning against political pressure on monetary policy. Warsh, a former Fed governor, told lawmakers he would “act in the long-term interest of the economy.” “Markets are looking for reassurance that the Fed won’t become politicized,” said Krishna Guha, Vice Chairman at Evercore ISI, adding that credibility remains the institution’s most valuable asset.

Lawmakers also focused on Warsh’s policy stance as he seeks to replace Jerome Powell when his term ends in May. While historically viewed as a hawk, Warsh has recently signaled flexibility in responding to changing conditions. “There’s a balancing act here between maintaining discipline and adapting to new risks,” said Diane Swonk, Chief Economist at KPMG, pointing to the complexity of the current macro environment.

At the same time, markets were reacting to developments outside Washington. WTI crude hovered near $87 a barrel, reflecting ongoing tensions in the Middle East and concerns about supply disruptions. “Energy is once again driving the inflation narrative,” said Helima Croft, Head of Global Commodity Strategy at RBC Capital Markets, noting that oil prices are becoming a key variable for central bank policy.

Treasury markets signaled caution, with the 10-year yield holding around 4.28% as investors reassessed inflation risks. “Bond markets are telling you that uncertainty is still elevated,” said Priya Misra, Portfolio Manager at JPMorgan Asset Management, highlighting that yields remain sensitive to both geopolitical developments and Fed expectations.

Equities showed resilience despite the backdrop, with the S&P 500 edging higher during midday trading. Gains were led by defense and energy stocks, sectors seen as beneficiaries of prolonged geopolitical tension. “There’s a clear rotation into areas tied to global risk,” said Art Hogan, Chief Market Strategist at B. Riley Wealth, noting that investors are repositioning portfolios accordingly.

Warsh’s financial disclosures also came under scrutiny, with lawmakers questioning potential conflicts of interest tied to his past roles in the financial sector. Warsh said he would comply fully with ethics requirements, including divestments where necessary. “Transparency will be critical to securing confirmation,” said Sarah Binder, Senior Fellow at the Brookings Institution, who specializes in congressional oversight and Fed governance.

For policymakers, the broader challenge is navigating an economic landscape increasingly shaped by external shocks. Warsh acknowledged that global developments are playing a larger role in shaping domestic outcomes. “The Fed is no longer operating in a purely domestic framework,” said Eswar Prasad, Professor of Economics at Cornell University, emphasizing the growing influence of geopolitics on monetary policy.

The confirmation process is expected to continue through the week, with additional questioning likely to focus on interest rates, financial regulation, and labor market conditions. Investors are watching closely for signals on how Warsh would approach policy in the near term. “The market wants clarity, not just on rates but on reaction function,” said Matthew Luzzetti, Chief U.S. Economist at Deutsche Bank, referring to how the Fed responds to incoming data.

Looking ahead, Warsh faces the challenge of convincing both lawmakers and markets that he can lead the Federal Reserve through a period of heightened uncertainty. With inflation risks, geopolitical pressures, and policy expectations all converging, the outcome of the confirmation process could have far-reaching implications. “This is about more than one nomination—it’s about the future direction of U.S. monetary policy,” said Jan Hatzius, Chief Economist at Goldman Sachs.

JBizNews Desk

Top Wall Street analysts changed their outlook on these top names. For a complete view of all analyst rating changes, including upgrades, downgrades and initiations, please see our analyst ratings page.

  • Goldman Sachs analyst Brian Lee upgraded Ramaco Resources Inc (NASDAQ:METC) from Sell to Neutral and raised the price target from $14 to $15. Ramaco Resources shares closed at $14.07 on Monday. See how other analysts view this stock.
  • Keybanc analyst Eric Heath upgraded …

Full story available on Benzinga.com

This post was originally published here

United Airlines Holdings, Inc. (NASDAQ:UAL) will release earnings for its first quarter after the closing bell on Tuesday, April 21.

Analysts expect the Chicago, Illinois-based company to report quarterly earnings of $1.09 per share, up from 91 cents per share in the year-ago period. The consensus estimate for UnitedHealth’s quarterly revenue is $14.38 billion (it reported $13.21 billion last year), according to Benzinga Pro.

American Airlines publicly rejected any merger discussions with United Airlines on April 17, 2026, stating it is “not engaged with or interested in any discussions” regarding a combination with United.

United Airlines shares fell 2.8% to close at $98.91 on Monday.

Benzinga readers can access the latest analyst ratings on the Analyst Stock Ratings page. Readers can sort by stock ticker, company name, analyst firm, rating change or other variables.

Let’s have …

Full story available on Benzinga.com

This post was originally published here

(Editor’s note: The futures and ETFs data were updated.)

U.S. stock futures rose on Tuesday following Monday’s decline. Futures of major benchmark indices edged up, with negotiating teams from the United States and Iran slated to arrive in Islamabad for further talks. 

On Monday, the Dow Jones index closed about five points lower, even as tensions between the U.S. and Iran intensified as the ceasefire drew closer to expiry.

Meanwhile, the 10-year Treasury bond yields stood at 4.252%, and the two-year bond was at 3.735% at the time of writing. The CME Group’s FedWatch tool‘s projections show markets pricing a 99.5% likelihood of the Federal Reserve leaving the current interest rates unchanged in April.

Index Performance (+/-)
Dow Jones 0.49%
S&P 500 0.26%
Nasdaq 100 0.34%
Russell 2000 0.25%

The SPDR S&P 500 ETF Trust (NYSE:SPY) and Invesco QQQ Trust ETF (NASDAQ:QQQ), which track the S&P 500 index and Nasdaq 100 index, respectively, were higher in premarket on Tuesday. The SPY was up 0.22% at $710.27, while the QQQ surged 0.28% to $648.59.

data-variant=”banner”
data-news-mode=”manual”

>


Read Also:

Will S&P 500 Open Up Or Down On April 21?

This post was originally published here

PrairieSky Royalty (TSX:PSK) released first-quarter financial results and hosted an earnings call on Tuesday. Read the complete transcript below.

Benzinga APIs provide real-time access to earnings call transcripts and financial data. Visit https://www.benzinga.com/apis/ to learn more.

Access the full call at https://edge.media-server.com/mmc/p/tegjt8ik

Summary

PrairieSky Royalty reported Q1 2026 funds from operations of $94.9 million, reflecting an 11% increase from the previous year due to higher production and stronger bonus consideration.

Total production grew by 4% year-over-year, with oil production increasing by 2% and record highs in condensate and pentane production as part of the NGL stream.

The company entered into 48 new leasing arrangements, which contributed to elevated bonus consideration, and anticipates reducing debt levels significantly by the end of 2026.

The Duvernay and Clearwater plays continue to drive production growth, with Duvernay expected to be the fastest growing play in 2026.

PrairieSky Royalty declared Q1 dividends of $61.6 million, corresponding to a 65% payout ratio, and announced a second quarter dividend of 26.5 cents per share.

Full Transcript

OPERATOR

Good day and thank you for standing by. Welcome to the PrairieSky Royalty First Quarter 2026 Financial Results Conference Call At this time, all participants are in a listen-only mode. After the speaker’s presentation there will be a question and answer session. To ask a question during the session you will need to press star 11 on your telephone. You will then hear an automated message advising your hand is raised to withdraw your question. Please press star 11 again. Please be advised that today’s conference is being recorded. I would now like to hand the conference over to your speaker today, Andrew Phillips, President and CEO. Please go ahead.

Andrew Phillips (President and CEO)

Thank you. Daniel Good morning and thank you for dialing into the PSK Q1 2026 conference call. On the call from PSK are Pam Cazale, Dan Bertram, Mike Murphy and myself Andrew Phillips. Before we begin, there is certain forward looking information and statements in our commentary today, so I’d ask listeners and investors to review the forward looking statements qualifier in our press release and MD&A which can be found on our website. Funds from operations totaled 94.9 million, an 11% increase from Q1 2025 resulting from higher production and stronger bonus consideration. Total production grew 4% from Q1 of 2025 with oil production showing 2% growth year over year. Condensate and pentane production reported as part of the NGL stream remains at record highs for PrairieSky at approximately 35% of the NGL stream. Elevated bonus consideration was the result of 48 new leasing arrangements with 37 distinct oil and gas companies. Given the lower rig count year over year, we are pleased with the 201 Spuds on PrairieSky lands versus the 200 in prior year. With the increased pricing for oil and a continued weak Canadian dollar, we are observing early indications of higher planned activity levels post breakup. Based on strip pricing, we’re anticipating a material reduction in debt levels by the end of 2026. A number of our recent leasing arrangements are for exploration rather than pure development, which is a positive trend. Rising capital cycles can help unlock the vast optionality inherent in an 18.6 million acre land base. In addition to this, more operators in the Clearwater are exploring for oil up and down hole where they already have an existing producing horizon. We expect this will unlock numerous new developments over the next 10 years. With the current development inventory on land, we can replace the approximate 9.5 million barrels of royalty production on our lands for 61 years. New discoveries have the potential to unlock more inventory. I will now turn the call to Mike to further discuss activity on our lands.

Mike Murphy

Thanks Andrew The first quarter saw a record number of Duvernay wells spud at 26, including 20 in the West Shale Basin. First West Shale completions from this program are currently underway with new wells expected to be on production starting in mid May and driving light oil growth through the back half of …

Full story available on Benzinga.com

This post was originally published here

GE Aerospace (NYSE:GE) released first-quarter financial results and hosted an earnings call on Tuesday. Read the complete transcript below.

Benzinga APIs provide real-time access to earnings call transcripts and financial data. Visit https://www.benzinga.com/apis/ to learn more.

View the webcast at https://edge.media-server.com/mmc/p/2u6mdyrk/

Summary

General Electric Co reported a strong start to 2026, with orders up 87% and revenue increasing by 29%, driven by significant growth in CES services and DPT orders.

Operating profit grew by 18%, and EPS increased by 25% to $1.86, with free cash flow rising by 14%.

The company is reducing its full-year departures outlook due to geopolitical uncertainties, but it maintains its guidance, trending towards the high end of the range.

General Electric Co is actively investing in its U.S. manufacturing sites and supply base, with plans to invest $1 billion for the second consecutive year to accelerate engine deliveries and ramp part production.

The company highlighted a robust commercial services backlog of over $170 billion, with services revenue expected to increase due to strong aftermarket demand.

Management expressed confidence in navigating the current geopolitical and economic challenges, emphasizing the resilience provided by a diverse and young fleet.

Full Transcript

OPERATOR

Good day ladies and gentlemen and welcome to the GE Aerospace first quarter 2026 earnings conference call. At this time, all participants are in a listen only mode. My name is Liz and I will be your conference coordinator today. If you experience issues with the webcast slides refreshing or there appears to be delays in the slide advancement, please hit F5 on your keyboard to refresh. As a reminder, this conference is being recorded. I would now like to turn the program over to your host for today’s conference, Blair Schorr from the GE Aerospace Investor Relations Team. Please proceed.

Blair Schorr (Investor Relations Team Member)

Thanks, Liz. Welcome to GE Aerospace’s first quarter 2026 earnings call. I’m joined by Chairman and CEO Larry Culp and CFO Rahul Guy. Many of the statements we’re making are forward looking and based on our best view of the world and our business as we see them today. As described in our SEC filings and website, those elements may change as the world changes. Additionally, Larry and Rahul will speak to Total Company and corporate financial Results and guidance today on a non GAAP basis. Now over to Larry.

Larry Culp (Chairman and CEO)

Thanks, Blair. Good morning everyone. I want to start by addressing the conflict in the Middle East and the dynamic geopolitical environment our industry is navigating. While we’re hopeful for a peaceful resolution, we’re also embracing today’s reality. With safety our top priority, we’re focused every day on supporting our teams in the region and our customers globally. At GE Aerospace, we remain committed to our purpose. We invent the future of flight, lift people up and bring them home safely. Right now, nearly 1 million people are in flight with our technology under wing, a responsibility our 57,000 employees take seriously. Turning to our first quarter results, 2026 is off to a strong start. Orders were up 87% with CES nearly doubling and DPT up 67% including record defense orders for this decade. Revenue increased 29% driven by CES services and double digit growth in DPT. Operating profit grew 18% with both segments up double digits and EPS increased 25% to $1.86 with free cash flow up 14%. Flight Deck enabled us to improve output again with commercial services revenue up 39%, total engine deliveries up 43%. All the while, we’re continuously investing to improve time on wing and lower cost of ownership for our customers across our current fleet and for next generation technologies. I want to express a big thank you to both the GE Aerospace team and our supplier partners for their unwavering commitment to deliver for our customers. Turning to slide four and what we’re currently seeing in today’s operating environment. In the first quarter, global departures were up low single digits, including a high single digit decline in the Middle East which represents roughly 5% of our departures and for the balance of the year. We’ve assessed multiple scenarios to develop a range of outcomes with our current assumption that the conflict and its effects continue through the summer. As a result, we’re reducing our full year departures outlook from mid single digit growth to flat to low single digit growth. This includes a low double digit decline in the Middle East for the year with modest reductions to other regions. Based on our experience during the global financial crisis, the impact of services will likely lag changes in air traffic demand by several quarters, to be followed by a period of above average growth. We’re well positioned to navigate cycles with our backlog providing resilience through changes in air traffic, and we have a young and diverse fleet with leading programs in both narrowbody and widebody. For our largest program, the CFM56, about 2/3 of the the fleet is yet to undergo a second shop visit and utilization remains stable, supporting continued demand. Additionally, our defense business is supporting U.S. and allied warfighters. With our engines powering the Blackhawk, the Apache, the B1, the B2, the F15EX, the F16 and the Eurofighter. We’re seeing increased utilization since March, creating future aftermarket demand diving deeper into services and services orders and backlog. Our commercial services business is supported by a robust backlog of over $170 billion, up nearly $30 million since the end of 24, providing visibility into multi year demand and supporting our continued growth. Over the last 12 months, commercial services orders increased over 30%, including 49% growth in the first quarter. Within services, demand remains strong for spare parts which represent roughly 40% of surfaces revenue since the beginning of March, spare parts orders are up over 30% year over year and sequentially flat to the first two months of the first quarter. And even with over 25% revenue growth over the last five quarters, demand continues to exceed supply. As a result, spare parts delinquency, which represents shipments that have been delayed due to material availability constraints, is up roughly 70% since the end of 24. Given the sustained demand environment and our existing delinquency, we’re entering the second quarter with more than 95% of spare parts revenue already in backlog. Turning to internal shop visits, which represent roughly 60% of our service revenue, approximately 2/3 of the engines due for our projected shop visits for all of 26 are currently off wing either in our shops or waiting to be inducted. Additionally, we have high visibility into the engines which will come off wing over the next couple of quarters based on utilization trends and required removal thresholds. In concert with with the airlines, our pipeline of planned engine removals in the second and third quarters combined with engines that are currently off wing, exceeds our Shop Visit guide, providing ample demand to fulfill our outlook and DE risking our 2026 guide. Overall, we expect a limited impact on services, revenue and profit in 26. We’re holding our full year guidance across the board given the macro uncertainty, though, with our strong start to the year, we are trending toward the high end of that range. Shifting to slide 6 flight deck is fundamentally changing the way we operate and in times like these it matters even more. Collaborative problem solving with suppliers, airframers, airlines and lessors are key to this effort. For example, we recently hosted a key supplier at our Terre Haute, Indiana site, leveraging Flight Deck. We worked together to improve flow and reduce waste on their LEAP production line and they’ve since increased output by over 40%. Actions like these contributed to priority supplier material input, increasing double digits both sequentially and year over year again in the first quarter, resulting in the increased outputs I mentioned ago, including engines up 43% across our MRO network. We’re using Flight Deck to increase output, reduce turnaround times and lower the cost of shop visits. Take our McAllen, Texas site where we reduce LEAP high pressure turbine repair time by over 50% by redesigning the cell for better flow and we know AI will be an accelerator for Flight Deck. At our Lafayette, Indiana facility, we expanded the deployment of an AI based material assistant to predict shop visit work scopes for LEAP engines nine months in advance, building on the turnaround time reduction we’ve recognized in both our Selma and Malaysia sites. Collectively, our efforts improved shop visit turnaround times for both narrow body and widebody platforms year over year. With our growing installed base, we’re focused on expanding capacity to fulfill customer demand within the LEAP external network. Delta Tech Ops is now the first North American airline MRO provider licensed for both the LEAP-1A and LEAP-1B. And we just announced Iberia as our seventh premier mro. Supporting Growth in Europe More broadly, the Maintaining US Aerospace leadership requires sustained investment to meet customer demand. We recently announced plans to invest $1 billion in our U.S. manufacturing sites and supply base for the second consecutive year to help accelerate engine deliveries, ramp part production that extends time on wing and strengthen our defense industrial base. Additionally, $100 million will be invested in our external supplier base to provide equipment and tooling to increase capacity. These actions and investments are driving meaningful progress to increase services and equipment output. And while there’s more to do, we’re off to a strong start and position to ramp even further. Shifting to slide 7 our growing backlog reflects our commitment to deliver customer value. We’re investing to improve time on wing and cost of ownership. Nearly $200 million of our $1 billion investment in US manufacturing supports expanding capacity for LEAP durability upgrades and we’re making progress upgrading the fleet with durability kit now on over 30% of the Leap One A installed base. Growing our repair capability is critical to improve turnaround times and lower cost of ownership, as a repaired part can cost 50% less than a new part. At our Singapore repair facility, we’re investing $300 million to support new technologies and repair processes. Our customer driven approach is driving backlog growth with more than 650 commercial engine or over $1 billion in wins in the first quarter alone. This included extending our 50 plus year partnership with American as they celebrate their 100th anniversary this month. American recently committed to more than 300 LEAP-1A engines with options for 200 more to power future A321neo and A321XLR deliveries. United, also celebrating 100 years this month selected 300 GEnx engines for its 787 fleet, making it the largest GENX operator globally. And additionally, Delta committed to 60 GEnx engines with options for 60 more for its new 787 fleet, marking its first GenX selection. In services, we signed an agreement with ryanair covering approximately 2,000 CFM56 and LEAP engines, providing material support and MRO services to scale their in house capabilities consistent with our open MRO strategy and in defense, in support of the CH53K and the critical missions it performs for the US Marine Corps, we were awarded a $1.4 billion contract for additional T408 turboshaft engines. With continued momentum, we’re looking forward to what should be an exciting Farnborough airshow in July. Our experience with our current fleet is also informing next generation technology investment. RISE is central to that strategy and will enable improved efficiency without sacrificing durability this quarter. Together with the Civil Aviation Authority of Singapore and Airbus, we established the world’s first airport testbed for open fan technology as a part of the RISE program. This testing will validate how next gen engine architectures operate in real world airline environments and marks another step forward toward ground and flight tests later this decade in defense and systems. We also continue to execute with speed against high priority military needs in support of US and allied warfighters. This quarter deliveries were up 24% and we continue to receive awards across our family of small engines, a key growth area as programs progress. This included an award from the US Air Force to complete an initial design concept of the GEK 1500 in partnership with Kratos with potential applications across Unmanned Aerial Systems, Collaborative combat aircraft or ccas and missiles. This work is being informed by the maturity of the GEK 800, which completed successful altitude testing last fall. The team designed, built and tested the first GEK 800 in less than 12 months, testing the fifth iteration of the engine last summer. And we’re making progress with high end CCAs through our partnership with Shield AI for the expat Vehicle program, pairing our propulsion development, testing and certification expertise with their autonomous aircraft capabilities to accelerate delivery of mission ready capabilities. We also recently completed a preliminary design review on the Hybrid Electric Turbo Generator engine system for Beta Technologies MB250 VTOL autonomous aircraft. This confirms the engine concept and demonstrates the power of combining our technical expertise, accelerating key programs Stepping back We’re driving measurable progress on what matters most to our customers, ramping output and improving durability while reducing the cost of ownership, which supports their growth and ours. Rahul over to you Larry, thank you

Rahul Guy (Chief Financial Officer)

and good morning everyone. We started the year with over 20% top line and earnings growth. Orders were up 87% with CEs up 93% and TPT up 67%. Revenue increased 29% with CEs up 34% while DPT was up 19%. Operating profit was $2.5 billion, up approximately $380 million driven by services volume and price margins, as expected, decreased 200 basis points to 21.8% from the impact of install engine growth, investments and inflation. EPS was $1.86, up 25% from increased operating profit, a lower tax rate and a reduced share count. Free cash flow was $1.7 billion, up 14%, largely driven by higher earnings. Working capital and ADNA combined was nearly a $500 million source with strong utilization billings partially offset by the expected timing of compensation payments. Going deeper on our 25% EPS growth this quarter, growth in operating profit drove $0.29 or nearly 80% of the improvement in EPS with increased profit in CES and dpt. This was partially offset by higher corporate cost and eliminations which were up around $120 million, roughly half from an increase in eliminations and half from an increase in environmental health and safety expenses off a low base, a lower tax rate and and reduction in share count drove an additional 10 cents of EPS growth. Tax rates decreased 3 points to 14.7% from earnings mix and benefit from recent tax legislation. Share count was down 24 million from our previously announced capital allocation actions. Turning to ces in the first quarter, orders grew 93% with services up 49% and equipment more than tripling to nearly $8 billion. Revenue increased 34%, services grew 39% with internal shop visit revenue up 35% from higher volume including leap internal shop visit growth of over 50% and increased work scopes. Spare parts sales were also up over 25% from improved material availability and growth of external leap shop visits. Equipment revenue grew 20% with engine deliveries up 50% including LEAP up 63%. Widebody deliveries were also up over 25% driven by GenX which was up even more. Profit was $2.4 billion, up nearly $450 million from higher services volume price and the absence of charges related to estimated profitability on long term service agreements taken in first quarter of 2025. As expected, margins were down 230 basis points to 26.4% driven by install engine growth including Minex shipments and investments. Both install engine …

Full story available on Benzinga.com

This post was originally published here

NetSTREIT Corp (NYSE:NTST) reported upbeat results for the first quarter on Monday.

The company posted quarterly FFO of 34 cents per share which beat the analyst consensus estimate of 33 cents per share. The company reported quarterly sales of $57.062 million which beat the analyst consensus estimate of $53.114 million.

Netstreit raised its FY2026 FFO guidance from $1.35-$1.39 to $1.36-$1.39.

“I am pleased to report a strong start to the year with a record amount of net investments completed this quarter. Our disciplined sourcing and underwriting allowed us to capitalize on an attractive acquisitions market while maintaining our strict risk adjusted return targets. Given the excellent condition of our …

Full story available on Benzinga.com

This post was originally published here

The incoming CEO of Apple Inc. (NASDAQ:AAPL), John Ternus, is confronted with two significant tasks: overhauling the company’s artificial intelligence (AI) strategy in the face of growing investor concern and driving innovation.

Forrester analyst Dipanjan Chatterjee cautioned about potential turbulence for Apple due to changes in consumer technology interactions, especially concerning generative AI. Ternus is also faced with the decision to either uphold Apple’s privacy-focused approach or adopt AI-driven personalization, CNBC reported on Monday.

 “The seas will be turbulent for Apple because there’s been so much change in how consumers interact with technology,” Chatterjee said.

Despite ruling the consumer devices market and boasting a $4 trillion market cap, Apple has largely been an observer in the AI explosion. Investors are unhappy with delays in Apple Intelligence since its 2024 launch announcement. Apple is now expected to introduce a redesigned Siri in September, powered by Google‘s (NASDAQ:GOOG) (NASDAQ:GOOGL) Gemini model.

The company’s press release announcing the CEO transition didn’t mention AI, instead highlighting …

Full story available on Benzinga.com

This post was originally published here

U.S. retail sales posted their strongest monthly gain in over a year, signaling continued resilience in consumer spending even as higher prices and geopolitical uncertainty weigh on broader economic sentiment.

Data released by the U.S. Commerce Department showed retail sales rose 0.9% in April, well above economists’ expectations of a 0.4% increase, marking the largest jump since early 2025. The gains were broad-based, extending beyond gasoline purchases and auto sales, pointing to underlying strength in discretionary spending.

“Consumers are still showing a willingness to spend across categories,” said Michael Pearce, Deputy Chief U.S. Economist at Oxford Economics, noting that solid wage growth and a stable labor market continue to support household demand. “This report suggests the consumer remains a key pillar of economic growth.”

Core retail sales—which exclude autos, gasoline, building materials, and food services and feed directly into GDP calculations—rose 0.6%, reinforcing the view that spending momentum remains intact despite elevated borrowing costs.

Strength was evident across multiple sectors. Electronics and appliance retailers, clothing stores, and restaurants all reported gains, while online retail also contributed to the upside. The data suggests consumers are not only absorbing higher fuel costs but continuing to allocate spending toward goods and experiences.

The report arrives at a critical juncture for policymakers. Federal Reserve Chair Jerome Powell has emphasized a data-dependent approach as the central bank weighs the timing of potential rate cuts. Stronger-than-expected retail sales could complicate that outlook by signaling persistent demand, which may keep inflation pressures elevated.

“Robust consumption could delay the Fed’s ability to ease policy,” said Kathy Bostjancic, Chief Economist at Nationwide, adding that sustained spending strength may require policymakers to keep rates higher for longer than markets currently anticipate.

Markets are closely watching consumer behavior as a barometer of economic health. Household spending accounts for roughly two-thirds of U.S. economic activity, making retail data a key indicator for both growth and inflation trends.

At the same time, some economists caution that the strength may not be evenly distributed. Lower-income consumers continue to face pressure from higher living costs and rising credit balances, raising questions about how long current spending levels can be sustained.

“The headline number is strong, but there are underlying pressures building,” said Neil Dutta, Head of U.S. Economic Research at Renaissance Macro Research, pointing to tightening credit conditions and declining excess savings among certain households.

For corporate America, the data offers a mixed but generally positive signal. Retailers and consumer-facing businesses may benefit from sustained demand, while continued spending strength could also reinforce pricing power across sectors.

Looking ahead, the trajectory of consumer spending will be closely tied to labor market conditions, inflation trends, and interest rate policy. For now, the latest data underscores a key reality: despite economic headwinds, the U.S. consumer continues to drive growth—potentially reshaping expectations for both markets and policymakers in the months ahead.

JBizNews Desk

Bank of Hawaii Corp (NYSE:BOH) on Monday posted weaker-than-expected results for the first quarter.

The company reported quarterly earnings of $1.30 per share which missed the analyst consensus estimate of $1.33 per share. The company reported quarterly sales of $192.322 million which missed the analyst consensus estimate of $193.524 million.

“Bank of Hawai‘i began the year on firm footing,” said Jim Polk, President and CEO. “This performance underscores the strength and resilience of our franchise. Net interest income and net interest margin continued to improve, supported by disciplined balance sheet management and a stable deposit base. Total loans and leases and average noninterest-bearing deposits increased compared to the prior quarter. …

Full story available on Benzinga.com

This post was originally published here

As of April 21, 2026, three stocks in the information technology sector could be flashing a real warning to investors who value momentum as a key criteria in their trading decisions.

The RSI is a momentum indicator, which compares a stock’s strength on days when prices go up to its strength on days when prices go down. When compared to a stock’s price action, it can give traders a better sense of how a stock may perform in the short term. An asset is typically considered overbought when the RSI is above 70, according to Benzinga Pro.

Here’s the latest list of major overbought players in this sector.

BlackBerry Ltd (NYSE:BB)

  • On April 20, the company announced an expanded collaboration with NVIDIA Corporation (NASDAQ:NVDA) and a new automotive software deal with Leapmotor. QNX, …

Full story available on Benzinga.com

This post was originally published here

Oracle Corp (NYSE:ORCL) shares are gaining ground on Tuesday morning. The move follows a dip during Monday’s session driven by geopolitical jitters.

Analyst Highlights AI Backlog

DA Davidson analyst Gil Luria remains focused on the software giant’s massive scale. Luria noted Oracle is well-positioned to capture AI demand.

The company currently maintains a backlog of approximately $550 billion. Luria told CNBC that Oracle’s core software business effectively funds its expensive data center build-out.

Capital Spending Strategy

Investors are tracking Oracle’s aggressive pivot toward AI infrastructure. The company has cut 20,000 to 30,000 jobs to …

Full story available on Benzinga.com

This post was originally published here

U.S. Trade Representative Jamieson Greer has reportedly stated that the tariffs imposed by President Donald Trump on Mexico’s auto and steel sectors will continue, despite the upcoming renegotiations of the U.S.-Mexico-Canada Agreement (USMCA).

This information was shared with Mexican industry groups and top business leaders during meetings in Mexico City on Monday, including chambers representing commerce, automotive, and iron and steel sectors, as reported by Reuters on Tuesday.

The meetings were focused on the objectives for revamping the USMCA, with a review deadline set for July 1. Greer said tariffs are likely to remain, noting that Trump supports them and that a return to a zero-tariff global system is not expected, a source told the publication.

Greer also noted that U.S. officials are exploring ways to assist Mexico, but did not provide specific details. This marks the first time Greer has publicly stated that Mexico will have to contend with some level of tariffs, even after the USMCA is renegotiated this year.

The USMCA trade deal …

Full story available on Benzinga.com

This post was originally published here

Vicor (NASDAQ:VICR) held its first-quarter earnings conference call on Tuesday. Below is the complete transcript from the call.

This content is powered by Benzinga APIs. For comprehensive financial data and transcripts, visit https://www.benzinga.com/apis/.

View the webcast at https://edge.media-server.com/mmc/p/3wkwiew3/

Summary

Vicor reported Q1 2026 revenues of $113 million, a 5.3% increase sequentially and a 20.2% increase year-over-year.

Gross profit margin for Q1 stood at 55.2%, a slight decline from the previous quarter but an increase of 800 basis points from the same period last year.

The company expects Q2 revenues of nearly $126 million and full-year 2026 revenues of approximately $570 million.

Vicor is undertaking capacity expansion efforts, aiming to increase the capacity of its first fab to support $1.5 billion in annual revenue, with plans to explore a second fab.

Bookings were strong in high-performance computing, industrial, aerospace, and defense markets, with a book-to-bill ratio above 2.

Management highlighted ongoing strategic focus on vertical power delivery (VPD) technology, with advancements aimed at dominating the AI and computing markets.

The company anticipates continued growth in its licensing business, expecting it to become a significant portion of its revenue.

Vicor faced legal expenses related to intellectual property enforcement but expects these efforts to drive future licensing opportunities.

Full Transcript

OPERATOR

Good day and thank you for standing by. Welcome to the Vicor first quarter 2026 earnings conference call. At this time, all participants are in listen only mode. After the speaker’s presentation, there will be a question and answer session. To ask the question during the session, you will need to press star 11 on your telephone. You will then hear an automated message advising your hand is raised to withdraw your question. Please press star 11 again. Please be advised that today’s conference is being recorded. I would now like to hand the conference over to your speaker today. Jim Schmidt, Chief Financial Officer. Please go ahead.

Jim Schmidt (Chief Financial Officer)

Thank you. Good morning and welcome to Vicor Corporation’s earnings call for the first quarter ended March 31, 2026. I’m Jim Schmidt, Chief Financial Officer and I’m in Andover with Patrizio Vinciarelli, Chief Executive Officer and Phil Davies, Corporate Vice President, Global Sales and Marketing. Earlier this morning we issued a press release summarizing our financial results for the three months ended March 31, 2026. This press release has been posted on the investor Relations page of our website, www.vicorpower.com. we also filed a Form 8K today related to the issuance of this press release. I remind listeners this conference call is being recorded and as the copyrighted property of Vicor Corporation. I also remind you various remarks we make during this call may constitute forward looking statements for the purposes of the safe harbor provisions under the Private Securities Litigation Reform act of 1995. Except for historical information contained in this call, the matters discussed on this call, including any statements regarding current and planned products, current and potential customers, potential market opportunities, expected events and announcements, and our capacity expansion, as well as management’s expectations for sales growth, spending and profitability are forward looking statements involving risk and uncertainties. In light of these risks and uncertainties, we can offer no assurance that any forward looking statement will in fact prove to be correct. Actual results may differ materially from those explicitly set forth in or implied by any of our remarks today. The risks and uncertainties we face are discussed in Item 1A of our 2025 Form 10K, which we filed with the SEC on March 2, 2026. This document is available via the EDGAR system on the SEC’s website. Please note, the information provided during this conference call is accurate only as of today, Tuesday, April 21, 2026. Vicor undertakes no obligation to update any statements, including forward looking statements made during this call and you should not rely upon such statements after the conclusion of this call. A webcast replay of today’s call will be available shortly on the Investor Relations page of our website. I’ll now turn to a review of Q1 financial performance, after which Phil will review recent market developments and Patrizio, Phil and I will take your questions. In my remarks. I will focus mostly on the sequential quarterly changes for P and L and balance sheet items and refer you to our press release or our upcoming Form 10Q for additional information. As stated in today’s press release, VICOR recorded product and royalty revenue for the first quarter of $113 million, up 5.3% sequentially from the fourth quarter of 2025 total of $107.3 million and up 20.2% from the first quarter of 2025 total of $94 million. Advanced products revenue increased 3.7% sequentially to $64.9 million, and brick products revenue increased 7.7% sequentially to $48 million. Shipments to stocking distributors increased 0.5% sequentially and and increased 63.6% year over year. Exports for the first quarter decreased sequentially as a percentage of total revenue to approximately 48.9% from the prior quarter’s 49.3%. For Q1 advanced product share of total revenue decreased to 57.5% compared to 58.4% for the fourth quarter of 2025, with brick products share correspondingly increasing to 42.5% of total revenue. Turning to Q1 gross margin, we recorded a consolidated gross Profit margin of 55.2%, a 20 basis point decrease from the prior quarter. Q1 gross margin increased 800 basis points from the same quarter last year. I’ll now turn to Q1 operating expenses. Total operating expense increased 4% sequentially from the fourth quarter of 2025 to $45.5 million. This increase included higher legal expenses related to enforcement of RIP. The amounts of total equity based compensation expense for Q1 included in cost of goods, SGA and R&D was 836,000 1,959 and 1,057,000 respectively, totaling approximately $3.9 million. Turning to income taxes, we recorded a tax benefit for Q1 of approximately $0.3 million, representing an effective tax rate for the quarter of -1.3%. The company’s tax provision and effective tax rate for the quarter ended March 31, 2026 was positively impacted by stock options exercised in the quarter. Net income for Q1 totaled $20.7 million. GAAP diluted income per share was $0.44 based on a fully diluted share count of 47,254,000 shares. Turning to our cash flow and balance sheet, cash and Cash equivalents totaled $404.2 million at Q1, an increase of $1.4 million sequentially. Accounts receivable net of reserves totaled $67.4 million at quarter end, with DSOs for trade receivables at 42 days. Inventories net of reserves increased 3.8% sequentially to $94.8 million. Annualized inventory turns were 2.1. Cash flow used for operating activities totaled $3.9 million for the quarter, which was net of a litigation settlement payment of 28.6 million. Capital expenditures for Q1 totaled $12.4 million. We ended the quarter with a construction in progress balance primarily for manufacturing equipment of approximately $10.7 million and with approximately $33.9 million remaining to be spent. I’ll now address bookings and backlog Q1 book to Bill came in above 2 and 1 year backlog increased 70% from the prior quarter, closing at $300.6 million. 2026 is a year of great opportunity for Vicor. We expect Q2 revenues of nearly 126 million and 2026 revenues of nearly 570 million. This guidance is based on conservative assumptions about our licensing practice, specifically that we will not enter into new licensing agreements until our second ITC case gets to its final determination in 2027. Additional exclusion orders further restricting importation of infringing computing systems will provide motivation to close new licensing deals on the right terms. Along with revenue growth in 2026, we expect margin expansion.

Phil Davies (Corporate Vice President, Global Sales and Marketing)

Phil thank you Jim. With the book to bill above, two Q1 bookings were strong across our high performance computing, industrial and aerospace and defense markets. They remain strong in the second quarter and I’ll discuss each of them in turn. Our lead computing customer is continuing a steep production ramp of its wafer scale engine with best in class AI inference performance. Wafer scale engines and future embedded multi die and COAS packages for AI Chiplet solutions are uniquely enabled by vertical power delivery. Further advances in AI performance are about to be enabled by Vicor’s second generation VPD solution with 3amps per square millimeter current density and a current multiplication factor of up to 40 in a 1.5 millimeter thin package. Per my Q4 comments, engagement with other HPC customers for second generation VPD solutions will follow the generational transition by our lead customer with capacity in our first chip fab earmarked for existing strategic customers. We will continue to be selective as we add additional customers on the VPD front, competition is handicapped by a multiplicity of issues including inadequate current density and stacked packages that are not mechanically and thermally adept. That’s because competition copied a first generation VPD solution whose pioneering aspects are still immature and at risk of continuity of supply challenges caused by patent infringement. Our broad industrial market, which is supported by our global distribution partners, had a strong first quarter and our top 100 industrial OEMs in the automated test and semiconductor manufacturing equipment markets continue to benefit from the AI data center buildout with strong order placement. We are also winning next generation platforms with earlier generation and new factorized power system solutions. Our current multipliers supplying high power to ASIC and memory test heads and pin electronics remain unchallenged and in terms of current density, low noise and thin packages, geopolitical developments have been a key driver of our aerospace and defence business in recent quarters. Increases in spending as a percentage of GDP and replenishment of defensive and offensive systems supports the growth of this market. Our objectives, goals and strategies for 2026 remain unchanged, with a focus on a portfolio of 100 customers globally across four market segments. Future growth opportunities will require capacity expansion, including a second fab Our combinatorial strategy of being the power system technology innovator and an IP licensing company is delivering results. With that, we’ll take your questions.

OPERATOR

Thank you. As a reminder to ask a question, please press star 11 on your telephone and wait for your name to be announced. To withdraw your question, please press star 11 again. Our first question comes from the line of Quinn Bolton with Needham and Company. Your line is now open.

Quinn Bolton (Equity Analyst)

Hey guys, congratulations on the nice results and outlook. I guess I wanted to start with just the assumptions you’re making around 2026 for the IP licensing business. Looks like royalty revenue and Q1 was about $15 million or about $60 million annualized. I know you’re not assuming any additional or new licenses signed, but where do you see royalty or licensing revenue this year as part of that 570 guidance?

Patrizio Vinciarelli (Chief Executive Officer)

The 570 guidance includes royalties, which would increase somewhat based on existing licensing agreement, but in terms of providing, in effect, safe guidance, we thought it would be best to set aside any opportunity with respect to, in other words, early deals relating to current actions. So our working assumption for guidance purposes is that we’re not going to have any until we get to further diminution on our second case next year, but it could be that we do get some ahead of that time frame. Understood.

Quinn Bolton (Equity Analyst)

And then Patricia, last quarter you seemed Pretty confident that the utilization in Andover would approach 80% by the end of 26 or early 2027. Look, looks like you’re on a strong product ramp. But are you still sort of comfortable or still expecting utilization to sort of achieve those levels that you discussed last quarter?

Patrizio Vinciarelli (Chief Executive Officer)

Yes, in absolute terms with respect to product revenues. What has transpired since we last spoke on this topic is that we actually have a significant level of elasticity with respect to expansion capacity within the fellow state facility. That’s giving us a little bit more flexibility with respect to the timing and choice of the location for the second fab. So to get a little bit more specific, we’ve seen an opportunity for relatively significant dispatching capacity. It could be as much as 50% above what had been planned to be supported in terms of annual revenues out of the Fellow Street facility. So that gives us cushion with respect to timing, which were put into good use in terms of the choice of a location. And to give you a little bit more flavor with respect to that. We’ve also come around to focusing on existing buildings as opposed to a piece of land because of the fact that with an existing building we can execute much more rapidly in terms of capacity expansion. And part of strategy with respect to getting more out of the Fellow Street facility is to selectively source outside of that facility, you know, some of the process steps that can be more easily relocated. So that should give you the picture with respect to both the capacity utilization and the plans with respect to capacity expansion.

Quinn Bolton (Equity Analyst)

Sorry, Patrice, just a quick clarification. Did you say that in the first Andover facility you would be outsourcing some manufacturing steps either to third parties or would that be to the second chip fab?

Patrizio Vinciarelli (Chief Executive Officer)

It would be to an interim solution for the second chip fab, but this will still be totally within Vigo control. But there are process steps that can be easily located in a nearby building and that’s part of the plan to extend capacity of the fell state facility. Understood. Thank you. I’ll get back in queue.

OPERATOR

Thank you. Our next question comes from the line of Justin Claire with Roth Capital Partners. Your line is now open.

Justin Claire (Equity Analyst)

Hey, good morning. Thanks for the questions here. So I think first off, you mentioned engagement with additional VPD customers. I think could follow the generational transition for the lead customer from Gen4 to Gen5. Was wondering if …

Full story available on Benzinga.com

This post was originally published here

Gold’s recent pullback has failed to shake institutional conviction, with major investors continuing to position for long-term currency debasement despite heightened volatility driven by geopolitical tensions and shifting rate expectations.

While momentum has slowed in recent weeks, strategists at Wells Fargo Investment Institute say writing off gold’s broader trajectory would be premature, pointing instead to a market undergoing consolidation after an extended rally. “We continue to see gold as a compelling medium-term opportunity,” the firm said in a recent client note, emphasizing that the underlying macro drivers remain intact.

Gold was one of the standout performers in 2025, supported by aggressive central bank buying, persistent inflation concerns, and elevated geopolitical risks. Data from the World Gold Council shows central banks continued to accumulate bullion at near-record levels, reinforcing gold’s role as a strategic reserve asset amid growing skepticism toward fiat currencies.

That strength carried into early 2026 before sentiment shifted sharply. Gold posted its worst monthly performance since 2008 in March, as escalating tensions tied to the U.S.–Iran conflict fueled inflation expectations and forced markets to scale back anticipated Federal Reserve rate cuts. Rising yields, a traditional headwind for non-yielding assets, contributed to the selloff.

Despite the correction, investor demand has proven resilient. The SPDR Gold Trust (NYSE: GLD), the world’s largest gold-backed exchange-traded fund, remains up roughly 11% year-to-date, underscoring continued institutional allocation even as volatility persists.

“The bigger picture continues to revolve around currency debasement,” said George Milling-Stanley, Chief Gold Strategist at State Street Global Advisors. “With governments running large deficits and central banks balancing inflation with growth, gold remains a key hedge against the erosion of purchasing power.”

Analysts point to structural shifts in global financial systems as an additional tailwind. Several emerging market central banks, including China’s People’s Bank of China, have steadily increased gold reserves in recent years as part of broader diversification away from the U.S. dollar.

At the same time, geopolitical uncertainty continues to reinforce gold’s safe-haven appeal. While conflict-related volatility has contributed to short-term price swings, it has also strengthened gold’s positioning as a strategic asset during periods of global instability.

Still, some market participants caution that near-term risks remain. “Higher real yields could continue to pressure gold prices in the short run,” said Ole Hansen, Head of Commodity Strategy at Saxo Bank. “The market may face intermittent setbacks if rate expectations continue to shift.”

For investors and policymakers alike, gold’s resilience highlights a deeper concern about the long-term trajectory of global currencies. Expanding fiscal deficits, rising sovereign debt, and persistent inflation pressures are reinforcing the case for hard assets as a hedge against monetary erosion.

Looking ahead, gold’s path will be closely tied to Federal Reserve policy, inflation dynamics, and geopolitical developments. While volatility is likely to remain elevated, institutional positioning suggests the core thesis is unchanged: gold is increasingly viewed not just as a tactical trade, but as a strategic safeguard against currency debasement in an uncertain global economy.

JBizNews Desk

AT&T Inc. (NYSE:T) will release earnings for its first quarter before the opening bell on Wednesday, April 22.

Analysts expect the telecommunications company to report quarterly earnings of 55 cents per share. That’s up from 51 cents per share in the year-ago period. The consensus estimate for AT&T’s quarterly revenue is $31.24 billion (it reported $30.63 billion last year), according to Benzinga Pro.

Ahead of quarterly earnings, Scotiabank analyst Maher Yaghi, on April 1, maintained AT&T with a Sector Perform rating and raised the price target from $31 to $31.5.

With the recent buzz around AT&T, some investors may be eyeing potential gains from the company’s dividends too. As of now, AT&T has an annual dividend yield of 4.24%, which is a quarterly dividend amount of 27.75 cents per share ($1.11 a year).

To figure out how to earn $500 monthly from AT&T, we …

Full story available on Benzinga.com

This post was originally published here

Goodfood Market (TSX:FOOD) held its second-quarter earnings conference call on Tuesday. Below is the complete transcript from the call.

This transcript is brought to you by Benzinga APIs. For real-time access to our entire catalog, please visit https://www.benzinga.com/apis/ for a consultation.

The full earnings call is available at https://www2.makegoodfood.ca/en/investisseurs/evenements

Summary

Goodfood Market reported a decline in net sales and active customers in Q2 2026, with net sales at $22.5 million and active customers at 59,000, primarily due to a temporary license disruption and reduced marketing efforts.

The company is focused on a strategic reset, emphasizing cost discipline, margin protection, and cash generation, while simplifying operations and improving product offerings to enhance customer retention and lifetime value.

Despite temporary cost pressures leading to a negative adjusted EBITDA of $1 million, management remains optimistic about future performance, highlighting actions taken to stabilize margins and improve cash flow through operational efficiencies and tighter cost controls.

Full Transcript

OPERATOR

Good morning ladies and gentlemen and welcome to The Good Food Q2 2026 earnings conference call and webcast. At this time, all participants are enlisted only. Following the presentation, we will conduct a question and answer session. Instructions will be provided at that time for you to queue up for questions. Please note that questions will be taken from financial analysts only. If anyone has any difficulties hearing the conference, please press star followed by zero for operator assistance at any time. I would like to remind everyone that this conference call is being recorded today, April 21st at 8:00am Eastern Time. Furthermore, I would like to remind you that today’s presentation may contain forward looking statements, statements about good foods, current and future plans, expectations and intentions, results, level of activity, performance, goals or achievements, or other future events or developments. As such, please take a moment to read the disclaimer on forward looking statements on slide 2 of the presentation. I would like to turn the meeting over to your host for today’s call, Selim Basu, Good Food Chief Executive Officer. Mr. Basu, you may proceed.

Selim Basu (Chief Executive Officer)

Thank you. Bonjour tout le monde, Bienvenue conférence de marche Good Food for presente non resultier du de seintrimas de l’ exe sis DeMille Vincis Good morning everyone. Welcome to our Good Food earnings call in which we will present our results for the second quarter of fiscal 2026. You can find our press release and other filings on our website and SEDAR Plus and all figures on this call are in Canadian dollars unless otherwise noted. With me today are Najib Malouf, our newly appointed President and Chief Operating Officer Vanessa Harida, our Vice President of Finance and Ross Aomur, our outgoing Chief Financial Officer. Before we begin, I wanted to highlight two things. First, Najeeb and I joined goodfood with a clear stabilize the business, protect cash and rebuild discipline. That work is underway and albeit today’s result will show the impact of a license suspension, we have made significant strides in advancing our mandate. Also for fiscal 2026, both Najib and I have made the deliberate decision to forego our base salary. This is a voluntary choice. Our employment agreements remain unchanged, but we believe that in this phase of the company’s transformation, accountability needs to start at the top. This is not a signal that we expect others to do the same. Our priority is to build a stronger, more resilient company, one that creates long term opportunities for our teams, delivers for our customers and earns the trust of our …

Full story available on Benzinga.com

This post was originally published here

Brian Paes-Braga, Chairman & CEO of The Metals Royalty Co. (NASDAQ:TMCR), was recently a guest on Benzinga All Access. 

Paes-Braga discussed the company’s recent direct listing and its focus on providing capital to critical mineral projects at a time when the Western world is placing a greater emphasis on mineral sovereignty. 

The listing …

Full story available on Benzinga.com

This post was originally published here

Microsoft Corp (NASDAQ:MSFT) shares are up during Tuesday’s premarket session as the company is expanding its partnership with North America’s Building Trades Unions (NABTU) to enhance AI training and career pathways.

This initiative aims to provide no-cost AI literacy courses to skilled craft professionals, reflecting Microsoft’s commitment to making AI accessible and beneficial for all.

Microsoft said that the partnership with NABTU will build on previous training efforts, having already trained 1,500 instructors, and is set to launch AI literacy courses to millions across North America. This collaboration is part of Microsoft’s broader strategy to ensure that communities involved in building the AI economy can share in its opportunities.

Enterprise AI Scale-Up

Recently, Microsoft doubled down on enterprise AI, partnering with Expert.ai to push real-world adoption beyond experimentation and into scalable deployment.

Expert.ai has partnered with Microsoft Italy to accelerate enterprise adoption of artificial intelligence for complex business processes. The collaboration aims to help organizations move AI from experimental stages into scalable, production-ready environments.

The partnership brings Expert.ai’s EidenAI Suite to the Microsoft Azure Marketplace, enabling businesses to deploy advanced AI capabilities within a trusted cloud …

Full story available on Benzinga.com

This post was originally published here

During times of turbulence and uncertainty in the markets, many investors turn to dividend-yielding stocks. These are often companies that have high free cash flows and reward shareholders with a high dividend payout.

Benzinga readers can review the latest analyst takes on their favorite stocks by visiting Analyst Stock Ratings page. Traders can sort through Benzinga’s extensive database of analyst ratings, including by analyst accuracy.

Below are the ratings of the most accurate analysts for three high-yielding stocks in the real estate sector.

Outfront Media Inc (NYSE:OUT)

  • Dividend Yield: 3.95%
  • Barrington Research analyst Patrick Sholl maintained an Outperform rating and raised the price target from $27 to $33 on March 2, 2026. This analyst has an accuracy rate of 68%
  • Wells Fargo analyst Daniel Osley maintained an Overweight rating and increased the price target from $27 to $30 on Feb. 27, 2026. This analyst has an accuracy rate of 74%.
  • Recent News: On Feb. 25, OUTFRONT Media reported better-than-expected fourth-quarter financial results.
  • Benzinga Pro’s …

Full story available on Benzinga.com

This post was originally published here

Reddit Inc. (NYSE:RDDT) co-founder Alexis Ohanian recently shared his views on the impact of artificial intelligence (AI) on various industries, emphasizing the resilience of sports in the face of AI advancements.

Ohanian took to X on Monday to express his thoughts on the topic and said, “Folks are finally starting to realize.”

He shared a post from another X user highlighting his talk at the Global Alts Miami conference in March, where he argued that while AI is revolutionizing digital content, it cannot replicate or automate live sports. Ohanian believes that sports, particularly women’s sports, will continue to grow in value as AI takes over other sectors.

“Sport is the last one standing, right? You’re never going to pay money to take your kids to go see a bunch of robots hit 18 hole-in-ones or what have you. And …

Full story available on Benzinga.com

This post was originally published here

Energy Focus Inc (NASDAQ:EFOI) shares are up in Tuesday’s premarket session. The move follows a massive rally on Friday and a retreat on Monday.

Profit-Taking After Exponential Surge

The recent volatility appears driven by profit-taking. On Friday, volatility triggered a circuit breaker halt, ending that session up a staggering 242.11%.

Friday’s surge began after the lighting company outlined progress on data center infrastructure. Management highlighted its specific role in AI-ready facilities.

This pivot toward AI infrastructure has captured significant retail interest.

The company recently completed Project G, a $0.5 million Uninterruptible Power Supply (UPS) installation.

It …

Full story available on Benzinga.com

This post was originally published here

Gold’s momentum might have slowed in recent weeks, but writing off its broader trajectory would be premature.

Despite the volatility, largely caused by the outbreak of the U.S.–Iran war, institutions like Wells Fargo still see gold as a compelling medium-term opportunity, rather than a trade that has run its course.

Gold’s recent pullback was in complete contrast to its blistering run. In 2025, yellow metal was a standout performer as strong central bank purchases, lingering inflation concerns, and elevated geopolitical tensions fueled the rally.

The strength carried into early 2026, before the sentiment shifted. March’s performance was the worst since 2008, as war-driven inflation erased the rate cut expectations. Since then, the market has recovered, and SPDR Gold Trust (NYSE:GLD) is currently up 11% year-to-date.

Debasement Marches On

Still, for institutional players, the bigger picture remains intact owing to the …

Full story available on Benzinga.com

This post was originally published here

U.S. stock futures were higher this morning, with the Dow futures gaining around 300 points on Tuesday.

Shares of Vicor Corp (NASDAQ:VICR) fell sharply in pre-market trading after the company posted first-quarter results.

Vicor reported quarterly earnings of 44 cents per share which beat the analyst consensus estimate of 31 cents per share. The company reported quarterly sales of $112.969 million which beat the analyst consensus estimate of $109.050 million.

Vicor shares dipped 2.2% to $220.00 in pre-market trading.

Here are some other stocks moving lower in pre-market trading.

  • Maase Inc. (NASDAQ:MAAS) fell 10.2% to …

Full story available on Benzinga.com

This post was originally published here

As tariffs and geopolitical turbulence batter global trade, the head of the world’s largest development institution says the biggest emerging market opportunities barely depend on global trade at all.

In an interview published on Monday with Indian entrepreneur podcaster Nikhil Kamath, World Bank President Ajay Banga — the former Mastercard CEO who now oversees what he describes as “$120-odd billion that gets put into the marketplace every year” laid out five sectors he believes will drive growth across the developing world.

The Five Sectors

Infrastructure anchors Banga’s list — roads, bridges, airports, power, and water as the base on which everything else is built. Smallholder agriculture is second, focused on keeping farmers productive and on their land rather than fuelling urban migration. Primary healthcare is third, built around technology-enabled local clinics connecting communities to remote doctors.

Tourism is fourth — Banga sees a vast gap between what many developing economies have to offer and how few visitors they actually attract.

Value-added …

Full story available on Benzinga.com

This post was originally published here

Top Wall Street analysts changed their outlook on these top names. For a complete view of all analyst rating changes, including upgrades, downgrades and initiations, please see our analyst ratings page.

  • Goldman Sachs analyst Matthew Martino initiated coverage on Dynatrace Inc (NYSE:DT) with a Buy rating and announced a price target of $45. Dynatrace shares closed at $35.44 on Monday. See how other analysts view this stock.
  • Truist Securities analyst Richard Sunderland initiated coverage on American Electric Power Company Inc (NASDAQ:AEP) with a Buy rating and announced a price target of $148. American Electric Power shares …

Full story available on Benzinga.com

This post was originally published here

The Iran war has disrupted multiple sectors, with aviation and energy industries among the hardest hit as regional tensions escalate.

South Korea Introduces Driving Bans

South Korea remains one of the regions most severely affected by the fuel shortages as the country relies on imports for over 90% of its energy needs, with 70% of its crude oil shipments arriving from the Gulf region. However, the country’s oil reserves risk running out as the situation in the Middle East worsens, the Telegraph reported on Monday.

The report also said that South Korean government employees had been directed to stop driving one weekday out of five as petrol reserves dry up and fuel prices at the pump surge. The government has set aside 26 trillion South Korean won (nearly $17 billion) to purchase fuel as soon as the strait opens up.

The report also says that residents have been urged to also take steps to slow down energy consumption, including charging EVs and phones during the day, reducing time spent in the shower, using vacuum cleaners and washing machines on the weekends only, cycling more, etc.

The country will also focus on increasing Nuclear energy outputs and is halting exports of jet fuel to prioritize domestic airlines.

Europe’s Jet Fuel Shortages

Speaking of airlines, European countries have been grappling with shortages of jet fuel as the Strait of Hormuz remains shut, according to a report by OilPrice.com on Sunday, citing the shutdown of the refineries in the region due to emissions-related rules and declining demand, which …

Full story available on Benzinga.com

This post was originally published here

California officials on Monday said newly unsealed court filings show Amazon.com Inc. (NASDAQ:AMZN)  engaged in an illegal price-fixing scheme that allegedly pushed up prices across major retailers.

Amazon Price Fixing Allegations Involving Major Retailers

In a press release, California Attorney General Rob Bonta said the state has obtained unredacted court filings that allegedly show Amazon pressuring vendors and retailers to raise prices across competing platforms, including Walmart and Target.

“The evidence we’ve uncovered is clear as day: Amazon is working to make your life more unaffordable,” Bonta said.

He added, “The company is price fixing, colluding with vendors and other retailers to raise costs for Americans beyond what the market requires.”

According to the filing, Amazon allegedly instructed vendors to “fix,” “raise,” or “increase” prices on rival platforms and threatened penalties if they did …

Full story available on Benzinga.com

This post was originally published here

Capital One Financial Corporation (NYSE:COF) will release earnings for its first quarter after the closing bell on Tuesday, April 21.

Analysts expect the McLean, Virginia-based company to report quarterly earnings of $4.67 per share, up from $4.06 per share in the year-ago period. The consensus estimate for Capital One Financial’s quarterly revenue is $15.37 billion (it reported $10 billion last year), according to Benzinga Pro.

According to Bloomberg, a U.S. District judge in Miami, last month, granted Capital One’s request to dismiss the lawsuit, which accused the bank of closing hundreds of accounts in 2021 due to “political discrimination.”

Capital One Financial shares fell 0.4% to close at $205.71 on Monday.

Benzinga readers can access the latest analyst ratings on the Analyst Stock Ratings page. Readers can sort by stock ticker, company name, analyst firm, rating change or other …

Full story available on Benzinga.com

This post was originally published here

On CNBC’s “Halftime Report Final Trades,” NewEdge Wealth CEO Rob Sechan picked Broadcom Inc. (NASDAQ:AVGO), which moved lower on Monday.

Broadcom, on April 14, announced a strategic partnership with Meta Platforms Inc (NASDAQ:META). The tech firm agreed to support the so-called MTIA (Meta Training and Inference Accelerator) compute chips through 2029.

Don’t forget to check out our premarket coverage here

Bryn Talkington, managing partner of Requisite Capital Management, likes Capital One Financial Corporation (NYSE:COF). The bank expects to report quarterly earnings today.

Capital One Financial will release earnings for its first quarter …

Full story available on Benzinga.com

This post was originally published here

The S&P 500 slipped on Monday, falling 0.24% to close at 7,109.14, as renewed tensions between the U.S. and Iran weighed on sentiment and snapped the market’s recent momentum.

The Polygon-based (CRYPTO: POL) Polymarket crowd is still optimistic heading into Tuesday. The April 21 market shows a 68% bet on “Up,” with early trading activity building on whether the S&P 500 will open higher or lower.

Why That Number Matters

Tensions escalated after President Donald Trump said the U.S. had seized an Iranian-flagged cargo ship in the Gulf of Oman, while Iran signaled it would not participate in a new round of peace talks. The current ceasefire between the two sides is also set to expire this week, adding …

Full story available on Benzinga.com

This post was originally published here

Intuitive Surgical, Inc. (NASDAQ:ISRG) will release earnings for its first quarter after the closing bell on Tuesday, April 21.

Analysts expect the Sunnyvale, California-based company to report quarterly earnings of $2.11 per share. That’s up from $1.81 per share in the year-ago period. The consensus estimate for Intuitive Surgical’s quarterly revenue is $2.62 billion (it reported $2.25 billion last year), according to Benzinga Pro.

On March 18, the U.S. Food and Drug Administration (FDA) issued an early alert highlighting a potentially high-risk issue with stapling devices manufactured by Intuitive Surgical.

Shares of Intuitive Surgical fell 0.8% to close at $465.60 on Monday.

Benzinga readers can access the latest analyst ratings on the Analyst Stock Ratings page. Readers can sort by stock ticker, company name, analyst firm, rating change or other variables.

Let’s have …

Full story available on Benzinga.com

This post was originally published here

The most oversold stocks in the health care sector presents an opportunity to buy into undervalued companies.

The RSI is a momentum indicator, which compares a stock’s strength on days when prices go up to its strength on days when prices go down. When compared to a stock’s price action, it can give traders a better sense of how a stock may perform in the short term. An asset is typically considered oversold when the RSI is below 30, according to Benzinga Pro.

Here’s the latest list of major oversold players in this sector, having an RSI near or below 30.

Kiniksa Pharmaceuticals Internationl PLC (NASDAQ:KNSA)

  • On April 16, Wedbush analyst David Nierengarten maintained Kiniksa Pharmaceuticals with an Outperform rating and raised the price target from $53 to $58. The company’s stock fell around 10% over the past five days and has a 52-week low of $19.62.
  • RSI Value: 28
  • KNSA Price Action: Shares …

Full story available on Benzinga.com

This post was originally published here

SpaceX’s IPO filing reportedly indicates that founder Elon Musk and a select group of insiders will maintain substantial voting control in the company post-IPO, thereby ensuring their voting power surpasses that of other investors.

Following the IPO, Musk will continue to serve as the CEO, CTO, and chairman of the nine-member board of directors, Reuters reported on Tuesday.

SpaceX plans to adopt a dual-class equity structure, with Class B shareholders receiving 10 votes each, thereby consolidating power with Musk and a few insiders. Class A shares sold to public investors will carry one vote each.

The filing includes provisions that may limit shareholders’ influence over board elections and legal actions, a structure common in founder-led tech firms that reduces public investors’ power over strategy and management, according to Reuters.

The confidentially submitted filing, earlier this month, sheds light on SpaceX’s financial health and corporate governance. The combined company ended 2025 with $24.8 billion in cash and a strong balance sheet, holding $92 billion in assets …

Full story available on Benzinga.com

This post was originally published here

In today’s rapidly evolving and fiercely competitive business landscape, it is crucial for investors and industry analysts to conduct comprehensive company evaluations. In this article, we will undertake an in-depth industry comparison, assessing Apple (NASDAQ:AAPL) alongside its primary competitors in the Technology Hardware, Storage & Peripherals industry. By meticulously examining crucial financial indicators, market positioning, and growth potential, we aim to provide valuable insights to investors and shed light on company’s performance within the industry.

Apple Background

Apple is among the largest companies in the world, with a broad portfolio of hardware and software products targeted at consumers and businesses. Apple’s iPhone makes up a majority of the firm sales, and Apple’s other products like Mac, iPad, and Watch are designed around the iPhone as the focal point of an expansive software ecosystem. Apple has progressively worked to add new applications, like streaming video, subscription bundles, and augmented reality. The firm designs its own software and semiconductors while working with subcontractors like Foxconn and TSMC to build its products and chips. Slightly less than half of Apple’s sales come directly through its flagship stores, with a majority of sales coming indirectly through partnerships and distribution.

Company P/E P/B P/S ROE EBITDA (in billions) Gross Profit (in billions) Revenue Growth
Apple Inc 34.56 45.46 9.35 52.0% $54.07 $69.23 15.65%
Western Digital Corp 35.36 17.84 12.88 27.66% $2.11 $1.38 25.24%
Seagate Technology Holdings PLC 60.99 263.44 11.91 299.49% $0.85 $1.18 21.51%
Everpure Inc 123.64 15.54 6.37 7.04% $0.15 $0.74 20.35%
NetApp Inc 17.92 18.20 3.23 31.16% $0.51 $1.21 4.39%
Super Micro Computer Inc 21.03 2.47 0.66 5.93% $0.55 $0.8 123.36%
Logitech International SA 20.97 6.28 3.13 11.36% $0.31 $0.61 6.06%
Diebold Nixdorf Inc 34.46 2.77 0.86 4.49% $0.11 $0.28 11.66%
Turtle Beach Corp 15.08 1.77 0.74 14.73% $0.02 $0.05 -18.69%
Immersion Corp 11.31 0.71 0.13 3.98% $0.06 $0.14 5.51%
Average 37.86 36.56 4.43 45.09% $0.52 $0.71 22.15%

Full story available on Benzinga.com

This post was originally published here

In the ever-evolving and intensely competitive business landscape, conducting a thorough company analysis is of utmost importance for investors and industry followers. In this article, we will carry out an in-depth industry comparison, assessing Airbnb (NASDAQ:ABNB) alongside its primary competitors in the Hotels, Restaurants & Leisure industry. By meticulously examining key financial metrics, market positioning, and growth prospects, we aim to offer valuable insights to investors and shed light on company’s performance within the industry.

Airbnb Background

Airbnb is the world’s largest online alternative accommodation travel agency; it also offers booking services for boutique hotels, experiences, and hotel-like services. Airbnb’s platform offers over 9 million active accommodation listings. Listings from the company’s 5 million-plus hosts are spread over almost every country in the world. In 2025, 42% of revenue was from North America, 39% from Europe, the Middle East, and Africa, 10% from Latin America, and 9% from Asia-Pacific. Transaction fees for online bookings account for all its revenue.

Company P/E P/B P/S ROE EBITDA (in billions) Gross Profit (in billions) Revenue Growth
Airbnb Inc 35.63 10.50 7.31 4.06% $0.27 $2.29 12.02%
Royal Caribbean Group 18.08 7.54 4.31 7.49% $1.57 $2.02 13.21%
Carnival Corp 12.78 3.08 1.53 2.04% $1.27 $2.23 6.11%
Viking Holdings Ltd 33.50 34.25 5.91 31.67% $0.45 $0.71 27.76%
Expedia Group Inc 27.85 26.08 2.45 15.64% $0.59 $3.2 11.4%
Norwegian Cruise Line Holdings Ltd 22.02 4.18 0.98 0.65% $0.55 $0.92 6.4%
Choice Hotels International Inc 15.45 30.97 3.56 38.3% $0.12 $0.21 0.1%
Hilton Grand Vacations Inc 55.35 3.11 0.89 3.59% $0.25 $2.34 3.82%
Global Business Travel Group Inc 27.86 2 1.11 5.29% $0.14 $0.45 34.01%
Average 26.61 13.9 2.59 13.08% $0.62 $1.51 12.85%

Full story available on Benzinga.com

This post was originally published here

In the ever-evolving and intensely competitive business landscape, conducting a thorough company analysis is of utmost importance for investors and industry followers. In this article, we will carry out an in-depth industry comparison, assessing Adobe (NASDAQ:ADBE) alongside its primary competitors in the Software industry. By meticulously examining key financial metrics, market positioning, and growth prospects, we aim to offer valuable insights to investors and shed light on company’s performance within the industry.

Adobe Background

Adobe provides content creation, document management, and digital marketing and advertising software and services to creative professionals and marketers for creating, managing, delivering, measuring, optimizing, and engaging with compelling content multiple operating systems, devices, and media. The company operates with three segments: digital media content creation, digital experience for marketing solutions, and publishing for legacy products (less than 5% of revenue).

Company P/E P/B P/S ROE EBITDA (in billions) Gross Profit (in billions) Revenue Growth
Adobe Inc 14.49 8.79 4.27 16.39% $2.66 $5.73 11.97%
Palantir Technologies Inc 231.57 47.23 83.62 8.71% $0.58 $1.19 70.0%
AppLovin Corp 48.90 77.57 30.63 61.09% $1.34 $1.47 65.88%
Salesforce Inc 23.88 2.58 4.29 3.26% $3.27 $8.69 12.09%
Intuit Inc 26.34 5.88 5.67 3.61% $1.14 $3.61 17.36%
Synopsys Inc 70.75 2.89 10.03 0.22% $0.69 $1.77 65.52%
Cadence Design Systems Inc 78.45 16.06 16.43 7.27% $0.59 $1.25 6.2%
Autodesk Inc 46.90 17 7.32 10.64% $0.58 $1.79 19.4%
Datadog Inc 418.52 12.30 13.76 1.3% $0.08 $0.77 29.21%
Roper Technologies Inc 25.34 1.85 4.93 2.15% $0.86 $1.43 9.67%
Workday Inc 49.40 4.21 3.59 1.74% $0.39 $1.92 14.52%
Zoom Communications Inc 14.65 2.72 5.72 7.06% $0.28 $0.95 5.31%
PTC Inc 20.73 4.36 5.93 4.34% $0.25 $0.57 21.36%
Trimble Inc 39.49 2.76 4.68 2.69% $0.25 $0.7 -1.38%
IREN Ltd 33.83 6.44 19.19 -5.77% $-0.23 $0.11 59.02%
Tyler Technologies Inc 48.05 3.97 6.50 1.79% $0.12 $0.26 6.29%
Guidewire Software Inc 64.71 8.01 9.31 3.95% $0.08 $0.23 24.05%
HubSpot Inc 267.30 5.87 3.91 2.78% $0.1 $0.71 20.42%
Average 88.75 13.04 13.85 6.87% $0.61 $1.61 26.17%

Full story available on Benzinga.com

This post was originally published here

In today’s rapidly changing and highly competitive business world, it is imperative for investors and industry observers to carefully assess companies before making investment choices. In this article, we will undertake a comprehensive industry comparison, evaluating Analog Devices (NASDAQ:ADI) vis-à-vis its key competitors in the Semiconductors & Semiconductor Equipment industry. Through a detailed analysis of important financial indicators, market standing, and growth potential, our goal is to provide valuable insights and highlight company’s performance in the industry.

Analog Devices Background

Analog Devices is a leading analog, mixed-signal, and digital-signal processing chipmaker. The firm has a significant market share lead in converter chips, which are used to translate analog signals to digital and vice versa. The company serves tens of thousands of customers; more than half of its chip sales are to industrial and automotive end markets. ADI’s chips are also incorporated into wireless infrastructure equipment.

Company P/E P/B P/S ROE EBITDA (in billions) Gross Profit (in billions) Revenue Growth
Analog Devices Inc 69.66 5.51 16.04 2.46% $1.52 $2.04 30.42%
NVIDIA Corp 41.24 31.22 22.94 31.11% $51.28 $51.09 73.21%
Broadcom Inc 77.90 23.69 28.48 9.12% $11.15 $13.16 29.47%
Micron Technology Inc 21.16 6.98 8.75 21.0% $18.48 $17.75 196.29%
Advanced Micro Devices Inc 105.34 7.12 12.99 2.44% $2.86 $5.58 34.11%
Texas Instruments Inc 42.88 13.08 12.07 7.03% $2.07 $2.47 10.38%
Qualcomm Inc 27.73 6.36 3.35 13.57% $4.11 $6.68 5.0%
Marvell Technology Inc 48.16 9.04 15.69 2.79% $0.75 $1.15 22.08%
Monolithic Power Systems Inc 115.93 20.74 25.81 4.95% $0.21 $0.41 20.83%
NXP Semiconductors NV 27.84 5.56 4.59 4.53% $0.98 $1.81 7.2%
ON Semiconductor Corp 295.03 4.39 5.88 2.33% $0.45 $0.55 -11.17%
GLOBALFOUNDRIES Inc 36.96 2.70 4.83 1.68% $0.73 $0.51 0.0%
Credo Technology Group Holding Ltd 95.90 17.41 30.35 10.03% $0.16 $0.28 201.49%
Astera Labs Inc 144.10 21.94 37.03 3.41% $0.07 $0.2 91.77%
Tower Semiconductor Ltd 115.72 8.68 16.28 2.78% $0.2 $0.12 13.69%
MACOM Technology Solutions Holdings Inc 127.19 15.58 20.64 3.64% $0.07 $0.15 24.52%
First Solar Inc 13.55 2.17 3.97 5.62% $0.7 $0.67 11.15%
Lattice Semiconductor Corp 5941.50 22.78 31.39 -1.08% $0.01 $0.1 24.16%
Average 428.13 12.91 16.77 7.35% $5.55 $6.04 44.36%

Full story available on Benzinga.com

This post was originally published here

President Donald Trump has invoked the Defense Production Act (DPA) to channel federal funds towards a variety of energy projects.

Trump signed five presidential determinations under the law on Monday, focusing on domestic coal power, liquefied natural gas (LNG), domestic petroleum, and power-grid infrastructure. He stated that deficiencies in these sectors pose a threat to national defense.

This action empowers the Energy Department to use funding secured in 2025 from Trump’s key tax-and-spending package. The department can now employ energy purchases, financial support, and other means to overcome delays, financing deficits, regulatory obstacles, and market barriers.

The President’s signature authorizes federal funding for purchases across these categories, potentially benefiting coal plants, refineries, and manufacturers of gas turbines and transformers.

Trump underscored the importance of coal-powered generation for stable electricity to support defense installations, industrial expansion, and emerging technologies like artificial intelligence. He also highlighted the critical role of LNG capacity in ensuring energy security for allies and the importance of U.S. refining capacity to fuel the nation’s armed forces.

data-variant=”banner”
data-news-mode=”manual”

This post was originally published here

The gaming industry is buzzing with GameStop Corp.’s (NYSE:GME) limited-time deal, allowing customers to trade in their gaming consoles for money.

“Trade your Xbox or PlayStation 5 for $420.69 in cash,” the company said in a post on X. The offer is valid for three days from April 20 to April 23.

The offer coincides with the unofficial cannabis day 420. The retailer framed the offer with humor, suggesting customers in need of “weed money” could swap their consoles for instant cash. While the campaign’s tone is playful, it underscores GameStop’s continued reliance on trade-in programs as a core part of its business model.

GME On Sweet Investors Spot

The gaming retailer has been in the spotlight this year, driven by CEO Ryan Cohen‘s ambitious plan to make GME a $100 billion-plus company and Michael Burry‘s fresh …

Full story available on Benzinga.com

This post was originally published here

Shares of Amazon.com Inc (NASDAQ:AMZN) rose sharply in pre-market trading after the company announced an expanded strategic collaboration with Anthropic.

Amazon announced that Anthropic is committed to spending more than $100 billion on Amazon Web Services technology over the next 10 years to secure five gigawatts (GW) of capacity to train and power the company’s advanced AI models.

Amazon shares jumped 2.8% to $255.26 in pre-market trading.

Here are some other stocks moving in pre-market trading.

Gainers

  • Baiya International Group Inc (NASDAQ:BIYA) gained 58.6% to $1.38 in pre-market trading after falling more than 10% on Monday.
  • Fitness Champs Holdings Ltd (NASDAQ:FCHL) gained 43.3% to $0.32 in pre-market trading. Univest Securities, LLC announced closing of $5.0 million public offering for its client Fitness Champs Holdings.
  • Local Bounti Corp (NYSE:LOCL) rose 40.4% to $2.64 in pre-market trading after gaining 22% on Monday.
  • Aspire Biopharma Holdings Inc (NASDAQ:ASBP) jumped 41.7% to $0.37 in pre-market trading.
  • Scisparc Ltd (NASDAQ:SPRC) rose 32.4% to $5.60 in pre-market trading after dipping …

Full story available on Benzinga.com

This post was originally published here

Tesla Inc. (NASDAQ:TSLA) is all set to report its first-quarter 2026 earnings on Wednesday after market close. Here’s a look at the major events surrounding Tesla this past quarter.

Old Models Out, Q1 Deliveries

Tesla CEO Elon Musk had shared during the fourth quarter of 2025’s earnings call that the company was going to sunset its premium Model S and Model X vehicles in a pivot towards autonomous driving and robotics. Musk had also said that Tesla’s Fremont, California, facility would be focusing on producing the Optimus Robots, targeting a million units annually in the future.

The EV giant also recently released its Q1 2026 delivery figures, which missed market expectations as Tesla delivered over 358,000 vehicles worldwide, producing 408,000 vehicles. The gap between the vehicles produced and vehicles sold illustrated that 50,000 Tesla vehicles sit unsold in the company’s lots.

New Model Buzz

Social media posts by Musk also pointed towards Tesla possibly …

Full story available on Benzinga.com

This post was originally published here

Apple Inc. (NASDAQ:AAPL) announced the appointment of Johny Srouji as the new chief hardware officer on Monday, effective immediately. Srouji steps into the role previously held by John Ternus.

Srouji, who has been with Apple since 2008, previously served as the senior vice president of hardware technologies. He was instrumental in launching Apple’s in-house chip strategy, beginning with the A4, and has played a key role in advancing multiple technologies across Apple’s products.

CEO Tim Cook praised Srouji as exceptionally talented, highlighting his impact within Apple and across the tech industry.

data-variant=”banner”
data-news-mode=”manual”

>


Read Also:

Apple ‘Relatively Insulated’ From AI Volatility, Analyst Says

This post was originally published here

President Donald Trump has contradicted Energy Secretary Chris Wright‘s prediction on gas prices amid the ongoing Iran war.

During a phone interview with The Hill on Monday, Trump expressed his disagreement with Wright’s forecast that gas prices may not drop below $3 per gallon until next year.

“No, I think he’s wrong on that. Totally wrong,” Trump stated.

When asked about his expectation for a drop in gas prices, Trump responded, “as soon as this ends,” referring to the ongoing war with Iran. The U.S. currently maintains a blockade on all Iranian ports.

On the same day, Reuters reported that Pakistan’s army chief Asim Munir suggested to Trump that the U.S. blockade on Iranian ports poses a challenge to negotiations. Trump, however, refuted this claim in his conversation with The Hill, stating that Munir “didn’t recommend anything on the blockade.”

Trump further emphasized the strength of the blockade, saying, “The blockade is very powerful, very strong. They lose $500 million a day with the blockade up,” referring to Iran. “We control …

Full story available on Benzinga.com

This post was originally published here

Texas-based environmental rights group The South Texas Environmental Justice Network said on Monday that it will hold protests outside SpaceX’s HQ in Starbase as investors visit the facility ahead of the company’s IPO.

Pressuring Pension Funds To Avoid IPO

The group’s co-founder, Bekah Hinojosa, is urging investors to boycott the IPO amid concerns about the company’s environmental impact, while also lobbying the New York City Comptroller’s office to avoid the IPO for the city’s pension fund, Reuters reported on Monday.

Hinjosa, a resident of Brownsville, which is a town near Starbase, shared that she feels like the town is “being bombed by Elon Musk.”

The report said that a failed launch at the HQ in 2023 had sent a cloud of concrete over a nearby town, as well as started a fire spanning 3.5 acres …

Full story available on Benzinga.com

This post was originally published here

A leading cryptocurrency analyst spotlighted a sharp jump in Dogecoin (CRYPTO: DOGE) transaction volume over the past week.

Transaction Spike Preceded DOGE’s Rally

In an X post, Ali Martinez, citing supportive data from on-chain analytics firm Santiment, stated that nearly $800 million worth of DOGE was transacted on a single day on April 16.

The dramatic spike in on-chain volume preceded DOGE’s price hitting a one-month high of $0.10, though the memecoin has since pulled back sharply.

Full story available on Benzinga.com

This post was originally published here

Northrop Grumman Corporation (NYSE:NOC) will release earnings for its first quarter before the opening bell on Tuesday, April 21.

Analysts expect the Falls Church, Virginia-based company to report quarterly earnings of $6.06 per share. That’s up from $3.32 per share in the year-ago period. The consensus estimate for Northrop Grumman’s quarterly revenue is $9.76 billion (it reported $9.47 billion last year), according to Benzinga Pro.

On March 30, Northrop Grumman said it has received U.S. Navy’s contract modification to deliver up to nine additional surface electronic warfare improvement program Block 3 systems.

Shares of Northrop Grumman fell 1.2% to close at $656.98 on Monday.

Benzinga readers can access the latest analyst ratings on the Analyst Stock Ratings page. Readers can sort by stock ticker, company name, analyst firm, rating change or other variables.

Let’s have a …

Full story available on Benzinga.com

This post was originally published here

The CNN Money Fear and Greed index showed further improvement in the overall market sentiment, while the index remained in the “Greed” zone on Monday.

U.S. stocks settled mostly lower on Monday, with the Nasdaq Composite snapping a 13-session win streak during the session amid renewed U.S.-Iran tensions.

The U.S. Navy seized the Iranian cargo ship TOUSKA in the Gulf of Oman over the weekend, and President Donald Trump signalled that it’s “highly unlikely” he’ll extend the ceasefire with Iran, which ends tomorrow.

However, stocks recorded sharp gains last week, with the blue-chip Dow adding 3.2% and the S&P 500 surging 4.5%.

In earnings, shares of Cleveland-Cliffs Inc. (NYSE:CLF) fell more than 2% on Monday after …

Full story available on Benzinga.com

This post was originally published here

Beyond Meat, Inc. (NASDAQ:BYND) shares are moving sharply in after-hours trading following Monday’s session, after closing the regular session up about 41%.

BYND gained about 17.24% in after-hours trading, rising $0.20 to $1.36.

Why It’s Trending

The move comes as investors react to a newly disclosed SEC Form 144 filing showing planned insider selling activity.

The filing indicates that company officer Teri L. Witteman intends to sell approximately 29,978 shares.

Insider Selling Details

According to the filing, the shares stem from vested restricted stock units acquired over time and are set to be sold through Merrill Lynch.

The transaction …

Full story available on Benzinga.com

This post was originally published here

With U.S. stock futures trading higher this morning on Tuesday, some of the stocks that may grab investor focus today are as follows:

  • Wall Street expects UnitedHealth Group Inc. (NYSE:UNH) to report quarterly earnings at $6.58 per share on revenue of $109.58 billion before the opening bell, according to data from Benzinga Pro. UnitedHealth shares rose 0.5% to $325.03 in after-hours trading.
  • Alaska Air Group Inc. (NYSE:ALK) reported downbeat results for the first quarter. The company posted quarterly losses of $1.68 per share, which missed the analyst consensus estimate of losses of $1.34 per share. The company …

Full story available on Benzinga.com

This post was originally published here

Investor Cathie Wood-led ARK Invest on Monday backed the $1.75 trillion valuation for commercial space flight company SpaceX as it gears up for its upcoming IPO.

$1.75 Trillion Valuation Is Plausible

The firm shared that its research pointed towards the valuation being warranted. “$1.75 trillion IPO target is grounded in a plausible trajectory for each of SpaceX’s core business segments,” including Starlink, the xAI merger, as well as the company’s launches, which are backed by a “durable” trajectory and “structural advantages,” ARK said.

Further illustrating bullish sentiments, ARK hailed the SpaceX-xAI merger. “The xAI merger has added a strategic dimension to the platform that no comparable public company has even attempted to replicate,” it said in the statement, also backing …

Full story available on Benzinga.com

This post was originally published here

Iran on Monday said that it will not negotiate under the “shadow of threats” and that “Iranians do not submit to force.” This was followed by Trump threatening Iran with “lots of bombs.”

The Strait of Hormuz continues to be affected, with shipping being restricted. Amid this, the prediction market is betting on when Iran will agree to unrestricted shipping through the Strait. Traffic through the strait has slowed significantly since the war began.  

Here’s What Prediction Market Is Saying

Polymarket, a Polygon (CRYPTO: POL) based prediction platform that allows users to wager on an outcome using the USDC (CRYPTO: USDC) stablecoin …

Full story available on Benzinga.com

This post was originally published here

Ripple (CRYPTO: XRP) CEO Brad Garlinghouse praised SEC Chair Paul Atkins‘ leadership on Monday, contrasting it with the agency’s earlier approach under Gary Gensler.

Garlinghouse Slams Gensler-Led SEC

In an X post, Garlinghouse said that the regulator under Gensler had “declared war on a technology” and had lost its way.

“It was an unlawful power grab…and the courts said as much,” Garlinghouse stated, apparently referencing the SEC v. DEBT Box case, where a federal judge found the regulator had committed a “gross abuse of power.” 

Atkins A ‘Breath Of Fresh …

Full story available on Benzinga.com

This post was originally published here

Anthony Pompliano, on Tuesday, ignited debate over stocks versus real estate, suggesting equities have delivered strong returns over the past half-century.

Stocks Outpace Real Estate

In a post on X, Pompliano stated that “It has been much better to own stocks than real estate over the last 50 years,” citing data shared by Barchart.

Stocks Versus Real Estate

While real estate tends to preserve value and generally rises with inflation, offering modest returns, the stock …

Full story available on Benzinga.com

This post was originally published here

Investor Ross Gerber of Gerber Kawasaki on Monday reiterated his demand that Elon Musk-led Tesla Inc. (NASDAQ:TSLA) issue refunds for customers who have opted for the Full Self-Driving (FSD) package, slamming the system’s lack of progress.

Make Customers Whole, Says Ross Gerber

In a post on X, Gerber sounded out his calls for refunds from Tesla. “A promise is a promise,” Gerber said in his post, then sharing that several customers “paid several times on several Tesla vehicles for FSD that has never worked as promised.” He then urged Tesla to “make people whole.”

$10,000 Refunds, Robotaxi Expansion

Gerber had earlier weighed in on Tesla’s FSD v14.3 update, sharing that the company owed its customers the money …

Full story available on Benzinga.com

This post was originally published here

Hedge funds are sharply increasing bearish bets against the U.S. dollar, reflecting a growing shift in global currency markets as demand for traditional safe-haven assets fades and investors rotate into risk-sensitive positions.

Latest data from the Commodity Futures Trading Commission (CFTC) shows speculative traders significantly expanded net short positions on the dollar in recent weeks, marking one of the most pronounced bearish turns since late 2023. The shift highlights a broader repositioning among institutional investors as macro conditions evolve.

“We’re seeing a clear move away from defensive dollar exposure,” said Win Thin, Global Head of Currency Strategy at Brown Brothers Harriman, noting that improving global sentiment is reducing the need for dollar hedging. “As volatility declines and growth expectations stabilize, capital is rotating into higher-yielding currencies.”

The U.S. Dollar Index (DXY), which measures the greenback against a basket of major currencies, has come under renewed pressure as the euro, pound, and several emerging market currencies strengthen. Analysts point to shifting rate expectations and global capital flows as key drivers behind the move.

A major catalyst is the evolving outlook for Federal Reserve policy. Federal Reserve Chair Jerome Powell has emphasized a data-dependent approach, with markets increasingly pricing in that the Fed may be near the end of its tightening cycle. That shift is narrowing the interest rate advantage that previously supported the dollar.

“The dollar’s strength over the past two years was largely driven by rate differentials,” said Jane Foley, Head of FX Strategy at Rabobank. “If the Fed pauses while other central banks remain relatively firm, that support begins to erode.”

At the same time, easing geopolitical tensions and resilient equity markets are reducing safe-haven demand. Investors who previously sought protection in the dollar during periods of uncertainty are now reallocating toward equities, commodities, and higher-yielding currencies.

Still, some strategists warn the trade may be getting crowded. “The market is leaning heavily short on the dollar,” said Mark McCormick, Global Head of FX and EM Strategy at TD Securities. “Any shift in Fed messaging or resurgence in volatility could trigger a sharp reversal.”

For corporate America, a weaker dollar presents mixed implications. Multinational firms could benefit from improved overseas earnings translation, while import-heavy businesses may face rising costs. Currency swings also add complexity to global investment and trade decisions.

Looking ahead, the durability of the dollar’s decline will hinge on Federal Reserve policy, global growth trends, and geopolitical stability. For now, hedge funds are signaling a clear directional view: the dollar’s safe-haven dominance is softening as investors reposition for a more risk-on global environment.

JBizNews Desk

On Monday, Cathie Wood-led Ark Invest made significant trades involving Amazon.com Inc. (NASDAQ:AMZN) and DoorDash Inc. (NASDAQ:DASH).

The Amazon Trade

Ark Invest’s purchase of 3,492 shares of Amazon.com Inc. was executed through the ARK Space & Defense Innovation ETF (BATS:ARKX). This acquisition, valued at approximately $866,994, comes on the heels of Amazon’s expanded deal with Anthropic, which was announced on the same day. The agreement involves Anthropic committing over $100 billion to Amazon Web Services over the next decade, enhancing Amazon’s AI infrastructure with Trainium3 capacity. Additionally, Amazon has increased its investment in Anthropic by $5 billion, with potential for an additional $20 billion based on commercial milestones. This …

Full story available on Benzinga.com

This post was originally published here

Leading cryptocurrencies rose on Monday, while stocks ended lower amid mixed signals from President Donald Trump on the Iran conflict.

Cryptocurrency 24-Hour Gains +/- Price (Recorded at 9:26 p.m. EDT)
Bitcoin (CRYPTO: BTC) +2.35% $76,056.53
Ethereum (CRYPTO: ETH)
               
+1.76% $2,321.05
XRP (CRYPTO: XRP)                          +1.72% $1.43
Solana (CRYPTO: SOL)                          +1.80% $85.64
Dogecoin (CRYPTO: DOGE)              +1.89% $0.09561

Crypto Market Rebounds

Bitcoin spiked to an intraday high of $76,575, bolstered by a 20% jump in 24-hour trading volume. Ethereum reclaimed $2,300, while XRP and Dogecoin also lifted.

Shares of Strategy Inc. (NASDAQ:MSTR) and Coinbase Global Inc. (NASDAQ:COIN) closed up 2.58% and 2.57%, respectively.

Over $270 million was liquidated in the past 24 hours, predominantly in short positions, according to Coinglass data.

Open interest in Bitcoin futures rose 3.70% over the last 24 hours. However, whale and retail traders on Binance were bearish on BTC, evidenced by higher number of shorts vis-à-vis longs.

“Fear” sentiment prevailed in the market, according to the Crypto Fear & Greed Index.

Top Gainers (24 Hours) 

Cryptocurrency (Market Cap>$100 M) Gains +/- Price (Recorded at 9:26 p.m. EDT)
RaveDAO (RAVE)       +82.58%     $1.00
ORDI (ORDI)                  +18.34%     $4.90
Tradoor (TRADOOR)            +14.09%     $7.88

The global cryptocurrency market capitalization stood at $2.56 trillion, …

Full story available on Benzinga.com

This post was originally published here

The Dow Jones Industrial Average finished Monday little changed, slipping 0.01% to 49,442.56. Meanwhile, the S&P 500 and the Nasdaq declined 0.24% and 0.26% to 7,109.14 and 24,404.39, respectively.

These are the top stocks that gained the attention of retail traders and investors through the day:

Apple Inc. (NASDAQ:AAPL)

Apple’s stock closed up 1.04% at $273.05, reaching an intraday high of $274.28 and a low of $270.29. The stock’s 52-week range is between $288.61 and $189.81. In the after-hours trading, the stock fell 0.55% to $271.55.

Apple announced that CEO Tim Cook will step down in September, with John Ternus set to take over. Cook expressed gratitude for his time at Apple, emphasizing the privilege of leading the company.

Amazon.com Inc. (NASDAQ:AMZN)

Amazon shares fell 0.91% to close at $248.28, with a high of $250.18 and a low of $245.37. Its 52-week high and low are $258.60 and $165.29, respectively. In the after-hours trading, the stock rose 2.42% to $254.30.

Amazon announced a significant expansion of its deal with Anthropic, committing over $100 billion to Amazon Web Services over the next decade. CEO …

Full story available on Benzinga.com

This post was originally published here

The U.S. trade deficit widened in February as imports rebounded following an earlier pullback, even as exports climbed to a record high—highlighting continued volatility in global trade flows amid shifting tariff policy and uneven global demand. Data released April 2 by the U.S. Bureau of Economic Analysis (BEA) and the U.S. Census Bureau showed the goods and services trade gap increased 4.8% to $57.3 billion, up from January. “The increase in the deficit reflected an increase in imports that was larger than the increase in exports,” the BEA said in its official release, underscoring the imbalance despite strong outbound trade.

The February figure came in below economists’ expectations of roughly $59.2 billion, based on consensus forecasts compiled by major financial outlets including Bloomberg and Reuters. Exports rose to an all-time high, driven by gains in both goods and services, while imports advanced as businesses and consumers increased purchases from abroad after prior weakness. “Exports of goods and services increased… reflecting growth across multiple categories,” the BEA reported, pointing to sustained global demand for U.S. output even as imports regained momentum.

Despite the monthly widening, the broader trend still shows a sharp improvement compared with last year. In the first two months of 2026, the U.S. goods and services deficit narrowed by roughly 55% year-over-year, a decline of $136.1 billion, according to BEA data. Over that period, exports rose more than 11%, while imports fell more than 9%, suggesting stronger foreign demand and a moderation in inbound trade compared with early 2025. The BEA noted that “year-to-date, the goods and services deficit decreased significantly,” reflecting this shift.

Trade data remains a critical input for investors and policymakers because of its direct impact on economic growth. “Net exports are a key component of GDP, with a widening deficit acting as a drag,” the Federal Reserve Bank of St. Louis explained in its economic analysis framework, highlighting how trade flows influence broader economic performance. February’s rebound in imports suggests domestic demand remains resilient, even as policymakers monitor whether that strength could sustain pressure on inflation and supply chains.

The report comes amid ongoing shifts in U.S. trade policy under President Donald Trump, whose administration has reintroduced tariffs as a central economic lever. Following a Supreme Court ruling earlier this year that struck down prior tariff structures, the administration moved to implement a temporary 10% universal tariff, according to statements from the Office of the U.S. Trade Representative (USTR). “Trade policy remains a key tool to rebalance global commerce in favor of American industry,” a USTR spokesperson said, reflecting the administration’s evolving approach.

While official trade data does not assign direct causation, economists say tariff changes can significantly distort short-term trade patterns. Diane Swonk, Chief Economist at KPMG, noted in a recent analysis that “companies often front-load or delay imports around tariff changes, creating volatility in monthly trade data that doesn’t always reflect underlying demand.” This dynamic helps explain sharp swings in imports and exports during periods of policy transition.

At the same time, February’s data reinforced the resilience of U.S. exports despite a challenging global backdrop. “U.S. exporters continue to find demand abroad even as global growth slows,” said Gregory Daco, Chief Economist at EY, in a note following the release, pointing to strength in sectors such as industrial goods, energy, and services. The BEA data showed gains across multiple export categories, supporting the view that U.S. competitiveness remains intact in key markets.

For financial markets, the report delivered a mixed signal. Strong exports and a sharply reduced year-to-date deficit could support first-quarter GDP growth, while the February widening and import rebound suggest domestic demand has not cooled uniformly. Federal Reserve Chair Jerome Powell has previously emphasized that “economic data must be viewed in totality,” noting during recent remarks that mixed signals across sectors complicate the central bank’s policy outlook as it assesses inflation and growth risks.

Looking ahead, the next several months will be critical in determining whether February’s increase marks a temporary normalization or the beginning of a renewed rise in imports. Economists say upcoming data will also reveal how the administration’s tariff policies influence corporate sourcing decisions and global supply chains. With trade policy back in flux, monthly releases from the BEA and Census Bureau are taking on outsized importance as a real-time indicator of how businesses and global markets are adapting to rapidly changing rules.

— JBizNews Desk

On Monday, Zions Bancorp (NASDAQ:ZION) discussed first-quarter financial results during its earnings call. The full transcript is provided below.

Benzinga APIs provide real-time access to earnings call transcripts and financial data. Visit https://www.benzinga.com/apis/ to learn more.

The full earnings call is available at https://event.choruscall.com/mediaframe/webcast.html?webcastid=rnSlyYeP

Summary

Zions Bancorp reported a 37% year-over-year increase in net earnings to $232 million, or $1.56 per diluted share, driven by revenue growth and lower credit loss provisions.

The company announced a strategic acquisition agreement with Basis Investment Group to enhance its Fannie and Freddie lending programs, expected to bolster its capital markets franchise.

Zions Bancorp’s net interest margin stood at 3.27%, down slightly from the previous quarter, with future guidance indicating moderate increases in net interest income if rates remain stable.

Management highlighted ongoing investments in consumer and small business banking, with new product launches like the Gold Account and Business Beyond aimed at increasing deposit growth.

The company’s capital position remains strong, with a CET1 ratio of 11.5%, and potential benefits from the Basel III endgame proposal could provide additional capital relief.

Zions Bancorp is seeing increased loan activity, particularly in commercial and industrial sectors, and expects moderate loan growth despite some pricing pressures in commercial real estate lending.

The company is experiencing broad-based growth in fee income, especially in capital markets, and maintains a positive outlook for fee income and operating leverage for the full year 2026.

Full Transcript

OPERATOR

Greetings and welcome to Zions Bancorp’s First Quarter Earnings Conference call. At this time, all participants are in a listen only mode. A question and answer session will follow the formal presentation. If anyone should require operator assistance during the conference, please press Star 0 on your telephone keypad. Please note that this conference is being recorded. It is now my pleasure to turn the conference over to Andrea Christofferson. Thank you. You may begin.

Andrea Christofferson (Director of Investor Relations)

Thank you, Julian and good evening everyone. Welcome to our conference call to Discuss Zions Bancorp’s first quarter 2026 results. My name is Andrea Christofferson, Director of Investor Relations. Before we begin, I would like to remind you that during this call we will make forward looking statements. Actual results may differ materially. We encourage you to review the forward looking statements and non GAAP disclosures in our press release and on slide 2 of today’s presentation, which apply equally to statements made during this call. A copy of the earnings release and presentation are available@sciencebank corporation.com for our agenda today, Chairman and Chief Executive Officer Harris Simmons will provide opening remarks. Following Harris’s comments, Chief Financial Officer Ryan Richards will review our financial results and outlook. Also with us today are Scott McClain, President and Chief Operating Officer Derek Stewart, Chief Credit Officer and Chris Kyriakakis, Chief Risk Officer. After our prepared remarks, we will hold a question and answer session. This call is scheduled for one hour. I will now turn the time over to Harris.

Harris Simmons (Chairman and Chief Executive Officer)

Thanks very much Andrea and good evening everyone. We’re reasonably pleased with our performance and financial results for the first quarter which reflect meaningful year over year improvement and continued progress against our long term strategic priorities. Our Capital Markets division continues to be an important driver of fee income growth. Since launching the business in 2020, we’ve invested heavily in talent, technology and product capabilities, expanding our presence across investment banking, sales and trading and real estate capital markets. In late March, we announced an agreement with Basis Investment Group to acquire their Fannie and Freddie lending programs, related mortgage servicing rights, and an experienced team supporting those platforms subject to regulatory and customary closing approvals. We expect this transaction will meaningfully enhance our ability to serve commercial real estate clients across the Western United States and beyond and to further strengthen our capital markets franchise, we continue to invest in our consumer and small business franchises. Following the launch of our new Gold Account consumer Deposit product in the second half of 2025, we recently introduced its companion offering for small business customers branded as Beyond Business Account. We began piloting the product in Colorado and Arizona late in the quarter and it’s expected to roll out more broadly across our affiliate banks later this quarter. This tiered checking solution is designed to support clients as they grow from basic banking needs to more complex cash flow and money movement capabilities. Our focus on small business is also reflected in continued momentum in SBA lending, where we now rank 11th nationally in SBA 7 loan approvals during the first half of the SBA’s fiscal year Shifting now to the financial results for the quarter, Slide 3 presents certain first quarter results versus the prior quarter and prior year. First quarter results reflected typical seasonal expense patterns, while revenue and profitability improved meaningfully relative to the prior year period. Net earnings were $232 million, or $1.56 per diluted share, up 37% from a year ago, driven by revenue growth, a lower provision for credit losses and a lower effective tax rate compared to the fourth quarter of 2025. Earnings declined 11%, primarily reflecting lower revenue, including the impact of two fewer days in the period and significantly lower securities gains as well as seasonal compensation expenses. The net interest margin was 3.27%, down 4 basis points from the prior quarter, reflecting lower earning asset yields and a decline in average demand deposits partially offset by improved funding costs. Average loans grew 2.4% on an annualized basis, led by commercial lending, while average customer deposits showed a modest seasonal decline period. End Customer deposits grew $1.3 billion, or 1.8% from year end. Credit losses were very modest at three basis points annualized of average loans on slide four, diluted earnings per share were $1.56, down from $1.76% in the prior quarter and up from $1.13% a year ago. As a reminder, the year ago quarter included an 11 cent per share headwind related to the revaluation of deferred tax assets due to newly enacted state tax legislation. There were no notable items in the first quarter with an impact greater than $0.05 per share. As shown on Slide 5, adjusted pre provision net revenue was $301 million declined 9% from the prior quarter, reflecting some of the items noted earlier, including a slightly lower day count. Adjusted taxable equivalent net interest income pre Provision net revenue increased 13% versus the year ago quarter on improved revenue and positive operating leverage. With that overview, I’ll turn the call over to our Chief Financial Officer Ryan Richards to walk through the quarter in more detail and to walk through our outlook.

Ryan Richards (Chief Financial Officer)

Ryan thank you Harris and good evening everyone. Beginning on slide 6, you can see the 5 quarter trend for net interest income and net interest margin. Taxable equivalent net interest income was 662 million, down 21 million or 3% from the prior quarter and up 38 million or 6% from the year ago quarter. Earning asset yields fell faster than funding costs during the quarter, most notably in January and loan repricing reflected the impact of the December rate cuts. Current deposit costs also moved lower but with a lag over the quarter. Net interest margin was 3.27%, down 4 basis points linked quarter and up 17 basis points year over year. Slide 7, provides additional detail on the drivers of net interest margin. The linked quarter walks reflect the lower asset yields mentioned previously as well as a lower contribution from average demand deposit balances. These factors were partially offset by improved deposit costs year over year. The improvement in margin primarily reflects deposit and borrowing repricing and our continued focus on optimizing the balance sheet. For the first quarter of 2027, our outlook for net interest income is moderately increasing. Given the uncertain path of benchmark rates. The forward curve as of March 31st assumed no rate changes over the next 12 months. If that plays out, we estimate net interest income growth of about 7 to 8% which would exceed our guide. Moving to non interest income on slide 8, customer related non interest income was 172 million compared to 177 million in the prior quarter and 158 million a year ago. Excluding net credit valuation adjustment, adjusted customer related non interest income was 174 million compared with 175 million in the prior quarter and up 16 million or 10% from the year ago quarter. We are particularly pleased with the broad based growth achieved during the quarter relative to the last year which reflects higher residential mortgage loan sales activity and growth in retail and business banking, commercial account and wealth management fees. We continue to see attractive opportunities in capital markets and have strong pipelines going into the second quarter. For the first quarter of 2027, our outlook for adjusted customer related fee income is moderately increasing versus the first quarter 2026 results of 174 million. With broad based growth and capital markets continue to contribute in an outsized way, we currently expect results towards the top end of that range. Turning to Slide 9,, adjusted on interest expense was 558 million. Expenses increased versus the prior quarter driven primarily by seasonal compensation and were higher year over year reflecting increased marketing technology costs, professional and outsourced services and higher incentive compensation. We will continue to manage expenses prudently while investing to Support growth. Our first quarter 2027 outlook for adjusted non interest expense is moderately increasing versus the first quarter of 2026 based on first quarter performance and full year expectations. We continue to Expect positive operating leverage for a full year 2026 in the range of 100 to 150 basis points. Slide 10, presents trends in average loans and deposits. Average loans grew 2.4% annualized during the quarter primarily within the commercial and industrial portfolio and increased 2.5% year over year. Loan yields declined sequentially as benchmark rate cuts in the latter part of 2025 were reflected in variable rate repricing. Average deposits were modestly lower than the prior quarter by 540 million. Approximately 1/2 of the decline was due to average broker deposits while the remainder can be attributed to seasonal runoff across business operating accounts early in the quarter. Importantly, period end customer deposits increased by 1.3 billion or 1.8% from year end. The cost of total deposits declined sequentially, benefiting from both repricing and a more favorable mix within interest bearing deposits. Slide 11, presents the five quarter trend of our average and ending funding sources. Our Total funding costs declined 8 basis points linked quarter to 1.68% largely as a result of the aforementioned deposit repricing. Period. End customer deposits grew 1.3 billion and short term borrowings declined significantly as we continue to replace higher cost wholesale funding with customer positive growth and securities cash flows while also remixing into senior debt. Turning to Slide 12,, the investment securities portfolio continues to serve as an important source of on balance sheet liquidity and a tool to balance interest rate risk through deep access to the repo markets. During the quarter, principal and prepayment related cash flows from investment securities of 493 million were partially offset by reinvestment of 299 million. The continued paydown of lower yielding mortgage backed securities supports earning asset remix or reduction in wholesale funds. The estimated price sensitivity of the portfolio inclusive of hedging activity was 3.7 years. Credit quality remains strong as shown in slide 13. Net charge offs were 3 basis points annualized of average loans and the non performing assets ratio declined to 48 basis points. Classified and criticized balances also declined during the quarter. The allowance for credit losses ended the quarter at 1.16% and remains well positioned relative to our risk profile with a 239% coverage of non accrual loans. Slide 14, provides an overview of our $13.7 billion commercial real estate portfolio which represents approximately 22% of total loans. The portfolio remains granular and well diversified by property type and geography with conservative loan to value characteristics. Credit metrics remain favorable including low levels of non accruals and delinquencies. Our capital position remains strong as shown on slide 15. The Common Equity Tier 1 ratio was 11.5% flat during the quarter as earnings growth was somewhat offset by the 77 million in common shares, repurchase and dividends paid. In addition to the growth in risk weighted assets, we continue to expect net capital generation through earnings and continued improvement in AOCI. Tangible book value per share increased 19% versus the prior year reflecting earnings generation and continued balance sheet normalization. Slide 16, summarizes the outlook we discussed across loans, net interest income, fee income and expenses. This outlook reflects our best estimate based on current information and is subject to the risks and uncertainties discussed in our forward looking statements.

Andrea Christofferson (Director of Investor Relations)

This concludes our prepared remarks as we move to the question and answer section of the call. We request that you limit your questions to one primary and one follow up question to enable other participants to ask their questions. Julian, please open the line for questions.

OPERATOR

Thank you. And once again, if you would like to ask a question, please press Star one on your telephone keypad. A confirmation tone will indicate that your line is in the question queue. You may press Star two to remove yourself from the queue. For any participants using speaker equipment, it may be necessary to pick up the handset before pressing the star keys. One moment while you pull for questions. And our first question comes from the line of John Pam Carey from Evercore isi. Please proceed with your question.

John Pam Carey (Equity Analyst)

Afternoon. On the just on the margin side I know you your loan Yield compressed about 14 basis points linked quarter. I think you had mentioned that it was largely a function of the rate cuts and variable rate repricing. I guess that linked quarter change was that all the benchmark rate change. Any other impact to loan yields in the quarter and maybe if you can give us your new-money loan yields just to give us an idea where originations are coming on the books.

Ryan Richards (Chief Financial Officer)

Hey, thanks John, really appreciate that. Yeah, so listen, I think you picked up on the main thrust of it. So we would have had some benchmark repricing and expectation of the rate cut that came in the middle of December and some that trailed thereafter and where we remained skewing a little bit more on the asset sensitive side that that was the biggest contributor in terms of the repricing characteristics. Of course we’ve got the nice materials in our appendix that I know you’re familiar with, but I think maybe the question that you’re getting at on front book versus back book for the loan portfolio is really the most meaningful part of that as we sort of think about trajectory moving forward is for those fixed rate loan portfolios, the things that have yet to reprice through. And there we’re seeing a 72 basis point spread on the front book vis-à-vis the back book.

John Pam Carey (Equity Analyst)

Okay. All right. And then I guess in terms of your positive operating leverage expectation of 100, 150 basis points, that’s for the year. And so what rate assumption does that imply? I know you mentioned if there’s no rate changes consistent with the forward curve, the next 12 month Net Interest Income (NII) outlook could come in at 7 to 8% above the range. Does that 100, 150 basis points expectation imply the forward curve? And maybe if you can give us a little bit more detail in terms of that NII expectation.

Ryan Richards (Chief Financial Officer)

Yeah, thank you for that, John. Listen, in the past we’ve brought a view of kind of latent and emergent effects. It’s less interesting this quarter since we there’s not much to talk about in the forward curve in terms of rates changes that were implied at least at the quarter end. So those are kind of right on top of each other. So we were able to firm up our guide for the full year. As you sort of think about the trajectory of that, where we normally guide on a one year four quarter basis, we believe you’ll see there’s a much more powerful positive operating leverage, probably not unlike what we’ve seen this quarter relative to last quarter where and Harris is quoting in his remarks, you will see positive operating leverage of 270 basis points. So we think that as our repricing plays through from the investment securities into loans, as we have less those headwinds associated with our terminated swaps, some of the other things play through. We do see really good prospects for one year, fourth quarter last year when we were with you, we were anticipating as part of our sensitivity and our guidance that we could have had rate cuts. I think we were anticipating in June and September. And based upon the forward curve, those are now off the table so that having no cuts is embedded into our full year positive operating leverage guidance. Got it.

John Pam Carey (Equity Analyst)

All right, thanks Ryan. Appreciate it.

OPERATOR

Thank you. And our next question comes from the line of Manon Gosalia with Morgan Stanley. Please proceed with your question.

Manon Gosalia (Equity Analyst)

Hi, good afternoon. On the deposit cost side, deposit costs, I guess they came down quarter on quarter, but they were pretty flat relative to the spot rate as of December 31st. And it looks like the spot rate as of March 31st has moved lower again. So can you just help us connect the dots on the trajectory there? Maybe give us an update on deposit pricing and competition and also what you’re expecting in terms of CD rollovers coming up, hey, thank you for that. And we’ll try to unpack that in places and invite my colleagues to jump in as well. Listen, I think I’ve seen the questions come in other calls in this earnings cycle about where deposit costs go if rates kind of stay static here for the remainder of the year. There’s still some trailing activity, some repricing down on term deposits, thinking about customer time deposits that have yet to play through. So, you know, that would definitely be an element of this. You will have heard us talking increasingly quarter over quarter and when you catch us at conferences about …

Full story available on Benzinga.com

This post was originally published here

Servisfirst Bancshares (NYSE:SFBS) released first-quarter financial results and hosted an earnings call on Monday. Read the complete transcript below.

This transcript is brought to you by Benzinga APIs. For real-time access to our entire catalog, please visit https://www.benzinga.com/apis/ for a consultation.

Access the full call at https://event.choruscall.com/mediaframe/webcast.html?webcastid=OGwVSQiN

Summary

Servisfirst Bancshares reported strong loan growth and a 33% year-over-year increase in earnings per share for Q1 2026, with net income at $83 million.

The company achieved a net interest margin expansion to 3.53% and maintained a best-in-class efficiency ratio below 30%, indicating strong operational leverage.

Strategic expansion in Texas is underway with 18 bankers onboarded and the first loan closed; expectations are high for this market to contribute significantly over the next few years.

Loan payoffs have decreased, and the company is optimistic about future loan growth, supported by a robust pipeline and new relationships across markets.

Management highlighted a solid capital position, with common equity tier 1 reaching 11.86% and a strong liquidity position, underscoring the company’s capacity for continued growth.

Full Transcript

OPERATOR

Greetings and welcome to the service. First Bancshare’s first quarter earnings conference call. At this time all participants are in listen only mode. If anyone should require operator assistance, please press Star zero on your telephone keypad. A question and answer session will follow the formal presentation and you may press Star one to be placed into question queue. It’s now my pleasure to turn the call over to Davis Mains, Director of Investor Relations. Davis, please go ahead.

Davis Mains (Director of Investor Relations)

Good afternoon and welcome to our first quarter earnings call. We’ll have Tom Broughton, our CEO, Jim Harper, our Chief Credit Officer and David Sporacio, our CFO covering some highlights from the quarter and then take your questions. I’ll now cover our forward looking statements disclosure Some of the discussion in today’s earnings call may include forward looking statements. Actual results may differ from any projections shared today due to factors described in our most recent 10-K and 10-Q filings. Forward looking statements speak only as of the date they are made and Servisfirst Bancshares assumes no duty to update them. With that, I’ll turn the call over to Tom Broughton. Thank you. Good afternoon and thank you for joining our first quarter conference call. We’re really pleased with our start to the year and I’m going to highlight a few things before I turn it over to Jim Harper to give credit update. On the loan side, we had pretty solid loan growth for the quarter. Loan growth is usually not very robust in the first quarter, but we did see some pretty good loan growth. We are seeing loan payoffs begin to diminish compared to the last two years. Certainly a great thing. You know, I don’t know what kind of trend we’ll see in the second quarter, but on a quarter to date basis we’ve seen some very nice growth in the first 20 days or so of the quarter. On the forward line pipeline, over 90 days it’s 90 plus days. It’s the strongest we’ve ever had in our history. And of course on a 90 day loan pipeline the closing rate is much lower than on a, you know, 30 day loan pipeline, for example. So. But it is great to see a long list of new relationships across all of our markets in a variety of industries on that list. On the deposit side they grew by 8% annualized in the first quarter which is exceeded our expectations. As we typically see our deposit growth in the second half of the year. We continue to try to manage our deposit cost to improve margins. We continue to attract new clients with our strong financial condition, our profitability and our personal service that we provide to commercial clients and Correspondent banks David will elaborate in a few minutes, but our net interest margin continues to improve. Our efficiency ratio continues to be the best in class as we dropped below 30% in the first quarter. We do have 161 producers at quarter end. We’ve hired over the last 12 months 32 new FTEs and 75% of those FTEs are frontline employees. So we should see, you know, obviously some improved productivity over time and profitable growth there. Our Houston team has found an office they policed it, not ready to move into yet, but they got a 26,000 square feet to build out. We do have 18 bankers on board there today and their pipelines are building quite nicely. We actually closed our first loan in Texas, which is a large supply chain company with long term contracts in March, so we’re pleased with the start there.

Jim Harper (Chief Credit Officer)

And now I’m going to turn it over to Jim Harper for a credit update. Thanks Tom. As noted, loan growth for the quarter was solid at 7% annualized, though we definitely experienced an uptick in loan activity beginning late in the quarter, which reinforces Tom’s comments about our forward pipeline. From a credit metric standpoint, net charge offs for the first quarter were around $8.3 million, most of which was associated with the remaining balance of one credit, with the charge representing the final resolution of a loan to a longtime troubled borrower. Our allowance to total loans remained static when compared to the end of 2025 (should be 2026), ending the quarter with an allowance compared to total loans of 125 basis points. Non performing assets to total assets at quarter end were 100 basis points, which was slightly higher than the 97 basis points we reported at fiscal year end 25. However, we are confident in some near term reductions in NPAs of approximately $17 million, or just over 9% of our 33126 NPAs stemming from the U.S. coast Guard’s purchase of a private university campus and the assumption of two other loans by a long term customer. As always, we continue to actively and aggressively manage our NPAs and this portfolio and David will be next with a discussion of our first quarter financial performance.

David Sporacio (Chief Financial Officer)

Thank you Jim and good afternoon everyone. I will walk you through the financial details of our first quarter and I am pleased to report a strong start to 2026 across virtually every metric we track. The headline numbers reflect continued expansion in the net interest margin, disciplined expense control, solid loan and deposit growth, and a meaningful year over year improvement in operating leverage, all of which speak to the durability of the service first model for the first quarter of 2026 we’ve reported net income of $83 million or $1.52 per diluted share or $1.54 on a normalized basis. To put that in Context, we earned $1.16 per diluted share in the first quarter of 2025, so we are up 33% year over year on earnings per share. On a linked quarter basis, EPS stepped back from the $1.58 we reported in 4Q25 and I want to briefly explain why. Fourth quarter included a $4.3 million non recurring Bolly death benefit that flowed through non interest income and fourth quarter also had more calendar days to earn net interest and fee income during the first quarter. We also had a prior period adjustment to boli income of $1 million which was a headwind. Excluding those items, the core earnings trajectory is clearly upward. Our return on average assets was 1.89% for the quarter, which is essentially in line with fourth quarter and well above the 1.45% we delivered one year ago. Return on average common equity was 17.91%. These are strong industry leading returns and they reflect the operating leverage inherent in our model when loan growth, deposit repricing and expense discipline all move together in the right direction. In net interest income for the first quarter it was $148.2 million which is up from $146.5 million in the fourth quarter and up from $123.6 million a year ago. The net interest margin expanded to 3.53%, 15 basis points better than linked quarter and 61 basis points better than the same quarter last year. That progression reflects two drivers working in tandem, continued repricing of our low fixed

Tom Broughton (Chief Executive Officer)

rate loan portfolio and a full quarterly impact of the Fed rate cuts from the fourth quarter. As we have mentioned in previous quarters, we continue to see opportunities on loan repricing for the next 12 months. We have about a $2 billion opportunity for low fixed rate loans renewing normal payment cash flows, covenant violations and modifications. In fact we have about $2.9 billion in fixed rate loans maturing in the next three years at a price below our current going on rate for loans. On the deposit side, average interest bearing deposit cost fell to 2.79% down 22 basis points from fourth quarter and 61 basis points from over a year ago. That repricing is still working through the book and and we continue to expect meaningful benefit as higher rate time deposits mature and renew at current market rates on the asset side loan yields were 6.18% an 11 basis point step down from quarter four. That reflects the normal variability in the declining rate …

Full story available on Benzinga.com

This post was originally published here

Chamath Palihapitiya told the All-In Podcast that the three major hyperscalers now control roughly 60% of all compute and have a strategic incentive to throttle OpenAI and Anthropic, a setup he called a “five-alarm fire” for the two leading frontier labs.

The Social Capital chief compared it to the collapse of Friendster, which lost the social networking race to MySpace and Facebook after it could not keep its site up.

Revenue at the frontier labs could hit a wall “not because of product quality and adoption” but because of “the Friendster effect,” he said.

Shares of Bloom Energy Corp. (NYSE:BE) have gone “absolutely straight up vertical,” Palihapitiya said, as developers rush toward on-site natural gas power that sidesteps grid queues.

Nvidia Corp. (NASDAQ:NVDA) and CoreWeave Inc. (NASDAQ:CRWV) remain the …

Full story available on Benzinga.com

This post was originally published here

As much as I enjoy the intellectual exercise of researching and writing about financial markets, I find the act of investing can be very unpleasant.

When stocks are up, I worry they’ll go down. And when they’re down, I worry they’ll go lower.

Even when I look back and see the progress my portfolio has made toward my financial goals, I struggle to recall moments where I felt totally sanguine about the money I had at risk. Sure, in hindsight, I’m grateful for how far I’ve come. But my memory of the process is of anything but a smooth ride.

As the stock market set new highs this week, I reflected on this poorly timed, lump-sum purchase I made back on Feb. 18, 2025, when the S&P 500 was at 6,129. That was a day before the market topped and then tumbled 19%. Fortunately, stocks quickly recovered those losses, and I was back to breakeven within a few months. (Read more about that here and here.)

Fast-forward to today. The S&P …

Full story available on Benzinga.com

This post was originally published here

Sen. Elizabeth Warren (D-Mass.) publicly questioned Elon Musk’s fitness to run X Money, one day before her deadline for Musk to respond to an April 14 letter flagging consumer, financial stability and national security risks.

Warren, the Senate Banking Committee ranking member, is pressing Musk on whether X Money will issue a stablecoin, whether it will surveil and monetize user transaction data, and what controls it will have to prevent scams, fraud and illicit finance.

Cross River Bank’s Rap Sheet

Warren’s letter flagged that X Money deposits appear to be held by Cross River Bank, based on screenshots posted by actor William Shatner, who received early access.

The 6% APY headline feature is offered through the same bank. Cross River is a repeat FDIC enforcement target, hit …

Full story available on Benzinga.com

This post was originally published here

Global private equity exit volume decreased by 6.25% in the first quarter (Q1). The three-month period tallied 720 transactions. That’s down from 768 in Q1 2025.

Aggregate transaction value, however, surged to $311 billion. Elon Musk‘s $250 billion deal between SpaceX and xAI, the top quarter’s top transaction, made up about 80% of the total value.

The seller group consisted of Sequoia Capital Operations LLC, Lightspeed Ventures LLC, Kingdom Holding Co., Valor Management LLC, StepStone Group Inc., Andreessen Horowitz LLC, Vy Capital, Craft Ventures LLC, CoreNest Capital and MGX Fund Management Ltd, S&P noted in its most recent Q1 report citing LSEG data.

Musk’s record-setting merger has redefined global M&A; the previous record stood for more than two decades, dating back to Vodafone’s (NASDAQ:VOD) $203 billion takeover of Germany’s Mannesmann in 2000.

The second largest exit in …

Full story available on Benzinga.com

This post was originally published here

Every 800V rack NVIDIA ships in 2027 is worth roughly 11x more ON silicon than the 54V racks shipping today. Consensus still hasn’t put that math in its model.

The semiconductor cycle is technically still in a trough. ON Semiconductor’s (NASDAQ:ON) revenue is down 15% year-over-year, fab utilization sits around 68%, and the stock just ripped 21% in a single week and sits up 167% from its April 2025 low. Either the market has lost its mind, or it’s figuring out that the “EV recovery story” label everyone has been using for ON is the wrong label.

The setup nobody was pricing

ON makes the kind of chips that sit inside things most people never think about. Power management, sensors, voltage regulation. Historically, the bull case was electric vehicles. Every EV needs enormous amounts of silicon carbide to manage battery power, and ON built one of the largest SiC franchises in the industry. The EV slowdown over the past two years was a direct hit to that thesis, and the stock spent most of 2024 and 2025 bleeding.

Here is what changed. According to a research briefing reviewed by Wolf Financial this week, CEO Hassane El-Khoury laid out a specific framework at the Morgan Stanley TMT Conference in March. Today’s AI data center racks run at roughly 120 kilowatts of power. ON’s content inside one of those racks is approximately $9,500. The next generation of AI racks, which start shipping in the back half of 2027, will operate at close to 1 megawatt using an architecture called 800-volt direct current. ON’s content inside one of those racks jumps to approximately $105,000.

That is 11 times the silicon content, per rack, across a three-generation GPU transition.

Why 800-volt is happening

This is the part where the physics actually matters. NVIDIA’s next flagship rack system, the …

Full story available on Benzinga.com

This post was originally published here

Bank of Hawaii (NYSE:BOH) released first-quarter financial results and hosted an earnings call on Monday. Read the complete transcript below.

This transcript is brought to you by Benzinga APIs. For real-time access to our entire catalog, please visit https://www.benzinga.com/apis/ for a consultation.

View the webcast at https://edge.media-server.com/mmc/p/xo3occc2/

Summary

Bank of Hawaii reported solid financial performance for Q1 2026, with net interest income and margin expanding for the eighth consecutive quarter, driven by fixed asset repricing and a decline in deposit costs.

Earnings per share were $1.39, and the company maintained strong capital and credit quality, with a focus on their leading deposit market share in Hawaii.

Strategic initiatives include expanding wealth management capabilities and supporting family-owned businesses through the new Center for Family Business and Entrepreneurs.

The company’s outlook remains cautious due to potential headwinds such as Middle East tensions and rising energy costs, but it remains optimistic about achieving a 2.9% net interest margin by year-end.

Management highlighted the stable economic environment in Hawaii, characterized by low unemployment and strong visitor spending, but noted external risks that could impact consumer confidence.

Full Transcript

OPERATOR

Good day and thank you for standing by. Welcome to the Bank of Hawaii Corporation first quarter 2026 earnings conference call. At this time, all participants are in a listen-only mode. After the speaker’s presentation, there will be a question and answer session. To ask the question during the session, you will need to press 11 on your telephone. You will then hear an automated message advising. Your hand is raised to withdraw your question. Please press star 11 again. Please be advised that today’s conference is being recorded. I would now like to hand the conference over to your speaker today. Cheng Park, Executive Vice President, Investor Relations. Please go ahead.

Cheng Park

Good morning and good afternoon. Thank you for joining us today for our first quarter 2026 earnings conference call. Joining me today is our President and CEO Jim Polk, CFO Brad Satenberg and Chief Risk Officer Brad Sherson. Before we get started, I want to remind you that today’s conference call will contain some forward looking statements.

Jim Polk

And while we believe our assumptions are reasonable, the actual results may differ materially from those projected during the call. Today, we’ll be referencing a slide presentation as well as the earnings release. Both of these are available on our website boh.com under the Investor relations link. And now I would like to turn the call over to Jim. Thanks, Chang. Good morning and good afternoon everyone. Thank you for joining us today. Before I get into the quarter, as this is my first earnings call as CEO, I want to say a few words about my predecessor, Peter.

Brad Shearson (Chief Risk Officer)

Peter Ho. Peter built something truly special here. A franchise defined by discipline, consistency and a genuine commitment to the people of our island communities. With 16 years as CEO, he left this institution much stronger in every way that matters. I’m grateful for his confidence in me and I’m honored to carry this forward. Now on to the quarter. Bank of Hawaii delivered another solid set of Results to open 2026. Net Interest Income and our net interest margin expanded for the eighth consecutive quarter. Driven by continued fixed asset repricing and a meaningful decline in total deposit costs. NIM increased 13 basis points as our fixed asset repricing engine continues to perform as expected. During the quarter, we remixed $643 million in fixed rate loans and investments from a roll off yield of approximately 4% to a roll on yield of 5.6%, continuing to lift the overall yield on earning assets. We remain on track toward our stated goal of approaching 2.9% NIM by the end of the year and we feel good about that trajectory even against an uncertain rate backdrop. Deposit trends continue to be encouraging as our average cost of total deposits declined 17 basis points, achieving a beta of 36%, normalizing for nonrecurring expenses and noninterest income. Our EPS came in at $1.39, reflecting the steady underlying earnings power of the franchise. We maintained strong capital and excellent credit quality while continuing to build on our leading deposit market share position here in Hawaii. The strategic formula has not changed. Bank of Hawaii operates in one of the most distinctive banking markets in the country, concentrated and relationship driven where four locally headquartered banks hold more than 90% of FDIC recorded deposits. In that environment, brand and trust are our structural advantages. They allow us to price deposits attractively, manage funding costs actively, and generate superior risk adjusted returns across cycles. Turning to our home market, Hawaii’s economy entered 2026 on solid footing near record low unemployment, strong visitor spending and an active construction pipeline anchored by significant military and public infrastructure investment. That said, we are watching the environment carefully. Tensions in the Middle east, rising energy costs and the potential for sustained inflation are headwinds that could affect consumer confidence and travel demand as the year progresses. Our credit portfolio continues to reflect the underwriting discipline this bank has maintained through many cycles. I want to briefly address the recent Konalo storm in Hawaii and Typhoon Srinlaku in the West Pacific. First and foremost, bank of Hawaii remains focused on supporting our employees, customers and communities impacted by these events. We are in the early stages of assessing the potential impact of Typhoon Sinlaku and it will take several weeks to gain clearer insight. Brad Shearson will cover the potential impact of the Konalo storm as well as our overall credit profile in more detail shortly. I also want to highlight the progress we are making in wealth management, an area I expect will become an increasingly important part of the franchise’s story. Through Banco Advisors and our partnership with Cetera, we continue to expand investment capabilities for our retail and private banking clients. Simultaneously, we are deepening coordination between our commercial and private banking teams around our high net worth client relationships. Importantly, we recently opened the center for Family Business and Entrepreneurs where we provide dedicated planning resources to Hawaii’s family owned businesses, encompassing financial and estate planning, succession planning, business valuation and MA advisory capabilities. For many of these families whose wealth is largely concentrated in their company, these are among the most consequential decisions they will face. It is a capability uniquely suited to bank of Hawaii’s depth of relationships and trusted role in this market. I’ll close with this. We remain focused on the strategy, the culture and the values that have made bank of Hawaii successful. I fully intend to carry forward the intensity of execution, the continued investment in our people and technology and an unwavering commitment to the island communities that have trusted this institution for 128 years. I’m proud to be in this role and I look forward to the work ahead. With that, I’ll turn the call over to Brad Shearson to discuss credit, after which Brad Sattenberg will walk through the financials in detail. We’ll then be pleased to take your questions. Thanks, Jim. I’ll begin with an overview of our credit portfolio and conclude with asset quality metrics and as you will see, our performance remains strong, consistent with prior quarters. Turning to our lending philosophy, the bank of Hawaii is dedicated to serving our local communities, lending primarily within our core markets where our expertise allows us to make informed and disciplined credit decisions. Our portfolio is built on long tenured relationships, with approximately 60% of both our commercial and consumer clients having been with the bank for more than 10 years. Geographically, our loan book is concentrated in markets we know well. Approximately 93% of loans are based in Hawaii, with 4% in the Western Pacific and just 3% on the mainland. Primarily supporting existing clients who operate both locally and on the mainland, our loan portfolio remains well balanced between consumer and commercial exposure. Consumer loans represent 56% of total loans, or approximately $8 billion. Within the consumer portfolio, 86% consists of residential, mortgage and home equity loans with a weighted average LTV of 48% and weighted average FICO score of 798. The remaining 14% of consumer loans are comprised of auto and personal lending. Credit quality in these segments also remains strong, with average FICO scores of 729 for auto loans and 760 for personal loans. Turning to commercial lending, the portfolio totals $6.2 billion, representing 44% of total loans. 73% is secured by real estate with a weighted average LTV of 55%. This reflects our ongoing emphasis on collateral protection. CRE remains the largest component of the commercial book, totaling $4.3 billion or 31% of total loans. And in Oahu, the state’s largest CRE market, a combination of consistently low vacancy rates and flat inventory levels continues to support a stable real estate market across industrial, office, retail and multifamily property types, vacancy rates remain below or close to their 10 year averages. Total office space on Oahu has declined by approximately 10% over the past decade, driven primarily by conversions to multifamily residential and lodging. This structural reduction in supply combined with the return to office trend has brought vacancy rates closer to long term averages and well below national levels. Our CRE portfolio remains well diversified with no single property type exceeding 9% of total loans. Conservative underwriting practices continue to be applied consistently with weighted average LTVs below 60% across all CRE categories. In addition, diversification within each segment remains strong, supported by modest average loan sizes. Scheduled maturities are also well balanced, with more than 60% of CRE loans maturing in 2030 or later reducing any near term refinancing risk. Looking at the distribution of LTVs, there isn’t much tail risk in our CRE portfolio. Less than 3% of CRE loans have greater than 80% LTV. CNI accounts for 11% of total loans totaling $1.6 billion. This portfolio is diversified across industries characterized by modest average loan sizes and there is very little leveraged lending. Turning to asset quality, credit metrics continue to perform exceptionally well. Net charge offs totaled $1.1 million or just 3 basis points annualized, down 9 basis points from linked quarter and 10 basis points lower year over year. 3 basis points is abnormally low. This was driven by a small net recovery in commercial as well as a slight decline in consumer net charge offs. Non Performing assets declined to 9 basis points, down 1 basis point from linked quarter and 3 basis points year over year. Delinquencies increased to 40 basis points, up 4 basis points from linked quarter and up 10 basis points year over year and criticized loans remained flat to the linked quarter at 2.12% of total loans. That’s up 4 basis points year over year. Notably, 84% of criticized assets are real estate secured with a weighted average LTV of 53%. And as an update on the allowance for credit losses on loans and leases, the ACL ended the quarter at $147 million, up 200,000 from linked quarter. The ratio of our ACL to outstandings remained flat at 1.04%. This ACL coverage does include a $3.2 million qualitative overlay specifically related to the recent Kona Low storm. This overlay accounts for the potential impact of flood damage to approximately 15 to 20 properties in our portfolio net of anticipated insurance recoveries. We are monitoring these exposures closely but can already see that the potential loss would not deviate greatly from the amount we have reserved. And in light of recent industry discussions around private credit, I want to provide clear assurance that we …

Full story available on Benzinga.com

This post was originally published here

Strategy Inc. (NASDAQ:MSTR) Executive Chairman Michael Saylor announced Monday that the company bought 34,164 Bitcoin (CRYPTO: BTC) for $2.54 billion, the largest single-day purchase in its history.

The buy lifted Strategy’s holdings to 815,061 BTC, a roughly $61.6 billion stack that reportedly pushes the company past BlackRock. Strategy now trails only Satoshi Nakamoto.

The filing followed a Sunday post from Saylor that read “Think Even ₿igger.”

Crypto analyst Mike Flaum had separately predicted Strategy would acquire over 40,000 BTC this week.

Saylor landed a touch shy of that, but it was still the largest acquisition by the company since 2024.

The purchase was made at an average cost of $74,395 per coin, lifting Strategy’s blended cost basis to $75,527, almost exactly where bitcoin is trading today.

MSTR Slips As Schiff …

Full story available on Benzinga.com

This post was originally published here

U.S. stocks traded lower toward the end of trading, with the Dow Jones index falling around 0.1% on Monday.

The Dow traded down 0.11% to 49,391.03 while the NASDAQ fell 0.39% to 24,373.05. The S&P 500 also fell, dropping, 0.29% to 7,105.30.

Leading and Lagging Sectors

Energy shares climbed by 1.1% on Monday.

In trading on Monday, consumer discretionary stocks fell by 1.2%.

Top Headline

Shares of Investar Holding Corp (NASDAQ:ISTR) gained more than 5% on Monday as the company released earnings results for the first quarter.

The company posted adjusted earnings of 87 cents per share, beating market estimates of 68 cents per share. The company’s quarterly sales came in at $35.640 million versus expectations of $36.400 million.

Equities Trading UP
           

  • Enveric Biosciences Inc (NASDAQ:ENVB) shares shot up 130% to $4.19 after President Donald Trump issued an executive order on Saturday instructing health regulators to hasten the review process of …

Full story available on Benzinga.com

This post was originally published here

The U.S. Navy has selected Shield AI from among a pool of vendors eligible for contractor-run intelligence, surveillance, and reconnaissance (ISR) services in an operation that could total as much as $800 million in task orders.

The work would be carried out using Shield AI’s V-BAT vertical-takeoff-and-landing uncrewed aircraft to provide ongoing airborne monitoring. It operates at sea and from land-based sites with the U.S. Coast Guard and U.S. Marine Corps, including deployments from Navy ships, the press release stated.

“V-BAT has delivered more operational outcomes than any other Group 3 VTOL UAS. We’ve interdicted over 100,000 lbs of narcotics in the Caribbean and Pacific. V-BAT has executed hundreds of targeting operations in Ukraine, where GPS and communications are jammed during every mission, and we have delivered substantial outcomes in …

Full story available on Benzinga.com

This post was originally published here

IonQ Inc. (NYSE:IONQ) shares are trading higher Monday. The move follows a fresh analyst endorsement and heavy short interest dynamics.

The Nasdaq is down 0.66% while the S&P 500 has shed 0.38%.

• IonQ shares are showing limited movement. Where are IONQ shares going?

Northland Capital Sets Bullish Target

Northland Capital Markets analyst Nehal Chokshi initiated coverage on IonQ on Monday. Chokshi assigned an Outperform rating to the quantum computing firm. According to Benzinga Pro, the analyst set a price target of $55. This upbeat valuation follows a volatile period for the stock.

Short Interest Fuels Squeeze Potential

Data shows a recent climb in bearish bets. Short interest rose from 79.48 million to 80.93 million shares recently. This represents 22.78% of the company’s float. It would …

Full story available on Benzinga.com

This post was originally published here

Snowflake Inc (NYSE:SNOW) shares are trading higher on Monday. The stock is gaining traction even as the Nasdaq falls 0.69% and the S&P 500 sheds 0.41%.

Investors are rotating back into growth-oriented cloud and software names. This follows a prolonged “SaaSpocalypse” sell-off that erased billions in market cap.

• Snowflake stock is showing exceptional strength. What’s fueling SNOW momentum?

Moving Past SaaSpocalypse Fears

The recent downturn stemmed from fears that AI agents would erode subscription growth. High-profile names such as Salesforce Inc (NYSE:CRM) and Cloudflare Inc (NYSE:NET) faced sharp selling pressure.

However, the tide is turning. Wedbush analyst Dan Ives labeled the …

Full story available on Benzinga.com

This post was originally published here

Salesforce Inc. (NYSE:CRM) shares are trading higher on Monday. CEO Marc Benioff took to X to tout the success of the company’s Agentforce AI platform.

The Nasdaq is down 0.57% while the S&P 500 has shed 0.34%.

•  Why is CRM stock advancing?

Benioff Counters Software Bears

Benioff directly refuted critics predicting a bleak future for enterprise software. He highlighted impressive performance metrics at major firms like Pearson and PenFed.

Benioff referred to the shift as “Agenticware,” not just software. He noted that results provide tangible return on investment and not just hype.

Agentforce Drives Efficiency

At Pearson, the platform autonomously manages refunds …

Full story available on Benzinga.com

This post was originally published here

JPMorgan analyst Doug Anmuth reiterated an Overweight rating and a $395 price forecast for Alphabet Inc. (NASDAQ:GOOGL) (NASDAQ:GOOG) in a Monday research note.

The firm named the tech giant a “Top Pick” just days before the Google Cloud Next event in Las Vegas.

Cloud Growth Takes Center Stage

Anmuth highlighted Google Cloud’s rising importance to Alphabet’s bottom line. The segment is now the company’s second-largest business. JPMorgan expects Cloud to represent roughly 19% of total revenue in 2026.

The analyst noted that the Cloud backlog surged 160% year-over-year to $240 billion in late 2025. “While Cloud Next has not been a major catalyst for GOOG/L shares in the past, …

Full story available on Benzinga.com

This post was originally published here

image credit: Author

The Nasdaq (NQ) and S&P 500 (ES) operate within a dynamic environment shaped by liquidity, volatility, and evolving market structure. Modern trading is no longer driven solely by direction, but by how price interacts with key levels, participant behavior, and shifting conditions. Understanding these underlying mechanics is essential for interpreting price action with clarity and consistency.


Market Structure: Beyond Directional Thinking

Market structure is not simply about higher highs or lower lows. It reflects how price organizes itself through phases of expansion, consolidation, and rotation.

In indices like the Nasdaq and S&P 500, price often transitions between these phases as liquidity is built and distributed. Consolidation typically signals balance, while expansion reflects imbalance and directional intent. Recognizing these transitions allows traders to align with market conditions rather than react to them.


Liquidity: The Core Driver of Price Action

Liquidity remains one of the most critical, yet misunderstood, components of trading. Markets do not move randomly; they move in search …

Full story available on Benzinga.com

This post was originally published here

Agnico Eagle Mines (NYSE:AEM) has launched a multi-billion-dollar acquisition spree, striking three deals to gain control of one of Finland’s biggest gold‑producing regions.

The Toronto-based miner is acquiring Rupert Resources (OTCQX:RUPRF) for approximately C$2.9 billion (about US$2.1 billion), Aurion Resources (OTCQX:AIRRF) for about $350 million in cash, and purchasing B2Gold’s (AMEX:BTG) 70% stake in the Fingold joint venture for $325 million.

Combined, the deals give Agnico full control over a 2,492 square-kilometer land package in Finland’s Central Lapland Greenstone Belt.

“The scale of the mineralized trends, combined with the elimination of property boundaries, provides a strong foundation for disciplined, multi‑year exploration aimed at expanding resources and delivering new discoveries,” Agnico’s Executive VP Guy Gosselin said in the announcement.

World-Class Consolidation

The firm’s …

Full story available on Benzinga.com

This post was originally published here

The nuclear narrative has been hijacked by AI. From hyperscalers to data centers, the story has been simple: exploding compute demand needs baseload power. But Eli Lilly and Co (NYSE:LLY) just added a twist—and it has nothing to do with GPUs.

The drugmaker behind Prozac and Cialis is now exploring nuclear energy, signing a letter of intent with Indiana to support small modular reactors and advanced nuclear tech. The signal here isn’t about AI scale. It’s about something far more fundamental: industrial reliability.

Industrial Demand, Not AI Hype

Unlike data centers that can distribute workloads, pharmaceutical manufacturing doesn’t get that luxury. Production lines are tightly regulated, energy-intensive, and unforgiving to disruptions.

That’s where nuclear fits …

Full story available on Benzinga.com

This post was originally published here

A dire warning was just issued by the man at the center of the US Government through the GFC. What’s the warning now?

A Dire Warning

Henry Paulson just broke years of radio silence with a serious warning. The man who managed the U.S. Treasury through the 2008 financial crisis is now saying the Treasury market itself is heading toward a vicious emergency.

“We need an emergency break-the-glass plan, which is targeted and short-term, on the shelf, so it’s ready to go when we hit the wall.”

We’re sitting on $39 trillion in federal debt, with interest expense now over $1.2 trillion per year and growing at a terrifying 17% compound annual growth rate over the past six years. That works out to about $3.5 billion per day.

Annual interest expense, with CAGR since 2020.

As interest costs soar, we do not raise taxes- instead, we just issue even more debt (increasing the federal fiscal deficit, or the gap between federal spending and revenue). As more debt supply is issued, if demand does not rise at a commensurate rate, the price must decline.

And according to Paulson, foreign demand for Treasuries is no longer something we can count on.

In fact, the share of government debt that’s held by foreign and international investors has been declining for 14 years:

Foreign held debt, …

Full story available on Benzinga.com

This post was originally published here

VinFast Auto Ltd. (NASDAQ:VFS) has flipped the script. After a sharp late-March rally that caught traders’ attention, the EV maker has now flashed a Golden Cross—a bullish technical signal that’s putting Tesla, Inc‘s (NASDAQ:TSLA) emerging Vietnamese rival firmly back on the radar.

Chart created using Benzinga Pro

Parabolic Move Sparks Breakout

The setup follows a near-parabolic surge between March 18 and early April, where VinFast stock climbed rapidly on heavy volume.

The move was driven by a mix of delivery momentum, expansion buzz in India and Southeast Asia, and a low-float, …

Full story available on Benzinga.com

This post was originally published here

Former Fed nominee Judy Shelton unloaded on Fed Chair Jerome Powell in a Sunday Wall Street Journal op-ed, branding the central bank’s 2% inflation target a policy of “intentional debasement” and invoking James Madison‘s view that a depreciating currency is unconstitutional because it erodes property rights.

The timing is not subtle.

Kevin Warsh, the man Trump actually nominated, faces the Senate Banking Committee on Tuesday with his path already bruised by the Justice Department’s inquiry into Powell’s testimony about Fed headquarters renovations.

The Op-Ed That Doubles As A Job Application

Shelton was technically supportive of Warsh, citing his past IMF remarks on central bank overreach.

But the bulk of the piece is her own pitch: gold-standard sympathies, skepticism of Fed discretion, and openness to currencies that could compete with the dollar.

She also took direct shots at Powell for 31% cumulative inflation since 2018 and for failing to apologize, let alone resign, for missing the Fed’s own targets. …

Full story available on Benzinga.com

This post was originally published here

John Oliver used Sunday’s “Last Week Tonight” to call prediction markets gambling sites with better lawyers, adding the loudest voice yet to a backlash already being waged by state AGs, Congress and the sportsbook industry.

What Oliver Said

Oliver framed Kalshi and Polymarket as gambling sites operating in states where gambling remains illegal, arguing their hedging pitch strains credibility when most users trade sports or political word markets.

He cited one analysis showing more than two-thirds of all winnings on Polymarket have been captured by just 740 accounts, despite the platform having over two million users.

Oliver also went after CNN, Fox News, CNBC and Wall Street Journal parent Dow Jones for paid partnerships that put Prediction Market odds on air during news coverage, singled out Donald Trump Jr.’s advisory roles at both companies, and criticized CFTC Commissioner Michael Selig for suing three states rather than letting courts decide whether prediction …

Full story available on Benzinga.com

This post was originally published here