U.S. stocks fluctuated on Wednesday, following Tuesday’s rally. Futures of the major benchmark indices were mixed.

On Tuesday, President Donald Trump fueled the de-escalation narrative, saying that Iran talks “could be happening over the next two days” in Pakistan. The fresh Trump comments built on Vice President JD Vance‘s flagged “a lot of progress” in weekend talks with Iranian officials held in Islamabad.

Meanwhile, the 10-year Treasury bond yielded 4.25%, and the two-year bond was at 3.76%. The CME Group’s FedWatch tool‘s projections show markets pricing a 99.5% likelihood of the Federal Reserve leaving the current interest rates unchanged in its April meeting.

Index Performance (+/-)
Dow Jones -0.06%
S&P 500 0.05%
Nasdaq 100 0.11%
Russell 2000 -0.02%

The SPDR S&P 500 ETF Trust (NYSE:SPY) and Invesco QQQ Trust ETF (NASDAQ:QQQ), which track the S&P 500 and Nasdaq 100, respectively, were higher in premarket on Wednesday. The SPY was up 0.022% at $694.61, while the QQQ advanced 0.088% to $629.15.

Stocks In Focus

ASML Holding

  • ASML Holding NV (NASDAQ:ASML) rose 1.35% in premarket on Wednesday after the company announced its first-quarter earnings, beating expectations and raising its 2026 revenue outlook.
  • Benzinga’s Edge Stock Rankings indicate that ASML maintains a strong price trend in the short, medium, and long terms, with a solid growth score.

Terawulf

  • Terawulf Inc. (NASDAQ:WULF) declined 5.16% after reporting preliminary results and announcing a common stock offering after the market closed on Tuesday.
  • Benzinga’s Edge Stock Rankings indicate that WULF maintains a strong trend in the long, short and medium terms.
Benzinga's Edge Stock Rankings for WULF.

Stellantis NV

  • Stellantis NV

Full story available on Benzinga.com

This post was originally published here

(Editor’s note: The future prices of benchmark tracking ETFs, the lede, the economic data and the headline were updated in the story.)

U.S. stocks fell on Thursday, following Wednesday’s sharp rebound. Futures of the major benchmark indices were lower after Iran accused Washington of violating the ceasefire.

On the economic front, the real GDP growth for the fourth quarter was revised down to a modest 0.5% annual rate. Meanwhile, consumer dynamics in February saw personal income dip by 0.1%, even as personal consumption expenditures climbed 0.5%, pushing the PCE price index up 0.4% for the month and 2.8% annually.

Adding to the complex backdrop, the initial jobless claims for the week ending April 4 rose by 16,000 to 219,000.

In a post shared on X, Iranian parliamentary speaker Mohammad Bagher Ghalibaf said Washington had a “pattern” of breaking commitments, adding that “in such situation, a bilateral ceasefire or negotiations is unreasonable.” He cited continued Israeli strikes in Lebanon, an alleged drone incursion into Iranian airspace and disputes over Iran’s nuclear rights as violations.

However, President Donald Trump mentioned in a recent Truth Social post that all the U.S. ammunition and weaponry, “will remain in place,” until the “REAL AGREEMENT” is reached and fully complied with.

Meanwhile, the 10-year Treasury bond yielded 4.28%, and the two-year bond was at 3.77%. The CME Group’s FedWatch tool‘s projections show markets pricing in a 99.5% likelihood that the Federal Reserve will leave interest rates unchanged at its April meeting.

Index Performance (+/-)
Dow Jones -0.39%
S&P 500 -0.38%
Nasdaq 100 -0.36%
Russell 2000 -0.66%

The SPDR S&P 500 ETF Trust (NYSE:SPY) and Invesco QQQ Trust ETF (NASDAQ:QQQ), which track the S&P 500 and Nasdaq 100, respectively, were lower in premarket on Thursday. The SPY was down 0.27% at $674.16, while the QQQ declined 0.20% to $604.86.

Stocks In Focus

GameSquare Holdings

  • GameSquare Holdings Inc. (NASDAQ:GAME) surged 50.61% after the company reported fourth-quarter 2025 results that included its first positive adjusted EBITDA, along with full-year 2025 financials and a reiteration of its 2026 guidance.
  • Benzinga’s Edge Stock Rankings indicate that GAME maintains a weak price trend in the short, medium, and long terms.

This post was originally published here

Confidence among American consumers has never been this depressed in the history of the University of Michigan survey.

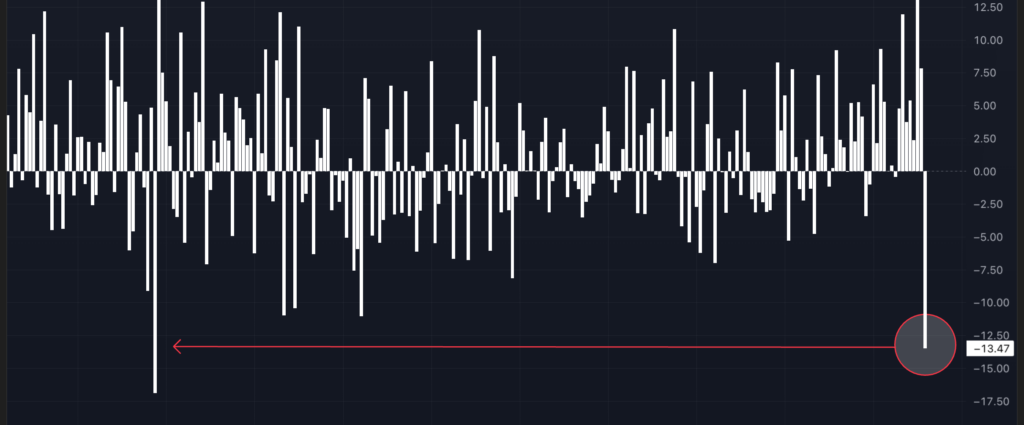
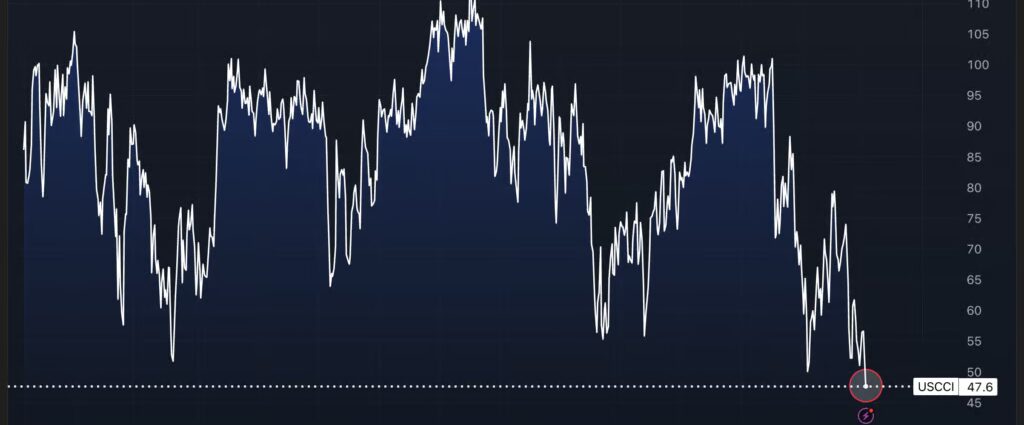
The preliminary April consumer sentiment index crashed to 47.6 — an all-time record low, an 11% monthly plunge and a sharp miss against the 52 consensus — as the Iran war’s economic fallout spread from the gas pump into households’ broader outlook on their finances, jobs and the future.

Chart: Worst Consumer Confidence Reading Since Records Began

Consumer Surveys For April 2026: Full Breakdown

Indicator April 2026 March 2026 April 2025 MoM Change vs. Consensus
Consumer Sentiment 47.6 53.3 52.2 –10.7% MISS vs. 52.0
Current Economic Conditions 50.1 55.8 59.8 –10.2%
Consumer Expectations 46.1 51.7 47.3 –10.8%
1-Year Inflation Expectations 4.8% 3.8% 5.3% +100bps BEAT vs. 3.8%
5-Year Inflation Expectations 3.4% 3.2% +20bps

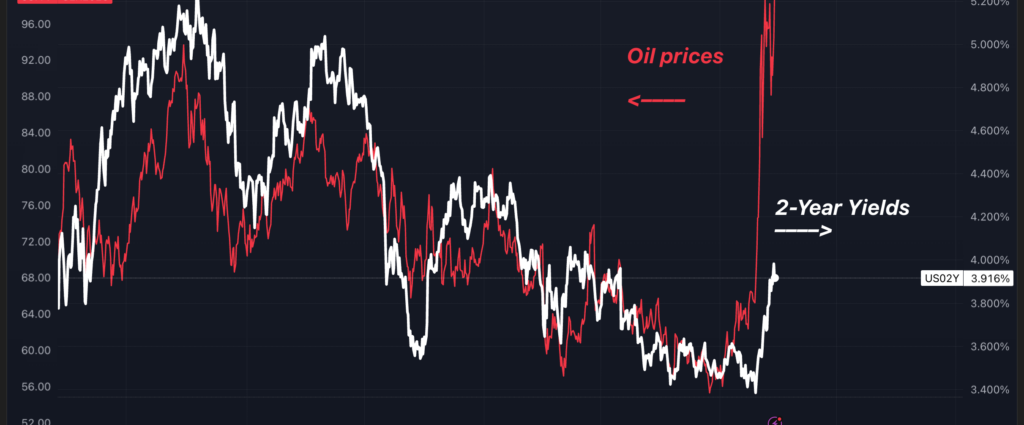
Iran War Didn’t Raise Prices. It Raised What People Expect Prices To Do

Aside from the shocking sentiment headline in Friday’s data, the inflation expectations component also negatively surprised.

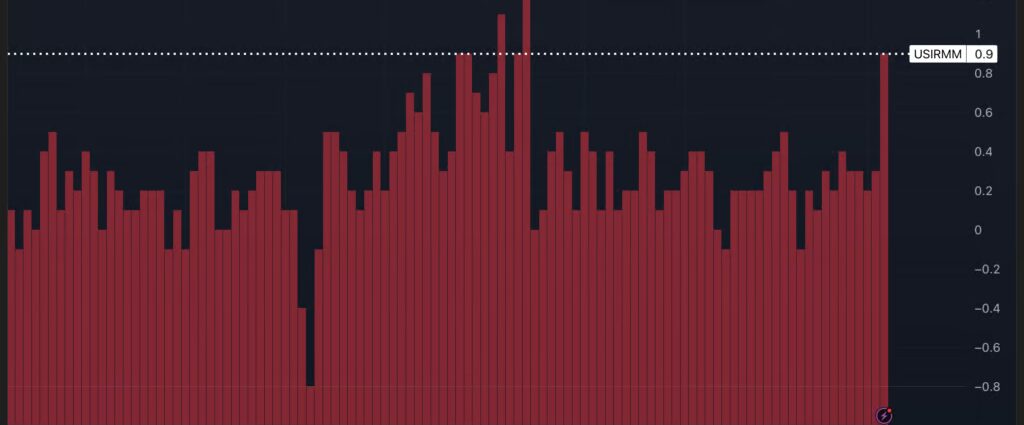
Year-ahead inflation expectations surged from 3.8% in March to 4.8% in April, a 100-basis-point jump in a single month, blowing past the 4.2% consensus and marking the largest one-month increase since April 2025.

The current reading now exceeds every 2024 reading and sits well above the 2.3%–3.0% range that prevailed in the two years before the pandemic.

Five-year inflation expectations ticked up from 3.2% to 3.4%, the highest reading since November 2025 — but held more contained than the short-run surge, a distinction that carries real meaning for the Federal Reserve.

Chart: Americans Expect 4.8% Inflation Next Year Fed Targets 2%

This post was originally published here

U.S. inflation surged in March at the fastest monthly pace since June 2022, driven almost entirely by an energy shock tied to the Iran war.

The Consumer Price Index (CPI) rose 0.9% month-over-month — matching Wall Street’s estimate — as energy prices jumped over 10.9% on the month. This marks the biggest monthly CPI jump in nearly four years.

The annual inflation rate soared from 2.4% in February to 3.3% in March, the highest since May 2024.

Core CPI, which strips out food and energy, came in at 0.2% month-over-month, below the 0.3% consensus. On an annual basis, the underlying inflation gauge rose 2.6% year-over-year, up from 2.5% in February and below expectations of 2.7.

That divergence between a hot headline and a contained core is the structural signal in Friday’s report: the Iran war has not yet spread beyond the pump.

Chart: Tradingview

Energy Did The Work — And Then Some

The energy index surged 10.9% in March, the largest monthly increase since September 2005.

Gasoline alone jumped 21.2% on a seasonally adjusted basis — the largest single-month increase since the series was first published in 1967 — and …

Full story available on Benzinga.com

This post was originally published here

American wallets felt the impact of the war in Iran on Friday after the March Consumer Price Index (CPI) report confirmed what drivers had already felt at the pump.

Gasoline prices posted their largest single-month increase since the Bureau of Labor Statistics first published the series in 1967, surging 21.2% in March as the conflict disrupted oil flows through the Strait of Hormuz.

That one number — gasoline — accounted for nearly three-quarters of the entire 0.9% monthly headline CPI increase, which is the steepest monthly jump since June 2022.

It is also the most direct measure yet of how a geopolitical shock 7,000 miles away is repricing life in the United States.

Chart: March Inflation Logs Highest Monthly Jump Since June 2022

From $2.98 To $4.15 – Trump Broke The Pump

On Feb. 26 — the day before the Iran war began — the national average price for regular gasoline stood at $2.98 per gallon, according to AAA data.

It now stands at $4.153. That is a 39% increase in roughly six weeks, the fastest peacetime gasoline price shock in modern American history.

Think of it this way: the average American drives about 15,000 miles a year and gets around 28 miles per gallon.

At $2.98, that was a roughly $1,600 annual fuel bill. At $4.15, it is now $2,200. The war has cost the average driver an extra $600 a year — and counting.

The energy index as a whole surged 10.9% in March — its largest monthly move since September 2005. Beyond gasoline, fuel oil rose 30.7%, its sharpest monthly climb since February 2000.

Airline fares jumped 2.7%, the first visible signal of jet fuel costs passing through into consumer services, with jet fuel prices up 75% since the start of the war according to Goldman Sachs.

AAA National Pump Prices — April 10, 2026

Grade Current Avg.
Regular $4.153
Mid-Grade $4.668
Premium $5.033
Diesel $5.683
E85 $3.303
Source: AAA

What Are Economists Saying?

Jeffrey Roach, chief economist at LPL Financial, said “at least eighty percent” of the 0.9% monthly CPI increase was energy-related, rising even higher if airfares are included given transportation’s 16% weight in the index. …

Full story available on Benzinga.com

This post was originally published here

The specter of political interference in the Federal Reserve is rippling through the market, and for ETF investors, the parallels to the 1970s are becoming more and more difficult to ignore.

• What’s next for TIP stock?

While Sen. Elizabeth Warren has accused President Donald Trump of interfering in the Fed, warning that this could have serious implications for the interest rates for mortgages, credit cards and student loans, there is another, more sinister threat to the market that ETF investors should be considering: inflation risk.

Warren referenced former President Richard Nixon’s term in the 1970s, an era of high inflation, unemployment and lower GDP growth.

The parallels to the 1970s and the Nixon administration are not coincidental. The fear among investors today is that the same set of economic problems that resulted in one of the most painful periods of inflation in American economic history could be about to be replayed.

The Nixon Playbook — And How It Applies To The Market Today

The Nixon administration and the economic policies that put in place during that time have a lot to teach about what could go wrong in …

Full story available on Benzinga.com

This post was originally published here

Gold is down 13% in March, on track for its steepest monthly decline since October 2008, when Lehman Brothers collapsed and global markets were in freefall.

The SPDR Gold Shares (NYSE: GLD) recorded over $8 billion in outflows during the month — more than double its prior largest monthly withdrawal, set in February 2021.

A war is raging in the Middle East. The world’s oldest safe haven is supposed to thrive in exactly this environment — so why isn’t gold working? And what does history say about what comes next after selloffs this violent?

Gold Had Its Worst Month Since 2008 – A Safe Haven That Failed To Show Up

The paradox is the story. Gold entered 2026 among Wall Street’s hottest consensus trades.

Gold had rallied 64.6% in 2025 — the bullion’s best annual return since 1979 — and by late January, spot gold reached an all-time high of $5,589 per ounce.

The bullish thesis was straightforward: falling inflation, multiple Fed rate cuts ahead, and insatiable central bank demand.

A month after President Donald Trump launched Operation Fury, the Strait of Hormuz remains closed, Brent crude trades above $110, and gold, the world’s oldest safe haven, is collapsing.

The answer is not geopolitics. It’s interest rates.

Gold is not an outright war hedge — it is an interest-rate-sensitive asset.

The conflict reignited the very inflation pressures markets had spent months assuming were behind them. The rate cuts that underpinned gold’s historic bull run have evaporated.

The Fed held rates at 3.50%–3.75% at its March 18 meeting and penciled in just one 25-basis-point cut for the year.

Yet traders went further: Polymarket traders now assign a 35% probability to zero cuts in 2026 — the single most likely …

Full story available on Benzinga.com

This post was originally published here

Federal Reserve Chair Jerome Powell expressed concerns about the fiscal trajectory of the U.S. while addressing the students at Harvard University on Monday.

Powell acknowledged that the $39 trillion debt load, while not immediately threatening, is on an unsustainable path that demands urgent legislative intervention. “It will not end well if we don’t do something fairly soon,” Powell said.

He distinguished the level of debt and its trajectory, arguing that the U.S, as the issuer of the world’s reserve currency and home to the deepest capital markets, can sustain a far larger debt burden than smaller economies.

In response to a student’s inquiry about the U.S. debt’s breaking point, Powell said that the exact threshold is uncertain. …

Full story available on Benzinga.com

This post was originally published here

U.S. equity markets bounced off seven-month lows on Monday, with major indices broadly higher by midday as President Donald Trump disclosed active negotiations with a “new and more reasonable” Iranian regime while Fed Chair Jerome Powell downplayed the need for imminent rate hikes.

• Amazon.com shares are advancing steadily. Why is AMZN stock advancing?

Powell reinforced the cautiously optimistic mood at Harvard University on Monday, where he said President Trump’s tariffs represented a “one-time price bump” and that the central bank has limited ability to offset supply shocks like war-driven energy surges.

“Inflation expectations appear to be well-anchored,” Powell said.

Markets interpreted Powell’s remarks as modestly dovish: the implied probability of a Fed rate hike in 2026 dropped to around 18%, as per the CME FedWatch tool.

The yield on the 10-year U.S. Treasury note fell around 10 basis points to 4.34%, pulling back from the eight-month highs struck on Friday. The 2-year note also fell about 10 basis points to 3.82%, while the 30-year bond yielded 4.90%, down seven basis points.

Across U.S. equity markets by midday Monday, gains were broad-based, with nine of 11 S&P 500 sectors advancing.

The S&P 500 advanced 0.7% to 6,413, while the Dow Jones Industrial Average gained 1.1% to 45,650. The Nasdaq 100 gained 0.5% to 23,240.

Within Magnificent Seven stocks, Amazon.com, Inc. 

Full story available on Benzinga.com

This post was originally published here

The Bond Vigilantes had been dormant for much of the past three to four years, until President Donald Trump‘s war in Iran snapped them back into action.

Now they are back, repricing sovereign bond yields from Washington to London to Frankfurt, punishing governments and central banks for any perceived leniency on inflation and forcing a wholesale rethink of where interest rates are headed in 2026.

The key question now is: Are the vigilantes right again — or has the bond market overshot, pricing a hawkish shock that will never come?

Who Are the Bond Vigilantes?

The term was coined by economist Ed Yardeni, president and chief investment strategist at Yardeni Research, in the 1980s to describe bond market investors who enforce fiscal and monetary discipline by selling government bonds — driving yields higher — when they believe a central bank or government is being too loose with inflation or spending.

Think of them as the market’s self-appointed inflation police: when they mobilize, borrowing costs rise for everyone, from governments to corporations to households with mortgages.

In his latest morning briefing on Monday, Yardeni confirmed that the vigilantes are mobilizing for both the inflationary consequences of the Iran war and the larger government deficits needed to fund defense spending.

The Strait of Hormuz — through which roughly 20 million barrels per day of crude oil and approximately one-fifth of global liquefied natural gas trade flows — remains effectively closed to all commercial vessels.

The result, Yardeni writes, is “the worst global energy shock ever.”

Earlier this month, Yardeni Research increased its probability of a U.S. recession and a bear market in stocks to 35%, up from 20% previously, warning of a potential “1970s-style stagflation scenario” that included two recessions in that decade.

“The major central banks haven’t responded yet, but the Bond Vigilantes are taking matters into their own hands and tightening credit conditions,” Yardeni wrote.

The Global Yield Scoreboard

The scale of the repricing over just four weeks of war is staggering.

The U.S. 2-Year Treasury yield has surged approximately 50 basis points month-to-date to 3.86% — the largest one-month increase since October 2024.

Think of the 2-year yield as the bond market’s verdict on the Fed: it reflects, in real time, where investors believe interest rates will sit over the next two years, making it one of the most watched signals on Wall Street.

But the United States is the calmest story on the board.

Germany’s 2-year Bund yield has jumped roughly 64 basis points month-to-date to 2.64% — the sharpest …

Full story available on Benzinga.com

This post was originally published here

Brent crude topped $110. The Nasdaq is officially in correction. And for the first time since 2023, futures markets are pricing in a rate hike.

THE RUNDOWN

WAR › The Dow fell 793 points on Friday and entered correction territory for the first time since early 2023, joining the Nasdaq, which is now down 10.9% from its October high. Brent crude topped $112 after Iran turned back two China-owned container vessels from the Strait of Hormuz, per the WSJ. President Trump extended his deadline for Iran to reopen the strait by 10 days to April 6, calling talks “very well” while Iran denied any direct negotiations. Meanwhile, the Pentagon is weighing 10,000 additional ground troops to give Trump more military options.

MARKETS › The S&P 500 posted its fifth straight weekly decline, falling 2.1% for the week and 6.8% for the month. If that holds, it’s the worst March since December 2022. Every single Magnificent 7 name is now down more than 10% from its highs. Citi cut its equity allocation to neutral, citing “most of our negative equity macro risk signals triggering.” Nineteen S&P 500 stocks hit new 52-week highs on Friday. The number hitting new lows was much longer.

Full story available on Benzinga.com

This post was originally published here

Something is badly mispriced in the bond market, and almost nobody is talking about it.

WTI crude rallied to $99 on Friday — on track to close at the highest level since July 2022. The 2-Year Treasury yield, one of the most reliable real-time gauges of Federal Reserve interest rates, is at 3.92%.

The last time oil traded at these levels, the 2-Year was above 5%.

Today, there is roughly a 100-basis-point gap between the current yield and where recent history suggests it should be.

Everyone’s Watching Oil. The 2-Year Yield Is The Real Threat.

John Roque, technical analyst at 22V Research, flagged the divergence in a note published this week

His argument is pointed: oil is getting all the attention, but the 2-Year yield is the instrument that will ultimately do the most damage.

“Right now, oil is ‘public enemy #1’, but I think it’ll ultimately be the US 2-Year Treasury Yield,” he wrote.

Roque’s near-term target for the 2-Year is 5% — the top of a range …

Full story available on Benzinga.com

This post was originally published here

The Dow Jones Industrial Average fell more than 400 points today, dropping into correction territory as wartime supply fears kept Brent crude hovering near $111 a barrel and the S&P 500 headed for its fifth straight weekly decline, its longest losing streak since 2022.

But the bigger story is in the rates market, where futures traders on Friday pushed the probability of a Fed rate hike by year-end to 52% on the CME FedWatch tool, according to CNBC. It is the first time that number has crossed the 50% threshold. A month ago, those odds were at zero.

• Microsoft stock is showing weakness. Why are MSFT shares declining?

What Prediction Markets Say

On Polymarket, a contract asking whether the Fed raises rates in 2026 is trading at 25% with $642,900 in volume. The contract spiked from around 8% at the start of March. On Kalshi, the chance is 27%.

This is still well below the 52% implied by CME futures, which …

Full story available on Benzinga.com

This post was originally published here

A new policy initiative from the Federal Reserve, through one of its governors, Stephen Miran, is bringing bank loan ETFs back in focus. His proposal to shrink the balance sheet while potentially allowing lower rates creates a tricky backdrop for floating-rate strategies that have thrived in a high-rate environment.

• Invesco Senior Loan ETF stock is taking a breather. Where are BKLN shares going?

Yield Tailwinds May Fade For Key ETFs

Some of the most popular bank loan ETFs could face challenges to their core investment thesis:

  • Invesco Senior Loan ETF (NYSE:BKLN)
  • SPDR Blackstone Senior Loan ETF (NYSE:SRLN)
  • iShares Floating Rate Bond ETF (BATS:FLOT)

All these ETFs have benefited from rising rates, as they have floating coupons. However, if the bank rates fall, even alongside balance sheet reduction, income generation could be lower for …

Full story available on Benzinga.com

This post was originally published here


Sen. Elizabeth Warren (D-Mass.) sent a sharp letter to Federal Reserve chair nominee Kevin Warsh on Thursday, saying he appears likely to serve as a “rubber stamp for President Trump‘s Wall Street First Agenda”

Warren, the ranking Democrat on the Senate Banking Committee, told Warsh that his record as a Fed Board of Governors member from 2006 to 2011, spanning the 2008-09 financial crisis and Great Recession, “should disqualify you from a promotion.”

“It appears you have learned nothing from your failures,” Warren wrote, accusing Warsh of prioritizing large financial institutions over American families during the crisis. She also criticized him for advocating “against tougher safeguards intended to prevent big bank failures and taxpayer bailouts” after leaving the Fed.

The letter posed detailed questions …

Full story available on Benzinga.com

This post was originally published here

The average 30-year fixed-rate mortgage climbed to a six-month high this week, adding fresh pressure to an already strained housing market as the ongoing conflict in the Middle East pushes oil prices higher and reignites inflation concerns.

Freddie Mac (OTC:FMCC) reported Thursday that its Primary Mortgage Market Survey showed the 30-year fixed-rate mortgage averaged 6.38%, up from 6.22% the prior week and the highest reading since early September. Rates have now risen for four consecutive weeks.

The jump is tied directly to energy prices. Oil has surged more than 30% since the Iran conflict began in late February, lifting U.S. Treasury yields. Since mortgage rates track the 10-year Treasury, borrowing costs have followed.

Spring Homebuying Faces Headwinds

The …

Full story available on Benzinga.com

This post was originally published here

The U.S. entered 2026 poised for a rare growth upgrade — until the war in Iran wiped out that momentum, as the Middle East energy shock pushed headline inflation to its highest level in four years.

On Thursday, the Organization for Economic Co-operation and Development (OECD) made it clear: inflation is rising.

For President Donald Trump, heading into the 2026 midterms, it’s a difficult hand as the GOP looks to maintain a razor-thin majority. The Federal Reserve is likely to hold interest rates steady, while the expected growth boost for the U.S. economy has all but vanished.

What The OECD Report Actually Said

U.S. headline inflation is now projected to rise from 2.6% in 2025 to 4.2% in 2026. That’s a 1.2 percentage-point upward revision from the December 2025 forecast. Should energy price pressures fade, headline inflation could fall to 1.6% in 2027.

The OECD projects core inflation, which excludes food and energy, at 3% in 2026. That’s still above the Fed’s 2% target through the full year.

The driver is clear. Brent crude oil prices are roughly 40% higher in 2026 than the OECD assumed in December.

Lower effective tariff rates on U.S. imports — following the Supreme Court’s IEEPA ruling — can partially offset price pressures, the Paris-based organization noted. However, “the impact of higher energy prices on inflation will more than offset the effect from the decline in effective tariff rates.”

On growth, the U.S. remains resilient relative …

Full story available on Benzinga.com

This post was originally published here

Foreign investors are purchasing U.S. government debt at near-record levels, driving total foreign holdings to a staggering $9.3 trillion in January, even as structural cracks emerge in the broader bond market.

Japan And Allies Drive The Surge

Global demand for U.S. Treasuries saw a sharp uptick at the start of the year, with total foreign holdings swelling by $34.8 billion, according to Macromicro.me data shared by The Kobessi Letter.

Japan solidified its position as the largest foreign creditor, purchasing $39.8 billion to bring its total stockpile to $1.2 trillion—the highest since July 2022.

The United Kingdom closely followed, adding $29.3 billion to reach $895.3 billion, its third-highest level on record. The European Union also increased its holdings by $8 billion.

Collectively, foreign investors now own more U.S. debt than ever before, acting as a crucial pillar for the growing federal deficit.

Full story available on Benzinga.com

This post was originally published here

President Donald Trump promised a Golden Age of low inflation and hot economic growth, but the first business survey since the Iran war broke out suggests he’s getting the opposite.

The warnings came from the first business surveys printed since the war started on Feb. 28.

The S&P Global Flash U.S. Composite Purchasing Managers’ Index (PMI) — a survey-based gauge of business activity across both the manufacturing and services sectors — fell to 51.4 in March.

While the broader headline reading still points toward an expansionary private sector activity, the details beneath the surface were more concerning.

Input costs posted their sharpest monthly increase in 10 months, signaling a renewed inflation pulse driven by higher energy prices. At the same time, U.S. private sector employment declined for the first time since February 2025.

This isn’t just a story of slowing growth. It’s a picture of an economy drifting toward stagflation — and a Federal Reserve with no easy response.

What The March PMI Shows — And Why It Matters

The survey, compiled between March 12 and 23, revealed a widening split across the economy:

  • The Services PMI fell to 51.1, an 11-month low and below expectations, as higher energy costs and geopolitical uncertainty weighed on demand. Export orders declined at a faster pace.
  • Manufacturing, by contrast, rose to 52.4, a two-month high. …

Full story available on Benzinga.com

This post was originally published here

Federal Reserve Governor Stephen Miran — who has dissented in favor of rate cuts at every meeting since his appointment by President Donald Trump last year — said Monday that the Iran-driven oil shock does not alter his policy outlook, arguing the Fed should wait for clearer evidence before assessing the inflation impact of higher energy prices.

“I think that we shouldn’t be making policy based on short-term headlines,” Miran said Monday during a Bloomberg interview.

“It’s just still premature to have a clear view about what this is going to look like as you look 12 months out.”

Should The Fed Look Through An Oil Shock?

Since the start of the war in Iran, oil prices — as tracked by the United States Oil Fund (NYSE:USO) — have rallied nearly 40%, fueling fears of an upcoming inflationary wave.

“These oil shocks have been things that this Fed has looked through for a long time,” Miran said.

“It would be highly unusual for the Fed to start looking through them now.”

Traditional central banking holds that oil shocks hit headline inflation hard but pass through to core inflation only weakly, and that central banks should look through the first-round effects unless two specific conditions emerge: inflation expectations beyond the first year start to rise, or wages begin responding to higher energy prices in a way that creates a self-reinforcing spiral.

Miran said he sees neither.

But financial markets are sending a different signal. Prediction markets now put a 34% probability on zero Fed rate cuts in 2026 — …

Full story available on Benzinga.com

This post was originally published here


Gold has plummeted into a bear market, shedding over 22% from its January record highs, as soaring oil prices tied to the escalating U.S.-Iran conflict trigger fears of persistent inflation and an increasingly hawkish Federal Reserve.

The Safe-Haven Paradox

The precious metal hit an all-time high of $5,589 per ounce in January. However, at the last check, gold was trading at $4,357.29, down 22.12% from the record, marking a historic sell-off.

Independent researcher at Ash & Seed Press, Shanaka Anslem Perera, noted the paradox: the war caused oil to spike above $112, which fanned inflation. Brent crude futures currently remain elevated near $107.86, while WTI sits at $98.81.

Fed Holds Steady Amid Oil Shock

Responding to the persistence of inflation, the Federal Open Market Committee maintained …

Full story available on Benzinga.com

This post was originally published here


Gold is being hit from two directions simultaneously — and the combination is producing a sell-off not seen in over four decades.

• SPDR Gold Shares stock is showing weakness. Why is GLD stock trading lower?

The precious metal is down nearly 9% week-to-date through Friday morning — its worst weekly performance in over four decades.

While rising expectations for Fed rate hikes have been the primary driver, another pressure point is emerging: growing speculation that some Gulf states may be forced to sell gold reserves to plug fiscal gaps as crude export revenues evaporate.

The chart tells two stories simultaneously. The percentage decline of 9.11% is the worst weekly move since 1983.

But the dollar loss is even more striking — gold has shed $441 per ounce this week, the largest weekly dollar decline in the metal’s recorded history, a direct consequence of prices that were near all-time highs when the selling began.

The Rate Hike That Broke Gold’s Most Powerful Tailwind

Gold’s most powerful tailwind entering 2026 was the expectation of falling real interest rates. Two to three Federal Reserve rate cuts were priced for the year.

Lower real rates reduce the opportunity cost of holding gold — a non-yielding asset — and that dynamic had driven bullion to record highs in 2025.

The Iran war destroyed that thesis in three weeks.

The CME FedWatch tool now shows a 52% probability of a Fed rate hike by October. Polymarket prices the odds of a 2026 hike at 24%, up from just 6% before the conflict began.

When rate hike expectations surge, real yields climb, the …

Full story available on Benzinga.com

This post was originally published here

Mortgage rates in the U.S. jumped to a three-month high this week, adding strain to the housing market as the spring buying season begins. The 30-year fixed mortgage rate rose to 6.22% for the week ending March 19, up from 6.11% the previous week, according to Freddie Mac.

War Abroad Is Pushing Borrowing Costs Higher

The increase follows the outbreak of the Iran conflict, which has tightened global energy supplies and lifted oil prices, fueling inflation expectations. The 10-year Treasury yield, which influences mortgage rates, rose to 4.26% from 3.96% before the conflict.

Mortgage applications fell nearly 11% from the prior week. New single-family home sales dropped nearly 18% in January from the previous month and were down 11.3% from a year earlier, according to the Census Bureau.

The Federal Reserve kept interest rates at 3.5%–3.75%, …

Full story available on Benzinga.com

This post was originally published here


Both the S&P 500 and Nasdaq 100 are poised to break below their 200-day moving averages for the first time since March 2025.

Meanwhile, the Brent-WTI crude spread blew out to $17 per barrel early Thursday — the widest since April 2020 when WTI went negative — as Israel’s strike on Iran’s South Pars gas field triggered retaliatory missile attacks across the Gulf and markets began pricing in the risk of U.S. crude export restrictions.

Brent surged 7.11% to $115.01, while Middle East benchmarks Murban and Dubai crude exploded above $128 and $136 respectively.

Chart Of The Day

S&P 500 Could Break Below Its 200-Day Moving Average For First Time Since March 2025

Iran War Day 20: What Happened In The Last 24 Hours

  • President Donald Trump said Israel “violently lashed out” at Iran’s South Pars gas field and that the U.S. “knew nothing about this particular attack.” He warned that the U.S. would “massively blow up the entirety of the South Pars gas field” if Qatar’s LNG is attacked again, and demanded no further Israeli strikes on the site unless Iran retaliates against Qatar.
  • Iran retaliated with ballistic missiles against Qatar’s Ras Laffan LNG complex, which handles roughly 20% of global LNG supply. Qatar reported fires and extensive damage. Iranian drones also hit the Samref refinery in Yanbu, Saudi Arabia, and the Mina Al-Ahmadi refinery in Kuwait.
  • The Fed held rates at 3.5%-3.75% in an 11-1 vote. The dot plot projects one cut in 2026. Chair Jerome Powell emphasized oil-shock uncertainty and said inflation progress had stalled.

Thursday’s Oil Market Update

WTI crude oil futures — as tracked by the United States Oil Fund (NYSE:USO) — traded at $98.35 per barrel early Thursday, up $2.03 (+2.11%). Since the start of the war on Feb. 28, WTI prices have surged roughly 45% from a pre-war level near $68 per barrel.

Brent crude — tracked via the United States Brent Oil Fund, LP ETV (NYSE:BNO) — jumped 7.11% to $115.01 per barrel following Iranian missile strikes on Gulf energy infrastructure.

Middle East benchmarks saw even sharper moves: Murban crude surged 10.34% to $128.84 per barrel, while Dubai crude spiked 11.05% to $136.42 per barrel, reflecting an acute physical supply squeeze in the region.

The Brent-WTI spread widened to approximately $17 per barrel — the widest since April 2020, when WTI famously went negative amid the pandemic storage crisis. Excluding that historic anomaly, the current spread is …

Full story available on Benzinga.com

This post was originally published here

Federal Reserve Chair Jerome Powell on Wednesday warned that the escalating Middle East conflict will push U.S. inflation higher in the near term — but ruled out stagflation and described the U.S. economy as resilient.

Powell’s remarks came after the Federal Open Market Committee held the federal funds rate unchanged at 3.50%–3.75% for the third consecutive meeting, as widely expected.

Middle East Crisis Front And Center

“The implications of developments in the Middle East for the U.S. economy are uncertain,” Powell said in his opening statement.

“In the near term, higher energy prices will push up overall inflation. It is too soon to know the scope and duration of the potential effects on the economy.”

He highlighted the traditional central bank approach of “looking through” energy shocks, but conditioned that option on inflation expectations remaining anchored — a threshold he acknowledged is less comfortable given years of above-target inflation.

“The question of looking through, when it does arise, will be one to approach not lightly, but in the context that inflation has been above target,” Powell said.

He also highlighted the U.S.’s position as a net energy exporter, noting that higher oil prices would boost domestic drilling activity and corporate profits — providing some economic offset.

Yet, he cautioned that “the net of the oil shock will still be some downward pressure on spending and employment and upward pressure on inflation.”

Rate Path: Cuts Still In Play, Hike Not Off The Table

The median SEP …

Full story available on Benzinga.com

This post was originally published here


Editor’s Note: Article has been updated with additional information.

The Federal Reserve held interest rates unchanged at 3.50%–3.75% for the third straight meeting on Wednesday, as widely expected by market participants.

The FOMC statement noted that while economic activity has been expanding at a solid pace, job gains have remained low, and inflation remains somewhat elevated. 

Fed Governor Stephen Miran was the lone dissenter, voting in favor of a 25-basis-point rate cut.

The updated Summary of Economic Projections (SEP) pointed to higher inflation and slightly higher economic growth compared to December.

  • The Fed now sees PCE inflation at 2.7% in 2026, up from 2.4% projected in December.
  • Real GDP growth is now projected at 2.4% for 2026, up from 2.3% in December.

2026 2027 2028
Change in real GDP (%) 2.4 2.3 2.1
December projection (%) 2.3 2.0 1.9
Unemployment rate (%) 4.4 4.3 4.2
December projection (%) 4.4 4.2 4.2
PCE inflation (%) 2.7 2.2 2.0
December projection (%) 2.4 2.1 2.0
Core PCE inflation (%) 2.7 2.2 2.0
December projection (%) 2.5 2.1 2.0

The dot plot — the chart showing where each Fed official expects interest rates to be in the coming years — …

Full story available on Benzinga.com

This post was originally published here


U.S. equity markets slipped into the red on Wednesday in early morning trading in New York as hotter-than-expected February producer price data reignited inflation fears just hours before the Federal Reserve is set to deliver its rate decision and updated economic projections, while Brent crude surged above $108 a barrel following an Israeli strike on Iran’s South Pars natural gas processing complex.

South Pars Strike Marks Major Escalation

Israel struck Iran’s South Pars gas processing facility in Assaluyeh on Wednesday morning, hitting tanks and infrastructure at the complex.

South Pars is Iran’s largest natural gas field and the source of roughly 70% of the country’s gas output. It shares a reservoir with Qatar’s North Field — the world’s largest natural gas deposit.

Iran’s Revolutionary Guards immediately issued evacuation warnings for several Gulf energy facilities. Iranian state media declared that Gulf energy sites are now “legitimate targets.” Iran’s Foreign Ministry said Tehran would retaliate. Qatar’s foreign ministry called the strike “a dangerous and irresponsible step amid the current military escalation.”

Prediction odds of the Strait of Hormuz reopening by April 30 fell to 25%, as tracked by Polymarket.

Brent crude surged 4.8% to $108.50 a barrel. WTI crude – as tracked by the United States Oil Fund

Full story available on Benzinga.com

This post was originally published here

A cleaner drug, zero competition, and two binary readouts this year. Plus, Powell and oil near $99.

Three straight losing weeks for the S&P. Oil within spitting distance of $99. Jerome Powell steps to the mic on Wednesday. Jensen Huang kicks off Nvidia’s GTC today. Happy Monday.

The S&P 500 closed Friday at 6,632, down 1.6% on the week and roughly 5% off its January high. Dow at 46,558. Nasdaq at 22,105. Gold above $5,100 an ounce. WTI crude at $98.71. Every member of the Mag 7 is red on the year.

The oil picture keeps getting worse, not better. Bloomberg modeled Strait of Hormuz shutdown scenarios this week: one month puts crude around $105, two months at $140, three months at $165. The Trump administration suspended the Jones Act to try to tame prices. None of it has been enough.

Goldman put a number on the inflation risk: a $10 sustained oil price increase would push year-over-year headline CPI from 2.4% to roughly 3.2% within three months. That’s the backdrop walking into Wednesday’s FOMC decision.

Full story available on Benzinga.com

This post was originally published here


The U.S.-Iran war has delivered what Goldman Sachs now sees as the largest oil supply shock on record.

Persian Gulf exports, as tracked by vessel count data, have fallen to roughly 3% of normal levels at the Strait of Hormuz — a disruption that dwarfs even the 1973 OPEC embargo and the 1990 Gulf War in terms of the immediate hit to flows.

Goldman’s commodity research team, led by analyst Daan Struyven, upgraded its Brent crude price forecast on Wednesday, citing a longer assumed disruption and a more complex global policy response than their initial models projected.

“Our commodity strategists now expect Brent to average $98 in March and April—up 40% from the 2025 average— before falling back to $71 by 2026 Q4,” Goldman Sachs said.

On Thursday morning, front-month futures on the West Texas Intermediate light crude – as tracked by the United States Oil Fund (NYSE:USO) – traded 6% higher near $95 a barrel. That’s after the International Energy Agency (IEA) announced an emergency release of 400 million barrels from crude reserves – the largest in history.

The Largest Oil Supply Shock on Record

Goldman’s analysis shows the current hit to Persian Gulf exports at 16.2 mb/d on a four-day moving average basis, a figure the bank describes as the largest supply shock on record, exceeding the production losses seen during the 1973 …

Full story available on Benzinga.com

This post was originally published here