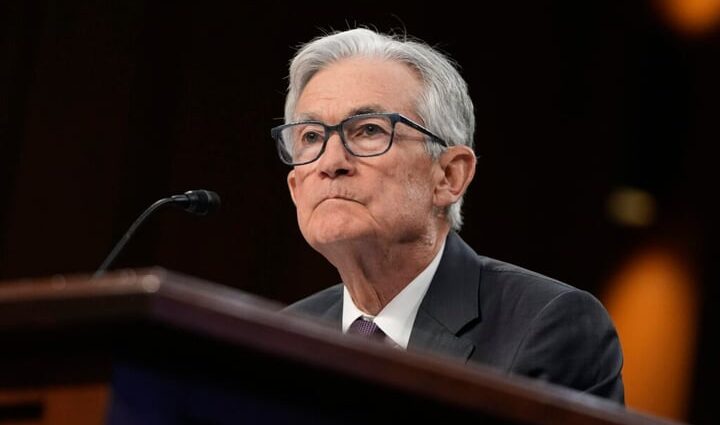
Leading cryptocurrencies stagnated, while stocks fell on Wednesday due to the Federal Reserve’s interest rate decision and uncertainty surrounding U.S.-Iran peace talks.

Cryptocurrency 24-Hour Gains +/- Price (Recorded at 9:30 p.m. EDT)
Bitcoin (CRYPTO: BTC) +0.13% $76,338.11
Ethereum (CRYPTO: ETH)
               
-0.29% $2,275.54
XRP (CRYPTO: XRP)                          +0.03% $1.37
Solana (CRYPTO: SOL)                          -0.01% $83.86
Dogecoin (CRYPTO: DOGE)              +7.62% $0.1072

Crypto Liquidations Surge

Bitcoin remained volatile, dropping from an intraday high of $77,884 in the early hours to below $75,000 by afternoon. Trading volume spiked nearly 30% over the last 24 hours.

Ethereum hovered between $2,200 and $2,300 amid strong trading volume, while Dogecoin jumped over 7%.

Shares of Strategy Inc. (NASDAQ:MSTR) and Coinbase Global Inc. (NASDAQ:COIN) closed down 4.54% and 6.37%, respectively.

Over $550 million was liquidated in the past 24 hours, with $345 million in long positions erased, according to Coinglass data.

Open interest in Bitcoin futures fell 0.88% over the last 24 hours, and more than 12% over a week. Binance derivatives traders, both retail and whale, stayed “Neutral” on the apex cryptocurrency.

Top Gainers (24 Hours) 

Cryptocurrency (Market Cap>$100 M) Gains +/- Price (Recorded at 9:30 p.m. EDT)
SKYAI (SKYAI)       +35.21%     $0.2861
Unibase (UB)                  +13.14%     $0.06655
Terra Classic (LUNC)             +10.45%     $0.00006967

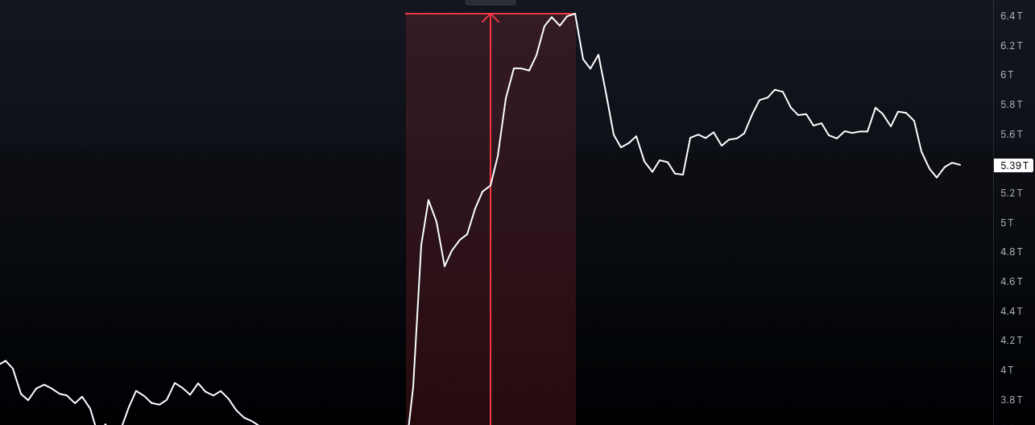
The global cryptocurrency market capitalization stood at $2.55 trillion, following a drop of 0.02% over the last 24 hours.

Stocks Drag On Fed Decision

Stocks retreated further on Wednesday. The …

Full story available on Benzinga.com

This post was originally published here

Tesla Inc (NASDAQ:TSLA) is trending after the market close on Wednesday after the company provided an update on the long-awaited Tesla Semi.

Tesla High-Volume Semi Production Begins

In a social post on X late Wednesday, Tesla announced that its first Tesla Semi has rolled off the high-volume production line.

“First Semi off high volume line,” Tesla said in the post, which featured an image of Tesla …

Full story available on Benzinga.com

This post was originally published here

Entergy (NYSE:ETR) reported first-quarter financial results on Wednesday. The transcript from the company’s first-quarter earnings call has been provided below.

This transcript is brought to you by Benzinga APIs. For real-time access to our entire catalog, please visit https://www.benzinga.com/apis/ for a consultation.

Access the full call at https://events.q4inc.com/attendee/703279949

Summary

Entergy Corp reported a strong financial performance for Q1 2026, with adjusted earnings per share of $0.86 and an 8.5% growth in retail sales.

The company launched the Fair Share+ pledge to ensure data centers contribute to infrastructure costs, securing agreements with Meta for new data centers, which are expected to generate $7 billion in benefits.

Entergy Corp raised its capital plan to $57 billion, driven by new electric service agreements and growth in industrial sales, with an anticipated 8.5% compound annual growth in retail sales through 2029.

Operational highlights include the first fire milestone of the Orange County Advanced Power Station and capital savings in transmission projects, while expanding renewable and storage capacity with active RFPs for over 4,500 megawatts.

Future outlook remains positive with strong growth prospects, supported by strategic investments and robust customer agreements, with plans to provide more details at an upcoming Investor Day.

Full Transcript

OPERATOR

Good Morning, My name is John and I will be your conference operator today. At this time I would like to welcome everyone to Entergy’s first quarter 2026 earnings call and teleconference. All lines have been placed on mute to prevent any background noise. After the speaker’s remarks, there will be a question and answer session. If you would like to ask a question during this time, simply press Star followed by the number one on your telephone keypad and if you would like to withdraw your question, press Star one again. I will now turn the call over to Liz Hunter, Vice President of Investor Relations for Entergy Corporation.

Liz Hunter (Vice President of Investor Relations)

Liz, Good morning. Thank you John and thanks to everyone for joining this morning. We will begin today with comments from Entergy’s Chair and CEO Drew Marsh and then Kimberly Fontan, our CFO will review results in today’s call. Management will make certain forward looking statements. Actual results could differ materially from these forward looking statements due to a number of factors which are set forth in our earnings release, our slide presentation and our SEC filings. Entergy does not assume any obligation to update these forward looking statements. Management will also discuss non-GAAP financial information reconciliations to the applicable GAAP measures measures are included in today’s press release and slide presentation, both of which can be found on the Investor Relations section of our website. And now I will turn the call over to Drew.

Drew Marsh (Chair and CEO)

Thank you Liz Good morning everyone. We had a productive first quarter in which we delivered strong financial results. We launched our Fair Share plus pledge and we advanced customer initiatives with the execution of several electric service agreements, including the one with META that improve our financial outlook well into the future.. Beginning with financial results today we are reporting first quarter adjusted earnings per share of $0.86. 2026 guidance remains on track and we are increasing our already strong adjusted EPS outlook driven by 8.5% retail sales growth. Now I’ll cover the business updates in the quarter and as always, I’ll start with the customer. For several years we have worked with stakeholders to recruit data centers and capture the transformative impact they can have on our communities and through investment, jobs and other support, all at the same time protecting and benefiting existing customers. Earlier this year we formalized that commitment with the launch of our Fair Share+ pledge. The Fair Share+ pledge is a set of guiding principles that ensures that data centers pay their fair share for the power they consume plus additional benefits for customers and communities. Our pledge aligns with the Ratepayer Protection Pledge that our customers signed with the White House. Fair Share is achieved in several ways. Minimum bills and contract length cover incremental costs, termination provisions ensure current customers avoid unneeded costs, clean energy terms support a potential future transition, and strong credit terms give us confidence in all of it. Fair share also means that data centers cover their portion of fixed costs that our current customers pay for today. The fair share portion alone is the source of the estimated $7 billion of benefits we have highlighted, and current customers bills will be lower than they otherwise would have been because data centers are paying for the incremental infrastructure they need as well as their share of fixed costs. The plus component is all of the community benefits originally envisioned by our state and local leaders, including well paying jobs and targeted workforce development a substantial influx of new support for schools, nonprofits and other state and community needs and multiplier effects from new businesses and employment opportunities that come about because of the data centers. The plus component also includes a stronger electric system with reliability and resilience benefits, lower average fuel costs driven by more efficient generation, and specific customer benefits like low income or energy efficiency support. The plus component is clearly valuable and it is in addition to our estimated $7 billion in customer benefits. We’re proud that the framework we committed to more than two years ago is already providing significant benefits for our customers and communities, and those benefits will compound well into the future.. I cannot say enough about the tremendous work our employees have done to create this transformative opportunity for our communities while also providing so much value for our existing customers. And we aren’t done yet. In late March, we announced a new electric service agreement with MEDA for another data center in North Louisiana. The fair share value from this agreement alone is expected to be $2 billion, which is included in the $7 billion I mentioned in the plus category. Over the next 20 years, MEDA has made other commitments $140 million for energy efficiency programs and $60 million for our Power to Care program. Entergy Louisiana will match power to CARE funding, bringing the increase to $120 million. For context, that is a five times annual increase for 2025 levels that will meaningfully improve outcomes for our most vulnerable customers. Shortly after executing the agreement, Entergy Louisiana filed an application with the Louisiana Public Service Commission requesting approval for assets needed as a result of adding the new META data center to the system. The investment includes seven new combined cycle units, transmission infrastructure and battery storage facilities. The cost of the proposed facilities will be covered by payments from meta, whether from their tariff or other contributions. Yet all customers will realize reliability and resilience benefits and lower fuel costs from these investments. We also agreed to pursue another 2 1/2 gigawatts of Renewables and further investigate CCS, nuclear upgrades and new nuclear to support META’s clean energy goals. We’ll add projects to the plan as assets are identified. This month, the Commission affirmed that our request falls under their new Louisiana Lightning Initiative, and they directed that the procedural schedule should support a decision at the December B and E meeting. The Commission’s Lightning Initiative is part of Governor Landry’s Project Lightning Speed to support economic development that provides significant benefits to state and local communities. We are requesting approval for more than $15 billion in capital with about $14 billion in our four year plan. As a result of the agreement and pending the approval request, we’re also raising our sales and adjusted EPS outlook. Kimberly will discuss in more detail beyond the META agreement. So far this year we have signed ESAs totaling over 1,000 megawatts. These agreements were from multiple industries across all our operating companies and they indicate that customer growth beyond data centers remains robust in our region. We also continue to receive data center interest within our service area. After all agreements signed to date, including the recent agreement with META, we still have a pipeline of 7-12 GW of potential data center customers that are not in our plan. Moving beyond the customer growth update, I’d like to cover a few more items. Operational excellence remains a key focus area and we will talk in more detail about that at Investor Day. For today, I’ll share a couple of highlights. Orange County Advanced Power Station achieved its first fire milestone, bringing it one step closer to delivering reliable power for our customers in Texas. We expect the plant to be fully online in late summer. Recently, our power delivery team identified more than $30 million in capital savings on the Commodore to Churchill 230kV project. Our engineers developed a solution which improved the design, lowered materials cost and enabled faster customer delivery. Importantly, the improvement can be applied to future large transmission projects. This kind of innovative thinking, combined with the scale of our capital plan will continue to lower costs for customers and unlock additional customer investment opportunities. Entergy Texas is working to expand its spending generation capacity to serve a growing customer base. Following the Commission’s feedback, they issued an RFP in February for combined cycle capacity and energy across our system. We continue to expand our Renewables portfolio driven by our customers desire for clean energy options. We have active RFPs for more than 1,600 megawatts of Renewables and storage and we have over 4,500 megawatts of Renewables and storage in various stages of negotiation. After selections from prior RFPS in Arkansas, Louisiana and Mississippi. Roughly two thirds of the megawatts in negotiation would be owned. In addition, we are actively managing proposals through Louisiana’s accelerated Renewable review process. These are important tools to help us identify projects supporting customers Clean Energy Goals as we indicated on the previous earnings call, Energy Arkansas filed its base rate case in late February requesting a $45 million rate change which is less than 2%. Because bill impacts vary by customer type, the residential impact would be less than 1%. Some of the features that we requested include an optional time of use rate that provides residential customers with the opportunity to lower bills by shifting energy use to lower cost hours and low income rates that provide a 50% discount on the customer charge for households that qualify for LIHEAP assistance. We also elected to resume Entergy Arkansas Forward Test Year FRP after the rate case is resolved. Entergy Mississippi filed its annual formula rate plan with no change requested. Arkansas and Mississippi both have mechanisms that provide cash allowance for funds used during construction for investments to support significant economic development projects. To that end, Entergy Arkansas filed its first annual Generating Arkansas Jobs act rider in March and Entergy Mississippi updated its interim facilities rate adjustment in January. One additional comment about Mississippi the state recently passed legislation authorizing securitization of costs associated with Winter Storm. Fern Kimberly will provide additional details on that as well Beyond Fair Share plus Our employees continue to work every day for the benefit of the communities we serve. We recently participated in the industry’s LIHEAP Action day in Washington, D.C. to advocate for energy affordability for our customers in need. Congress approved an appropriations package that includes a $20 million increase for LIHEAP, which reflects growing recognition of the program’s importance. For more than 15 years, Entergy has also provided free tax preparation for low to moderate income customers at sites throughout Entergy’s region. In 2025, we helped customers receive $54 million in earned income tax credits, putting money directly into our customers pockets. Finally, we are very excited about our upcoming Investor Day in June. Plan to walk through the clear line of sight for our multi year strategy and outlooks in detail and you’ll hear directly from our leadership team on the opportunities ahead. Highlights will include a conversation with large customers on how we partner together to create better outcomes for our key stakeholders, a view into our operational strategy to successfully execute on the large build cycle ahead of us, a discussion of the work we are doing to unlock additional capital deployment opportunities, a review of our approach to maintaining financial discipline, and finally, a deeper dive into the significant near and long term customer growth opportunities to sustain our strong growth well beyond our five year outlook. We had a productive start to 2026 with solid progress and execution across the business and by continuing to put our customers first, we will deliver premium value to each of our key stakeholders. We look forward to discussing this in more detail with you at our Investor Day. I’ll now turn the call over to Kimberly for the financial update.

Kimberly Fontan (Chief Financial Officer)

Thank you Drew. Good morning everyone. I’ll now review our financial results and provide an update on our long term outlooks. Our results for the quarter were straightforward. Our adjusted EPS was $0.86 as shown on slide 4. The primary drivers were from the effects of investments made for our customers, including regulatory actions net of higher depreciation expense taxes other than income taxes and interest expense from financing capital expenditures. The per share increase was partially offset by a higher share count from settling equity forwards. Industrial sales growth was very strong at 15% as new and expansion projects continue to ramp up their operations. Overall retail sales increased 6%. The earnings contribution from retail sales growth was essentially neutral as higher revenue from the industrial growth was offset by the effects of weather, including positive weather in the first quarter of last year. As Drew discussed, the MEDA contract creates significant customer and community benefits. In addition, we are refreshing our outlooks to reflect the new agreement and other minor updates. The highlights are summarized on slide 5. This agreement further strengthens our retail sales outlook. We now expect approximately 8.5% compound annual retail sales growth through 2029 driven by 16%. Industrial growth data centers continue to be a significant driver along with growth from a variety of traditional Gulf south industries including lng, industrial gases, petrochemicals, agricultural chemicals and primary metals. As a reminder, we only add hyperscale data centers to our plan once we have a signed electric service agreement and then we include them at minimum bill levels. This conservative approach ensures that we can count on the revenue that we’ve included in our plan. Our customer centric four year capital plan is now $57 billion, which is 14 billion higher than our plan quarter. The increase includes the investment needs resulting from the new customer agreement, primarily seven new CCCTs as well as battery storage projects. All seven CCCTs have in service dates in 2030 and 2031 such that not all of the capital for these units is in our four year horizon. For the transmission investments in the filing, we’ve made a conservative assumption not to include them as we work through financing options. We have also not yet included the renewables or Riverbend nuclear upgrade investments discussed in our filing. These would be added to the plan as specific projects are firmed up. The equity associated with our four year plan is now $6.6 billion at the lower end of our target range of 10 to 15% of the total capital plan. Our strategy to be proactive in addressing our equity needs provides certainty and flexibility, giving us ample time to raise. We have successfully sold forward contracts through our robust ATM program as well as the block transaction we executed last March. The agreements we have in place cover about 30% of our four year need with 1.9 billion already contracted. That leaves $4.7 billion to be sourced which is not expected to be needed until late 2027 through 2029. Our forecast also includes $3 billion of hybrid instruments at parent slide 6 summarizes our credit ratings and affirms that our credit metric outlooks remain better than rating agency thresholds. Our plan reflects FFO to debt at or above 15% from Moody’s metric throughout …

Full story available on Benzinga.com

This post was originally published here

Highwoods Props (NYSE:HIW) held its first-quarter earnings conference call on Wednesday. Below is the complete transcript from the call.

This transcript is brought to you by Benzinga APIs. For real-time access to our entire catalog, please visit https://www.benzinga.com/apis/ for a consultation.

The full earnings call is available at https://events.q4inc.com/attendee/653907737

Summary

Highwoods Properties Inc reported strong leasing activity, increasing its leased rate by 50 basis points for in-service properties and 800 basis points for development properties.

The company invested $108 million in properties in Dallas and Raleigh while selling $42 million of non-core properties in Richmond, improving portfolio quality.

FFO was reported at $0.84 per share, and the company maintained its annual outlook, with expectations of significant NOI and cash flow growth as occupancy increases.

Highwoods Properties Inc plans to sell $200 million of additional non-core assets by mid-year and may use proceeds for share buybacks or further investments.

Management highlighted strong leasing performance in key markets like Dallas and Charlotte, driven by favorable demographic trends and limited new office supply.

Full Transcript

OPERATOR

Good morning and welcome to the Highwoods Properties Inc first quarter 2026 earnings call. All participants are in a listen only mode. After the speaker’s remarks, we will conduct a question and answer session. To ask a question at this time, you’ll need to press STAR followed by the number one on your telephone keypad. As a reminder, this conference call is being recorded. I would now like to turn the call over to Brendan Mayarana, Executive Vice President and Chief Financial Officer. Thank you. Please go ahead.

Brendan Mayarana (Executive Vice President and Chief Financial Officer)

Thank you operator and good morning everyone. Joining me on the call this morning are Ted Klink, our Chief Executive Officer and Brian Leary, our Chief Operating Officer. For your convenience, today’s prepared remarks have been posted on the web. If you have not received yesterday’s earnings release or supplemental, they’re both available on the Investors section of our website at highwoods.com on today’s call, our review will include non GAAP measures such as FFO, NOI and EBITDAIR. The release and supplemental include a reconciliation of these non GAAP measures to the most directly comparable GAAP financial measures. Forward looking statements made during today’s call are subject to risks and uncertainties. These risks and uncertainties are discussed at length in our press releases as well as our SEC filings. As you know, actual events and results can differ materially from these forward looking statements and the Company does not undertake a duty to update any forward looking statements. With that, I’ll turn the call over to Ted.

Ted Klink (Chief Executive Officer)

Thanks Brendan and good morning everyone. We had an excellent quarter executing on our key initiatives. Leasing volume was strong across our in service and development properties. This is clear from the 50 basis point increase in our leased rate on our in service portfolio. An 800 basis point increase in our lease rate on our developments. Both of these will deliver meaningful upside in NOI cash flow and FFO over the next few years as occupancy ramps. During the quarter we invested 108 million in best in class commute worthy properties in locations in Dallas and Raleigh through joint ventures and sold 42 million of non core properties in Richmond. All of this activity improves our portfolio and further cements the foundation for pushing our growth rate and cash flows meaningfully higher and will result in long term value creation for our shareholders. Even with our strong performance in the quarter, we recognize the broader narrative that advances in AI could reshape the workforce and therefore affect long term office demand. The range of potential outcomes is wide and varied and at this point there are many unknowns. What we do know however is that customers and prospects haven’t diminished their appetite for space and are making long term commitments to their in office strategies. Activity across our portfolio, our markets and our is strong. Leasing was solid in the quarter. Our leasing pipeline remains robust, high quality space across our is dwindling and there’s little to no new supply expected during the foreseeable future. This flight to quality dynamic creates a strong backdrop for occupancy gains and rent growth both of which we experienced in the first quarter. Additionally, credit worthy customers are willing to make long term commitments as evidenced by our weighted average lease term on second gen lease volume of seven and a half years more than one year longer than our recent average lease term. Further, demographic trends across our footprint are favorable with business relocations and expansions reaccelerating driving healthy population and job growth. We firmly believe high quality commute worthy properties and locations owned by well capitalized landlords are best positioned to capture increasing demand and improving economics. Turning to the quarter, we delivered solid financial performance with FFO of $0.84 per share and we maintained our outlook for the year. Our leasing performance was Excellent. We signed 958,000 square feet of second gen leases including over 300,000 square feet of new leases. We delivered gap rent growth of 19.4% and cash rent growth of 4.8%. Net effective rents were the second highest in company history and 9% higher than the prior five quarter average expansions which we include as renewals outpace contractions at a ratio of nearly 2 to 1. In addition, we signed 107,000 square feet in the first gen leases across our development properties. Customers and prospects recognize the blocks of high quality located office space with well capitalized owners are diminishing across our footprint which gives us strong pricing power in the best sub markets. We placed in service more than 200 million of 87% leased development properties during the quarter. Glen Lake 3, which comprises 203,000 square feet of office and 15,000 square feet of retail is now 94% leased. Across the street we delivered Glen Lake 2 retail which is 100% leased to Crooked Hammock Brewery. The addition of 24,000 square feet of food and beverage options elevates Glen Lake’s offerings and complements the nearly 1 million square feet of office we have here. This has supported our ability to push rents across this park in West Raleigh. We also placed in Service Granite Park 6 and Dallas’s Legacy. This 422,000 square foot best in class office property is 80% leased. We also made strong progress leasing up our two remaining development properties 23 Springs, our 642,000 square foot development project in Uptown Dallas continues to garner strong activity with the least rate now 83% up from 75% last quarter and 62% 12 months ago. We have strong prospects to bring our leased rate at 23 Springs into the 90s. In Tampa’s West Shore, our 143,000 square foot Midtown east development is now 95% leased, up from 76% last quarter and 39% 12 months ago. The office component at Midtown east is 100% leased on a combined basis. The properties placed in Service during the first quarter and in our remaining development pipeline for 86% leased but only 48% occupied. As the leases commence, we will capture significant growth in NOI cash flow and FFO. We are starting to receive interest from build to suit and sizable anchor prospects for potential new development. It’s still early and it’s hard to say whether any of these discussions will result in new projects, but the increased interest is encouraging and signifies the limited inventory companies face when searching for large blocks of high quality space. On the disposition front, we sold a non core portfolio in Richmond for 42 million. As reflected in our outlook, we expect to sell roughly 200 million of additional non core assets by the middle of this year and are marketing other assets for sale. We believe we will be able to redeploy capital from non core asset and land sales on a leverage neutral basis that will further strengthen our cash flows and result in higher growth. As we announced last week, we may also use non core disposition proceeds to repurchase up to 250 million of outstanding shares of our common stock on a leverage neutral basis. We continue to evaluate acquisition opportunities and highly pre leased developments, but repurchasing our shares is another capital deployment option we now have in our arsenal. Before turning the call over to Brian, I want to reiterate the priorities we have highlighted over the past few years that will drive long term value creation for our shareholders. First, we will continue to drive occupancy towards stabilized levels in our operating portfolio. Second, we will deliver and stabilize our development pipeline. Third, we will improve our portfolio quality and long term growth rate by recycling out of non core capex intensive assets in non locations and invest in properties with better cash flows and higher long term growth rates. And fourth, we will do all this while maintaining a strong and flexible balance sheet. We made meaningful progress on each of these priorities during the first quarter. We believe the focus on these 4 areas combined with a strong fundamental backdrop in our core due to the healthy demand and limited new supply will drive significant growth in cash flow and long term value over the next several years.

Brian Leary (Chief Operating Officer)

Brian thanks Ted and good morning everyone. Our operating results continue to reflect the advantage of owning commute worthy amenitized assets in the best business districts of high growth Sunbelt metros. Fundamentals across our markets continue to improve as evidenced by vacancy rates and sublease space. Declining rents are up which combined with steady concession packages has resulted in higher net effective rents. As far as supply goes, the best of the best and the best of the rest are in high demand. With office construction at historic lows or non existent in many markets, new office inventory is in scarce supply with demolitions outpacing deliveries nationwide. The flight to quality has become in many cases an all out sprint to quality with users proactively inquiring for early extensions to lock in location and terms. A common theme across our markets is that office rents pale in comparison to the investment customers have in their people and that exceptional environments and experiences yield superior results when their people are in the office and being better together. Customers are choosing well located, highly amenitized Class A buildings with well capitalized owners and customer centric operations and they are willing to pay for it. They are moving to metros that continue to win people and companies with the highest quality of life and most business friendly outlooks. This is the Highwoods Portfolio. This is the Highwoods team and these are our Sunbelt markets and BBDss. Starting with Dallas, the Metroplex remains one of the country’s premier destinations for corporate headquarters and expansions, which shouldn’t be a surprise at this point considering it is Site Selection Magazine’s number one city for headquarter relocations and as in the state Chief Executive Magazine has deemed as the best for business 21 consecutive years from 2018 through 2024, Dallas landed roughly 100 headquarter relocations, with 11 more in 2025. The region continues to attract diverse firms across financial and professional services, advanced manufacturing, logistics and life sciences seeking a central location, business friendly environment and a deep labor pool. That macro story is consistent with the office fundamentals you see in the Q1 broker data. According to Cushman and Wakefield, VFW recorded 117,000 square feet of positive net absorption in the first quarter of 2026, its fifth consecutive positive quarter, with nearly 340,000 square feet of positive absorption in Class A. As Class B continues to shed space, our Dallas portfolio is in Uptown, Legacy and Preston center which is the tightest submarket in the region with less than 6% vacancy and is home to one of our latest acquisitions, the terraces. These BBDss are squarely in the path of demand. The mark to market we’re realizing via second generation leasing both at McKinney and Olive and the Terraces is significant, generating gap rent spreads of 27%. Turning to Charlotte, the city is increasingly recognized as a strategic hub that’s being validated by headline corporate decisions. Among the 104 metros that Cushman and Wakefield tracks, Charlotte was number one for job growth. To that end and subsequent to our most recent earnings call in February, three global financial institutions have made major new job announcements already with an established home in Charlotte South Park DBD, where we have almost 800,000 square feet. JP Morgan recently announced plans for an eventual 1,000 job regional hub with 400 of those to be hired by 2028. Two new entries to the market include Capital Group’s Plan New Home in Uptown with 600 new employees and after a nationwide search, Sumitomo Mitsui Banking Group, one of Japan’s largest banks, selected Uptown as well for a second US headquarters, creating 2,000 jobs by the end of 2032, with an average salary for these 2,000 jobs projected to be over $165,000 a year. This macro backdrop aligns perfectly with Q1 office fundamentals. CBRE noted approximately 410,000 square feet of positive net absorption in the first quarter and total leasing volume of roughly 1.4 million square feet up nearly 74% year over year, with about 70% of that volume in …

Full story available on Benzinga.com

This post was originally published here

Carvana Co (NYSE:CVNA) delivered financial results for the first quarter after the closing bell on Wednesday. Here’s what you need to know from the report.

Carvana Q1 Highlights

Carvana reported first-quarter revenue of $6.43 billion, beating analyst estimates of $6.08 billion, according to Benzinga Pro. The company reported first-quarter earnings of $1.69 per share, beating estimates of $1.50 per share.

Total revenue increased 52% year-over-year after Carvana sold 187,393 vehicles in …

Full story available on Benzinga.com

This post was originally published here

Teladoc Health (NYSE:TDOC) reported mixed first-quarter financial results that have shares falling on Wednesday after market close.

Here are the key highlights.

• Teladoc Health stock is among today’s weakest performers. Why is TDOC stock falling?

Teladoc Q1 Earnings

Teladoc reported first-quarter revenue of $613.8 million, down 2% year-over-year. The revenue total beat a Street consensus estimate of $610.9 million, according to data from Benzinga Pro.

Integrated Care revenue was $395.4 million in the quarter, up 2% year-over-year.

BetterHelp revenue was $218.4 million in the quarter, down 9% year-over-year.

The company reported a net loss of 36 cents per share, missing a Street consensus estimate of a loss of 33 cents per share.

Adjusted EBITDA margins were 14.2% and 0.9% for Integrated Care and BetterHelp, respectively.

“We delivered a good start to 2026, with first quarter consolidated revenue and adjusted EBITDA …

Full story available on Benzinga.com

This post was originally published here

MGM Resorts International (NYSE:MGM) reported mixed first-quarter results after Wednesday’s closing bell, missing analyst earnings estimates. 

Here’s a look at the details inside the report. 

MGM Q1 Details       

MGM Resorts reported quarterly earnings of 49 cents per share, which missed the analyst consensus estimate of 53 cents, according to Benzinga Pro data. 

Quarterly revenue came in at $4.45 billion, which beat the Street estimate of $4.37 billion.

MGM reported the following first-quarter business highlights:

  • Las Vegas Strip Resorts’ quarterly net revenues increased year-over-year for …

Full story available on Benzinga.com

This post was originally published here

Chipotle Mexican Grill, Inc. (NYSE:CMG) shares climbed after the fast-serve restaurant reported first-quarter results following Wednesday’s closing bell.

Here’s a look at the details inside the report. 

Chipotle Q1 Details       

Chipotle Mexican Grill reported quarterly earnings of 24 cents per share, in line with analyst expectations.

Quarterly revenue of $3.09 billion beat the Street estimate of $3.07 billion, according to Benzinga Pro data. 

Chipotle reported the following first-quarter highlights, year over year:

  • Opened 49 company-owned restaurants, with 42 locations, including a Chipotlane.
  • Total …

Full story available on Benzinga.com

This post was originally published here

KLA Corp. (NASDAQ:KLAC) reported financial results for the third quarter of fiscal 2026 after the market close on Wednesday. Here’s a look at the key metrics.

KLA Corp. Q3 Results & Outlook

  • Q3 Revenue: $3.42 billion, versus estimates of $3.37 billion
  • Q3 Adjusted EPS: $9.40, versus estimates of $9.14

KLA Corp. expects fiscal fourth-quarter revenue to be in the range of $3.38 billion to $3.78 billion versus estimates of $3.54 billion, according to Benzinga Pro. The company anticipates …

Full story available on Benzinga.com

This post was originally published here

Since the establishment of Modern Portfolio Theory in the 1950s, the 60/40 portfolio has been the “set it and forget it” gold standard of investing. Its logic was simple – when stocks took a tumble, bonds acted as the shock absorber.

But, in 2026, that spring has gone damp. Bonds are no longer behaving like the defensive anchor they once were.

Recent research from KKR confirms what investors might already have suspected – a fraying relationship between stocks and bonds. Instead of moving in opposite directions, the two asset classes are becoming increasingly positively correlated. When the “risk-off” switch is flipped, both sides of the traditional portfolio are now bleeding at the same time.

The Great Repositioning

This shift isn’t just a theoretical headache for retail investors; the world’s biggest “smart money” players have been front-running this reality for years.

Norway’s $2.1 trillion Sovereign Wealth Fund, the world’s largest, has slowly rewritten its playbook. Once a conservative giant with roughly 40% in equities in the late 2000s, the fund has pushed its equity exposure as high as 70%.

Yet, despite …

Full story available on Benzinga.com

This post was originally published here

SNDL Inc (NASDAQ:SNDL) shares are trading lower on Wednesday afternoon after reporting first-quarter financial results that featured a revenue miss. Here’s what investors need to know.

SNDL Q1 Financial Performance and Segment Data

The company posted a net loss of four cents per share, which was in line with analyst expectations, but its net revenue of $195.9 million fell short of the estimated $210.3 million.

This performance represents a 4.4% revenue decrease from the same period in the prior year, a decline primarily driven by market headwinds impacting both the liquor and cannabis segments.

The liquor retail division saw revenue slide 4.9% to $104.1 …

Full story available on Benzinga.com

This post was originally published here

Families of victims involved in a mass shooting on Feb. 10 in Tumbler Ridge, British Columbia, sued Sam Altman and OpenAI in San Francisco federal court.

The plaintiffs claim that OpenAI’s chatbot, ChatGPT, failed to alert authorities to the mass shooting.

The mother of one of the victims, a 12-year-old girl who remains in the ICU, filed the first lawsuit. Another mother, whose child was killed, filed a second lawsuit. Other victims and their families plan to file more lawsuits in the coming weeks, The Guardian reported.

The shooter, identified as 18-year-old Jesse Van Rootselaar, carried out a mass shooting at Tumbler Ridge Secondary School. Eight people died. The victims included Van Rootselaar’s mother and stepbrother before the shooting, as well as six others at a school. Five of the victims were children. More than two dozen additional people were injured.

Van Rootselaar was found dead at the scene from what investigators believe was a self-inflicted gunshot wound.

OpenAI employees flagged the shooter’s account eight months before the …

Full story available on Benzinga.com

This post was originally published here

Rush Enterprises (NASDAQ:RUSHB) held its first-quarter earnings conference call on Wednesday. Below is the complete transcript from the call.

Benzinga APIs provide real-time access to earnings call transcripts and financial data. Visit https://www.benzinga.com/apis/ to learn more.

Access the full call at https://edge.media-server.com/mmc/p/rc4sc8fa/

Summary

Rush Enterprises Inc reported first quarter 2026 revenues of $1.68 billion, with net income of $61.5 million or $0.77 per diluted share.

The company declared a quarterly cash dividend of $0.19 per share, emphasizing its commitment to returning value to shareholders.

Despite a challenging commercial vehicle market, the company expects the first quarter to be the trough and anticipates improvement driven by increased order activity and customer optimism.

Aftermarket services, leasing, and rental businesses remained strong and contributed significantly to profitability, with the aftermarket business accounting for 66% of gross profit.

Strategic initiatives included signing an agreement to acquire Peterborough dealerships in Louisiana and Mississippi, expected to close in June.

Management highlighted the importance of emissions regulations and the anticipated impact on future truck sales, with a focus on maintaining inventory levels and managing costs effectively.

The company expects gradual improvement in truck sales and aftermarket performance, supported by improving freight conditions and customer sentiment.

Full Transcript

OPERATOR

Good day and thank you for standing by. Welcome to Rush Enterprises Inc’s first quarter 2026 earnings conference call. At this time, all participants are in a listen only mode. After the speaker’s presentation, there’ll be a question and answer session. To ask a question during the session, you’ll need to press star 11 on your telephone. You will then hear an automated message advising your hand is raised to withdraw your question. Please press star 11 again. Please be advised that today’s conference is being recorded. I would now like to turn the conference over to your speaker for today, Rusty Rush, Chairman, CEO and President. Please go ahead.

Rusty Rush (Chairman, CEO and President)

Well, good morning and welcome to our first quarter 2026 earnings release call. With me on the call this morning are Steve Keller, Chief Financial Officer, Jody Pollard, Chief Operating Officer, Jay Hazelwood, Vice President Controller, and Michael Goldstone, Senior Vice President, General Counsel and Corporate Secretary. Before I get started, Steve will say a few words regarding forward looking statements.

Steve Keller (Chief Financial Officer)

Certain statements we will make today are considered forward looking statements as defined in the Private Securities Litigation Reform act of 1995. Because these statements include risks and uncertainties, our actual results may differ materially from those expressed or implied by such forward looking statements. Important factors that could cause actual results to differ materially from those expressed or implied by such forward looking statements include but are not limited to or those discussed in our annual report on Form 10-K for the year ended December 31, 2025 and in our other filings with the Securities and Exchange Commission.

Rusty Rush (Chairman, CEO and President)

Thank you Steve and thanks everyone for joining us today. As we reported yesterday, we generated revenues of $1.68 billion in the first quarter with net income of $61.5 million or 77 cents per diluted share. We also declared a quarterly cash dividend of $0.19 per share, which reflects our continued focus on returning value to shareholders. Now, stepping back for a minute, the first quarter was still a tough environment for the commercial vehicle market industry wide. Retail sales for new trucks remained at historically low levels and we’re still working through the effects of the freight recession, excess capacity and general economic uncertainty. That said, we do believe this quarter represents the trough of the cycle and more importantly, we’re starting to see some early signs that things are moving in the right direction. Freight rates improved a bit, miles driven began to pick up, and customer sentiment started to feel a little more optimistic. As a result, we saw increased quoting activity and order intake as the quarter progressed, especially from our large fleet customers. That hasn’t translated into sustained strength in truck sales yet, but it’s a good leading indicator and gives us Confidence that demand is starting to come back. One thing that stood out again this quarter is the strength of our business model. Even with soft truck sales, our aftermarket leasing and rental businesses, along with disciplined expense management, helped us stay very profitable and perform well overall. We also stayed focused on growing the business. During the quarter, we signed an agreement to acquire Peterbilt dealerships in southern Louisiana and Mississippi. We expect to close that deal and begin operating those locations as Rush Truck Centers in June. So even in a down cycle, we continue to invest in the business, expanding into new markets and positioning ourselves for long term growth. Our aftermarket business continues to be a key strength for us. It made up roughly 66% of our gross profit in the quarter and generated 627 million in revenue, up slightly year over year. Demand was still soft in some segments, excuse me, especially for some of our over the road customers. But overall we were able to deliver growth, which speaks to the strength of our relationships and our execution. We also started seeing to starting to see some positive indicators here. More freight activities and more miles being driven, which should translate into stronger parts and service demand as customers begin catching up on deferred maintenance. Our aftermarket strategic initiatives are also making a difference. Our inspection processes and parts delivery optimization have gained traction across our network and are delivering incremental revenue, increasing uptime for our customers and delivering a better experience overall. Looking ahead, we expect the aftermarket to gradually improve as we move through the year and continue to be a key driver for our performance. Turning to truck sales, the market was still very tough in the first quarter with Class 8 truck sales at their lowest level since COVID But even in that environment, we performed well. We sold 2,964 Class 8 trucks in the US and captured a 7.2% market share. That really comes down to execution, having the right inventory and the diversity of our customer base. As I mentioned earlier, we saw solid order activity and increased engagement from customers during the quarter. We think that’s being driven by improving freight conditions and customers beginning to plan for 2027 engines. Emissions emissions regulations Class 4 through 7 truck sales saw the worst demand since 2015, but our results were more about timing than demand. Some large fleet customers pushed deliveries until later in the year, so we expect that to benefit benefit us in the coming quarter. Used truck demand improved as we move through the quarter and we’re seeing better conditions tied to improving spot rates and tighter capacity. So overall, while the first quarter was slow, we expect sales to improve gradually in the second quarter and then pick up in the second Pick up more in the second half of the year. Renewal leasing continue to be strong and growing part of our business. Revenue was 92 million in the quarter, up a little over 2%. Year over year. Leasing demand remains strong as customers look to replace aging equipment and get ahead of cost increases tied to the upcoming emissions regulations. Rental is below where we’d like it to be, driven by current market conditions, but it did improve as the quarter progressed, and we expect the utilization to continue trending up through the year. Overall, rush truck leasing continues to generate consistent reoccurring revenue and remains an important contributor to our performance. So to wrap it up, the first quarter reflected the ongoing pressure from the freight recession and weak truck demand. But we delivered solid earnings and profitability. That speaks to the strength and balance of our business. We believe we’re at the bottom of the cycle and we’re encouraged by early signs we are seeing whether that’s freight customer activity or order trends. As conditions continue to improve, we believe we’re well positioned to capture that demand and grow the business. Before I close, I want to thank our employees across the company. Their focus, discipline and commitment to our customers continue to drive our performance, especially in a very challenging environment like this. With that, I’ll take your questions.

OPERATOR

Thank you. As a reminder, if you’d like to ask a question, please press Star one one on your telephone. You’ll hear the automated message advising your hand is raised. We also ask that you please wait for your name and company to be announced before proceeding with your question. One moment while we compile the Q and A roster, our first question for the day will be coming from the line of avi. Audrey Lashwin of ubs. Your line is open.

Audrey Lashwin (Equity Analyst at UBS)

Hey, good morning, guys. So glad to see that the year is still on track for improvement sequentially. But, you know, just thinking about the second half year, it sounds like there’s still a decent amount of uncertainty around the pre buy for this year on just a number of fronts. Whether the OEMs (Original Equipment Manufacturers) are going to have new engines ready and how the rules are going to be enforced and the demand dynamics around that. Can you just give us a rundown on how those different moving parts are shaping your expectations??

Rusty Rush (Chairman, CEO and President)

Well, that’s a good statement there, avi. It’s kind of crazy, isn’t it? We’re. What are we? We’re April 30 tomorrow. We got eight months left in the year and we still don’t have definitive regulations printed. Okay, now, when I’m talking about emissions regulations, they have sent out signals and told People the EPA has of what they’re going to do, right, they’re going to keep supposedly at 0.35, but they have not clarified about credits, et cetera. If there’s going to be NCPs (Noncompliance Penalties), things like that, we’re probably still 60 days away from it. But regardless of that, we do know that there are going to be new emissions regulations, you know, so I think that’s spurred customers to go ahead. You know, order activity, as you can see starting in December has been up dramatically from where it was the prior seven or eight months from order intake. So you know, even with that uncertainty, you know there is certainty of something going down. Exactly what it is we’re not exactly sure because it hasn’t been posted by the EPA yet. So you know, we’ll still have to follow that and see. We hope to know within the next 45 to 60 days. But if I had been, if I told you that 45 days ago and held my breath, I wouldn’t be in very good shape because I told you I’d known by now. So it keeps getting, the candy is keep getting kicked down the road a little bit. So I think the most important thing is that, you know, customers, business is people are more optimistic finally because of the contraction on the supply side, right, of taking trucks out, whether it was through non domicile building less trucks in the back half of last year, building less trucks in the first quarter of this year, we slowed the intake down so the supply side squeezed down. Customers are more optimistic about rates coming in. If you’d asked me three or four months ago, everybody said, I know this is one of your questions, but you know me, I’m going to ramble on that, you know, we’re going to be flat to low singles and it was mid singles and now people look at maybe high single digit increases. So people are optimistic at the same time to your point about emissions not knowing clear, not knowing clearly what it’s going to be, what the state is. But we do know it’s going to be worse whether there would be NCPs (Noncompliance Penalties) and the cost would go up dramatically or the total enforcement of what’s out there for EPA. January 27th. So that’s about the best thing I can tell you is there’s still uncertainty but you know, something’s coming down the tracks. Right. You just don’t know exactly what. Got it.

Audrey Lashwin (Equity Analyst at UBS)

Appreciate that Rusty. And just to follow on a point there. So thinking about the improving conditions within the freight market, as you just noted, really more driven by supply reductions, capacity reductions that doesn’t necessarily help the parts and service side as much as improving freight activity. So what are you seeing there and when do you think we might see parts and service volumes inflect positively?

Rusty Rush (Chairman, CEO and President)

Yep. You know, it’s funny, people, theoretically, you know, people believe that when truck sales go down,, okay, that you’re going to get more parts than service. Well, that’s not really actually the case because people are cutting back their budgets and things. And that’s what we’ve seen. Right. That’s why we’ve been fairly flat over the last couple three quarters. Right. We’ve even in spite of inflation, we’ve had, we’ve remained flat. And that’s because people have tightened their belts. The best thing I can see is for their business to get better. Right. Historically, when customers feel better about looking forward and more optimistic, there will be no postponement of any maintenance or repairs because it’s just like anything, you know, when your income level goes down, you learn how to take your outcome, what you spend down too. It’s no different than you as a person managing your household. So that’s what customers have done. The most encouraging thing for me is going to be hopefully seeing second and third quarter releases and listen and hearing about contract rates going up. So that optimistic, that optimism that we see out there, you know, comes to fruition is the best way I can describe it. We expect, I would tell you this, we’ve been going slightly, I’m not happy with it, but we have gradually gone January. February was better than January, March was better than February, and April looks like it’s going to be a little …

Full story available on Benzinga.com

This post was originally published here

On Wednesday, Rush Enterprises (NASDAQ:RUSHA) discussed first-quarter financial results during its earnings call. The full transcript is provided below.

Benzinga APIs provide real-time access to earnings call transcripts and financial data. Visit https://www.benzinga.com/apis/ to learn more.

The full earnings call is available at https://edge.media-server.com/mmc/p/rc4sc8fa/

Summary

Rush Enterprises Inc reported first quarter 2026 revenues of $1.68 billion with a net income of $61.5 million or $0.77 per diluted share. A quarterly cash dividend of $0.19 per share was declared.

The company noted challenges in the commercial vehicle market due to a freight recession and economic uncertainty but observed early signs of recovery with improved freight rates and increased customer sentiment.

Strategic growth included signing an agreement to acquire Peterborough dealerships in Louisiana and Mississippi, expected to be operational in June.

Aftermarket business remained a key strength, contributing 66% of gross profit with $627 million in revenue, showing slight growth year-over-year despite soft demand in some segments.

Truck sales were impacted with Class 8 sales at their lowest since COVID, but the company maintained a 7.2% market share, and improved order activity was noted, especially from large fleet customers.

Leasing and rental businesses continued to perform well, with leasing revenue up over 2% year-over-year.

Management expressed optimism for gradual improvement in sales and parts and service demand throughout the year, citing improving freight conditions and upcoming emissions regulations as drivers.

The company focused on disciplined expense management, maintaining solid earnings and profitability despite market pressures.

Full Transcript

OPERATOR

Good day and thank you for standing by. Welcome to Rush Enterprises Inc’s first quarter 2026 earnings conference call. At this time, all participants are in a listen only mode. After the speaker’s presentation, there’ll be a question and answer session. To ask a question during the session, you’ll need to press star 11 on your telephone. You will then hear an automated message advising your hand is raised to withdraw your question. Please press star 11 again. Please be advised that today’s conference is being recorded. I would now like to turn the conference over to your speaker for today, Rusty Rush, Chairman, CEO and President. Please go ahead.

Rusty Rush (Chairman, CEO and President)

Well, good morning and welcome to our first quarter 2026 earnings release call. With me on the call this morning are Steve Keller, Chief Financial Officer; Jody Pollard, Chief Operating Officer Jay Hazelwood, Vice President and Controller and Michael Goldstone, Senior Vice President, General Counsel and Corporate Secretary. Before I get started, Steve will say a few words regarding forward looking statements.

Steve Keller (Chief Financial Officer)

Certain statements we will make today are considered forward looking statements as defined in the Private Securities Litigation Reform act of 1995. Because these statements include risks and uncertainties, our actual results may differ materially from those expressed or implied by such forward looking statements. Important factors that could cause actual results to differ materially from those expressed or implied by such forward looking statements include but are not limited to or those discussed in our annual report on Form 10K for the year ended December 31, 2025 and in our other filings with the securities and Exchange Commission (SEC).

Rusty Rush (Chairman, CEO and President)

Thank you Steve and thanks everyone for joining us today. As we reported yesterday, we generated revenues of $1.68 billion in the first quarter with net income of $61.5 million or $0.77 per diluted share. We also declared a quarterly cash dividend of $0.19 per share., which reflects our continued focus on returning value to shareholders. Now, stepping back for a minute, the first quarter was still a tough environment for the commercial vehicle market industry wide. Retail sales for new trucks remained at historically low levels and we’re still working through the effects of the freight recession, excess capacity and general economic uncertainty. That said, we do believe this quarter represents the trough of the cycle and more importantly, we’re starting to see some early signs that things are moving in the right direction. Freight rates improved a bit, miles driven began to pick up, and customer sentiment started to feel a little more optimistic. As a result, we saw increased quoting activity and order intake as the quarter progressed, especially from our large fleet customers. That hasn’t translated into sustained strength in truck sales yet, but it’s a good leading indicator and gives us Confidence that demand is starting to come back. One thing that stood out again this quarter is the strength of our business model. Even with soft truck sales, our aftermarket leasing and rental businesses, along with disciplined expense management, helped us stay very profitable and perform well overall. We also stayed focused on growing the business. During the quarter, we signed an agreement to acquire Peterborough dealerships in southern Louisiana and Mississippi. We expect to close that deal and begin operating those locations as Rush Truck Centers in June. So even in a down cycle, we continue to invest in the business, expanding into new markets and positioning ourselves for long term growth. Our aftermarket business continues to be a key strength for us. It made up roughly 66% of our gross profit in the quarter and generated 627 million in revenue, up slightly year over year. Demand was still soft in some segments, excuse me, especially for some of our over the road customers. But overall we were able to deliver growth, which speaks to the strength of our relationships and our execution. We also started seeing to starting to see some positive indicators here. More freight activities and more miles being driven, which should translate into stronger parts and service demand as customers begin catching up on deferred maintenance. Our aftermarket strategic initiatives are also making a difference. Our inspection processes and parts delivery optimization have gained traction across our network and are delivering incremental revenue, increasing uptime for our customers and delivering a better experience overall. Looking ahead, we expect the aftermarket to gradually improve as we move through the year and continue to be a key driver for our performance. Turning to truck sales, the market was still very tough in the first quarter with Class 8 industry sales at their lowest level since COVID But even in that environment, we performed well. We sold 2,964 Class 8 trucks in the US and captured a 7.2% market share. That really comes down to execution, having the right inventory and the diversity of our customer base. As I mentioned earlier, we saw solid order activity and increased engagement from customers during the quarter. We think that’s being driven by improving freight conditions and customers beginning to plan for 2027 engines. Emissions emissions regulations Class 4 through 7 truck sales saw the worst demand since 2015, but our results were more about timing than demand. Some large fleet customers pushed deliveries until later in the year, so we expect that to benefit benefit us in the coming quarter. Used truck demand improved as we move through the quarter and we’re seeing better conditions tied to improving spot rates and tighter capacity. So overall, while the first quarter was slow, we expect sales to improve gradually in the second quarter and then pick up in the second Pick up more in the second half of the year. Renewal leasing continue to be strong and growing part of our business. Revenue was 92 million in the quarter, up a little over 2%. Year over year. Leasing demand remains strong as customers look to replace aging equipment and get ahead of cost increases tied to the upcoming emissions regulations. Rental is below where we’d like it to be, driven by current market conditions, but it did improve as the quarter progressed, and we expect the utilization to continue trending up through the year. Overall, rush truck leasing continues to generate consistent reoccurring revenue and remains an important contributor to our performance. So to wrap it up, the first quarter reflected the ongoing pressure from the freight recession and weak truck demand. But we delivered solid earnings and profitability. That speaks to the strength and balance of our business. We believe we’re at the bottom of the cycle and we’re encouraged by early signs we are seeing whether that’s freight customer activity or order trends. As conditions continue to improve, we believe we’re well positioned to capture that demand and grow the business. Before I close, I want to thank our employees across the company. Their focus, discipline and commitment to our customers continue to drive our performance, especially in a very challenging environment like this. With that, I’ll take your questions.

OPERATOR

Thank you. As a reminder, if you’d like to ask a question, please press Star one one on your telephone. You’ll hear the automated message advising your hand is raised. We also ask that you please wait for your name and company to be announced before proceeding with your question. One moment while we compile the Q and A roster, our first question for the day will be coming from the line of Avi Audrey Lashwin of ubs. Your line is open.

Avi Audrey Lashwin

Hey, good morning, guys. So glad to see that the year is still on track for improvement sequentially. But, you know, just thinking about the second half year, it sounds like there’s still a decent amount of uncertainty around the pre-buy for this year on just a number of fronts. Whether the Original Equipment Manufacturers (OEMs) are going to have new engines ready and how the rules are going to be enforced and the demand dynamics around that. Can you just give us a rundown on how those different moving parts are shaping your expectations?

Rusty Rush (Chairman, CEO and President)

Well, that’s a good statement there, avi. It’s kind of crazy, isn’t it? We’re. What are we? We’re April 30th tomorrow. We got eight months left in the year and we still don’t have definitive regulations printed. Okay, now, when I’m talking about emissions regulations, they have sent out signals and told People the Environmental Protection Agency (EPA) has of what they’re going to do, right, they’re going to keep supposedly at 0.35, but they have not clarified about credits, et cetera. If there’s going to be NCPS, things like that, we’re probably still 60 days away from it. But regardless of that, we do know that there are going to be new emissions regulations, you know, so I think that’s spurred customers to go ahead. You know, order activity, as you can see starting in December has been up dramatically from where it was the prior seven or eight months from order intake. So you know, even with that uncertainty, you know there is certainty of something going down. Exactly what it is we’re not exactly sure because it hasn’t been posted by the Environmental Protection Agency (EPA) yet. So you know, we’ll still have to follow that and see. We hope to know within the next 45 to 60 days. But if I had been, if I told you that 45 days ago and held my breath, I wouldn’t be in very good shape because I told you I’d known by now. So it keeps getting, the candy is keep getting kicked down the road a little bit. So I think the most important thing is that, you know, customers, business is people are more optimistic finally because of the contraction on the supply side, right, of taking trucks out, whether it was through non domicile building less trucks in the back half of last year, building less trucks in the first quarter of this year, we slowed the intake down so the supply side squeezed down. Customers are more optimistic about rates coming in. If you’d asked me three or four months ago, everybody said, I know this is one of your questions, but you know me, I’m going to ramble on that, you know, we’re going to be flat to low singles and it was mid singles and now people look at maybe high single digit increases. So people are optimistic at the same time to your point about emissions not knowing clear, not knowing clearly what it’s going to be, what the state is. But we do know it’s going to be worse whether there would be NCPS and the cost would go up dramatically or the total enforcement of what’s out there for Environmental Protection Agency (EPA). January 27th. So that’s about the best thing I can tell you is there’s still uncertainty but you know, something’s coming down the tracks. Right. You just don’t know exactly what. Got it.

Avi Audrey Lashwin

Appreciate that Rusty. And just to follow on a point there. So thinking about the improving conditions within the freight market, as you just noted, really more driven by supply reductions, capacity reductions that doesn’t necessarily help the parts and service side as much as improving freight activity. So what are you seeing there and when do you think we might see parts and service volumes inflect positively?

Rusty Rush (Chairman, CEO and President)

Yep. You know, it’s funny, people, theoretically, you know, people believe that when truck sales go down, okay, that you’re going to get more parts and service. Well, that’s not really actually the case because people are cutting back their budgets and things. And that’s what we’ve seen. Right. That’s why we’ve been fairly flat over the last couple three quarters. Right. We’ve even in spite of inflation we’ve had, we’ve remained flat. And that’s because people have tightened their belts. The best thing I can see is for their business to get better. Right. Historically, when customers feel better about looking forward and more optimistic, there will be no postponing of any maintenance or any repairs because it’s just like anything, you know, when your income level goes down, you learn how to take your outcome, what you spend down too. It’s no different than you as a person managing your household. So that’s what customers have done. The most encouraging thing for me is going to be hopefully seeing second and third quarter releases and listen and hearing about contract rates going up. So that optimistic, that optimism that we see out there, you know, comes to fruition is the best way I can describe it. We expect, I would tell you this, we’ve been going slightly, I’m not happy with it, but …

Full story available on Benzinga.com

This post was originally published here

Old Dominion Freight Line (NASDAQ:ODFL) reported first-quarter financial results on Wednesday. The transcript from the company’s first-quarter earnings call has been provided below.

Benzinga APIs provide real-time access to earnings call transcripts and financial data. Visit https://www.benzinga.com/apis/ to learn more.

The full earnings call is available at https://event.choruscall.com/mediaframe/webcast.html?webcastid=D3KvR7xX

Summary

Old Dominion Freight Line Inc reported a 2.9% year-over-year decline in revenue for Q1 2026, totaling $1.33 billion, despite an improvement in LTL volumes later in the quarter.

The company maintained a 99% on-time service and a claims ratio below 0.1% while focusing on yield management to support strategic investments.

Old Dominion Freight Line Inc plans to invest $265 million in 2026, continuing its strategy to prepare for future growth and handle increased volumes.

The company’s operating ratio increased by 80 basis points to 76.2% due to higher overhead costs, though direct operating costs improved.

Management expressed confidence in market share growth, supported by a strong service proposition and continued investment in employee development and infrastructure.

April 2026 revenue per day showed improvement despite a 6.5% decrease in LTL tons per day, indicating potential for sequential growth in Q2.

Old Dominion Freight Line Inc highlighted its strategic focus on maintaining superior service and cost discipline, with expectations of benefiting from improved demand and market share gains.

Full Transcript

OPERATOR

Good day and welcome to the Old Dominion Freight Line Inc first quarter 2026 earnings conference call. All participants will be in listen only mode. Should you need assistance, please signal a conference specialist by pressing the star key followed by zero. After today’s presentation, there will be an opportunity to ask questions. To ask a question, you may press star then one on a touchtone phone. To withdraw your question, please press Star then two. Please note this event is being recorded. I would now like to turn the conference over to Jack Atkins. Please go ahead.

Jack Atkins

Thank you, Dorwin. Good morning, everyone, and welcome to the first quarter 2026 conference call for Old Dominion Freight Line Inc. Today’s call is being recorded and will be available for replay beginning today and through April 29, 2026 by dialing 1-855-669-9658, access code 769-9494. The replay of the webcast may also be accessed for 30 days at the company’s website. This conference call may contain forward looking statements within the meaning of the Private Securities Litigation Reform Act of 1995, including statements, among others, regarding Old Dominion’s expected financial and operating performance. For this purpose, any statements made during this call that are not statements of historical fact may be deemed to be forward looking statements. Without limiting the foregoing, the words believes, anticipates, plans, expects and similar expressions are intended to identify forward looking statements. You are hereby cautioned that these statements may be affected by the important factors, among others, set forth in Old Dominion’s filings with the Securities and Exchange Commission and in this morning’s news release. Consequently, actual operations and results may differ materially from the results discussed in the forward looking statements. The Company undertakes no obligation to publicly update any forward looking statements, whether as a result of new information, future events or otherwise. Finally, before we begin, we note that we welcome your questions today, but ask that you limit yourselves to just one question at a time before returning to the queue. Thank you for your cooperation. At this time for opening remarks, I’d like to turn the conference call over to our President and Chief Executive Officer, Marty Freeman. Marty, please go ahead.

Marty Freeman (President and Chief Executive Officer)

Good morning and welcome to our first quarter conference call. With me on the call today is Adam Satterfield, our CFO. After some brief remarks, we will be glad to take your questions. Our first quarter results reflect a continuation of the encouraging trends that started to develop late last year. While our first quarter revenue declined on a year over year basis, demand for our service improved as the quarter progressed. This contributed to the acceleration in our LTL volumes during the quarter with strong sequential tonnage growth in February and March. Importantly, during the quarter, our team continued to deliver best in class service to our customers and maintained our disciplined approach to yield management. Providing our customers with superior service at a fair price is the cornerstone of our strategic plan. The consistency of our service performance day in and day out creates significant value for our customers and is something that we take significant pride in. As a result, we were pleased to once again deliver 99% on time service and a claims ratio below 0.1% in the first quarter. The strength of our unmatched value proposition has differentiated us from our competition and allowed us to win more market share than any other LTL carrier over the last 10 years. Our value proposition will continue to support our ability to grow our business in the years ahead and we continue to believe that we will be the biggest market share winner over the next 10 years. As a result, our best in class service also supports our yield management initiatives. Our long term disciplined approach to pricing is designed to offset our cost inflation and support our ability to make strategic investments back into our business. These investments will allow us to stay ahead of our anticipated growth curve to help us ensure that we’ll always have the capacity we need to grow. Our ability to say yes when a customer needs needs us the most is the hallmark of our industry. Leading customer service business levels in the LTL industry can change very quickly and being able to respond to growth opportunities in an improving demand environment is one of the primary areas that differentiate us from our competition. We believe it is important to consistently invest throughout the economic cycle despite the short term cost headwinds associated with this strategy. This is why despite a challenging operating environment, we invested nearly 2 billion capital expenditures over the past three years and why we plan to invest an additional 265 million in 2026. We’ve also continued to invest in the most important component of our long term success which is our OD family of employees. Our people and our unique culture are truly what sets us apart at Old Dominion. As a result, we have worked to ensure that we are providing a competitive wage and benefit package as well as various internal developmental programs like our in-house driver training schools and our management training program. These programs not only provide important opportunities for career advancements for our team, but they help ensure that our company is ready to respond when our customers need us the most. While we were always focused on long term, it is critical that we remain diligent in controlling our cost and continue to operate as efficiently as possible without compromising our superior service standards that remained the case in the first quarter as we continued to find ways to maximize our operating efficiencies and control our discretionary spending. We continue to believe that our business model contains significant operating leverage which has been enhanced by our ongoing investments in our technologies and continued focus on business process improvements. We produced solid results in the first quarter by continuing to execute our strategic plan, and I want to thank the entire OD family of employees for their unwavering dedication to our customers and to our company. Due to our consistent execution and investment, we are uniquely positioned to effectively handle incremental volume opportunities as the demand environment improves. As a result, we remain confident in our ability to win market share, generate profitable revenue growth, and increase shareholder value over the long term. Thank you very much for joining us this morning and now Adam will discuss our first quarter in greater detail.

Adam Satterfield (Chief Financial Officer)

Thank you Marty and good morning. I’m a little under the weather today, so I’d like to ask you all to bear with me as we get through this call Old Dominion’s revenue totals $1.33 billion dollars for the first quarter 2026, which represents a 2.9% decrease from the prior year. Our revenue Results include a 7.7% decrease in LTL tons per day that was partially offset by a 5.7% increase in our LTL revenue per hundredweight. Excluding fuel surcharges, our LTL revenue per hundredweight increased 4.4% compared to the first quarter 2025, which reflects our long term disciplined approach to yield management. On a sequential basis, our revenue per day for the first quarter increased 0.5% when compared to the fourth quarter of 2025 with LTL tons per day decreasing 0.4% and LTL shipments per day decreasing 0.7%. For comparison, the 10 year average sequential change for these metrics includes a decrease of 2.8% in revenue per day, a decrease of 2.5% in LTL times per day, and a decrease of 1.6% in LTL shipments per day. The monthly sequential changes in LTL tons per day during the first quarter were as January decreased 3.4% as compared to December, February increased 4.9% as compared to January, and March increased 4.6% as compared to February. The comparative 10 year average change for these respective months is a decrease of 3.1% in January, an increase of 1.0% in February and an increase of 4.5% in March. While there are still a couple of workdays remaining in April, our month to date revenue per day has increased by approximately 7.0% when compared to April 2025. This includes a decrease in our LTL tons per day of approximately 6.5% and an increase in our revenue per hundredweight excluding fuel surcharges of 4 to 4.5%. As usual, we will provide the actual revenue related details for April in our first quarter form 10-Q. Our operating ratio increased 80 basis points to 76.2% for the first quarter 2026 as the increase in overhead cost as a percent of revenue more than offset the improvement in our direct cost. Our overhead cost increased as a percent of revenue primarily due to the deleveraging effect associated with the decrease in our revenue as well as an increase in our general supplies and expenses. This resulted in the 60 basis point increase in our general supplies and expenses and 40 basis point increase in our depreciation cost as a percent of revenue. All of our other combined costs improved as a percent of revenue for the quarter on a net basis. The improvement in our direct operating cost as a percent of revenue was primarily due to our continued focus on revenue quality and operating efficiencies despite the lack of density on our network associated with the decrease in our volumes. Our team did a nice job of matching our labor costs with current revenue trends and this will be a key focus for us over the balance of the year. That said, we currently believe we have an appropriately sized workforce to handle a sequential increase in volumes during the second quarter. Old Dominion’s cash flows from operations totaled $373.6 million for the first quarter and capital expenditures were $62.6 million. We utilized $88.1 million for our share repurchase program during the first quarter and our cash dividends totaled $60.5 million. Our effective tax rate for the first quarter 2026 was 25.0% as compared to 24.8% in the first quarter 2025. We currently expect our effective tax rate to be 25.0% for the second quarter of 2026. This concludes our prepared remarks this morning. Operator will be happy to open the floor for questions at this time.

OPERATOR

We will now begin the question and answer session. To ask a question, you may press star then one on your touchtone phone. If you are using a speakerphone, please pick up your handset before pressing the keys. If at any time your question has been addressed and you would like to withdraw your question, please press star then two. At this time, we will pause momentarily to assemble our roster. The first question comes from Jordan Aliger with Goldman Sachs.

Jordan Aliger (Equity Analyst)

Please Go ahead. Yeah, hi, morning everyone. Thanks for the update. I guess sort of in the context of, you know, some of those trends you’ve been seeing, maybe continue on the trend thought and share some color or thoughts on direction of or trends as we move from the Q1 to Q2. Thank you.

Adam Satterfield (Chief Financial Officer)

Yeah, the 10 year average change for the operating ratio is 300 to 350 basis point improvement from the first to the second quarter and we’re comfortable with that range in the second quarter this year. Assuming that we do see some sequential improvement our volumes from here. And that’s what we’d anticipate. But obviously there’s a lot going on in the world right now. But based on what we’re currently seeing, we’re expecting that increase in volumes and I think we’re comfortable with hitting that normal sequential range as a result. If we do so, that’d be the fourth straight quarter that we’ve been able to be in or at least beat what our normal sequential change would be.

Jordan Aliger (Equity Analyst)

Thanks. And I don’t know if I could ask a follow up, but just sort of related to that, have you seen been a shift in sort of that excess terminal capacity? Has it come in a little bit? As we’ve seen volumes look a little better in terms of our capacity?

Adam Satterfield (Chief Financial Officer)

Yeah, I think you’ve been at like 30, 35% terminal capacity excess. I’m just sort of curious if that’s changed at all. Yeah, we’re, we’re still a little north of 35%. Their volumes are still down on a year over year basis. And obviously this is the slower time of the year in the first quarter. But you know, that’s something that we continue to see as an opportunity and will drive. Part of that operating ratio improvement is we can continue to see sequential volume improvement and then leveraging, you know, those fixed costs, those investments that we’ve made and that depreciation headwind that we’ve been facing. So leveraging those and some of our other fixed overhead costs. But you know, that benefit of density driving improvement in both our direct operating cost as well as some of those overhead costs. Thank you.

OPERATOR

The next question is from Jason Seidel with TD Cowan.

Jason Seidel (Equity Analyst)

Please go ahead. Thanks, operator. Morning, Marty. Adam and Jack. And Adam, I hope you feel better. I’m going to stick on the OR topic a little bit here. You know, as we think about your commentary for the normalized sequential moves from 1Q to 2Q, can you help us frame up the impacts in 1Q for

Adam Satterfield (Chief Financial Officer)

both fuel as well as weather? So we could figure out sort of where in the range we might want to be. Yeah, the. Glad you asked that. Figured fuel would be a topic of conversation, but it’s come up a few times. Yeah, exactly. You know, fuel is part of our yield management strategy we’ve always talked about we want fuel, which is just a variable component of pricing, to really be indifferent if fuel goes up or if it goes down. You know, essentially we want the bottom line to be the same and that’s how we look at things on individual account profitability type basis. And I think when you look at what happened from the fourth quarter to the first quarter of this year, we outgrew our normal sequential trend with tonnage by about 200 basis points. And that’s really the story of the quarter in the sense of the strong operating ratio performance that we had there. But when you just look, our shipments per day from the fourth quarter to the first quarter were essentially the same. And when you look at fuel was, was up 10%, deal counts, consistent profitability is relatively consistent, a little bit better overall, but obviously there’s other things going on. And when I compare that back to the first quarter of 2023 compared to the second quarter 2023, a lot of similar circumstances. Bill count was the same between those two periods. Fuel was down 10% between those two periods, but. So you had revenue impact on the downside of fuel, but profitability was consistent between those two periods. So obviously there’s always a lot of fluctuations. But I think those two sequential periods, when you’ve got similar bill count, similar mix of freight, kind of shows that fuel can go up or down 10% and overall profitability stay the same. Now, obviously we’re looking at a much larger increase in fuel and I would probably just point everybody back to the second quarter 2022. I think this first quarter to second quarter of 26 is probably going to have a lot of similarities to that first quarter to second quarter 22 period when we saw the fuel shock and all the other inflationary impact that that drives. That’s very helpful.

OPERATOR

And that was my one. Appreciate it, guys. The next question is from Chris Weatherby with Wells Fargo.

Chris Weatherby (Equity Analyst)

Please go ahead. Hey, thanks guys. Good morning. Wanted to get your sense on how you feel about, I guess, demand and then ultimately how you’re faring from a market share perspective as you think about coming out of the really strong performance in February and then what you’ve seen so far in March and April. Just kind of curious if some improvement has continued or you feel like there’s

Adam Satterfield (Chief Financial Officer)

been more Steady demand, just kind of get a sense of how you’re thinking about things. Yeah, it definitely feels like it’s continued to improve and go back to last year. We’ve had essentially through March is five months of normal sequential trends for us. And obviously like I mentioned earlier, it’s through a slower part of the year. But we felt like we started seeing a lot of and hearing optimism from customers and from our sales team late last year and we started seeing that return to seasonality. We’ve seen a pickup in our wait for shipment and in fact in April our weight for shipment is up on a year over year basis a little over 1%. So you know, that’s usually a leading indicator of an improving demand environment. So all those things, the positive ISM trends that we’ve seen and we’d expect another positive ism for April, I think those have all been consistent. The retail side of the sector has probably been driving more the volume performance at this point and we’re looking for the industrial sector to start contributing as well. That usually starts performing on a lag basis after you see that positive ISM performance. And I think that what we seem to hear right now, obviously there’s some geopolitical risk to everything right now, but it seems …

Full story available on Benzinga.com

This post was originally published here

Alphabet Inc. (NASDAQ:GOOGL) (NASDAQ:GOOG) reported first-quarter results after Wednesday’s closing bell, beating analyst estimates on the top and bottom lines. 

Here’s a look at the details inside the report. 

GOOG Q1 Details       

Alphabet reported quarterly earnings of $5.11 per share, which blew past the analyst consensus estimate of $2.62 by 95.04%, according to Benzinga Pro data. 

Quarterly revenue clocked in at $109.9 billion, which beat the Street estimate of $106.93 billion and was up from $90.23 billion in the same period last year.

Google Services revenues grew 16% to $89.6 …

Full story available on Benzinga.com

This post was originally published here

Amazon.com Inc (NASDAQ:AMZN) reported financial results for the first quarter after the market close on Wednesday. Here’s a look at the key details from the print.

Amazon Q1 Highlights

Amazon reported first-quarter revenue of $181.52 billion, beating the consensus estimate of $177.30 billion, according to Benzinga Pro. The e-commerce giant reported quarterly earnings of $2.78 per share, beating analyst estimates of $1.66 per share.

Total revenue increased 17% on a year-over-year basis. Here’s a breakdown of revenue by segment.

  • North America: $104.1 billion, up 12%
  • International: $39.8 billion, up 19%
  • Amazon Web Services: $37.6 billion, up 28%

Operating cash flow increased 30% to $148.5 billion for the trailing 12 months, and free cash flow decreased to $1.2 billion, primarily due to increased purchases of property …

Full story available on Benzinga.com

This post was originally published here

Ford Motor Co. (NYSE:F) stock climbed after the company reported first-quarter results following Wednesday’s closing bell, beating analyst estimates on the top and bottom lines. 

Here’s a look at the details inside the report. 

data-variant=”card”
data-news-mode=”manual”

>


Read Also:

Palantir Has ‘Golden Path’ To Become Trillion-Dollar AI Giant, Dan Ives Says

This post was originally published here

Meta Platforms Inc (NASDAQ:META) reported financial results for the first quarter on Wednesday after the bell. Here’s a rundown of the report.

Key Details In Meta’s Q1 Results

Meta posted first-quarter revenue of $56.31 billion, beating analyst estimates of $55.45 billion. The tech giant reported first-quarter adjusted earnings of $7.31 per share, beating estimates of $6.78 per share, according to Benzinga Pro.

Total revenue was up 33% on a year-over-year basis. Family daily active people declined slightly quarter-over-quarter due to internet disruptions in Iran and restrictions in Russia. Meta noted that the family daily active people metric was up 4% year-over-year in March.

Ad impressions jumped 19% year-over-year and average price per ad increased by 12% year-over-year. Meta noted its headcount was up 1% year-over-year to …

Full story available on Benzinga.com

This post was originally published here

Expedia Group (NASDAQ:EXPE) shares are up on Wednesday as the company is expanding into travel through a partnership with Uber Technologies, Inc. (NYSE:UBER).

This collaboration allows Uber users to book hotels directly in the Uber app, enhancing the travel experience amid rising demand as summer approaches.

The partnership between Uber and Expedia Group aims to simplify travel booking for users, integrating hotel reservations directly into the Uber app.

This initiative comes at a time when travel demand is surging, with consumers seeking more efficient ways to manage their trips.

The broader market is experiencing mixed performance, with the Nasdaq down 0.26% while the S&P 500 and Dow Jones are down 0.21% and 0.61%, respectively.

Despite the positive news for Expedia, the stock’s gains occur as broader market indicators show a decline, suggesting that company-specific factors may be influencing its performance.

Technical Analysis

Expedia is currently trading within a strong range, with a 12-month return of 54.66%.

The stock is trading 1.2% above its 20-day simple moving average (SMA), indicating short-term bullish momentum, while it sits 1.7% below …

Full story available on Benzinga.com

This post was originally published here

Yum! Brands (NYSE:YUM) shares are up, up 3.24%, on Wednesday as the company reported strong first-quarter results, with Taco Bell achieving an impressive 8% same-store sales growth.

This positive performance comes amid broader market pressures, as the Consumer Discretionary sector is currently down 0.71%, contributing to a mixed market day.

• Yum! Brands stock is showing exceptional strength. Why is YUM stock surging?

Quarterly Details

The company reported first-quarter adjusted earnings per share of $1.50, beating the analyst consensus estimate of $1.38. Quarterly sales of $2.059 billion outpaced the Street view of $2.042 billion.

Worldwide system sales grew 6% excluding currency impact, while unit count rose 5% with over 1,000 new openings.

GAAP operating profit increased 17% and core operating profit grew 6%, as digital system sales neared $11 billion with a record 63% mix.

KFC Division opened 648 gross new restaurants across 45 countries, while Taco Bell Division opened 30 gross new restaurants across eight countries. Pizza Hut Division opened 346 gross new restaurants across 27 countries.

Outlook

The company targets long-term average unit growth of 5% and system sales growth of 7%, excluding currency impact.

It also aims to deliver at least 8% core operating profit growth over the long term.

The broader market is experiencing a slight downturn, with major indices such as the S&P 500 and Dow Jones both posting losses. This backdrop …

Full story available on Benzinga.com

This post was originally published here

Akanda Corp. (NASDAQ:AKAN) stock surged on Wednesday. The move follows a massive multi-day rally in the cannabis sector.

Speculative momentum remains high after U.S. regulators moved to reclassify marijuana products.

Regulatory Shifts Fuel Optimism

The U.S. Department of Justice placed state-regulated medical marijuana under Schedule III. An expedited process for broader reclassification is now underway.

A new administrative hearing is scheduled for June 29.

Shareholder Meeting Adjourned

The company officially adjourned its Special Meeting of Shareholders today. The delay stemmed from a lack of quorum.

Despite this, investors focused on …

Full story available on Benzinga.com

This post was originally published here

Super Micro Computer Inc. (NASDAQ:SMCI) shares are falling on Wednesday afternoon. The Nasdaq is up 0.17% while the S&P 500 has shed 0.28%.

• Super Micro Computer shares are retreating from recent levels. What’s behind SMCI decline?

Oracle Cancels Massive Server Order

According to Bluefin Research on Thursday, Oracle Corp. (NYSE:ORCL) reportedly canceled an order for 300 to 400 NVIDIA Corp. (NASDAQ:NVDA) GB300 NVL72 racks.

Each rack costs $3.5 million. This represents a contract loss between $1.1 billion and $1.4 billion. Bluefin estimates SMCI shipped only 100 to 200 racks before the termination.

Legal Headwinds …

Full story available on Benzinga.com

This post was originally published here

JP Morgan analysts maintain a positive outlook on Mastercard Inc. (NYSE:MA) following strong second-quarter results from rival Visa Inc. (NYSE:V).

In a research note released Tuesday, analyst Tien-tsin Huang indicated that Visa’s performance offers a “mildly positive risk-reward” for Mastercard heading into its earnings report this Thursday.

Visa Results Signal Healthy Global Environment

Visa reported better-than-expected results and raised its second-half guidance. Cross-border volume performed better than many feared, while currency volatility provided a tailwind.

JP Morgan noted that Visa’s global and U.S. volumes exceeded expectations. This suggests a stable operating environment for the broader payments sector.

“Visa’s April cross-border results were substantially better than feared and showed only a slight deceleration, which should ease concerns for Mastercard,” the analysts …

Full story available on Benzinga.com

This post was originally published here

Central Pacific Financial (NYSE:CPF) held its first-quarter earnings conference call on Wednesday. Below is the complete transcript from the call.

This content is powered by Benzinga APIs. For comprehensive financial data and transcripts, visit https://www.benzinga.com/apis/.

View the webcast at https://events.q4inc.com/attendee/325405077

Summary

Central Pacific Financial reported strong earnings in Q1 2026 with net income of $20.7 million and EPS of $0.78, reflecting a 20% increase from the previous year.

The company maintained healthy credit quality and capital strength, with a return on average equity of 13.90% and a net interest margin of 3.53%.

Loan growth was driven by commercial real estate, while deposits increased by $90 million, with core deposits making up over 90% of total deposits.

Central Pacific Financial was named Hawaii’s US Small Business Administration Lender of the Year for 2025, highlighting its commitment to local businesses.

Management expects modest loan and deposit growth for 2026, with net interest income projected to rise by 4-6% over the prior year.

The company plans to continue returning capital to shareholders through dividends and share repurchases, with $44.5 million remaining under the share repurchase program.

The outlook includes maintaining a strong balance sheet and focusing on disciplined and sustainable growth strategies amid a resilient Hawaiian economy.

Full Transcript

OPERATOR

Good afternoon ladies and gentlemen. Thank you for standing by and welcome to the Central Pacific Financial Corp. First quarter 2026 earnings conference call. During today’s presentation, all parties will be in a listen only mode. Following the presentation, the conference will be open for questions. This call is being recorded and will be available for replay shortly after its completion on the company’s website at www.cpb.bank. i’d now like to turn the call over to Mr. Gerald Rubago, Senior Strategic Financial Officer. Please go ahead.

Gerald Rubago

Thank you Rob and thank you all for joining us today as we review Central Pacific Financial Corp’s. Financial results of the first quarter of 2026. Joining me this morning are Arnold Martinez, Chairman, President and Chief Executive Officer David Morimoto, Vice Chairman and Chief Operating Officer Ralph Mesic, Senior Executive Vice President and Chief Risk Officer and Dana Matsumoto, Executive Vice President and Chief Financial Officer. We have prepared a supplemental slide presentation with additional details on our earnings release. The presentation is available in our Investor Relations section of our website@ir.cpb.bank during today’s call, management may make forward looking statements. These statements are based on current expectations and assumptions and are subject to risks and uncertainties that could cause actual results to differ materially. For a complete discussion of these risks related to our forward looking statements, please refer to slide two of our presentation. With that, I will now turn the call over to our Chairman, President and CEO Arnold Martinez. Thank you Gerald and Aloha to everyone joining us today. joining us today. The first quarter represented a strong start to 2026 with solid earnings performance and continued execution across our franchise. We delivered growth in both loans and core deposits, maintained strong credit quality and continued to operate from a position of capital strength. This momentum reflects the strength of our relationship focused banking model and our continued commitment to serving the people, businesses and communities of Hawaii. Our results also demonstrate the durability in organic earnings power of the franchise. With return on equity above 13% and robust capital levels, we remain focused on disciplined sustainable growth and thoughtful capital allocation. From a shareholder perspective, we remain committed to deploying capital in ways that enhance long term value. This includes supporting organic growth, maintaining a strong balance sheet, returning capital through dividends and share repurchases, and preserving flexibility to respond to market opportunities. We were also pleased that CPB was named the Hawaii US Small Business Administration Lender of the Year for 2025. This marks the 17th time CPB has received this recognition and reflects our long standing commitment to Hawaii’s small business community. Turning to the broader environment, Hawaii’s economy remained resilient during the first quarter, visitor arrivals and spending increased and the state’s unemployment rate remained exceptionally low at 2.3%. While oil prices have increased due to the conflict in the Middle east, the direct impact on Hawaii’s economy has been limited to date and we continue to monitor conditions closely. At the same time, Hawaii continues to benefit from ongoing construction activity, military spending and a resilient local economy. Recent storm activity and flooding, including impacts from the Kona Lo, caused isolated but significant damage in parts of the state. We remain committed to supporting affected customers and communities as they recover and rebuild. Against this backdrop, our strategy remains consistent. Support local businesses through prudent lending, grow and deepen core deposit relationships, invest thoughtfully in our franchise and manage risk with discipline through the cycle. With that, I will turn the call over to Dana.

Arnold Martinez (Chairman, President and Chief Executive Officer)

Thanks, arnold for the first quarter, net income was $20.7 million and earnings per diluted share was $0.78. Return on average assets was 1.12% and return on average equity was 13.90%. Compared to the year ago quarter, our eps increased by 20% reflecting revenue growth and expense discipline as we continue to successfully execute on our strategy. Net interest income totaled $61.4 million and net interest margin remained healthy at 3.53% compared to the prior quarter. Results reflected typical seasonal factors and balance sheet timing including lower day count and lower average loan balances. The decline in our loan yields were partially offset by the improvement in our deposit costs. For the second quarter. We are projecting NIM of 3.50 to 3.55%. Our guidance for full year net interest income remains at a 4 to 6% increase over the prior year. Across a range of potential rate environments. Our balance sheet positioning and funding mix continue to provide meaningful resilience. Total other operating income was 11.6 million and declined from the prior quarter by $2.6 million. In the prior quarter we had one time BOLI death benefit income of $1.4 million. Current quarter BOLI income was further impacted by equity market volatility. Additionally, Q1 seasonality typically results in lower levels of fee income in the mortgage, banking and wealth areas. We continue to expect our full year other operating income to increase modestly over normalized priority. Prior year total other operating expense was $43.7 million and declined by $2.0 million from the prior quarter. The decline was primarily driven by higher incentive accruals in the prior quarter and lower deferred compensation expense this quarter. We expect our expenses to increase over the year, but our full year expense Growth is still expected to be modest and at 2.5 to 3.5% from 2025 normalized in the first quarter, we paid a cash dividend of $0.29 per share and repurchased approximately 321,000 shares for a total of $10.5 million. With our strong earnings and capital position, our board declared a second quarter cash dividend of $0.29 per share. We had 44.5 million remaining available under our share repurchase program as of March 31st and we plan to continue to utilize it as part of our capital allocation strategy. I will now turn the call over to David.

Dana Matsumoto (Executive Vice President and Chief Financial Officer)

Thank you, Dana. During the first quarter, our total loan portfolio grew by $31 million, bringing total loans to $5.3 billion at quarter end. The majority of the loan growth came near the end of the first quarter. Therefore, we will see the benefit in our net interest income in …

Full story available on Benzinga.com

This post was originally published here

Hyperliquid is publicly testing a plan to add prediction markets to its platform in a direct challenge to Polymarket.

The proposal, known as HIP-4, would allow traders to buy fully collateralized binary contracts on real-world outcomes within the same margin account they use for crypto perpetual futures.

Former Barclays CEO Bob Diamond chairs Hyperliquid Strategies Inc. (NASDAQ:PURR), the largest Nasdaq-listed way to bet on the exchange.

PURR holds more than 17 million HYPE tokens, has filed an S-1 to raise up to $1 billion more, and last closed near $6. Maxim Group initiated coverage on Friday with a Buy rating and a $10 price target.

Kalshi Is Inside The Tent

The HIP-4 proposal was co-authored by John Wang, head of crypto at Kalshi, and the two companies …

Full story available on Benzinga.com

This post was originally published here

Blackstone (NYSE:BX) is launching a new division focused on alternative investments in artificial intelligence and high-growth tech, including companies such as OpenAI and Anthropic. 

• Blackstone shares are under pressure. What’s pulling BX shares down?

Jas Khaira will lead the newly formed Blackstone N1 division and relocate from New York to San Francisco to head the firm’s new West Coast–based team, Bloomberg reported.

Khaira will take over as head of Blackstone Growth, succeeding Jon Korngold, who is departing the firm. He will also maintain his original position as leader of Blackstone’s Tactical Opportunities business in the Americas and will continue to serve on its investment committee.

data-variant=”card”
data-news-mode=”manual”

>


Read Also:

This post was originally published here

First Commonwealth (NYSE:FCF) reported first-quarter financial results on Wednesday. The transcript from the company’s first-quarter earnings call has been provided below.

This transcript is brought to you by Benzinga APIs. For real-time access to our entire catalog, please visit https://www.benzinga.com/apis/ for a consultation.

Access the full call at https://events.q4inc.com/attendee/105905810

Summary

First Commonwealth reported a net income of $37.5 million, translating to $0.37 per share, below the consensus earnings estimate of $0.40.

Net interest income decreased by $4.2 million due to the sale of $210 million in Eastern Pennsylvania commercial loans and heightened loan payoffs.

The net interest margin fell to 3.92%, but positive replacement yields and expiring swaps suggest potential for future expansion.

Deposits grew by 6.3% annualized, with successful money market promotions leading to new checking accounts.

Non-interest expenses increased by $1.2 million due to higher salaries and incentives, as well as prepayment fees for debt repurchase.

The efficiency ratio increased to 55.4%, with a commitment to slow down expense growth.

Provision for loan losses rose by $3.7 million, influenced by specific reserves for larger credits, but overall credit quality remains stable.

The balance sheet strengthened with increased tangible book value and reduced borrowings, while the loan-to-deposit ratio decreased to 91%.

Key strategic initiatives include leveraging fintech and AI to improve customer experience and internal efficiency.

The company plans continued share repurchases and announced an 11th consecutive annual dividend increase.

Full Transcript

OPERATOR

Ladies and gentlemen, thank you for standing by. My name is Abby and I’ll be your conference operator today. At this time, I would like to welcome everyone to the First Commonwealth Financial Corporation first quarter 2026 earnings release conference call. All lines have been placed on mute to prevent any background noise. After the speaker’s remarks, there will be a question and answer session. If you would like to ask a question during this time, simply press star followed by the number one on your telephone keypad. If you would like to withdraw your question, press star one again. Thank you. And I would now like to turn the conference over to Ryan Thomas, Vice President of Finance and Investor Relations. You may begin.

Ryan Thomas (Vice President of Finance and Investor Relations)

Thanks, Abby, and good afternoon, everyone. Thank you for joining us today to discuss First Commonwealth Financial Corporation’s first quarter financial results. Participating on today’s call, we will be Mike Price, President and CEO, Jim Reschke, Chief Financial Officer, Brian Sohocki, Chief Credit officer and Mike McKeown, chief lending officer. As a reminder, a copy of yesterday’s earnings release can be accessed by logging on to FCBanking.com and selecting the investor relations link at the top of the page. We have also included a slide presentation on our investor relations website with supplemental information that will be referenced during today’s call. Before we begin, I need to caution listeners that this call will contain forward looking statements. Please refer to our forward looking statements disclaimer on page three of the slide presentation for a description of risks and uncertainties that could cause actual results to differ materially from those reflected in the forward looking statements. Today’s call will also include non GAAP financial measures. Non GAAP financial measures should be viewed in addition to and not as an alternative for our reported results prepared in accordance with gaap. A reconciliation of these measures can be found in the appendix of today’s slide presentation. With that, I will turn the call over to Mike.

Mike Price (President and CEO)

Thank you, Ryan. Good afternoon, everyone. Several headlines for the first quarter of 2026 follow net income of 37.5 million resulted in 37 cents of earnings per share as compared to our consensus earning estimate of $0.40. Net interest income was down some $4.2 million for the quarter to 109.3 million as we sold $210 million of Eastern Pennsylvania commercial loans. And loan balances fell another 74.2 million due to heightened payoffs. Our commercial loan repayments swelled to $630 million in the first quarter, up some $150 million over the first quarter of 2025. In the first quarter we had 18 successful Commercial Real Estate projects. They were refinanced or sold representing a payoff of approximately $240 million in loan outstandings. The net interest margin or Net Interest Margin fell as expected to 3.92%. Among other items, positive replacement yields on new fixed rate loans in the first quarter were 54 basis points higher and coupled with $150 million swaps rolling off in the second quarter, this should provide the impetus for further Net Interest Margin expansion. Deposits grew 6.3% end to end annualized in the first quarter and our money market promotions have resulted in new consumer checking accounts. Heretofore we have been reticent to aggressively drop rates, but given the elevated loan payoffs and a markedly lower loan to deposit ratio, we are well positioned to test lower deposit rates in the next several quarters. Non interest expense expenses were up $1.2 million to 75.5 million DOL in the quarter as salaries and incentives increased alongside $500,000 of prepayment fees for the repurchase of long term debt. Our efficiency ratio climbed to 55.4% and we intend to slow down our expense growth rate. The provision for loan losses increased $3.7 million to $10.7 million on a linked quarter basis as we had $9.6 million in specific reserves for three larger credits, one of which was from Eastern Pennsylvania. Our non performing loans or NPLs to loans remained stubbornly high at 0.98% in the first quarter. Specifically, three previously discussed relationships totaling $20.5 million moved to non performing status during the quarter with $9.6 million of associated specific reserves. These downgrades offset otherwise positive asset resolution during the quarter. And please recall that of our 92.3 million in NPLs, 28.1 million or 30.4% is guaranteed by the SBA. The balance sheet and liquidity continued to strengthen in the first quarter as we paid off virtually all borrowings, lowered our loan to deposit ratio to 91% and grew tangible book value per share by 4.3% while at the same time repurchasing our stock. Other notable fourth first quarter items include our center bank acquisition has exceeded financial expectations and helped lead Cincinnati, the company leading loan and deposit growth in the second quarter. Residential Mortgage had a strong first quarter with both loan volumes and gain on sale income. The small business and business banking segment volumes were brisk as we have added new bankers and enhanced credit processes. Also, our retail bank had the highest net promoter and customer satisfaction scores since we began tracking. As we think about the ensuing quarters and future, it will be important that we focus on the basics, namely Live Our Mission Grow the Bank, Get Better. As we grow the bank, we must do so steadily and ensure our credit costs converge and surpass peers. Getting better will necessitate new approaches and technologies to both make it easier for customers to do business with First Commonwealth while simplifying internal processes. Given our adoption of fintech over the years and our current AI usage, we have important tools to continue to evolve our company. Simultaneously, we must become more efficient as we scale the bank. Our first strategic initiative, Live our Mission to improve the financial lives of our neighbors and businesses, remains the cornerstone of our brand and is what sets us apart as a community bank. With that, I’ll turn it over to Jim Resky, our cfo.

Jim Reschke

Thanks Mike. Mike’s already provided an overview of financial results, so I’ll drill down a bit on spread income and the margin. Spread. income was down from last quarter by $4.2 million, but approximately $2.6 million of this decline can be attributed to having fewer days in a quarter. The remainder stems from the lower levels of earning assets and the impact of last quarter’s Fed rate cuts on the variable rate loan portfolio. The Fed cuts resulted in a nine basis points contraction in the yield on earning assets, somewhat offset by a 5 basis points decrease in the cost of funds. The decline in earning assets is largely the result of the disposition of $210 million in loans that were moved to held for sale at the end of the fourth quarter. This quarter’s net interest margin, or Net Interest Margin of 3.92% is in line with our previous guidance, while it is down from last quarter’s 3.98%. The Net Interest Margin in the fourth quarter benefited from about 3 basis pointss from several unique items that we talked about last quarter, including the recognition of accrued interest from the payoff of several loans that had previously been placed on non accrual status. Looking ahead, the NIM should benefit from fewer than expected rate cuts that keep the variable rate loans from repricing downward while continuing to allow the fixed rate loans and securities to reprice upward. And the expiration of $150 million of macro swaps on May 1 this Friday is even more valuable in a higher rate environment as it will allow those loans to float to higher rates than expected. Based on our new one cut base case, we are revising our previous NIM guidance upwards slightly, about 3 to 5 basis pointss higher each quarter than before, drifting upward to the low 4% range by the fourth quarter of this year. First quarter non interest expense or NIE increased by $1.2 million from last quarter, but first quarter NIE included about $1.3 million in expense for finalizing incentive payments related to prior year volumes and performance. Similar to the first quarter last year, along with the $500,000 FHRV prepayment penalty that Mike mentioned, we expect NIE per quarter to hover in the $74 to $76 million range this year. Fee income is little change from last quarter first quarter fee income included approximately $435,000 from the payoff of several loans that had been included in the held for sale portfolio at year end when they paid off at par. The difference between PAR and the mark was recognized as fee income, Wealth, Mortgage and SBA are all up significantly from the same quarter a year ago. Fee income should range from 24 to 25 million dollars per quarter this year. We repurchased approximately 22.7 million dollars in stock last quarter at a weighted average price of $17.67. We have $25 million remaining in repurchase authorization, not the $18.4 million figure that was in the earnings release. We announced a 2 cent increase in the dividend yesterday, marking the 11th straight year of dividend increases. Combined with the dividend, we returned nearly 100% of internal capital generation to our shareholders last quarter, and yet tangible book value per share grew from $11.22 to to $11.34. We intend to continue share repurchase activity. In the second quarter. Our CET1 ratio improved from 12.1 to 12.5%. Our TCE ratio was unchanged to 9.7% and with that we’ll take any questions you may have.

OPERATOR

Thank you. We’ll now begin the question and answer session. If you dialed in and would like to ask a question, please press Star one on your telephone keypad to raise …

Full story available on Benzinga.com

This post was originally published here

President Donald Trump told Axios on Wednesday he will keep the U.S. naval blockade on Iran in place until Tehran agrees to a nuclear deal, rejecting an Iranian proposal to first reopen the Strait of Hormuz before nuclear talks resume.

“The blockade is somewhat more effective than the bombing. They are choking like a stuffed pig,” Trump said in the 15-minute phone interview. “They can’t have a nuclear weapon.”

Trump claimed Iran’s oil storage and pipelines “are getting close to exploding,” though some analysts have disputed the timeline.

Strikes Remain On The Table

U.S. Central Command has prepared a “short and powerful” wave of strikes to break the deadlock, three sources told Axios. Trump has not ordered any kinetic action and views the blockade as his primary leverage. A senior Iranian …

Full story available on Benzinga.com

This post was originally published here

The EV slowdown has weighed on lithium sentiment. But Lithium Americas Corp (NYSE:LAC) is leaning into a different narrative—one that could matter more than near-term demand cycles.

In an exclusive email interaction with Benzinga, Tim Crowley, SVP, Government and External Affairs at Lithium Americas, framed lithium as far more than an EV input. It has “emerged as a cornerstone of our national security, energy independence, and economic competitiveness”—a positioning that aligns closely with the Donald Trump-era push to localize critical mineral supply chains.

That shift is key. While EV demand ebbs and flows, national policy priorities tend to stick—and increasingly point toward domestic sourcing.

Crowley emphasized that Lithium Americas is working “in partnership with our federal, state, and local leaders” to build a U.S.-based lithium supply …

Full story available on Benzinga.com

This post was originally published here

Penske Automotive Group (NYSE:PAG) released first-quarter financial results and hosted an earnings call on Wednesday. Read the complete transcript below.

Benzinga APIs provide real-time access to earnings call transcripts and financial data. Visit https://www.benzinga.com/apis/ to learn more.

The full earnings call is available at https://events.q4inc.com/attendee/833752648

Summary

Penske Automotive Group reported Q1 2026 revenue of $7.9 billion, with net income of $235 million and earnings per share of $3.56.

The company made strategic acquisitions of two Lexus dealerships expected to generate $2 billion in annual revenue and repurchased 170,000 shares of common stock.

Penske Automotive Group’s commercial truck segment saw a decline in unit sales due to tariffs and freight market weakness, but new truck orders are increasing, indicating a positive outlook for H2 2026.

Full Transcript

OPERATOR

Good afternoon. Welcome to the Penske Automotive Group from first quarter 2026 earnings conference call. Today’s call is being recorded and will be available for replay approximately one hour after completion through May 6, 2026 on the Company’s website under the Investors tab at www.penskeautomotive.com. I will now introduce Anthony Porten, the company’s Executive Vice President of Investor Relations and Corporate Development. Sir, please go ahead.

Roger Penske (Chair and CEO)

Thank you, Krista. Good afternoon everyone and thank you for joining us today. A press release detailing Penske Automotive Group’s first quarter 2026 financial results was issued this morning and is posted on our website along with a presentation designed to assist you in understanding the company’s results. As always, I’m available by email or phone for any follow up questions you may have. Joining me for today’s call is Roger Penske, our Chair and CEO Shelly Hallgrave, our EVP and Chief Financial Officer, Rich Shearing from North American Operations, Randall Seymour of International Operations and Tony Piccione, our Vice President and Corporate Controller. We may make forward looking statements on today’s call about our earnings potential, outlook and other future events and we also may discuss certain non GAAP financial measures such as EBITDA and adjusted EBITDA. We’ve also prominently presented and reconciled any non GAAP measures for the most directly comparable GAAP measures in this morning’s press release and investor presentation, again both of which are available on our website. Our future results may vary from our expectations because of risks and uncertainties outlined in today’s press release. Under Forward looking statements, I direct you to our SEC filings, including our Form 10-K and previously filed Form 10-Qs for additional discussion and factors that could cause future results to differ materially from expectations. At this time, I’ll turn the call over to Roger Penske. Thank you Tony Good afternoon everyone and thank you for joining us today. We’re pleased to report a solid productive first quarter. During the first quarter, PAG delivered over 123,000 new and used vehicles and nearly 3,600 new and used commercial trucks and that generated approximately 7.9 billion in revenue. We earned 324 million in earnings before taxes and 235 million in net income and generated earnings per share of $3.56. The first quarter results include a $60 million gain on the sale of a dealership, partially offset by 13 million in certain disposals and other charges. As we continue to optimize our dealership portfolio. Excluding these items, adjusted earnings before taxes was 276 million. Net income was 201 and earnings per share was $3.05. This was a difficult comparison with the prior year period and challenging market conditions impacted year over year performance. We also continue to grow our footprint. In February we acquired two high performing and strategic Lexus dealerships in Orlando metropolitan area of Central Florida, one of the fastest growing regions in the U.S. these acquisitions complement the two Lexus and two Toyota dealerships we acquired in November 2025. Combined, these six dealerships are expected to generate 2 billion in estimated annualized revenue. We also repurchased 170,000 shares of common stock for 26 million. We increased the dividend to $1.40 which yields approximately 3.4%, the highest yield in our peer group. Looking at the details for the quarter, same store Retail Automotive new units declined 5% and used increased 1%. Units retailed were impacted by weather related challenges and a difficult comparison to March 2025 when tariffs caused pull ahead sales and lower BEV sales in the US Associated with the elimination of the BEV tax credit. Gross profit per unit new Unit retailed was $4,783 up $94 sequentially. Gross profit per used unit was $2,076 up $306 sequentially. Our service and parts revenue and gross Profit was a Q1 record. Same store revenue increased 4.6 and related gross profit increased 5.7%. Service and parts gross margin was up 60 basis points. The retail commercial truck segment Q1 unit sales declined 953 units driven by reduced order intake during Q3 and Q4 2025 following the implementation, implementation of tariffs and weakness in the freight market. However, we are encouraged today with the trends we are seeing across the commercial truck market. In recent months we’ve seen an increase in new truck orders. Expect the timing of these deliveries to take place in the second half of 2026. PTS equity income increased 24%. Growth in the full service leasing revenue, improved fleet utilization, lower operating and interest

Rich Sherry

expenses resulting from continued fleet reductions including maintenance and our depreciation were partially offset by continued challenges from the rental and lower gain on sale of trucks. At this time, I’ll turn the call over to Rich Sherry thank you Roger and good afternoon everyone In US Retail Automotive Same store new and used unit sales were affected by two major winter storms Liberation Day tariff announcement and pull forward of retail sales in March of last year and lower Battery Electric Vehicle (BEV) sales from easing emissions regulations and the elimination of the Battery Electric Vehicle (BEV) tax credit at the end of September 2025 during the quarter, 25% of new units sold were at MSRP compared to 29% in Q1 last year. Same store service and parts revenue increased 3.2% and gross profit increased 3.4%. Customer pay was up 4%, warranty was up 5% and collision repair declined 4%. Our US automotive technician count is up 3% when compared to the end of March of last year and our Bay utilization is 84%. Turning to Premier Truck Group Group during Q1, Premier Truck Group retailed 3,583 new and used trucks, generated 695 million in revenue and 128 million in gross profit on a sequential basis compared to Q4 2025. New unit gross increased $111 and used unit gross increased $4,624. New unit sales were down 26% and were in line with the overall North American Class 8 market. The recessionary freight environment and market uncertainty associated with tariffs and the status of emissions regulations impacted new truck in the last half of 2025. However, as Roger mentioned, in recent months we have seen an increase in new truck orders. In fact, Class 8 orders increased 91% and the industry backlog grew 33% to 175,000 units in the first quarter when compared to March of last year. We expect this increase in order activity to result in higher new unit sales in the second half of this year. Service and parts revenue increased 5% as average daily activity continues to grow and service backlog is beginning to increase. Service and parts gross profit represented 73% of segment gross profit during Q1. Turning to Penske Transportation Solutions, we are also encouraged by the stronger financial performance of Penske transportation solutions. During Q1, operating revenue declined 4% to $2.5 billion, lease revenue increased 2%, rental revenue declined 17% and logistics revenue declined 3%. PTS sold 9,319 units in Q1, ending the quarter with a fleet size of 387,500 units compared to 435,000 at the end of December 2024. Gain on sale declined by 26 million in Q1 26 compared to Q1 2025. As PTS continues to right size its fleet, higher fleet utilization, lower operating costs for maintenance, depreciation and interest expense contributed to an increase in earnings. Overall, our equity income from PTS increased 24% to $41 million. I would now like to turn the call over to Randall Seymour to discuss our international operations.

Randall Seymour

Thanks Rich. Good afternoon everyone. During Q1, international revenue was 3.3 billion which is up 6%. International new units were up 2% and used increased 3%. Same store service and parts revenue increased 7% as our strategies to increase customer pay drove a 10% increase which was more than offset the 3% decline in warranty. In the UK market. Q1 automotive registrations increased 6% to 615,000 driven by private and retail demand and an increase in Chinese OEM sales. While we were encouraged by Q1, the UK automotive environment remains challenging as inflation, higher taxes, consumer affordability and the government mandate towards electrification impacts the overall market. During Q1, our UK same store new units delivered were flat from lower sales of several German luxury brands and the elimination of the motability programs for these luxury brands. Same store used units increased 3% and gross profit per unit increased $500 sequentially when compared to Q4 2025 turning to Australia, our Earnings Before Tax (EBT) increased 15% compared to Q1 last year. In automotive our three Porsche dealerships in Melbourne continue to gain market traction through implementing our Porsche 1 ecosystem process. This process has driven higher customer satisfaction with all three dealerships in the top five including the top position nationally. Although we had a decline in new unit sales associated with the transition of the Macan to an all electric vehicle, we had a strong mix of higher end vehicles and our focus on pre owned and after sales continues to drive the business. In the Australian commercial vehicle and power system business we are diversified with revenue and gross profit split approximately 2/3 off highway and 1/3 on highway. The off highway business continues to grow. The current order book has exceeded our full year business plan with strength seen in energy solutions, mining and defence sectors. We have over 600 million Australian and secured orders so far for 2026. The engines and support we provide will be critical as this segment evolves. We continue to see the potential for our energy solutions business to generate at least 1 billion Aussie dollars in revenue by 2030. Over the last several years our focus has been to increase units in operation and to grow the recurring service, parts and remanufacturing aspects of our business. And this focus is starting to pay off. One of the major mining customers operates 125 megawatt power station with 20 Bergen engines that we installed four years ago. As part of the major maintenance interval we have begun to remanufacture 300 cylinder heads which will generate approximately 15,000 hours of work for our business. I would now like to turn the call over to Shelly Holgrave to review our cash flow, balance sheet and capital allocation.

Shelly Hulgrave

Thank you Randall. Good afternoon everyone. We remain committed to a strong balance sheet and a flexible and disciplined approach to capital allocation while driving our diversification strategy, implementing efficiencies and striving to lower cost. SG&A expenses increased by 1.5%, which is lower than the rate of inflation, while gross profit declined 1.7%. SG&A as a percentage of gross profit for Q1 2026 was 74.3%. Adjusted SG&A to gross profit was 73.3%. Q1 SG&A to growth was impacted by employee benefit costs up $4 million, payroll taxes and other UK social programs up 3.5 million, rent and real estate taxes up 7 million and lower automotive units and the impact from lower sales of new and used commercial vehicles at Premier Truck Group. During Q1 we generated $215 million in cash flow from operations and EBITDA of 397 million. During Q1 2026 we invested $63 million in capital expenditures. This is down from 85 million In Q1 2025 we completed acquisitions of two Lexus dealerships representing 450 million in estimated annualized revenue. We increased the cash dividend to $1.40 per share, representing the 21st consecutive quarterly increase on a forward basis. Our current dividend Yield is approximately 3.4% with a payout ratio of 39% over the last 12 months and we repurchased 170,000 shares of common stock for $26 million as of March 31, 2026, $221 million remained available for repurchases under our securities Repurchase Program program. Since the beginning of 2023, we have returned approximately $1.6 billion to shareholders through dividends and share repurchases. At the end of March, non vehicle long term debt was $2.6 billion and leverage was only 1.8 times. Despite completing several large acquisitions over the last six months, floor plan was 4.1 billion and and we had 425 million in vehicle equity for the quarter. Total interest expense increased $2 million. Floor plan interest decreased 4 million due to our cash management and lower interest rates, while other interest expense increased 6 million primarily from higher borrowings for acquisitions. We estimate a 25 basis point change in interest rates would impact interest expense by approximately $15 million. Our effective tax rate was 27.4% in Q1 2026, the prior year Results have been recast for the acquisition of Penske Motor Group using common control as disclosed last quarter. As a reminder, Penske Motor Group (PMG) was a partnership prior to our acquisition and was not subject to income tax Q1 2025 does not reflect federal or state income taxes. Had TMG been included in our taxable group. Therefore, period over period comparisons of net income and earnings per share may not be directly comparable. Due to the change in tax status of pmg, the impact to the effective tax rate would have been approximately 100 basis points and the impact to earnings per share would have been $0.05. Total inventory was 4.9 billion, up 77 million from December 2025. New vehicle inventory is at a 44 day supply including 46 days for premium and 29 days for volume. Forum used vehicle inventory is at a 39 day supply with the US at 33 days and the UK at 42 days. At the end of March we had 84 million in cash and liquidity of $1.2 billion. At this time. I will turn the call back to Roger for some final remarks.

Roger Penske (Chair and CEO)

Thank you Shelley. As mentioned, we added two Lexus dealerships to Penske Automotive Group (PAG) during the first quarter and today I’d like to welcome our new teams at Lexus of Orlando and Lexus of Winter Park to our organization. As I said earlier, we had a solid first quarter and I continue to remain optimistic about our business. New and used retail automotive grosses remain strong and service in parts continue to grow. Our diversification remains our key strength of our business model. The recovery in the commercial truck market is underway. We expect to increase new truck orders to benefit the second half of the year and our retail truck dealerships and PTS investment should benefit again today. Thanks for joining our call. We’ll take questions.

OPERATOR

Thank you. If you would like to ask a question, please press Star one on your telephone keypad to raise your hand and join the queue. And if you’d like to withdraw your question again, press Star one. Your first question comes from Michael Ward with Citigroup. Please go ahead

Michael Ward (Equity Analyst)

everybody. Thank you very much and good afternoon. I hope you all are doing well. Weather had a significant impact on the industry in January and February in the us. Can you quantify at all how much you were affected and were you able to get any of that back?

Rich Sherry

Hey Mike, this is Rich here. Good question. I mean as I mentioned in my prepared remarks, two significant storms, both one in January, one in February impacted. The first storm in January I think was almost 2,400 miles in, you know, it’s length and so it impacted our businesses from Texas all the way to the, to the Northeast. And so we had either delayed openings, multiple day closures, you know, as we had to deal with the cleanup. So February wasn’t as bad, but did impact pretty significantly the Northeast. Now the good news is obviously the competitors around us in those markets also suffered the same, same challenges. So we don’t think consumers were running to their dealerships to buy cars while we were struggling. But certainly from a fixed gross standpoint, you know, there was lost business there because that’s time you just can’t get back. So we had the added expense of the snow removal and then we attribute the fixed gross loss to about 4 to 5 million and then in total overall about a 6 million impact to our our earnings in Q1 as related to the weather.

Michael Ward (Equity Analyst)

Okay, thank you, Shelley. Shelley, you called out. …

Full story available on Benzinga.com

This post was originally published here

Microsoft Corp. (NASDAQ:MSFT) reports fiscal Q3 earnings after the bell today.

The company has routinely beaten earnings estimates, which explains the 90% chance Polymarket gives it of beating the $4.05 GAAP EPS consensus.

The more interesting action is on Kalshi, where traders are betting on which specific words Satya Nadella and his team will say on the 5:30 p.m. ET call.

What Kalshi Predicts

“Teams” is at 98%. “Dynamics” 97%. “Gaming” 97%. “LinkedIn” 97%.

Four near-locks, recurring revenue lines that get called out every quarter.

“OpenAI” is at 95%. Microsoft and OpenAI renegotiated their partnership Monday, with Microsoft’s IP license becoming nonexclusive through 2032 and OpenAI gaining the ability to serve products on other clouds.

For investors, the question is whether Nadella frames the reset as flexibility, risk, or continued Azure strength.

“Fairwater” at at 90%. Fairwater is Microsoft’s giga-scale AI datacenter program, connected by dedicated fiber …

Full story available on Benzinga.com

This post was originally published here

Bitcoin (CRYPTO: BTC) analysts are split three ways, with targets ranging from $100,000 by year-end to just 30% odds of breaking resistance.

21Shares: $100,000 By Year-End If Conditions Align

21Shares CIO Adrian Fritz pointed to spot Bitcoin ETFs absorbing nearly $2 billion year-to-date as evidence of renewed institutional confidence. 

Demand is coming from a mix of retail investors, institutions, and hedge funds using arbitrage and options strategies.

“Bitcoin now rivals mega-cap equities like Nvidia, with daily trading volumes exceeding $50 billion,” Fritz told CoinDesk’s Public Keys. 

“ETF structures provide both primary and secondary market liquidity, making the asset institutional ready,” he added.

Moreover, Fritz expects continued consolidation in the near term, with a move toward $100,000 by year-end if conditions align. 

He flagged several catalysts: improving geopolitical sentiment including any resolution tied …

Full story available on Benzinga.com

This post was originally published here

Bitcoin slipped to around $75,000 as traders reduced risk, with broader sentiment shifting from neutral to fear.

Cryptocurrency Ticker Price
Bitcoin (CRYPTO: BTC) $75,282
Ethereum (CRYPTO: ETH) $2,225
Solana (CRYPTO: SOL) $81.89
XRP (CRYPTO: XRP) $1.35
Dogecoin (CRYPTO: DOGE) $0.1017
Shiba Inu (CRYPTO: SHIB) $0.056039

Notable Statistics:

  • Coinglass data shows 179,931 traders were liquidated in the past 24 hours for $674.74 million.       
  • SoSoValue data shows net inflows of $440.7 million from spot Bitcoin ETFs on Wednesday. Spot Ethereum ET’Fs saw net inflows of $69.05 million.

Notable Developments:

Full story available on Benzinga.com

This post was originally published here

Bitcoin’s (CRYPTO: BTC) long-standing pitch as “digital gold” is facing a macro reality check. On Federal Reserve announcement days, the ETFs tracking it are behaving like high-growth tech proxies, moving in sync with interest rate expectations and liquidity signals.

Heading into the latest Fed policy decision and Jerome Powell’s press conference, trading patterns across major spot Bitcoin ETFs show a clear shift. Funds such as the iShares Bitcoin Trust (NASDAQ:IBIT), Fidelity Wise Origin Bitcoin Fund (BATS:FBTC), ARK 21Shares Bitcoin ETF (BATS:ARKB), and Grayscale Bitcoin Trust ETF (NYSE:GBTC) are increasingly moving more or less alongside equity benchmarks rather than acting as diversifiers.

On Wednesday morning, all the funds were trading marginally lower at less than 1%, same as the S&P 500. Meanwhile, the Nasdaq 100 index was not very far ahead, and was trading less than 1% higher.

data-variant=”card”

This post was originally published here

JP Morgan analyst Kenneth B. Worthington said Robinhood Markets, Inc.’s (NASDAQ:HOOD) first-quarter results fell short of expectations due to weaker revenue trends, while he lowered forecasts and trimmed his price forecast amid concerns about the durability of certain income streams.

Earnings Miss Driven By Revenue Weakness

Worthington noted that Robinhood reported first-quarter 2026 EPS of 38 cents, below the 43 cents consensus, as total revenue of $1.07 billion missed expectations of $1.14 billion. He attributed the shortfall to weaker transaction revenue and net interest revenue.

He highlighted pressure on transaction revenue, which came in at $623 million versus expectations of $661 million, as take rates declined across options and crypto.

He said options revenue fell short due to lower per-contract pricing, while crypto take rates also declined amid competitive pressure. Net interest revenue of $359 million also missed estimates, reflecting weaker securities lending activity in a softer IPO environment.

Costs, Deposits And Growth Trends

Worthington said Robinhood kept expenses well under control in the quarter, with adjusted operating expenses below prior guidance. However, the company raised its full-year expense outlook to account for investments tied to new initiatives, such as Trump Accounts.

He pointed to net deposits as a bright spot, with inflows of $17.7 billion exceeding expectations and tracking near the company’s 20% annual growth target. He added that April trends improved, with …

Full story available on Benzinga.com

This post was originally published here

Crypto still loves a price chart. The global conversation keeps circling ETFs, token cycles, and the next institutional allocation story. The lens is useful for traders, but it misses the more important product being built in plain sight.

In Latin America, stablecoins are not a side feature of crypto. They are becoming the account people actually use – a dollar-linked balance they can hold, move, receive, and spend. Especially if local money fails to carry enough trust.

In this context, the coming Stablecoin Conference LATAM in Mexico City feels like a preview of where consumer finance is heading. The event is scheduled for June 15-16, 2026, bringing together issuers, banks, policymakers, and infrastructure companies around digital money that people already treat as useful.

The Market Already Voted

The numbers now make the argument hard to dismiss. Latin America received $730 billion in crypto volume in 2025, with growth above 60% year on year. Monthly active crypto users in the region grew nearly 18%, three times faster than in the United States.

Between July 2022 and June 2025, Latin America recorded nearly $1.5 trillion in crypto transaction volume. Brazil alone received $318.8 billion, around one-third of the region’s activity, followed by Argentina, Mexico, Venezuela, and Colombia. Stablecoin purchases made up over half of all exchange purchases involving the Colombian peso, Argentine peso, and Brazilian real between July 2024 and the end of June 2025. 

Looks like the behavior of users choosing a balance they trust.

LATAM Did Not Adopt Stablecoins for the Narrative

There is a tendency in developed markets to frame stablecoins as a technology story. Faster settlement, better rails, programmable money, cleaner treasury operations. All of that is true, but it is not where the habit began.

In Latin America, the first product-market fit was much simpler. People wanted a way to hold value in a currency that didn’t punish them for waiting until next month. Businesses wanted to pay suppliers, receive money, and manage cash across borders without …

Full story available on Benzinga.com

This post was originally published here

XRP (CRYPTO: XRP) has experienced subdued price action over the past year, even as activity on its network has accelerated sharply, driven by growth in tokenized real-world assets.  

Tokenized Treasury Supply Jumps 8x

According to EvernorthXRP, tokenized U.S. Treasuries on the XRP network have grown from roughly $50 million to about $418.5 million over the past year, an eightfold increase.

The expansion reflects a broader trend of traditional financial instruments being issued and managed on blockchain infrastructure.

Network usage has also risen significantly. Transfer volume totaled approximately $70.1 million …

Full story available on Benzinga.com

This post was originally published here

ARK Invest CEO Cathie Wood maintains her $730,000 base case Bitcoin (CRYPTO: BTC) target for 2030 and says the bull market is still intact despite a 50% drawdown from all-time highs.

Gold Leading Bitcoin, Just Like Last Cycle

Wood explained that Bitcoin’s correlation to gold since 2019 stands at just 0.14, but gold has historically rallied before Bitcoin in previous cycles. She thinks the same pattern is playing out now.

“Bitcoin relative to gold has had a significant drop, but if you look at the longer term, you’ll see higher lows in terms of the very long-term trend line,” Wood said on The Rollup podcast. “The Bitcoin bull market is still intact,” she added.

ARK’s bull case projects Bitcoin reaching $1.5 million by 2030. Wood acknowledged taking flack for saying stablecoins had usurped some of Bitcoin’s role in emerging markets, but noted gold rallying simultaneously impacts Bitcoin’s store of value …

Full story available on Benzinga.com

This post was originally published here

Bitcoin (CRYPTO: BTC) is increasingly being framed by prominent investors as a macro-driven asset poised for a long-term bull cycle.

In an Apr. 29 podcast, Anthony Pompliano highlighted growing optimism among leading macro and crypto investors, who see Bitcoin as entering a structurally bullish phase rather than a speculative rally.

The bullish outlook is centered on four key drivers: expanding global liquidity, rising institutional participation, growing government engagement, and persistent inflation concerns. Collectively, these forces are seen as creating the foundation for a sustained upward trend in Bitcoin.

Arthur Hayes: Liquidity Is The Primary Driver

BitMEX co-founder Arthur Hayes reiterated his view that Bitcoin’s next major move will be driven by “digital credit” expansion and global liquidity cycles rather than retail speculation.

He has …

Full story available on Benzinga.com

This post was originally published here

For years now, the Federal Reserve has been chasing its 2% inflation target. Ryan Detrick, Chief Market Strategist at Carson Group, thinks it’s time investors stopped expecting it to get there — and started rethinking what higher inflation actually means for their money.

In an exclusive interview with Benzinga, Detrick made the case that the market is misreading the inflation story. Yes, prices are running hotter than the Fed wants. No, that doesn’t have to be bad news for stocks. In fact, he says, it might be the opposite.

The 2% Goal Is Slipping Out Of Reach

The Fed has long targeted 2% as its goal for annual inflation. But getting there has proven stubbornly difficult, and Detrick thinks the market is wrong to keep expecting it.

“What we’ve been saying for awhile, we’re in a 3% inflation world,” Detrick told Benzinga.

He pointed to the Personal Consumption Expenditures (PCE) Price Index, a popular Fed-watched gauge of consumer-price trends. Around 55% of its components are now climbing at more than 3% a year — up from about 45% a year ago.

“People hear that and they think immediately, oh my god , inflation’s higher. It has to be bad. That’s not true,” he said. History, he argued, doesn’t actually back up the idea that 2% inflation is normal: “Inflation has averaged around 4.5% throughout history, not the 2% that the Federal Reserve is targeting.”

data-variant=”card”
data-news-mode=”manual”

>


Read Also:

EXCLUSIVE: Ryan Detrick Shares A Political Trend For 2026 That Has Produced ‘Some Really Solid Returns’

This post was originally published here

Intel Corp (NASDAQ:INTC) shares are surging on Wednesday. The stock rose as much as 7.59% during the session. It touched a fresh 52-week high of $94.06.

The Nasdaq is up 0.33% while the S&P 500 has shed 0.05%.

• Intel stock is approaching key resistance levels. What’s driving INTC to record levels?

This follows a 24% jump last Friday. Momentum continues from a blowout first-quarter 2026 earnings report.

Investors are responding to aggressive analyst upgrades and crushed expectations.

AI Demand Supercharges Results

CEO Lip-Bu Tan emphasized that AI demand is driving growth. The shift toward inference and agentic AI increases CPU needs.

Intel reported adjusted earnings per share of 29 …

Full story available on Benzinga.com

This post was originally published here

On Wednesday, Enel Chile (NYSE:ENIC) discussed first-quarter financial results during its earnings call. The full transcript is provided below.

Benzinga APIs provide real-time access to earnings call transcripts and financial data. Visit https://www.benzinga.com/apis/ to learn more.

The full earnings call is available at https://edge.media-server.com/mmc/p/cyzvcrpb/

Summary

Enel Chile reported a 16% increase in EBITDA for Q1 2026, totaling $423 million, despite a 7% decrease in net income due to higher depreciation and financial expenses.

The company initiated construction on three battery energy storage projects to enhance portfolio flexibility, with projects expected to be operational by late 2027.

Hydrological conditions were favorable during the quarter, aiding stable operational performance and a forecasted hydro generation of 10.7 TWh for 2026.

Strategic agreements, such as the LNG supply deal with Shell, aim to optimize gas supply and align with Enel Chile’s long-term vision.

The regulatory environment is challenging, with tariff resettlements postponed, affecting expected cash flows; however, the company remains engaged with regulators for future tariff reviews.

Management highlighted the importance of electrification in Chile as a growth driver and emphasized a focus on investment in renewables and battery storage.

The company’s financial position remains robust, with $454 million in cash and available credit lines totaling $640 million to support ongoing operations and investments.

Full Transcript

OPERATOR

Good morning ladies and gentlemen and welcome to Enel Chile first quarter 2026 results conference call. My name is Carmen and I’ll be your operator for today. At this time all participants are in a listen only mode. After the speaker’s presentation there will be a question and answer session. To ask a question during the session you will need to chat through the webcast. During this conference call we may make statements that constitute forward looking statements within the meaning of the Private Securities Litigation Reform act of 1995. Such statements may include Enel Chile’s Current Expectations, Intentions, Plans, Beliefs and Projections. Forward looking statements are based on management’s current assumptions and expectations, do not guarantee future performance and involve risks and uncertainties. Actual results may differ materially from those anticipated in the forward looking statements as a result of various factors. These factors are described in the Enel Chile’s press release on its first quarter 2026 results. In the presentation accompanying this conference call, NEnel Chiles annual report on Form 20F on the risk factors. You may access our first quarter 2026 results press release and presentation on our website www.nl.cl and our 20F on the SEC’. Readers are cautioned not to place undue reliance on these forward looking statements which speak only as of their dates and Enel Chile undertakes no obligation to update these forward looking statements or to disclose any development as a result of which these forward looking statements become inaccurate except as required by law. I would now like to turn the presentation over to Ms. Isabella Clemis, head of Investor Relations of ENEL Chile. Please proceed.

Isabella Clemis

Buenos Dias. Good morning and welcome to Enel Chile’s 2026 first quarter results presentation. We greatly appreciate you taking the time to join us today. My name is Isabella Clemis. I’m the Head of Investor Relations. Joining me this morning are our CEO Gianluca Palongo and our CFO Simone Conticelli. Our presentation and related financial information are available on our website www.enel.cl in the investors section as well as through our Investors app. In addition, a replay of the call will soon be available. At the end of the presentation there will be an opportunity to ask questions questions via webcast chat through the Ask a Question link. Participants are connected in listening mode. Gianluca will kick off the presentation by covering key highlights of the period, our portfolio management actions and providing updates on the regulatory contest. Following that, Simone will offer an overview of our business, economic and financial performance. Thank you all for your attention and now let me hand over the call to Gianluca.

Gianluca Palongo (Chief Executive Officer)

Thank you Isabella, Good morning and thank you for your participation. Let’s start the presentation with our main highlights of the period. Let’s begin with portfolio management. During the quarter, hydrological conditions were favorable which helped us reduce portfolio risk and supported a stable operating performance across the business. We will come back to this point in more detail later on. At the same time, through EGP Chile, we started the construction of three battery energy storage projects in the northern part of the country. These base projects will add around 0.5 gigawatts of additional capacity and will play a key role in strengthening the flexibility of our portfolio while supporting our commercial strategy. In addition, Enel Generacion Chile signed a new LNG supply agreement with Shell. This agreement allows us to better valorize surplus gas volumes already available and to optimize LNG and Argentine gas supply for our generation business. Importantly, this initiative is fully aligned with our long term business vision for Chile. This is particularly relevant in the context of the growing deployment of battery energy storage systems which are essential to ensure a more flexible and efficient portfolio. Let’s now move to the country and regulatory context. Starting with the VAD 2020-2024 process, tariff resettlements have been postponed until July 2026. At this stage, the regulator is working on alternative solutions to fund this payment with the objective of avoiding any impact on regulated customers tariffs. Turning to the VAD 20242028 process during the quarter, the regulator published the Preliminary Technical Report Volume 2 in January 2026. Over the next few months, we are awaiting the publication of the final report. Let’s now turn to business profitability. The first quarter of 2026 delivered consistent financial results. EBITDA showed a solid improvement compared to previous years plus 16% during the period. The extraordinary General Meeting approved a capital increase of CLP 360 billion at Enel Distribution Chile, reinforcing the company’s balance sheet and overall financial flexibility. In addition, the annual General Meeting approved the final dividend, fully in line with our commitment to shareholder returns and value creation. In the next slides, we will go deeper into each of these areas and provide further details on the key drivers behind these results. Let’s move to slide 4 to talk about hydrology and the progress of our battery energy storage project. Let me begin with our hydro generation. Hydro generation during the quarter remained broadly in line with last year’s level. As shown on the left hand side of the slide for 2026, we are forecasting hydro generation at 10.7 TWh. This assumption is based on a conservative view on hydrology. Fully consistent with the average evolution observed over the last 13 years. That allows us to confirm our 2026 guidance. This is the case even though the probability of an El Nino event has increased in recent weeks, with potential impacts mainly expected in the second half of the year. This level of performance is supported by our well diversified hydro portfolio together with continuous operational optimization. Moving now to gas activities on gas sourcing, we have signed contracts with Argentine gas suppliers with a longer tenor compared to previous years. These contracts secure firm volumes at more competitive prices, providing stable supply until April 2027. In parallel, in the context of high gas prices and the more flexible demand outlook for our thermal fleets, we concluded a negotiation related to our long term LNG agreement. This approach is well aligned with our view of a gradual ramp up of battery storage in the coming years, supported by a solid and reliable gas supply from Argentina. Finally, let me focus on battery storage. We continue to strengthen our generation portfolio through the development of battery energy storage systems. These investments will increase the flexibility of our portfolio and support the long term resilience of our generation mix. In addition, they will continue to optimize our sourcing strategy. In this context, approximately 450 megawatts of new battery capacity are currently under development and will gradually start operations from 1227 ahead in line with our planned investment schedule. And now let’s move to slide 5 where we will review our generation portfolio and the energy balance. Let me start with our generation portfolio. We entered 2026 with a solid and well diversified portfolio. In fact, our total net installed capacity stands at 8.9 gigawatts, of which 78% comes from renewable energy sources. Therefore, this structure enhances flexibility and supports a balanced and resilient energy mix. Moving now to our energy balance during the first quarter of 2026, net production remains stable compared to the same period last year. This performance reflects the flexibility of our generation portfolio. Higher contributions from wind, solar and efficient natural gas combined cycles more than compensated for the slightly lower hydro generation. Physical energy sales amounted to 7.5 TWh, fully in line with the level recorded in the first quarter of last year. This confirms the stability of our commercial positioning supported by our diversified sourcing mix. On energy purchases during the quarter, we maintained a similar purchasing mix compared to last year. This included 1.3 TWh of net spot market purchases and 0.8 TWh sourced from third parties. And now I would like to take a moment to share with you some key topics related to the distribution business which we will cover on the next slide. Let me start with the tariff review shown on the left hand side of the slide. We are in the 2024-2028 Distribution Tariff Review process. In January of this year, the regulator released the second version of the technical report. The remaining technical steps are expected to lead the final tariff determination in the second half of 2026. Overall, the review is progressing in line with the regulatory timetable. Turning now to the VAD 2020 24, the settlement of the outstanding debt with distribution companies which was …

Full story available on Benzinga.com

This post was originally published here

EMCOR Group (NYSE:EME) released first-quarter financial results and hosted an earnings call on Wednesday. Read the complete transcript below.

Benzinga APIs provide real-time access to earnings call transcripts and financial data. Visit https://www.benzinga.com/apis/ to learn more.

View the webcast at https://edge.media-server.com/mmc/p/9qgwe89b/

Summary

EMCOR Group reported strong financial performance for Q1 2026 with revenues of $4.63 billion, marking a 19.7% year-over-year growth and an operating income of $404 million with an 8.7% operating margin.

The company achieved significant growth in its construction segments, with electrical construction revenues up by 33.1% and mechanical construction revenues increasing by 28.9%.

EMCOR Group’s remaining performance obligations (RPOs) totaled $15.62 billion, reflecting a 32.9% year-over-year increase, driven by robust demand in sectors like data centers, healthcare, and water and wastewater.

The company raised its full-year 2026 guidance, expecting revenues between $18.5 and $19.25 billion and diluted EPS between $28.25 and $29.75, citing strong market momentum and operational excellence.

Management highlighted strategic priorities such as enhancing training and productivity, maintaining contract management discipline, and focusing on field leadership excellence as key drivers of sustainable growth.

Full Transcript

Cindy (Conference Operator)

Good morning. My name is Cindy and I will be your conference operator today. At this time I would like to welcome everyone to the EMCOR Group first quarter 2026 earnings conference call. All lines have been placed on mute to prevent any background noise. After the speaker’s prepared remarks, there will be a question and answer session. If you would like to ask a question during this time, simply press Star, then the number one on your telephone keypad. If you would like to withdraw your question, please press the pound key. I will now turn the call over to Lucas Sullivan, Director, Financial planning and analysis. Mr. Sullivan, you may begin.

Lucas Sullivan (Director, Financial Planning and Analysis)

Thank you, Cindy. Good morning everyone and welcome to EMCOR’s first quarter 2026 earnings conference call. For those of you joining us by webcast, we are at the beginning of our slide presentation that will accompany our remarks today. This presentation will be archived in the Investor Relations section of our website at emcor-group.com with me today are Tony Guzzi, our Chairman, President and Chief Executive Officer Jason Albandian, Senior Vice President and Chief Financial Officer and Maxine Mauricio, Executive Vice President, Chief Administrative Officer and General Counsel. For today’s call, Tony will provide comments on our first quarter 2026 and discuss our RPOs. Jason will then review the first quarter numbers then turn it back to Tony to discuss our guidance before we open it up for Q and A. Before we begin, a quick reminder that this presentation and discussion contain certain forward looking statements and may contain certain non GAAP financial information. Slide 2 of our presentation describes in detail these forward looking statements and the non GAAP financial information disclosures. I encourage everyone to review both disclosures in conjunction with our discussion and accompanying slides. And finally, as a reminder, all financial information discussed during this morning’s call is included in our consolidated financial statements within both our earnings press release issued this morning and and in our Form 10Q filed with the securities and Exchange Commission. And with that, let me turn the call over to Tony.

Tony Guzzi (Chairman, President and Chief Executive Officer)

Tony? Yeah. Thanks Lucas. And I’m going to start my discussion on pages three and four. Good morning and thanks for joining us today. I’m pleased to report another outstanding quarter for EMCOR. Our first quarter 2026 results demonstrate the sustained momentum we have built over many years with strong execution across our business segments and continued growth in our core market sectors and geographies. In the first quarter we generated revenues of 4.63 billion representing year over year growth of 19.7% and organic growth of 16.8% when adjusting for incremental acquisition contribution and the sale of Emcor UK operating income reached 404 million with an 8.7% operating margin while diluting earnings per share of $6.84 represents an increase of 30% versus the first quarter of 2025. This reflects our strategic positioning in high growth markets and operational excellence across our construction and services platforms. These results demonstrate our customers continued confidence in EMCOR as one of their partners of choice for complex mission critical projects. Our construction segments once again performed extremely well in the quarter. The electrical construction segment generated year over year revenue growth of 33.1% with a 12.1% operating margin while the mechanical construction segment achieved 28.9% revenue growth with a 10.9% operating margin. This performance reflects the range of our capabilities across both trades and geographies. It also takes into account increased customer scope and our reputation as one of the premier specialty contractors for complex, fast paced projects. Our construction segment’s growth was driven primarily by increased activity in network and communications which is where our data center business rests institutional, manufacturing and industrial, healthcare and water and wastewater market sectors within our mechanical construction segment. We also benefited from increased commercial market sector revenues driven primarily by the resumption of demand for warehousing, distribution and logistics projects. Our teams continue to leverage our prefabrication and our virtual design and construction capabilities, excellence in labor management and planning, large project coordination and execution and a disciplined focus on contract negotiation, administration and the adherence to those terms. The U.S. building Services segment delivered solid results led by impressive performance in our mechanical services division. While we still face slight revenue headwinds within our site based business, we we’ve begun to see the benefits of the restructuring on the cost side which reduced overhead costs and we have a more profitable contract portfolio mix. Our industrial services segment generated revenue growth of 6.4% and that was driven by our field services division. Now I’m going to turn to page five. Our remaining performance obligation position strengthened significantly during the quarter providing excellent visibility for sustained growth. Our RPOs totaled $15.62 billion at the end of the quarter versus $11.75 billion in the year ago period and $13.25 billion as of December 31, 2025. This represents year over year growth of 32.9% and sequential growth of 17.9%. These diverse RPOs reflect continued strong demand across many market sectors with particularly robust activity in network accumulations or data centers where we continue to expand our geographic footprint and scope of services to better serve our customers. We see no sign of slowing demand in this vertical where customer investments in AI infrastructure, cloud infrastructure and overall digital transformation are driving unprecedented levels of activity. We are pleased with the quality and diversity of our work outside booked outside of the data center space, including notable awards within water and wastewater as we continue to win new projects in Florida. Institutional Driven by demand for upgraded lab space by certain colleges and universities and healthcare as our customers continue to modernize their facilities while seeking to make them more flexible and responsive, the strong operational and financial performance I’ve outlined demonstrate the effectiveness of our strategic initiatives and the depth of our execution capabilities. Our teams continue to deliver exceptional results for our customers while maintaining disciplined financial management and operational excellence and continued good contract negotiation and adherence to the contract terms we negotiate. With that context, I will turn it over to Jason who will provide a detailed review of our first quarter financial results.

Jason Albandian (Senior Vice President and Chief Financial Officer)

Thank you Tony and good morning everyone. Starting with Slide 6, which shows revenues, I’m going to cover the operating performance for each of our segments as well as some of the key financial Data for the first quarter of 2026 as compared to the first quarter of 2025. As Tony mentioned, revenues of $4.63 billion established a quarterly record for EMCOR, increasing 19.7% or 16.8% on an organic basis when excluding acquisitions and adjusting for the sale of emcor.uk revenues of electrical construction were $1.45 billion, increasing just over 33%. This segment generated increased revenues from the majority of the market sectors we serve, with the most significant growth coming from network and communications, where revenues increased by nearly 50% driven by strong demand for data centers. While this accounted for two thirds of the segment’s growth, we did experience notable revenue increases across a number of other sectors including hospitality and entertainment, due in part to progress made on a stadium project and institutional as a result of certain public sector projects in the quarter. Our electrical construction segment also benefited from greater levels of short duration projects and service work. Mechanical Construction revenues of 2.03 billion are up nearly 29%. Similar to electrical, this segment once again experienced the greatest growth from the network and communications market sector, where revenues increased by 86%. Increased cooling requirements and advancements in liquid cooling, particularly for AI data centers continue to drive opportunities for this segment. Beyond data centers, Mechanical generated quarterly revenue growth from the majority of the other sectors in which we operate, notably institutional. Revenues doubled year over year. Manufacturing and industrial, including food processing, was up 34% and commercial increased by 33%, driven by warehousing, distribution and logistics projects, largely within fire protection during the quarter. The segment also benefited from increased service revenues as we continued to expand our maintenance and inspection base both within traditional mechanical services as well as our fire life safety offerings. On a combined basis, our construction segments generated revenues of 3.47 billion, an increase of 30.6%. I should note that this performance established new quarterly revenue records for each of these segments. Moving to building services, revenues of 772.6 million grew by 4%, driven by our mechanical services division, which generated a 6% increase in revenues. From a service line perspective, the most significant growth was seen in repair, service service maintenance and building automation and controls. Revenues of our industrial services segment were $381.8 million, an increase of 6.4%. Greater contribution from our field services operations due primarily to progress made on a large solar project was partially offset by a reduction in revenues within our shop services division due to lower heat exchanger sales and related services. I’ll turn to Slide 7. For operating income, we generated operating income of 403.8 million or 8.7% of revenues, both of which are records for EMCOR. For a first quarter, this represents an increase in operating income of 26.7% and operating margin expansion of 50 basis points versus the prior year. When adjusting for the acquisition transaction costs which were incurred in Q1 of 2025, operating income grew by 23.1% and operating margin increased by 25 basis points. Once again, if we look at each of our segments due to the growth in revenues, operating income for electrical Construction increased by 28.2% to a quarterly record of 174.5 million. Operating margin of 12.1% compares to 12.5% a year ago. With consistent gross profit margins, this segment continues to execute well across its project portfolio, with the year over year decrease in operating margin primarily resulting from an increase in intangible asset amortization. Given the one month of incremental expense from the Miller acquisition, Mechanical Construction had operating income of 221.6 million and 18.7% increase. From an end market standpoint, this segment generated greater gross profit across many of the sectors in which we operate, with the largest increases generally tracking in line with the growth in its revenues. Operating margin of 10.9% compares to 11.9% in last year’s first quarter. As we anticipated when we exited 2025, operating margin in this segment decreased due to a shift in mix that included a greater percentage of revenues from projects where we’re acting as either a construction manager or prime contractor and which inherently carry lower than average gross profit margins due to reduced markups on materials, equipment and subcontractor costs. In addition, we had an increase in the number of GMP or cost plus projects, particularly in newer geographies around projects where scope or design are still evolving. Together, our construction segments grew operating income by nearly 23% and earned a combined operating margin of 11.4%. Building services generated operating income of 40.4 million, which represents an 11.1% increase. An operating margin of 5.2% expanded by 30 basis points. This segment benefited from strong performance within its mechanical services division which experienced a favorable mix given the greater volume of higher margin service and controls projects. Also, as Tony mentioned, while we do face some headwinds within our site based business, the restructuring we did last year has proven to be successful resulting in both reduced overhead costs and a more profitable contract portfolio. And lastly, operating income for industrial services was 12.8 million, an increase of 89.1% and operating margin of 3.3% expanded by 140 basis points. As a reminder and contributing to the favorable year over year comparison, the results for this segment in last year’s first quarter were negatively impacted by a $4 million increase in the allowance for credit losses which negatively impacted operating margin for Q1 of 25 by 110 basis points. Excluding this impact, the remaining increase in operating income and operating margin was primarily a result of greater gross profit and greater gross profit margin within its field services division. If we quickly turn to page eight, I’ll cover a few items not included on the previous slides. Gross profit of $864 million increased by 19.5% and our gross profit margin of 18.7% remained consistent with that of the prior year, which represents a record level of performance for a first quarter. SGA was 460.1 million or 9.9% of revenues, compared to 404 million or 10.4% of revenues a year ago. With the top line growth we experienced during the quarter, we are pleased with the operating leverage we attained as evidenced by the decrease in our SGA margin. And finally on this page, diluted earnings per share was $6.84, which represents an increase of 30% or 26.4% when excluding the transaction costs in last year’s first quarter. And finally for me, let’s turn to Slide 9 which covers our balance sheet. Our balance sheet, including 916 million of cash on hand and 1.25 billion of working capital, remains strong and liquid and enables us to continue to fund organic growth, pursue strategic MA and return capital to shareholders. During the quarter, we returned 105 million of cash to our shareholders through stock repurchases and our quarterly dividend. Although not shown on this page, due to an increase in accounts receivable, given our strong organic revenue growth and coupled with the payment of the prior year’s incentive compensation awards, cash flows from operations in the first quarter were essentially neutral. However, for the full year we remain confident in our ability to generate operating cash flow at least equivalent to net income or up to 80 to 85% of operating income consistent with previous years. With that, I’ll turn the call back over to Tony.

Tony Guzzi (Chairman, President and Chief Executive Officer)

Yeah, thanks Jason and I’m going to be on pages 10 and 11 given our strong start to the year and the strength of our remaining performance obligations, we are raising our full year 2026 guidance. We are increasing our revenue and diluted earnings per share guidance to a range that reflects our confidence and in the sustained operational excellence that we have exhibited and strong market momentum. Such guidance reflects the demand that we are seeing and our success of winning and executing large scale projects across many geographies and market sectors. We now expect to earn revenues of between 18.5 and $19.25 billion and diluted earnings per share of between $28.25 and $29.75. As a reminder, EMCOR’s business is characterized by project cycles and timing then can create quarterly variability. However, our guidance reflects our current expectation of continued strong operating margins throughout 2026, supported by disciplined project selection and execution. We are focused on maintaining pricing discipline while delivering exceptional value to our customers. Our sustained success is built on focused execution across a number of key priorities that differentiate Emcor and position us for continued growth. I’m now going to highlight four of them. The first one is our training, peer learning and our productivity initiatives. We continue to leverage our training programs, our virtual design and construction capabilities, prefabrication facilities and capabilities, and advanced project planning and delivery methodologies. We are committed to improving our means and methods every day, sharing knowledge across our organization and investing in workforce training, retention and expansion. The second item is contract management discipline and negotiation. We deliver exceptional results for our customers. However, we do protect our rights and interests through careful contract management negotiation, particularly on complex, fast paced projects. Third, we’re known for field service, field leadership excellence, one could argue that is our core product. Our field leadership excellence, from frontline foremen and superintendents to project managers and executives and subsidiary and segment leaders make Emcor an employer, a choice in our industry. And finally, supporting all that is our commitment to invest with discipline and for the long term, we maintain a disciplined approach for how we grow organically and through acquisition. This, coupled with the return of cash to shareholders through dividends and share repurchases, has provided the foundation for our compounding record of success over the past decade and provides balance to our approach to capital allocation. These interconnected priorities create a sustainable competitive advantage that drives superior, durable performance across many diverse geographies and market sectors. The fundamentals of our business remain strong with sustained demand across several key market sectors. We will continue to always face macroeconomic challenges. In fact, I can’t remember a time when we haven’t had them, such as geopolitical events, rising commodity prices, but our team has consistently demonstrated the ability to navigate complexity and continue to deliver results. Our success is a direct result of their dedication, their resilience expertise, which results in executional excellence and from our teammates across the organization, I want to thank every member of the EMCOR team for their contributions to our outstanding first quarter performance and over the long term and for everything you do to serve our customers, keep each other safe and drive our success every day. Thank you for your time this morning. We will now open the line for questions and Cindy, I will turn the call over to you.

Cindy (Conference Operator)

We will now begin the question and answer session. To ask a question, you may press Star then one on your touch tone phone. If you are using a speakerphone, please pick up your handset before pressing the keys. If at any time your question has been addressed and you would like to withdraw your question, please press Star then two. At this time we will pause momentarily to assemble our roster. Our first question comes from Adan Thalheimer of Thompson Davis. Go ahead please.

Adan Thalheimer (Equity Analyst)

Hey, good morning guys. Congrats on the strong Q1 and the record orders. I guess I wanted to start on the book to bill and orders. I mean I think at 1.5 times that was a record book to bill for you guys. And Tony, you broadly talked about the pipeline, but I’m just curious if you can give more detail on the pipeline and what the expectation should be for orders for the rest of the year.

Tony Guzzi (Chairman, President and Chief …

Full story available on Benzinga.com

This post was originally published here

Acadia Realty Trust (NYSE:AKR) reported first-quarter financial results on Wednesday. The transcript from the company’s first-quarter earnings call has been provided below.

This transcript is brought to you by Benzinga APIs. For real-time access to our entire catalog, please visit https://www.benzinga.com/apis/ for a consultation.

The full earnings call is available at https://edge.media-server.com/mmc/p/65qz828r/

Summary

Acadia Realty Trust reported a strong first quarter, with 11% year-over-year earnings growth driven by nearly 6% same-store growth and over $2.5 billion in transactional activity.

The company remains focused on its street retail portfolio, capitalizing on limited supply and increasing demand. It completed notable acquisitions in Palm Beach and Boston’s Newberry Street.

Future guidance has been raised, with full-year 2026 earnings projected at $1.22 to $1.26 per share, reflecting ongoing internal and external growth as well as a robust acquisition pipeline.

Full Transcript

OPERATOR

Good day and thank you for standing by. Welcome to the Acadia Realty Trust first quarter 2026 earnings conference call. At this time, all participants are in a listen only mode. After the speaker’s presentation, there will be a question and answer session. To ask a question during the session, you’ll need to press star 1-1 on your telephone. You will then hear an automated message advising your hand is raised to withdraw your question. Please press star 1-1 again. Please be advised that today’s conference is being recorded. I’d now like to hand the conference over to Lynelle Ray, Lease Administration and Due Diligence Analyst. Please go ahead.

Lynelle Ray (Lease Administration and Due Diligence Analyst)

Good morning and thank you for joining us for the first quarter 2026 Acadia Realty Trust Earnings conference call. My name is Lynelle Ray and I’m a lease administration and due diligence analyst. Before we begin, please be aware that statements made during the call that are not historical may be deemed forward looking statements within the meaning of the Securities and Exchange Act of 1934 and actual results may differ materially from those indicated by such forward looking statements due to a variety of risks and uncertainties, including those disclosed in the Company’s most recent Form 10-K and other periodic filings with the SEC. Forward looking statements speak only as of the date of this call, April 29, 2026, and the Company undertakes no duty to update them. During this call, management may refer to certain non GAAP financial measures., including funds from operations and net operating income. Please see Acadia’s earnings press release posted on its website for reconciliations of these non GAAP financial measures. with the most directly comparable GAAP financial measures.. Once the call becomes open for questions, we ask that you limit your first round to two questions per caller to give everyone the opportunity to participate. You may ask further questions by reinserting yourself into the queue and we will answer as time permits. Now it is my pleasure to turn the call over to Ken Bernstein, President and Chief Executive Officer, who will begin today’s management remarks. Thank you Lynelle.

Ken Bernstein (President and Chief Executive Officer)

Great job. Welcome everyone. As you can see in our press release, we had another strong quarter in what is shaping up to be a very solid year, both with respect to our internal as well as our external growth initiatives. And while geopolitical events have certainly added unwanted uncertainty to the global economy, thankfully due to the tailwinds for open air retail in general and then even more so for street retail, we are seeing continued strong results driven by strong tenant performance, demand, and attractive investment opportunities. As the team will discuss in more detail, we delivered 11% year over year earnings growth driven by nearly 6% same-store growth. Even with heightened uncertainty in the capital markets, we completed over $2.5 billion in transactional activity comprised of $600 million of new investments, over $500 million of recapitalizations within our investment management platform and a new $1.4 billion corporate borrowing facility. Now, since I have discussed in detail the key drivers of the tailwinds in open air retail on our previous calls, I will limit my explanation a bit. But in short, our continued strong performance is being driven most significantly by our street retail portfolio and more specifically by five key factors. First, limited supply that continues to shrink. Second, and probably more importantly, increasing demand due to the ongoing focus by retailers to having their own physical locations rather than being so heavily reliant on either wholesale or digital channels. Third, strong tenant performance due to a resilient consumer, especially the upper end shoppers at our street locations. Fourth, lighter relative capex in our retenanting of street locations and finally, stronger annual income growth in our street locations due to both higher contractual growth and then more frequent mark to market opportunities. These continued tailwinds are enabling us to deliver solid internal top line growth and having that growth hit the bottom line both in terms of earnings growth as well as net asset value growth. AJ Levine will discuss our progress last quarter and why we are poised to continue to deliver superior growth for the foreseeable future. And then supplementing this internal growth and ensuring that we can continue to deliver this steady growth well into the future is our external growth initiatives. Reggie Livingston will discuss our acquisition activity over the last quarter where we continue to deliver on our goals both with respect to our on balance sheet acquisitions of street retail and our execution through our investment management platform. But let me give a few observations as we have seen more investor interest in retail over the past year. Competition has increased for most formats of open air retail, but so has the volume of deals coming to market. So even with increased competition we expect to be able to meet our acquisition goals. And while we welcome the company, it has been a bit more difficult to simply buy existing yield to make our targeted returns. So as it relates to street retail investment opportunities, while competitive, it’s still a less crowded field than in other formats with fewer capable buyers. So we’re still seeing enough attractive investments that are accretive day one both to earnings and net asset value. And we are most focused on investments where there are near term value creation opportunities where we can use our skill set and relationships to unlock that value. We’re still finding deals that get us to a 6% plus yield in the near term, but require a few more moving pieces. And since our team has never been hesitant to use its value add skills and relationships, this shift is welcomed. Same is true for our investment management platform. The ability to achieve opportunistic returns by simply buying stable assets, as we successfully did during our Fund 5 investment period a few years ago, is becoming increasingly difficult. Thus, our recent investments over the past year have been much more value add focused and we expect that focus to continue. And as it relates to our investment management activity, we can actually team up with the increasing pool of institutional capital and harness that increased interest so we don’t have to just beat them. We can join them as well. And to be clear, with respect to both our REIT and Investment management acquisitions, our goal continues to be to make sure our investments are accretive to earnings and to net asset value day one and to achieve a penny of FFO. for every $200 million in assets acquired. Reggie will walk through how our most recent activity is meeting our goals both in terms of volume and accretion, and then equally importantly, how we are planting seeds for continued superior growth down the road. Then finally, John Gottfried will walk through our balance sheet metrics and how we are positioned to continue to drive both internal and external growth with plenty of dry powder and diverse sources of capital. So to conclude, our street retail investment thesis is working. The internal and external opportunities we see provide a clear line of sight into providing solid multi year top line growth and then having that growth drop to the bottom line. Then, with ample balance sheet capacity, we’re in a position to capitalize on the exciting opportunities that we have in front of us. I’d like to thank the team for their continued hard work and with that I will hand the call over to A.J.

AJ Levine

thanks Ken. Good morning everyone. So I’d like to start out with an update on internal growth with a focus on trends and performance on our high growth streets. Then I’ll touch on some of our slower to recover markets with significant upside, namely San Francisco and North Michigan Avenue. And I’ll finish with an update on Henderson Avenue in Dallas. Overall, another strong quarter of leasing across the board street Suburban, both within the REIT portfolio as well as our investment management platform. Our total volume of signed leases in Q1 was an additional $3.5 million at our share. We’ve grown our pipeline of new leases in advanced negotiation to $11.5 million, which is a net increase of nearly $2.5 million above the previous quarter. As we sign leases, we are quickly reloading the pipeline and then some. As Ken articulated, because of the historically strong supply demand dynamic and the resilient high income consumer that shops our streets, all signs indicate that we’ll be able to deliver similar results through the remainder of this year and beyond. In addition to an accelerating leasing velocity, we are also seeing a steady rise in market rents on our high growth streets. We are currently negotiating new leases, fair market renewals and pry loose mark to markets along several of our streets including soho, Upper Madison Avenue, M Street, Armitage Avenue and Melrose Place. These are all markets that have experienced several years of double digit rent growth and if we’re successful in signing these new deals, it will result in a weighted average spread of just over 40%. Now remember, street leases have 3% contractual growth, so a 40% spread after five years of 3% growth means that rents have grown closer to 60% over that time period. This is what we mean when we say that not all spreads are created equal now incremental to the sector leading growth that we’re seeing on our streets. We’re also continuing to build conviction around historically strong markets that are in the earlier stages of recovery like San Francisco and North Michigan Avenue in Chicago. At our last update we reported that since the start of 2025 we had signed about 90,000 square feet of new leases across our two assets with LA Fitness Club Studio and TNT Supermarkets. Since our last update and following the end of the first quarter, we’ve added another 25,000 square feet by signing Sprouts Farmers Market who will be joining Trader Joe’s and club studio at 555 Ninth street and like TNT and Club Studio, this will be their first store in San Francisco. What’s become clear is that tenants are strengthening their conviction around the recovery of San Francisco and with another 70,000 square feet of space remaining to lease, in addition to some accretive pri loose opportunities, we are gaining increased confidence that we can continue to unlock the meaningful remaining embedded value within our two San Francisco centers. Now right behind San Francisco is North Michigan Avenue, which continues to see steady improvement and has certainly moved beyond the green shoots phase of recovery. We still have a ways to go, but foot traffic has returned to pre2019 levels and since the start of this year there has been a noticeable increase in tenant demand. Over the last year we’ve seen new store openings and new lease signings from top brands like Mango, Aritzia, Uniqlo and American Eagle. And Most recently the 60,000 square foot Candy hall of Fame at 830 N. Michigan Ave. Even so, rents are still 50% below where they were at prior peak.. North Michigan Avenue is an iconic, irreplaceable street and we are confident that the recovery will continue to accelerate. And when it does, we’ll be well-positioned to capture that upside. And finally, I’ll end with an update on Henderson Avenue in Dallas. As a reminder, the vision on Henderson is to create a vibrant, walkable street curated with a mix of today’s most sought after retailers and supplemented with dynamic and recognizable F and B. Mixing the best of what’s worked on streets like Armitage Avenue in Chicago, Bleecker street in New York, Melrose Place in LA and M Street in D.C. in short, Dallas. First and only true street retail shopping experience. The street is already off to a great start with tenants like Jacovas and Warby Parker producing sales that could already justify rents doubling. And with 80% of our retail on the street now spoken for, our new leases are doing just that. I can’t reveal the names of all of the brands that have committed, but to give you a flavor, the project will consist of a healthy mix of nationally recognized tenants like Rag and Bone who is relocating from Highland Park Village, along with a collection of younger brands that have had success on some of our other high growth streets like Gezio, Cami and Margaux. And we’re saving around 10% of our space for brands that are more local and authentic to Texas. Add in some fun high volume F and B like Prince Street Pizza, pop up bagels and salt and straw ice cream and you have the makings of a well curated walkable street. So in summation, the key takeaway is that despite consistently high levels of leasing activity over the past several quarters, we continue to see meaningful Runway ahead both in terms of mark to market opportunity and ongoing lease up of our high growth streets as well as tapping into markets that have more recently begun to show the signs of a strong recovery. As always, I’d like to thank the team for their hard work and with that I will turn things over to Reggie.

Reggie Livingston

Thanks AJ and good morning everyone. I’ll cover two things, our transaction activity for Q1 and through April and then I’ll share some perspective on what we’re seeing in the market. On the transaction front, we’ve been incredibly busy year to date. We’ve closed over 1 billion in acquisitions and recapitalizations, gained footholds on two of the country’s premier luxury retail corridors, all while achieving our accretion and growth thresholds and building a pipeline that should maintain a high level of activity for the balance of the year. So let’s walk …

Full story available on Benzinga.com

This post was originally published here

ONEOK (NYSE:OKE) reported first-quarter financial results on Wednesday. The transcript from the company’s first-quarter earnings call has been provided below.

This content is powered by Benzinga APIs. For comprehensive financial data and transcripts, visit https://www.benzinga.com/apis/.

Access the full call at https://event.choruscall.com/mediaframe/webcast.html?webcastid=1bF093VI

Summary

ONEOK reported strong first-quarter earnings with a 12% year-over-year increase in net income, reaching $776 million, and raised its 2026 financial guidance due to robust performance and favorable market conditions.

The company is focusing on strategic initiatives such as the expansion of its natural gas and NGL infrastructure, including projects in the Permian and Powder River Basins, while maintaining a strong balance sheet and financial flexibility.

Management emphasized the long-term demand for U.S. energy infrastructure, driven by increasing LNG export capacity and rising natural gas demand, and highlighted ongoing operational excellence and customer relationship management as key to future growth.

ONEOK’s adjusted EBITDA guidance for 2026 was increased to a midpoint of $8.25 billion, reflecting strong business segment performance and improved market dynamics.

Operationally, ONEOK completed the relocation of the Shadowfax natural gas processing plant and is on track with other key projects, while also seeing strong demand for its export infrastructure, particularly for LPG exports.

Full Transcript

OPERATOR

Thank you for your continued patience. Your meeting will begin shortly. If you need assistance at any time, please press Star zero and a member of our team will be happy to help you.

Megan Patterson (Vice President, Investor Relationship)

Thank you. everyone welcome to one of the first quarter 2026 earnings call. We issued our earnings release and presentation after the markets closed yesterday and those materials are available on our website. After our prepared remarks, management will be available to take your questions. Statements made during this call that might include oneok’s expectations or predictions should be considered forward looking statements and are covered by the Safe harbor provision of the securities Acts of 1933 and 1934. Actual results could differ materially from those projected in forward looking statements. For a discussion of factors that could cause actual results to differ, please refer to our SEC filings. With that, I’ll turn the call over to Pierce Norton, President and Chief Executive Officer.

Pierce Norton (President and Chief Executive Officer)

Thank you Megan and good morning everyone and thank you for joining us today. Joining me on the call are Walt Hulse, Chief Financial Officer, Randy Lentz, Chief Operating Officer and Sheridan Swartz, our Chief Commercial Officer. Yesterday we reported first quarter earnings and raised our 2026 financial guidance, reflecting strong performance and building momentum. Before we get into the quarter, I’d like to take a step back and frame the environment we’re operating in and how we think about ONEOK’s role within it. Energy markets remain dynamic, but long term fundamentals are strong. It remains clear that the US Energy infrastructure is essential for economic growth, industrial competitiveness, power demand and global energy security. Midstream’s role is simple. We connect supply and demand safely and efficiently across cycles, not around them. That’s where ONEOK differentiates itself. We built a regionally diversified integrated platform at scale across natural gas liquids, natural gas, crude oil and refined products, anchored by an innovative employee base, the interconnectivity of our assets, customer relationships and a predominantly fee based model. Our systems sit in and around some of the most resilient basins and durable demand centers, including power generation, industrial demand and export markets. As we look to the remainder of 2026, our high level priorities remain consistent operate safely and reliably, execute our capital growth program with discipline, maintain balance sheet strength and financial flexibility and leverage our integrated asset advantage and strong customer relationships to continue driving volume growth across all of our systems. These priorities are grounded in what we see across the US Energy landscape where long term demand remains constructive both domestically and globally. US Natural gas demand is growing across power generation for emerging data center demand, industrial activity and liquefied natural gas exports. LNG export capacity alone is projected to more than double over the next decade, reinforcing the durable global call on U.S. energy and natural gas infrastructure. 65% of U.S. natural gas production contains recoverable natural gas liquids. That means the infrastructure to handle natural gas liquids must be addressed alongside natural gas. This requires full value chain infrastructure and continued investments in natural gas, natural gas liquids, crude oil and refined product assets. Companies like one of at the same time, NGL demand remains strong globally driven by petrochemical and international markets, with US Supply playing an increasingly critical role. And finally, the resilience and innovation of the US Energy industry continues to stand out through consistent efficiency gains and reliable results. Recent global events have only reinforced the importance of secure, resilient energy supply and the critical role U.S. energy plays in providing it. The world has seen that the most expensive energy is the energy that does not show up as global demand continues to grow. Infrastructure, not supply, is the constraint and that is exactly where oneok is positioned providing scalable, strategically located infrastructure with capacity and the ability to respond to evolving demand dynamics. I’ll now turn the call over to

Walt Hulse (Chief Financial Officer)

Walt Hulse for our financial update. Thank you, Pierce. As Pierce mentioned, we are increasing our 2026 financial guidance reflecting the strong performance we delivered in the first quarter across ONEOKs integrated systems and our higher expectations for the remainder of the year. We now expect 2026 net income to increase to a midpoint of approximately $3.5 billion, with diluted earnings per share increasing to a midpoint of $5.53. We are also increasing our adjusted EBITDA guidance to a midpoint of $8.25 billion. These updates reflect strong underlying business segment performance as well as increased opportunities across our system, driven in part by by a more constructive market environment that developed late in the first quarter. As we move into the back half of the year, the combination of higher volumes, completed projects and market tailwinds should be reflected more clearly in our results for the balance of this year and into 2027 our total 2026 capital expenditures guidance remains unchanged and at $2.7 billion to $3.2 billion. Turning to the first quarter performance, ONEOK reported net income of $776 million or $1.23 per diluted share, a 12% increase compared with the first quarter of 2025. Results included a non cash impairment of $60 million or $0.07 per diluted share after tax related to our Powder Springs logistic joint venture in the refined products and crude segment. Adjusted EBITDA for the quarter totaled approximately $2 billion, a 13% year over year increase driven by higher volumes and strong segment level performance. As market conditions strengthened toward the end of the quarter, we also saw additional opportunities across our system. We continue to expect the first quarter to be our lowest EBITDA quarter of the year, consistent with our typical annual cadence and seasonal dynamics. Importantly, our balance sheet and capital framework remains strong. We continue to prioritize financial flexibility while investing in the business and returning capital to shareholders. In April, we redeemed nearly $500 million of outstanding notes due July 2026 and we entered into a $1.2 billion term loan, further enhancing balance sheet flexibility in a rapidly changing market. Our results reflect the same themes that underpin our strategy a high quality, largely fee based earnings mix, strong performance across our integrated systems and disciplined cost and capital management. And our increased financial guidance reflects both this consistent execution year to date and improving market dynamics. I’ll turn it over to Randy for an operational and large capital projects update.

Randy Lentz (Chief Operating Officer)

Thank you Walt. From an operational standpoint, our focus remains on safe and reliable performance across our integrated assets. Our teams continue to execute well across all four business segments managing normal seasonality and weather related impacts. The scale and diversity of our systems allow us to absorb those seasonal dynamics while continuing to provide reliable service to our customers. Winter Storm Fern created temporary wellhead freeze offs that briefly reduced throughput, but as a reminder there were no material downtime on our assets on those related. Those impacts were already reflected in our original 2026 guidance. Turning to capital projects, we made strong progress so far this year. In the first quarter we completed the relocation of our 150 million cubic feet per day Shadowfax natural gas processing plant from North Texas to the Midland Basin. We expect a steady ramp up of volumes as producer activity remains solid in the area. We’re also on track to complete expansions of our Delaware Basin processing assets in the third quarter, increasing our capacity in the basin by 110 million cubic feet per day. In addition to our 300 million cubic feet per day Bighorn processing plant that remains on schedule for completion in mid-2027 in the powder River Basin. We’re on track to complete construction of our 60 million cubic feet per day cutter plant in the fourth quarter of 2026. This plant will increase our processing capacity in the Powder river to more than 100 million cubic feet per day. We expect capacity to fill quickly from wells already drilled and expected to be drilled by our 15% JV partnering plant. Across other segments, our Denver area refined products pipeline expansion will add 35,000 barrels per day of capacity when it enters service mid year and phase one of our Medford NGL fractionator will add 100,000 barrels per day of mid continent fractionation capacity in the fourth quarter. These projects remain on schedule and are positioned to deliver meaningful near term benefits by improving reliability, expanding connectivity and increasing optionality by also creating long term durable value across our footprint. I’ll now turn it over to Sheridan for a commercial update.

Sheridan Swartz (Chief Commercial Officer)

Thank you Randy Commercially we continue to see active engagement across our asset portfolio. Demand is supported by downstream pull, particularly from power generation, industrial and petrochemical demand and export linked markets. These dynamics reinforce the importance of strategically located infrastructure and long term relationships. Looking at the first quarter, we delivered strong year over year volume performance across our assets despite typically seasonal headwinds starting with the natural gas liquid segment performance was led by broad based volume growth across all three of our core regions. In the Rocky Mountain region, NGL volumes increased 11% year over year driven by higher base volume and increased ethane recovery. In the Mid Continent volumes increased 4% year over year driven entirely by C3 plus volume even as the region experienced some temporary impacts from winter storms earlier in the quarter. In the Gulf Coast Permian region volumes increased more than 30% year over year primarily reflecting base volume growth from newly connected third party plants that were delayed last year as well as higher short term volume opportunity. From a global perspective, NGL demand remains structurally strong and recent geopolitical dynamics have further reinforced the attractiveness of U.S. supply. We pressed request for capacity on our announced LPG export dock were already increasing and have accelerated more recently as customers look to diversify supply toward the US Turning to the refined products and crude segment, year over year refined products volumes increased 12% supported by strong gasoline and diesel demand, refinery maintenance dynamics, favorable regional basis differentials and wide crack spreads that drove strong refinery utilization. Blending volumes were also strong during the quarter we entered the spring blending season significantly hedged which limited our exposure to widening RBOB to butane spreads Historically wide basis differentials between New York harbor where we hedge and the Mid Continent where we sell product also impacted realized margins. Looking ahead, we’ve secured additional hedges on fall volumes at higher prices and extended new hedges into spring 2027. Importantly, blending volumes continue to be driven primarily by system throughput rather than EPA RVP waivers which typically create only modest incremental opportunities. Increased gasoline throughput and completed synergy projects provide a much greater benefit allowing us to optimize blending activity across our system. More broadly, the reach and flexibility of refined products systems remain a key advantage. We are the only refined products pipeline system with bi directional access between the Mid Continent and the Gulf coast which allows us to attract incremental volume and respond to changing market conditions. Demand fundamentals remain strong. We continue to see very strong diesel demand across our system which we expect to remain as we move into spring agricultural season. We also anticipate a robust summer travel season supported gasoline demand across our footprint. Additionally, if jet fuel supply remains constrained for an extended period, we could see incremental demand for gasoline. Refined products and crude exports have increased in recent months amid global supply tightness particularly related to diesel, and we are well positioned with dock capacity across multiple Gulf coast marine facilities. Crude dock utilization remain robust at our highly contracted seabora joint venture and we are in discussions to extend our contract expiring capacity at favorable rates. Finally, higher margin Permian crude oil gathering volumes increased compared with the fourth quarter as activity in the basin remains favorable but discipline moving to the natural gathering and processing segment, we delivered strong year over year volume led by the Mid continent where volumes increased 7%. Mid continent producers continue to focus activity across both gas focused and liquid rich plays and we have 11 rigs currently operating at cost our more than 1 million dedicated acres in this region. In the Rocky Mountain region, process volumes increased year over year even with winter weather and heater treater impacts. As operating conditions normalize, we expect volumes to strengthen in the second and third quarters. There are currently 11 rigs on our dedicated acreage with producers continue to drive efficiency gains through longer lapses. In the Permian basin, process volumes increased 4% year over year and we currently have 11 rigs operating across our footprint. As Randy mentioned earlier, our expanded capacity in the Permian enhances system flexibility and positions us well to support producers development plans across both the Midland and Delaware basins, customer activity remains strong and we are increasingly encouraged by the depth of opportunities the Permian Basin brings to our portfolio. From a financial perspective, realized commodity prices were lower in the first quarter as a result of entering the year fully hedged. Importantly, underlying throughput volumes increased year over year across all regions, reinforcing the long term earning capacity and resilience of our gathering and processing portfolio. Producer behavior remains disciplined and execution focused. We are seeing some acceleration in completion activity which supports our confidence in the 2026 volume outlook. That confidence is driven by direct visibility into producer plans and rather than an expectation of higher commodity prices. This view is consistent with recent earnings commentary for oilfield services companies that noted early signs of increasing activity, particularly among private and single basin operators. DUC inventories can also provide an avenue for this acceleration. Our producer base across ONEOK’s approximately 7bcf per day system is well balanced among large public companies, private operators and private equity backed producers. That diversity provides both scale and durability while allowing activity to adjust incrementally. I’ll close with our natural gas pipeline segment where strong results continued in the first quarter with all regions outperforming expectations. Results benefited from wider than planned Waha to Katy location price differentials as well as incremental marketing opportunities created by Winter Storm firm across our Louisiana assets. Looking ahead, we expect Waha to Katy differentials to normalize as new pipeline egress comes online in the second half of the year. Firm transportation demand remains strong with high contracted capacity and strong utilization. We also continue to see significant interest from data center related opportunities in Oklahoma and Texas and we remain in advanced discussion with several counterpoints. Additionally, LNG related demand remains strong both near term and long term, reinforcing the durability demand for natural gas pipeline assets. Pierce, that concludes my remarks.

Pierce Norton (President and Chief Executive Officer)

Thank you Sheridan, Randy and Walt for those comments to close. I’ll come back to where I started. The energy landscape will continue to evolve, but the need for reliable, scalable US Energy infrastructure is not cyclical. It is driven by long term demand fundamentals. Oneok is built for this environment. Having an integrated platform with capacity, a strong balance sheet and disciplined execution results durable long term value creation. Most importantly, none of this happens without our people. I want to thank our employees for their continued focus on safety, operational excellence, innovation and service and thank you to our investors for your continued trust and support in one up with that operator.

OPERATOR

We’re now ready to take questions. We will now begin the question and answer session. If you would like to ask a question, press Star one on your telephone keypad to leave the queue at any time, press Star two. We do ask that you limit yourself to one question and a follow up to fit in as many of you as we can. Once Again, that is Star One to ask a question. And our first question will come from Spiro Dunas with Citi. Your line is now open. Please go ahead.

Spiro Dunas

Thanks operator. Morning team. Maybe just start with the improved outlook. Just looking for a little more granularity on how much that $150 million move is maybe early realized during the first quarter and I guess what level of visibility you …

Full story available on Benzinga.com

This post was originally published here

U.S. stocks traded mixed midway through trading, with the Nasdaq Composite gaining around 0.1% on Wednesday.

The Dow traded down 0.38% to 48,955.51 while the NASDAQ rose 0.09% to 24,685.88. The S&P 500 also rose, gaining, 0.01% to 7,139.48.

Leading and Lagging Sectors

Energy shares jumped by 1.2% on Wednesday.

In trading on Wednesday, health care stocks fell by 1.1%.

Top Headline

Automatic Data Processing (NASDAQ:ADP) reported better-than-expected third-quarter financial results.

Automatic Data Processing posted adjusted EPS of $3.37, beating market estimates of $3.29. The company’s sales came in at $5.939 billion versus estimates of $5.852 billion.

Equities Trading UP
           

  • SAGTEC GLOBAL Ltd (NASDAQ:SAGT) shares shot up 40% to $2.38 after the company reported fourth-quarter financial results.
  • Shares of X T L Biopharmaceuticals Ltd (NASDAQ:XTLB) got a boost, surging 56% to $3.59 after the company announced it signed an agreement to be acquired by Psyga Bio.
  • Kalvista Pharmaceuticals Inc (NASDAQ:KALV) shares were also up, gaining 39% to $26.71 after the company …

Full story available on Benzinga.com

This post was originally published here

On Wednesday, Capital Power (TSX:CPX) discussed first-quarter financial results during its earnings call. The full transcript is provided below.

This transcript is brought to you by Benzinga APIs. For real-time access to our entire catalog, please visit https://www.benzinga.com/apis/ for a consultation.

View the webcast at https://edge.media-server.com/mmc/p/erwbtd8o/

Summary

Capital Power reported a strong Q1 2026 performance with a $404 million adjusted EBITDA, reflecting a $37 million year-over-year increase due to new acquisitions.

Strategic focus remains on diversification, with expansions in natural gas, renewables, and storage across North America, reinforcing a stable portfolio against market volatility.

The company reaffirmed its 2026 guidance, with strong supply and demand fundamentals in key markets and a target of 8-10% annual AFFO per share growth by 2030.

Operational highlights include the extension of the Arlington Valley contract to 2038 and progress on several fully contracted projects in Canada and the US.

Management emphasized a disciplined approach to capital allocation with a focus on risk-adjusted returns, supported by stable cash flows and robust contracting strategies.

Full Transcript

Roy Arthur (Vice President of Investor Relations and Investor Partnerships)

Good day ladies and gentlemen and thank you for standing by. Welcome to The Capital Power first quarter 2026 analyst conference call. At this time all participants are in a listen only mode. After the speaker’s presentation there will be a question and answer session. To ask a question you will need to press Star 11 on your telephone keypad. As a reminder, this conference call is being recorded. At this time I would like to turn the conference over to Mr. Roy Arthur, Vice President of Investor Relations and Investor Partnerships. Sir, please begin. Good morning everyone. My name is Roy Arthur, Vice President Investor Relations and Investment Partnerships. Thank you for joining us to review Capital Power’s first quarter 2026 results which we published earlier today. Our first quarter report and the presentation for this conference call are available on our website. During today’s call, our President and CEO, Avik Day will provide an update on our business. Following that, our Senior Vice President, Finance and CFO Kevin McIntosh will present a review of the quarter end financials for the company. Avik will wrap up with a review of our 2030 strategic priorities, after which we will open the floor to questions from analysts in our interactive Q and A session. Before we start, I would like to remind everyone that certain statements about future events made on the call are forward looking in nature and are based on certain assumptions and analysis made by the company. Actual results could differ materially from the Company’s expectations due to various risks and uncertainties associated with our business. Please refer to the cautionary statement on Forward looking information on Slide 4 or our filings available on SEDAR+. In today’s discussion we we will be referring to various non GAAP financial measures and ratios also noted on slide 4. These measures are not defined financial measures according to GAAP and do not have standardized meanings prescribed by GAAP and therefore are unlikely to be comparable to similar measures used by other enterprises. These measures are provided to complement the GAAP measures in the analysis of the Company’s results. From management’s perspective, reconciliations of these non GAAP financial measures to their nearest GAAP measures can be found in the MDA prepared as of April 28th for the first quarter of 2026. We acknowledge that Capitol Power’s head office in Edmonton is located within the traditional and contemporary home of many Indigenous peoples of Treaty 6 of the Treaty 6 Region and the Metis homeland. We acknowledge the diverse Indigenous communities that are in these areas and whose presence continues to enrich the community and our lives as we learn more about the Indigenous history of the lands on which we live and work. With that I will Hand it over to Avik.

Avik Day (President and CEO)

Thank you, Roy. Our Q1 2026 results reflect the prudence of our strategy and the resilience of our portfolio even against a volatile macro backdrop. Relentless execution is core to who we are. It’s what sets the Capital Power team apart in times of uncertainty driving durable growth. There are three key takeaways we want to leave you with today. First, our business remains stable despite heightened macro and geopolitical uncertainty around the world. Our business and strategy are unchanged here in North America and we continue to see multiple pathways to create value. Second, we are benefiting from diversification across geographies or electricity markets, technologies and markets continue to de risk our portfolio and strengthen the opportunity set we can pursue. As we will touch on later in the presentation, we continue to see strong supply and demand fundamentals in each of the core markets where we operate. Importantly, we also see compelling opportunities for growth across our three core generation technologies, natural gas, renewables and storage. Finally, our approach to risk and return has not changed. We remain disciplined and consistent in how we allocate capital with a clear focus on compelling risk adjusted returns. Our business remains resilient and we continue to offer compelling long term value creation supported by stable cash flows and disciplined growth. We continue to make steady progress on our 2026 priorities and remain disciplined in our approach to value creation. Our success reflects the tireless dedication and strong execution of our team across North America this quarter. We’re also pleased to highlight several important leadership updates that further strengthen our organization. Kevin McIntosh, who joins me on this call, has stepped into the role of Senior Vice President, Finance and Chief Financial Officer. In addition, Andrew Pearson, who has been an integral part of our organization since 2008, has joined the executive team as Senior Vice President US Commercial and is based in our newly opened Washington D.C. office. Looking ahead effective July 1, 2026, Steve Wallen has decided he will retire after 25 years of outstanding service and leadership and Mike Tsushima will join the Executive team as Senior Vice President and Chief Commercial Officer based in our Edmonton headquarters. We are deeply grateful to Steve for his leadership and the lasting impact he has had on capital Power. Together, these transitions underscore the depth of our leadership bench and our continued focus on building and sustaining a high performing team for Q1 2026. Performance highlights include the extension of the Arlington Valley contract through 2038 which reinforces our commercial optimization strategy, securing durable long term contracts with investment grade counterparties, progressing Arlington Valley and Hummel upgrades, advancing construction on four fully contracted projects totaling roughly 280 megawatts across Canada and the US all with investment grade counterparties. Operationally, the team delivered another strong quarter, generating approximately 11.5 terawatt hours across the fleet. Importantly, more than half our generation came from the US portfolio, which continues to underscore the success of our diversification strategy. Finally, our planned outages are progressing on schedule, enhancing reliability and efficiency of our fleet. For the second consecutive year, we saw the market get off to a rocky start owing to macro disruptions. Yet our strategy and our business have stayed consistent. While oil prices and broader market volatility have increased meaningfully, natural gas prices have declined, reinforcing why gas fired generation continues to be structurally advantaged. Natural gas offers low cost fuel operational flexibility and meaningful insulation from global disruption here in North America, which reinforces our conviction that this fuel source is pivotal to to meeting long term power demand growth and preserving affordability. The bottom line is simple, positive industry fundamentals remain intact for power generation and we are staying the course in our pursuit of delivering reliable and affordable power to our customers in pursuit of creating long term shareholder value. Our return profile reflects a combination of contracted cash flow and merchant generation capacity. From 2021 to 2025, our contracted EBITDA grew at a compounded annual rate of approximately 18% due to a combination of acquisitions, development and recontracting of existing assets. The contracting successes in Ontario, Miso and the Desert Southwest illustrate our ability to unlock meaningful value by optimizing our existing asset base. We continue to make tangible progress delivering the 1 billion of the embedded upside we articulated to you at our investor day in December. As a result of the recent contracting agreements at MCV and Arlington Valley, we have already delivered approximately 170 million of contracted EBITDA upside, with more to come. We operate approximately 12 gigawatts across our North American portfolio, with roughly 7 gigawatts targeted for contracting or recontracting. That gives us a long and visible Runway for incremental value creation from assets already in place. As power market fundamentals continue to tighten, that optionality becomes increasingly valuable. Reinforcing that contracting remains one of our most powerful levers for long term value creation. As we pursue further acquisitions, we will prioritize assets where our platform and expertise can unlock incremental value through commercial optimization. While we have enhanced our diversification in recent years, Alberta remains a meaningful part of our business. It’s an attractive market and presents a unique and compelling value proposition for data center investment. We are encouraged by recent regulatory progress, including the Alberta Canada mou eliminating the Canadian Energy Regulator (CER) for Alberta and continued progress on the ESOS Phase 1 and 2 data center interconnection processes. These steps improve investment certainty and support continued data center growth while maintaining affordability, reliability and meaningful economic benefit for Alberta and Canada. We believe Alberta has some structural advantages over other regions looking to attract large data centers. For instance, existing underutilized infrastructure includes generation, transmission and distribution. The nature of the Phase one process puts the focus on generation, but it’s important not to lose sight of the transmission and distribution infrastructure. Based on our analysis, the addition of 1.5 gigawatts of load would result in approximately $6 per month savings for the average residential customer in Alberta with existing transmission and distribution spread across more load. In addition to efficient and reliable generation, Alberta benefits from a deep supply of low cost fuel with forward prices trading below other major North American natural gas sales points. Alberta also has a strong track record of load CO location with approximately 3 gigawatts about 25% of provincial load co located with generation. This all reinforces our enthusiasm for this industry to succeed here and create benefits for constituents beyond Alberta. Diversification continues to benefit our portfolio with growth coming from multiple areas. This geographic and market diversity reduces reliance on any singular regulatory or pricing environment and gives us multiple pathways to create value over time. In PJM market, forward prices continue to exhibit strong long term spark spreads with greater visibility to capacity prices out to 2030. In addition, we are encouraged that the recent reliability backstop procurement proposal supports the most cost effective new capacity, which we believe will include brownfield expansions and upgrades on existing generation. Meanwhile, MISO continues to exhibit strong supply and demand fundamentals from a bilateral pricing perspective. We were able to recontract MCV, the largest gas cogeneration plant in the US out to 2040 at attractive pricing capacity. Pricing in this region also continues to see significant upward pressure owing to growing demand. Q1 2026 provides a great example of the benefits of diversification in action. Although we saw elevated gas prices and price volatility in pjm, we also saw strong contributions in Ontario and miso, underscoring the benefits of our diverse and resilient portfolio. In addition to geographic diversification, we continue to focus on three core power generation technologies being natural gas, renewables and storage. In contrast to the forward outlook, historical power generation growth has been muted over the past 20 years averaging about 0.5% per annum. However, these three technologies have demonstrated significant and consistent growth well in excess of that over the past 20 years. Natural gas fired generation has grown steadily as aging coal units, retirement and rising renewable penetration has increased the need for reliable, dispatchable power. That same push for reliability has also fueled rapid growth in utility scale battery storage, supported by declining lithium costs and longer storage duration to better integrate intermittent renewables when we look forward, we continue to see opportunities across all three of our businesses. Natural gas, renewables and storage each play an important role in meeting the needs of the grid as power demand continues to rise. As we indicated at Investor Day, natural gas will play a starring role. Together, this technological mix positions us well to capture rising demand while maintaining flexibility, allowing us to respond to the needs of our customers across our markets. Now I will hand it over to our Chief financial officer, Kevin McIntosh to provide our financial update.

Kevin McIntosh (Senior Vice President, Finance and Chief Financial Officer)

Thank you Avik and good morning everyone. I’m Kevin McIntosh and I’m pleased to join you today as Capital Power’s new CFO. We have significant opportunities ahead and while our ambition is bold, we are starting from a position of incredible strength with a high quality asset base and strong strategic positioning. Before we walk through the quarter, I’d like to briefly revisit a few of the key themes outlined at Investor Day as they continue to guide how we think about risk, return and capital allocation across the business. Looking at the past decade, our performance demonstrates a consistent ability to to deliver durable growth and strong shareholder returns. First, on returns to shareholders, we have increased our dividend for 12 consecutive years, compounding at roughly 7% annually from $1.51 per share in 2016 to $2.69 per share in 2025. Second, dividend growth has been supported by real business growth. Adjusted EBITDA has grown at approximately 13% compounded annually, increasing from $509 million in 2016 to $1.6 billion in 2025. This growth has been achieved within clear financial guardrails, including maintaining a 30 to 50% targeted dividend payout ratio, approximately 4 times net debt to EBITDA and a largely contracted cash flow base. This is a track record of excellence built through dedication and discipline. I’m excited to be part of this team and build on this legacy, delivering real value for you, our shareholders. Our balance sheet remains a core strength and is the foundation that supports fleet growth, capital deployment and long term value creation. In 2026, approximately 75% of our cash flow is secured through long term contracts or hedges, providing a high level of visibility and durability. That stable cash flow base gives us the flexibility to pursue M&A in merchant markets, grow the dividend and ultimately deliver strong total shareholder returns. The quality of that contracted base is equally important. Roughly 90% of our PPAs are with a rated or higher counterparties reinforcing revenue certainty and credit quality across the portfolio. Our weighted average contract life has consistently remained in the 9 to 11 years range reflecting the strong positioning of our asset base to meet customer needs. We remain confident in our ability to execute commercial optimization including long term contracting throughout our portfolio. Recent examples include the Arlington Valley and MCV contracts, both which extended contract duration on existing assets with investment …

Full story available on Benzinga.com

This post was originally published here

Amazon.com Inc. (NASDAQ:AMZN) reports first-quarter earnings after the bell today.

The company has beaten revenue estimates in six straight quarters and topped EPS estimates in nine of the last 10. Shares closed Tuesday near $264, just below last week’s all-time high.

Polymarket gives Amazon a 94% chance of beating its $1.65 GAAP EPS consensus.

The more interesting action is on Kalshi, where traders are betting on which specific words Andy Jassy will say on the call.

What Words Does Kalshi Predict?

“Tariff” sits at 96%. Trump’s original tariffs were struck down in February and replaced with a temporary 15% import tariff that expires this summer.

Amazon’s pre-tariff inventory cushion ran out last fall; tonight’s call should tell us how much the price hikes are biting.

“Live Sports” is also at 96%. Prime Video just wrapped its biggest-ever Thursday Night Football season at 15.3 million average viewers and added NBA playoff games this month.

Sports is the highest-attention …

Full story available on Benzinga.com

This post was originally published here

PROG Holdings (NYSE:PRG) reported first-quarter financial results on Wednesday. The transcript from the company’s first-quarter earnings call has been provided below.

Benzinga APIs provide real-time access to earnings call transcripts and financial data. Visit https://www.benzinga.com/apis/ to learn more.

The full earnings call is available at https://edge.media-server.com/mmc/p/jzvx4mf6

Summary

PROG Holdings Inc reported strong Q1 results with revenues of $743 million and a year-over-year growth of 11%. The company exceeded its outlook for earnings and non-GAAP EPS.

The company witnessed a 54% growth in consolidated GMV, primarily driven by purchasing power and the strong performance of 4, which grew GMV by 134% year-over-year.

Strategic initiatives include focusing on growth, enhancing customer experiences through AI, and expanding product offerings. The company continues to prioritize deleveraging and maintains a net leverage ratio of 2 times.

Future outlook is positive with revised revenue guidance for 2026 set between $3 to $3.1 billion. The company expects continued growth in GMV and improving profitability across its segments.

Management highlighted the resilience of their customer base amid macroeconomic challenges and emphasized their ability to adapt quickly to changing conditions.

Full Transcript

OPERATOR

Good day and thank you for standing by. Welcome to the PROG Holdings Inc Q1 earnings conference call. At this time, all participants are in listen only mode. After the speaker’s presentation, there will be a question and answer session. To ask a question during the session, you will need to press star 11 on your telephone. You will then hear an automated message advising your hand is raised. To withdraw your question an automated message advising your hand is raised to withdraw your question. Please press star 11 again. Please be advised that today’s conference is being recorded. I would like to hand the conference over to your first speaker today, John Ball, Vice President of Investment Relations. Please go ahead.

John Ball (Vice President of Investment Relations)

Thank you and good morning everyone. Welcome to The PROG Holdings Inc first quarter 2026 earnings call. Joining me this morning are Steve Michaels, Prague Holdings President and Chief Executive Officer, and Brian Garner, our Chief Financial Officer. Many of you have already seen a copy of our earnings release issued this morning which is available on our investor relations website, investor.pragueholdings.com during this call, certain statements we make will be forward looking, including comments regarding our revised 2026 full year outlook and our outlook for the second quarter of 2026. Listeners are cautioned not to place undue emphasis on forward looking statements we make today, all of which are subject to risks and uncertainties which could cause actual results to differ materially from those contained in the forward looking statements. We undertake no obligation to update any such statements. On today’s call we will be referring to certain non GAAP financial measures, including adjusted EBITDA and non GAAP EPS which have been adjusted for certain items which may affect the comparability of our performance with other companies. These non GAAP measures are detailed in the reconciliation tables included with our earnings release. The Company believes that these non GAAP financial measures provide meaningful insight into the Company’s operational performance and cash flows and provides these measures to investors to help facilitate comparisons of operating results with prior periods and to assist them in understanding the Company’s ongoing operational performance. With that, I would like to turn the call over to Steve Michaels, Prague Holdings President and Chief Executive Officer. Steve thanks John. Good morning everyone and thank you for joining us. I’ll start by saying we delivered a strong first quarter. We are very happy with the start to the year and the momentum we’re seeing in the business. Our results came in at the high end of our revenue outlook and exceeded the top end of our outlook for earnings and non GAAP eps. This outperformance reflects the discipline of our operating model and strong execution across the organization supported by higher than expected GMV with improved economics at FORSS as well as better portfolio yield at Progressive Leasing,, primarily due to lower than expected utilization of 90 day purchase options. In an environment where the geopolitical and macroeconomic situation presents challenges, including from rising gas prices, our model performed as designed. This consistency is a direct result of how we built and manage this business over time. Let me provide some additional color on the quarter before walking through our strategic priorities. As I mentioned in February we have begun framing growth through the Lens of consolidated GMV, which grew 5FORSS% in Q1 compared to the same period last year. These results reflect the addition of purchasing power and the Triple digit growth of FORSS as our portfolio of solutions expands. GMV is generated through multiple products across leasing for and purchasing power, and this consolidated view better reflects the full scale of our platform. It’s a great example of how we are deploying an integrated ecosystem of solutions to better reach underserved individuals and families. Starting with Progressive Leasing, GMV for the first quarter came in at 2.2% below the same period last year. However, trends improved meaningfully as the quarter progressed, with January down high single digits, February down low single digits, and March up low single digits. As a reminder, throughout last year our leasing business faced GMV headwinds from deliberate tightening actions and the bankruptcy of big lots. As we lapped both of those headwinds, particularly through February, Leasing’s GMV trends inflected positively in March. From a GMV standpoint, the quarter played out largely as expected and we are excited to exit the quarter on a growth trajectory. FORSS GMV for The quarter was 13FORSS% higher year over year. Customer demand for our BMPL product remains robust and importantly, we are seeing that growth translate into attractive economics and profitability, which I’ll discuss in more detail shortly. Purchasing Power’s Q1 GMV grew double digits at 10.3% year over year. This growth was due to favorable performance within existing employer accounts. We also added several new employer clients during the quarter, bringing tens of thousands of new eligible employees onto the platform and supporting future growth. Consolidated revenue came in at 7FORSS3 million, representing 11% year over year growth. This performance was primarily as a result of the addition of purchasing power along with growth at FORSS and partially offset by a revenue decline at Progressive Leasing due to a lower portfolio size. Throughout the quarter. Consolidated adjusted EBITDA was 90.3 million and non GAAP EPS was $1.2FORSS, both exceeding the high end of our outlook. This outperformance was fueled by better than expected portfolio yield and customer payment performance at Progressive Leasing as well as increased customer demand and profitability at FORSS. To summarize, the quarter, we delivered results above expectations, saw improving GMV trends while maintaining portfolio health at leasing drove profitable triple digit growth with improving economics at FORSS, achieved double digit GMV growth at purchasing power and continued to execute against our ecosystem strategy. Before we shift into our strategic priorities, I want to briefly address the broader environment and how it informs our updated outlook. The consumer we serve remains resilient, but they are facing real challenges. Gas prices are elevated and there is increased uncertainty in the macro backdrop. We remain committed to continue to deliver consistent portfolio performance across all our businesses and managing costs prudently to achieve our earnings outlook. Our track record demonstrates our ability to adapt quickly and we will do so as conditions evolve. Let me now turn to our three strategic pillars Grow, Enhance and Expand to share some highlights from the quarter. Starting with the Grow pillar, we saw encouraging traction at Progressive Leasing and purchasing power with remarkable growth at FORSS, which collectively resulted in consolidated GMV being up 5FORSS% year over year. For leasing, Q1 applications grew double digits year over year and GMV trends improved sequentially month over month with March up low single digits compared to the prior year. In addition to lapping the tightening actions from early 2025, these results reflect our investments in technology to enhance customer experience and in marketing to promote engagement across both new and existing customers. You heard about many of these initiatives at our recent investor day and we’re pleased to say that they are continuing to have a positive impact on our business. Our long term distribution base of exclusive retail partners with approximately 70% of progressive leasing GMV secured into the 2000 and 30s provides a durable foundation for growth as we also gain balance of share within existing key retail partners. Additionally, our direct consumer efforts spanning both marketing and digital channels have been meaningful drivers of growth within marketing. At Progressive Leasing, we leaned into customer acquisition, partner marketing and cross product campaigns which drove increased engagement and incremental gmv. We focused further up the funnel while maintaining flat acquisition costs year over year. At the same time, our outreach channels including email, SMS and push notifications generated incremental gmv, reinforcing healthy consumer demand and improving return on ad spend. On the digital front, Prague Marketplace delivered another notable quarter, growing a 169% year over year. We are scaling this channel through ongoing product enhancements, increased traffic and improved conversion. Our E Commerce channel also grew meaningfully due to deeper integrations with retail partners and improved digital checkout experiences. Q1E Commerce GMV was 25.7% of total progressive leasing GMV up from 16.8% in the same period last year and the highest first quarter mix to date. Shifting to FORSS, we delivered another triple digit growth quarter, our 10th in a row. With performance powered by both customer acquisition and engagement. The team rolled out AI driven product enhancements that simplify the shopping experience and average order values increased year over year. Monthly active users more than doubled compared to a year ago, reflecting growing consumer interest. On the marketing side, spend was deployed efficiently to support growth, maintaining a healthy balance between paid and organic customer acquisition. Finally, purchasing power delivered double digit GMV growth reinforcing the strength of its model and its strategic role within our ecosystem. Its payroll deduction model represents a differentiated distribution moat serving employees who value predictable convenient purchasing options through their paycheck. We remain in the early stages of deeper integration including introducing purchasing power to our retail partner employee basis and leveraging addressable employer relationships to expand leasing distribution over time. We believe this opportunity represents a meaningful incremental growth leverage From a marketing perspective, early media testing at purchasing power is showing encouraging results, demonstrating our ability to improve penetration within the eligible population under the Enhanced pillar, our investments in improving both customer and retailer experiences are progressing with several initiatives beginning to deliver positive results. Our AI driven lease eligibility engine is scaling meaningfully. We’ve expanded our leasing product catalog and improved response times from three seconds down to a tenth of a second. At the same time, we are advancing customer experience enhancements that are driving higher conversion. We deployed multiple AI driven improvements across our marketplace including an AI Chatbot assistant, enhanced payments navigation and a new AI powered checkout flow that simplifies and streamlines the transaction process. These marketplace enhancements have delivered an approximately 20 percentage point improvement in checkout conversion versus the prior experience while also lowering cost to serve and improving operational efficiency. The focus remains clear enhance the customer experience to support higher customer lifetime value while improving the economics of the business. Under the expand pillar, FORSS is scaling and purchasing power is growing double digits in line with expectations. As integration efforts advance, we remain intensely focused on strengthening our ecosystem. FORSS executed at a high level, delivering 1FORSS2% revenue growth in Q1 2026, the 10th consecutive quarter of triple digit GMV and revenue growth. Q1 GMV reached 280 million more than doubling Q1 2025 and March 2026 GMV of 108 million was the second highest month in company history. Customer engagement trends remain favorable with average purchase frequency of approximately five transactions per quarter and more than 130% growth in active shoppers year over year. New shoppers grew approximately 80% year over year, representing expansion of the platform’s customer base. Four’s subscription model remains a key driver, with Four plus subscribers continuing to contribute approximately 80% of total GMV. Four’s take rate, defined as revenue generated as a percentage of GMV over the trailing twelve month period, remained consistent at approximately 10%, indicating positive monetization efficiency as the business scales. From a profitability standpoint, Ford generated adjusted EBITDA of 12.9 million in Q1 2026, already exceeding full year 2025 adjusted EBITDA of 9.9 million. Q1 adjusted EBITDA margin was 37% reflecting the benefits of scale. While Q1 is seasonally the highest margin quarter following elevated GMV from the holiday period, the business continues to demonstrate meaningful operating leverage MoneyApp, our cash advance product, grew revenue over 50% in the first quarter and continues to play an important role as both an engagement and cross sell driver within our ecosystem. Growth was as a result of higher average advance sizes as well as early traction from a new product we introduced in December called Top Ups, which allows qualifying customers to responsibly access additional funds on top of an existing advance. While still early top Ups are beginning to generate incremental revenue and represent another avenue for us to deepen customer engagement and expand the platform over time, our ecosystem strategy is gaining traction. At our investor day in March, I highlighted that cross product engagement is a strategic priority because we believe it is a key component of long term growth and value creation. We are seeing progress from our ecosystem first approach with customers increasingly engaging across multiple products, driving higher lifetime value and improved acquisition efficiency. Four is currently our most connected product, often serving as an entry point and engagement driver across our platform. Progressive Leasing showed the most meaningful improvement in cross product engagement during the quarter, with more of its customers interacting with other offerings. Notably, we also drove the largest overlap and fastest growth in overlap between Progressive Leasing and four customers. Before turning over to Brian, let me touch on capital allocation. Our priorities remain unchanged. Invest in the business, pursue strategic M and A and return excess capital to shareholders through share repurchases and dividends. In February I told you that in the near term we will focus on prioritizing debt reduction as we work toward our long term net leverage target of 1.5 to 2 times. And we did. During the quarter we paid down $210 million in recourse debt, ending Q1 with a net leverage ratio of two times. To summarize the quarter, we delivered results above expectations led by consistent execution and improving demand trends across the business. Importantly, these results were achieved while continuing to invest in our strategic priorities, advancing our direct consumer capabilities, scaling our digital channels and deepening integration across our platform. Overall, our distribution moat, diversified ecosystem and data driven decisioning capabilities position us well to perform across a range of environments. I firmly believe the best chapters of Prague’s story are still ahead of us. With that, I’ll turn the call over to Brian. Brian

Brian Garner (Chief Financial Officer)

Thanks Steve and good morning, everyone. Our strong performance in the first quarter was broad based and reflects disciplined execution across each of our businesses as well as some margin favorability from consumer behavior in the leasing segment. In a short period of time, we made significant progress against our goal of deleveraging following the purchasing power acquisition and as we exit the quarter we are within our target net leverage range of 1.5 to 2 times. I’ll begin with our Q1 results of progressive leasing followed by four technologies purchasing power and then move to consolidated results. I’ll close with an update on our balance sheet capital allocation and our Revised full year 2026 outlook. While more broadly consumer demand across several discretionary categories remains pressured, our teams executed well on the areas within our control, including targeted growth initiatives, decisioning, expense discipline and capital deployment, enabling us to deliver results ahead of expectations and reinforcing the underlying opportunities within the business. Starting with Progressive Leasing first quarter, GMV came in at 393 million, representing a 2.2% decline year over year, which was in line with our expectations. As Steve outlined, this performance reflects two primary factors in the first half of the quarter, the tightening actions we implemented last year to preserve portfolio performance and the lapping of remaining GMV from big lots following their bankruptcy. As we progressed through the quarter and moved past these headwinds, GMV trends improved sequentially, returning to low single digit growth in March. Revenue for the Progressive leasing segment was 597 million in the first quarter, down 8.4% year over year, primarily result of a smaller average lease portfolio throughout the quarter. The lower gross leased asset balance, which is down 9.4% entering …

Full story available on Benzinga.com

This post was originally published here

Tradeweb Markets (NASDAQ:TW) released first-quarter financial results and hosted an earnings call on Wednesday. Read the complete transcript below.

This transcript is brought to you by Benzinga APIs. For real-time access to our entire catalog, please visit https://www.benzinga.com/apis/ for a consultation.

Access the full call at https://edge.media-server.com/mmc/p/ikpqwqhu/

Summary

Tradeweb Markets reported record quarterly revenue of over $600 million, marking a 21.2% year-over-year growth, driven by strong client activity and a favorable market environment.

The company’s international business contributed significantly, with 29% growth, and accounted for nearly 60% of overall revenue growth.

Tradeweb Markets continues to invest in strategic initiatives such as AI integration, expansion in emerging markets, and partnerships like the one with Canton for digital assets.

The company highlighted strong growth in electronic interest rate swaps, credit, and equities, with notable advancements in global swaps and AI-driven solutions.

Management expressed optimism about future growth, emphasizing the company’s resilience and strategic positioning in evolving market conditions.

Full Transcript

OPERATOR

Good morning and Good morning and welcome to Tradeweb’s first quarter 2026 earnings conference call. As a reminder, today’s call is being recorded and will be available for playback. To begin, I’ll turn the call over to head of Treasury FP&A and Investor Relations Ashley Sorrell. Please go ahead. Thank you and good morning. Joining me today for the call are our CEO Billy Hult who will review our business results and key growth initiatives, and our CFO Sarah Ferber who will review our financial results. We intend to use the website as a means of disclosing material non public information and complying with our disclosure obligations under Regulation FD. I’d like to remind you that certain statements in this presentation and during the Q and A may relate to future events and expectations and as such constitute forward looking statements within the meaning of the Private Securities Litigation Reform act of 1995. Statements related to, among other things, our guidance are forward looking statements. Actual results may differ materially from these forward looking statements. Information concerning factors that could cause actual results to differ from forward looking statements is contained in our earnings release, earnings presentation and periodic reports filed with the SEC. In addition, on today’s call we will reference certain non GAAP measures as well as certain market and industry data. Information regarding these non GAAP measures, including reconciliations to GAAP measures is in our earnings release and earnings presentation. Information regarding market and industry data, including sources, is in our earnings presentation. Now let me turn the call over to Billy. Thanks Ashley Good morning everyone and thank you for joining our first quarter earnings call. We delivered another record quarter surpassing $600 million in quarterly revenue for the first time in our history. As I noted last quarter, we entered the year with a constructive macro backdrop featuring strong private SECtor intermediation, robust global issuance and elevated levels of market debate alongside early signs of diversification away from US Assets. That backdrop evolved quickly. What began as a market conversation centered on the pace of rate cuts in 2026 shifted meaningfully as geopolitical tensions in the Middle east drove an increase in oil prices and renewed concerns around inflation across the economy. Our clients actively repositioned risk and navigated this dynamic environment, driving record quarterly average daily volumes on the platform, including 17 of our 22 products that we report in our monthly activity report. While periods of elevated volatility tend to naturally drive wider bid ask spreads, markets remained orderly throughout the quarter. Our clients engaged with the platform at record levels and increasingly capitalized on our automation solution AIX. Equally important, our dealer partners flourished as their continued investment in consistent two way Electronic liquidity benefited clients during heightened market stress. As we move into the aftermath of the volatility spike, history has shown that activity can moderate as clients digest the forward outlook. More importantly, this macro shock has left our clients in a healthy position and we expect them to resume trading actively across our global franchise. Diving into the first quarter, strong client activity and a risk on Environment drove 21.2% year over year revenue growth on a reported basis. Our international business continued to set new records with 29% revenue growth as our strategic initiatives across Europe, APAC and EM continued to pay off. We continued to balance investing for growth and profitability as adjusted ebitda margins expanded by 40 basis points relative to the first quarter of 2025. Our international business really continued to fire on all cylinders for us this quarter contributing to nearly 60% of our overall revenue growth. And importantly, that strength was broad based as we saw double digit growth across all four asset classes with our international clients. Even though international clients are naturally focused on non US products, they’re increasingly trading outside their home markets. That really speaks to the strength of our platform to put some numbers around that. Our international clients drove 60% of our dollar swaps growth and we also saw double digit contributions from them across U.S. treasuries, cash, creditit, CDS and ETFs. On the product side internationally, we had double digit growth across European, Aussie and Japanese government bonds. European swaps was a standout, but we also saw a very strong performance across APAC and EM swaps. And it wasn’t just rates as our European credit in CDS produced strong revenue growth. Not to be overshadowed, we also saw over 20% growth in both our European ETF and repo businesses. And then on the flip side, it’s not just international clients driving this activity. Our US clients are increasingly active in international products contributing over 20% of our international product revenue growth. So when you step back, what you’re really seeing is the flywheel of the platform at work where our global clients are trading across regions and asset classes. And we believe this advantage will only grow as we expand our presence across regions. Turning to Slide 5, our rates business produced a record revenue quarter driven by continued organic growth across swaps, global government bonds and mortgages. Record creditit revenues were led by strength across global corporate bonds and creditit derivatives money markets. Revenue growth was led by record quarterly revenues across global Repos and Institutional Client Development equities also produced record revenues led by growth in global ETFs and equity derivatives. Other revenues grew over 56% year over year driven by our digital assets initiatives. Finally, market data revenues were down approximately 5% year over year, driven by a timing shift in how certain historical data sets are delivered under our amended LG agreement. Recall, we recorded 8 million in January of 2025 tied to the delivery of data sets to LSEG. The revenue recognition of these data sets in 2026 shifted to 2 million being recognized in the first month of every quarter, adjusting for the timing difference. Market Data revenues grew 13% year over year, driven by growth in our recently renewed LSEG market data contract and proprietary data products. Turning to Slide 6, I will provide a brief update on two of our focus areas, U.S. treasuries and ETFs, and then I will dig deeper into U.S. creditit and global interest rate swaps, starting with U.S. treasuries. After eight months of below average intraday volatility, we saw a significant pickup in March intraday volatility. While March volatility rose over 50% from the December lows, it was still nearly 40% below what we saw in April of 2025. Our first quarter market share of 22% drove record revenues up nearly 10% year over year as double digit revenue growth in our institutional channel was partially offset by weaker retail trends. While market share was down year over year mainly due to lower wholesale market share, we remain optimistic on a reacceleration in our U.S. treasury business as we penetrate additional parts of the voice market. Coupled with with continued strong government debt issuance, our competitive position remains strong on a relative basis, we exceeded 50% share for the eighth conSECutive quarter in electronic institutional US treasuries versus our main electronic competitor. Wholesale remains a strategic priority with continued focus on expanding our liquidity network, deepening client relationships and driving growth through differentiated protocols and products across our integrated platform. Turning to equities this year marks the 10 year anniversary of our institutional US ETF platform, an important milestone that reflects both the evolution of the ETF ecosystem and tradeweb’s role at its center. Since launch, our platform has scaled significantly, surpassing 4 trillion in notional trade, including more than 1 trillion in the past 12 months alone. What began with just a handful of participants a decade ago has grown into a broad and diverse global network of close to 200 institutional clients and over 20 dealers. Our ETF business posted revenue growth in excess of 35% year over year as we continue to deepen integration with our clients coupled with a pickup in market volatility. Our AIX automation solution continues to be a key differentiator with our ETF clients with average daily trades increasing over 70% year over year with double digit growth across European and US ETFs. Our efforts to broaden our equity presence beyond our flagship ETF franchise continue to pay off with record institutional equity derivative revenues up nearly 20% year over year. Looking ahead, the pipeline remains strong as the benefits of our electronic solutions continue to resonate with our clients, we believe we are well positioned to capitalize on the long term SECular ETF growth story not just in equities but across our fixed income business. Shifting to Global creditit on slide 7 Double digit revenue growth for global creditit was driven by strong double digit revenue growth in European Credit, EM Credit and creditit derivatives which more than offset weakness in municipal bonds. U.S. creditit produced low single digit revenue growth, led by strong double digit revenue growth in our institutional business, but partially offset by continued weakness in our retail corporate creditit channel where revenues were down over 20% year over year, primarily reflecting the better relative yields our clients were getting outside of U.S. creditit. U.S. creditit remains a key growth priority and we are focused on expanding our penetration within RFQ markets to complement our leadership and portfolio and session based trading. Despite more than a decade of innovation, RFQ continues to be the primary execution protocol for institutional clients in US Credit, driven by its transparency and competitive pricing dynamics. However, clients are often reluctant to expose larger trades broadly given the trade off between minimizing information leakage and achieving optimal pricing. In response, we are focused on enhancing workflows that better align with client needs. To that end, we have continued to invest in our enhanced dealer selection tool SNAP plus, which enables our clients to dynamically target dealers most likely to engage and win a given inquiry based on both historical and real time trading data. This innovation builds on our broader strategy of expanding the range of pre trade execution and post trade solutions we offer. We remain focused on the block market with overall US creditit block share up 20 basis points year over year in the first quarter with block average daily volume growth of over 30% year over year across IG and high yield. Our volume growth was driven by continued adoption of our portfolio trading, RFQ and Sessions protocols. Institutional RFQ average daily volume grew over 30% year over year with double digit growth in both IG and High yield. Our efforts to expand into RFQ are seeing continued signs of success with our RFQ share of overall trace up over 50 basis points year over year. Portfolio trading produced record average daily volume increasing over 30% year over year with double digit growth across both US and international PT. All trade had a strong quarter with over $230 billion in volume with average daily volume up over 5% year over year, our All-to-All average daily volume grew over 65% year over year and our dealer RFQ average daily volume grew over 40% year over year. We saw record responder rates in high yield as the team remains focused on expanding our network and increasing the number of responders on the AllTrade platform. Electronification remains a key focus, especially in US Credit where underlying trends are strong. However, investment grade volumes have been increasingly impacted by affiliate trades which are internal transfers within a dealer that occur after a transaction in the institutional market. These are double counted non economic trades that don’t interact with electronic platforms, distorting reported market share and electronification and creating artificial pressure on both. If you adjust for that activity, the underlying picture looks better. Based on our estimates, first quarter market share in IG would have increased 5 basis points versus our reported decline of 33 basis points and electronification also would have moved higher. The core trend hasn’t changed and electronification in US Credit is continuing to build and we feel very good about our positioning as that plays out. Looking ahead, Global creditit remains a key area of focus with a long Runway for growth. While US Credit continues to anchor performance through ongoing innovation, differentiated liquidity and investment in our platform. We are also scaling European creditit by expanding RFQ adoption and liquidity and advancing munis through increased electronification, transparency and connectivity in a fragmented market. Finally, in EM Credit where we are still early in our expansion, we are building momentum by leveraging our established presence in developed markets alongside a holistic EM product offering across rates and creditit. Our EM Credit revenues grew over 40% year over year in the first quarter, signaling strong momentum moving to slide. 8 Over the past two decades, electronic interest rate swaps trading has evolved from an emerging concept into an ecosystem defined by transparency, efficiency and ongoing innovation. That continued evolution was evident this quarter, including in moments of heightened volatility where clients leaned further into electronic workflows. Global swaps delivered record quarterly revenues, up over 45% year over year, driven by strong client engagement across our global suite of currencies. Our quarterly core risk market share, which drives revenues and excludes compression trading, reached A record rising 190 basis points year over year. Total market share increased from 21% in the first quarter 25 to 24.1% in the first quarter 26 reflecting a combination of strong risk and compression volume growth during the quarter. We achieved record share across sterling and other G11 currencies and our SECond highest share across EM denominated currencies. First quarter performance was driven by record revenues across US, Europe, APAC and emerging markets. This quarter underscored the value of our breadth across the swaps market, particularly as clients interest can ebb and flow across products over time. Specifically, as inflation concerns reemerged and rate expectations shifted, this quarter activity picked up in our inflation swaps business, driving record volumes. It is a product area we entered in 2017 where adoption was initially gradual, but where the opportunity in the market expanded materially after 2020 and we currently hold over 95% electronic market share. That trajectory makes periods like this especially meaningful as they reinforce the value of our continu investments towards building a more holistic swaps offering across products and geographies over time. Beyond inflation swaps, the nature of trading we saw in March evidenced a broader pattern in how electronic trading continues to evolve. Even as market conditions became more challenging, automation remained robust and we saw clients not only lean into inherently electronic protocols, but use them in a more sophisticated way through sending their trades out to multiple dealers. Amidst an environment where we have historically seen that pullback. It’s a testament to the sophistication clients have built into their workflows and to the growing value of electronic trading across market conditions. Overall, our Request for Market (RFM) protocol saw average daily volume growth of over 150% year over year in the first quarter, with growth accelerating in March. Additionally, we continue to make progress across emerging market swaps. Our first quarter EM swaps revenues delivered another strong growth period, delivering another record and we believe there remains significant Runway given the still relatively low levels of electronification. Looking ahead, we continue to see significant long term growth potential in swaps on a DV01 basis. Electronification has grown at an average annual rate of 160 basis points since the first quarter 2020 as dealers and clients move a greater share of their workflows electronically. That progress is reflected in the continued strong revenue performance of our swaps business and we see substantial opportunity to further digitize workflows alongside our clients. In collaboration with them, we expect to drive continued workflow innovation across both cleared and bilateral swaps markets. And with that let me turn it over to Sarah to discuss our financials in more detail.

Sarah Ferber (Chief Financial Officer)

Thanks Billy and good morning. As I go through the numbers, all comparisons will be to the prior year period unless otherwise noted. Slide 9 provides a summary of our quarterly earnings performance. As Billy recapped earlier this quarter, we saw record revenues of $618 million that were up 21.2% year over year on a reported basis and 17.5% on a constant currency basis. Given the weakening dollar, we derived approximately 44% of our first quarter revenues from international clients. And recall that approximately 30% of our revenue base is denominated in currencies other than dollars, predominantly in euros. Total trading revenues increased 23%, comprised of 25% variable trading revenue growth and 14% growth across fixed trading revenue rate. Fixed revenue growth was primarily driven by an increase in minimum fee floors for certain dealers and by the addition of dealers to our mortgage and US Government bond platforms. Credit fixed revenue growth was primarily driven by the previously disclosed introduction of minimum fee floors and the migration of certain dealers to subscription fees. Other revenues of $10 million for the first quarter increased by 56%, primarily driven by growth in our digital initiatives related to our commercial relationship with the Canton network. Overall, the other revenue line will remain variable quarter to quarter, reflecting fluctuations in a number of variables including the number of Canton coins earned, Canton coin value, the number of super validators in the network, and periodic tech enhancements for our retail clients. We expect total other revenues in 2026 to be roughly in line with 2025 first quarter adjusted EBITDA margin of 55% increased by 101 basis points on a reported basis when compared to our 2025 full year margins. Our net interest income of approximately $17 million increased due to higher cash balances which offset lower interest yields. Lastly, this quarter’s GAAP results were impacted by both realized and unrealized gains and losses across our strategic investments. Specifically, we recorded $1.2 million in net loss this quarter, including $2.9 million of unrealized losses reflecting the mark to market of our Canton coin holdings. As a reminder, these losses are only included in GAAP EPS and are …

Full story available on Benzinga.com

This post was originally published here

Lightspeed Commerce (NYSE:LSPD) shares were volatile on Wednesday. The company announced a strategic divestiture of its Upserve U.S. hospitality product line to Skyview Equity.

This move aims to sharpen focus on its core growth engines in retail and hospitality, adding pressure as broader markets edged lower.

Lightspeed has sold its non-core Upserve product line for total cash consideration of up to $81 million, with $37 million subject to an earnout. This divestiture is expected to enhance the company’s flexibility in pursuing capital allocation priorities, including share repurchases and investments in product development.

As of December 31, 2025, Lightspeed had $479.0 million in cash and cash equivalents.

Technical Analysis

Lightspeed Commerce is currently trading 9.3% below its 20-day simple moving average (SMA) and 10.5% below its 50-day SMA, suggesting short-term bearish momentum. The stock is also 13.4% below its 100-day SMA, indicating a continued struggle in the intermediate term.

The relative strength index (RSI) stands at 46.11, which is neutral and suggests that the …

Full story available on Benzinga.com

This post was originally published here

Landstar System Inc (NASDAQ:LSTR) reported better-than-expected earnings for the first quarter on Tuesday.

The company posted quarterly earnings of $1.16 per share which beat the analyst consensus estimate of $1.12 per share. The company reported quarterly sales of $1.171 billion which beat the analyst consensus estimate of $1.156 billion.

“The Landstar team of independent business owners and employees executed well in a dynamic transportation backdrop, with our network generating higher truck transportation revenues and increased BCO utilization year-over-year,” said Landstar President and Chief Executive Officer Frank Lonegro. “I was particularly pleased with our variable contribution performance which reflected Landstar’s first year-over-year increase in variable contribution since the third quarter of 2022. We were encouraged by our improved first …

Full story available on Benzinga.com

This post was originally published here

On Wednesday, Wingstop (NASDAQ:WING) discussed first-quarter financial results during its earnings call. The full transcript is provided below.

This content is powered by Benzinga APIs. For comprehensive financial data and transcripts, visit https://www.benzinga.com/apis/.

The full earnings call is available at https://event.choruscall.com/mediaframe/webcast.html?webcastid=YjJIWuwu

Summary

Wingstop reported a disappointing 8.3% decline in same-store sales for Q1, attributing it to atypical winter weather and elevated gas prices, but achieved a 5.9% increase in system-wide sales driven by unit growth.

The company is focusing on strategic initiatives such as the Wingstop Smart Kitchen, a new loyalty program called Club Wingstop, and targeted marketing campaigns to drive future growth.

Wingstop opened 97 net new restaurants in Q1, reflecting a 17% unit growth, and maintained strong franchisee margins, demonstrating resilience in its asset-light model.

Management expects a return to same-store sales growth in the second half of the year, driven by operational improvements and strategic marketing efforts.

Wingstop is preparing for a national launch of its loyalty program by the end of Q2, which has shown promising results in pilot markets with increased guest retention and engagement.

Full Transcript

OPERATOR

Good morning ladies and gentlemen and thank you for standing by. Welcome to Wingstop Inc. fiscal first quarter 2026 earnings conference call. All participants will be in a listen only mode. Should you need assistance, please signal a conference specialist by pressing the star key followed by zero. Please note that this conference is being recorded today, Wednesday, April 29, 2026. On the call today are Michael Skipworth, President and Chief Executive Officer, Alex Koleidis, Senior Vice President and Chief Financial Officer and Sarah Niehaus, Senior Director of Investor Relations. I would now like to turn the conference over to Sarah. Please go ahead.

Sarah Niehaus (Senior Director of Investor Relations)

Thank you and welcome to the fiscal first quarter 2026 earnings conference call for Wingstop. Our results were published earlier this morning and are available on our Investor relations website@ir.wingstop.com our discussion today includes forward looking statements. These statements are not guarantees of future performance and are subject to numerous risks and uncertainties that could cause our actual results to differ materially from what we currently expect. Our SEC filings describe various risks that could affect our future operating results and financial condition. We use certain non GAAP financial measures that we believe can be useful in evaluating our performance. Presentation of such information should not be considered in isolation or as a substitute for results prepared in accordance with gaap. Reconciliations to comparable GAAP measures are contained in our earnings release. Lastly, for the Q and A session we ask that each of you please keep to one question and a follow up to allow as many participants as possible to ask a question. With that I would like to turn the call over to Michael.

Michael Skipworth (President and Chief Executive Officer)

Thank you Sarah and good morning everyone. We appreciate you joining the call. We believe 2026 is going to be a transformational year for Wingstop and remain extremely confident in the long term opportunity in front of us. Our focus is on execution execution against unique brand specific strategies which include strengthening our operations through the Wingstop Smart Kitchen™, expanding our reach to new guests and launching our new and highly differentiated loyalty program, each of which we believe are structural changes that will drive sustained growth towards our AUV target of $3 million. As I step back and assess the current state of the business, we are making significant progress against our strategic priorities. We are seeing measurable improvements in speed, accuracy and consistency that are being enabled by the Wingstop Smart Kitchen™ along with early signals that our marketing is reaching new guests and driving deeper engagement. That said, our same store sales result in Q1 was disappointing and fell below our expectations as we started the year domestic. Same store sales trends from Q4 carried into the first month of Q1 suggesting more consistency in the trend. However, as the quarter progressed, two factors came into play. The first was atypical winter weather resulting in temporary restaurant closures in over 6, 700 restaurants and secondly, elevated gas prices as a result of the conflict in the Middle east. Not too dissimilar to what we experienced in 2022. Rapidly rising gas prices stress the balance sheet of the lower income consumer that our business over indexes to. As a result, our same store sales trend worsened during the quarter and resulted in a decline of 8.3. If you exclude these unusual external factors, performance would have broadly been in line with our expectations. We have updated our full year outlook to reflect our results for Q1 and now anticipate same store sales to be down low single digits. But we believe our business can return to growth in the second half of the year as these strategies we are executing all come together. While the macro backdrop is masking some of the near term impact, we can see measurable progress across our key initiatives. Our Asset Light highly franchise model continues to demonstrate its resilience. In the quarter we delivered double digit adjusted EBITDA growth and we opened 97 net new restaurants translating into 17% unit growth. This performance reinforces the strength of our model. Central to our strategies is our disciplined focus on protecting our brand partners margins and maintaining strong unit economics which we believe is foundational to sustaining long term unit growth. And despite the challenging macro backdrop, we saw brand partner margins strengthen in Q1 and we believe this helps reinforce the strength of our development pipeline, a pipeline that remains one of the strongest in the industry, showcasing the durability of our model and confidence of our brand partners who continue to invest in the long term growth of the brand. We believe we have significant opportunity in front of us to scale Wingstop to over 10,000 restaurants globally. We remain focused on what we can control and our strategy remains unchanged. Let me start with the Wingstop Smart Kitchen™. The Wingstop Smart Kitchen™ is a meaningful operational transformation requiring fundamental changes to how our restaurants execute day to day. We are making clear progress in strengthening our operations with improvements in speed, accuracy and consistency across the system. And while the full benefits from our new back of house technology have not scaled to the entire Wingstop system yet, we are seeing clear evidence it is working. Last quarter we discussed the need to focus on Friday and Saturday dinner day parts where we see the highest volume of new guests entering the brand. With approximately 50% of new guests trying us for the first time during those windows. Within these dayparts we are now seeing an approximately 16 point improvement in the number of restaurants hitting our targeted speed of service in Q1 compared to Q4 along with a roughly 5 percentage point improvement in accuracy. Restaurants are driving greater consistency during these peak periods, ensuring we deliver on those moments that matter most for both new and existing guests. In addition, customer satisfaction improved across both digital carryout and delivery in the quarter, with delivery improving approximately 17 percentage points in customer satisfaction driven by gains in speed and execution. We are also seen in restaurants consistently achieving our 10 minute speed of service. Standard delivery times are now moving closer to our goal of less than 30 minutes, reinforcing that stronger execution translates into a better end to end guest experience. The most impact is in our lowest performing restaurants, reinforcing that we are raising the floor of performance across the system. This is a significant operational transformation and scaling consistent execution across the system system of our size is a deliberate ongoing focus. As we continue to build consistency across restaurants, dayparts and channels, we expect to more fully unlock the demand and conversion benefits of the platform. To further highlight the progress we are making on speed of service, we’re targeting a launch of our Order Ready Tracker by the end of Q2 that is designed to reinforce our speed of service through enhanced communication to our guests and drive measurable impacts and guest satisfaction. This feature directly connects into the Wingstop Smart Kitchen™ with real time status updates guiding the guests through the cook to order high quality experience only Wingstop can deliver. In early testing, the order tracking feature created greater confidence into the guest quote time, better highlighted the craft associated with each Wingstop order and reduced status related complaints and improved accuracy. The takeaway is clear when we deliver that high quality cook to order Wingstop experience and execute with speed, accuracy and consistency, we drive stronger conversion, improved retention and incremental sales. As we closely analyze the data, it is what we see in the data and the results that gives us strong conviction in the Wingstop Smart Kitchen™. As a key unlock for our restaurants, we are building momentum and as we execute at a high level consistently across the system, we expect the Wingstop Smart Kitchen™ to be a meaningful contributor to scaling AUVs towards our target of $3 million. Another key strategy in 2026 that we believe can position Wingstop for sustained growth is the launch of our loyalty program which we are referring to as Club Wingstop. This is not a traditional discount driven rewards program. Club Wingstop is built around a single simple premise. Members eat first, giving our most engaged guests access experiences and benefits that go beyond points and discounts. What differentiates the platform is how it enhances the guest interaction through capabilities like group ordering, point sharing and personalized offers that adapt based on behavior. As part of the latent design of this platform, we built an AI enabled tool that will allow us to achieve personalization at scale. This includes generating hundreds of pieces of content that drive relevant and adaptable messages to specific segments in our database. We have features embedded in our Club Wingstop technology that are designed to strengthen the emotional connection to our brand and drive sustainability frequency over time. In our pilot market we are seeing this translate into improved retention, higher reactivation of lapsed users and increased engagement from our most valuable guests. Engagement is strong with roughly half of active guests enrolled and approximately 40% of new guests are signing up. Members are also demonstrating higher check and stronger retention relative to non members. Results in our pilot market are being achieved with limited marketing support and only a partial feature set, which to us reinforces the strength of the platform and the opportunity. As we scale, we are preparing for a national launch by the end of Q2, supported by a full 360 degree marketing strategy and a robust pipeline of features including personalization, merchandise and experiential elements that extend well beyond traditional points based programs. We believe loyalty will be a meaningful driver over time, particularly as we scale nationally and integrate more deeply into our digital ecosystem. Widening the top of the funnel and capturing our fair share of our demand space is another key priority for us. In 2023, we estimate we are capturing only about 2% share in a demand space. We believe we can win a 20% share, highlighting the significant Runway ahead. But execution is foundational to this effort. It starts with driving acquisition through brand awareness and innovation, particularly flavor led innovation, which we know is a key driver of consideration, especially among the consumers we are targeting in our demand space. Our Wingstop is Here advertising campaign is designed to expand the top of the funnel and we are beginning to see early signs that it is working. New guests are increasingly skewing towards higher income cohorts, particularly in the $50,000 to $100,000 range, one of the fastest growing segments among new guests we’re acquiring. This gives us confidence that our marketing is resonating with a broader audience and is reflective of the opportunity we’re targeting in our demand space. Looking ahead, we have a strong pipeline of innovation and marketing initiatives including continued flavor led innovation. And the next phase of Wingstop is here, which we believe will showcase the quality and premium experience our guests have come to love. Together with the Wingstop Smart Kitchen™ and Club Wingstop, these efforts are designed to strengthen acquisition, improve conversion and support sustained traffic growth over Time. Another significant factor for building brand awareness and acquiring new guests is what we’ve been able to accomplish in expansion of our footprint. Our unit growth is supported by the strength of our unit economics underpinning the strong demand from our brand partners. In the first quarter we opened 97 restaurants globally at a more than 17% growth rate versus the year. As we grow our restaurant base, development itself becomes a demand driver, expanding brand awareness and amplifying the impact of our marketing, reinforcing the flywheel across the system. We continue to scale Wingstop in a disciplined manner and believe our market level strategies will allow us to do so in the most sustainable way outside of the US Momentum remains strong with newer markets such as Ireland and Thailand thriving and already delivering attractive unit economics as well as reinforcing the portability of the brand. Looking ahead, we remain on track to enter our largest new market to date, India in 2026, representing a significant long term opportunity. What fuels our growth is our brand partners returns which we believe are industry leading. It’s why we believe addressing near term challenges for our core consumer should not compromise our long term fundamentals. That mindset has translated into incredible growth. Since the beginning of 2023 we have opened over a thousand restaurants and more than doubled system wide sales to over $5.4 billion on a trailing twelve month basis. All while systematically growing our global pipeline to a record level. While the level of uncertainty in the current operating environment remains high, our path forward and strategies are very clear. We are focused on strengthening our operations through the Wingstop Smart kitchen, expanding our reach to new guests and launching Club Wingstop. Each of which we believe will drive a return to same store sales growth and further strengthen brand partner profitability and returns. We are confident in the strength of our asset light model, the resilience of our brand and the significant Runway ahead. Together we believe these position us to scale average unit volumes towards $3 million, expand our global footprint and continue advancing our ambition to become a top 10 global restaurant brand. And it is important to note that none of this would be possible without the dedication of our team members and the continued commitment of our brand partners who are executing every day to deliver a great guest experience experience and grow the Wingstop brand around the world. With that, I’ll turn the call over to Alex.

Alex Koleidis

Thanks Michael and good morning. Our first quarter results reflect the resiliency of our highly franchise asset light model. In a more pressured consumer environment, we delivered system wide sales growth, double digit adjusted EBITDA growth and unit growth that well exceeded our long term algorithm. Development continues to be one of the most compelling proof points in our model and the long term opportunity to scale Wingstop into a top 10 global restaurant brand. We opened 97 net new restaurants in the first quarter, a 17% growth rate and with domestic AUVs at approximately $2 million on a roughly $580,000 upfront investment to build a Wingstop, our brand partners are seeing on average a payback of less than two years. Our unit economics are what drive the demand we see in our pipeline which is evident in a pipeline that stands at more than 2,200 restaurant commitments under development agreements and that demand remains broad based across our brand partners. System wide sales increased 5.9% to $1.4 billion in the quarter fueled by net new unit development and more than offset the 8.7% decline in same store sales as a result of our system wide sales growth. Total revenue increased 7.4% to $183.7 million versus the prior year. Royalty revenue, franchise fees and other increased $8.7 million to $87.5 million. Company owned restaurant sales increased by $2.9 million to $33 million driven by six additional corporate stores opened or acquired since the prior year. Comparable period company owned restaurant cost of sales decreased 110 basis points versus the prior year to 74.9% of company owned restaurant sales, primarily driven by a 160 basis point decline in food, beverage and packaging costs. Our supply chain strategy continues to provide great visibility and predictability into food costs for our brand partners throughout 2026. With this current operating environment, we are encouraged by how our strategies improved profitability for our brand partners. This quarter SGA increased $3 million versus the prior year to $34.4 million primarily driven by a $2.4 million non recurring restructuring charge related to the corporate realignment announced in January this year. This was partially offset by lower system implementation costs. We continue to take a disciplined approach with our SGA investments ensuring we are investing appropriately in people, capabilities and technology to support our long term aspirations. Adjusted EBITDA a non GAAP measure was $65.4 million during the quarter, …

Full story available on Benzinga.com

This post was originally published here

Zimmer Biomet Holdings, Inc. (NYSE:ZBH) reported upbeat earnings for the first quarter on Tuesday.

The company posted first-quarter adjusted earnings of $2.09 per share, up 15.5% year over year, beating the Street estimates of $1.86.

The orthopedic implant maker reported sales of $2.087 billion, up 9.3% on a reported basis, up 6.8% on a constant currency basis, and 2.9% on an organic constant currency basis, beating the consensus of $2.07 billion.

“We are off to a solid start to the year — strategically, operationally, and financially,” said Ivan Tornos, Chairman, President, and CEO of Zimmer Biomet.

Zimmer Biomet raised fiscal adjusted earnings guidance from $8.30-$8.45 per share to $8.40-$8.55 per share, compared to the consensus of $8.40.

The company …

Full story available on Benzinga.com

This post was originally published here

Six exchange-traded funds that pay out based on who wins the White House and Congress are set to launch next Tuesday, opening a new channel for retail investors to wager on prediction markets from inside a Roth IRA or 401(k) brokerage window.

Roundhill Investments filed a post-effective amendment with the Securities and Exchange Commission setting May 5 as the effective date, according to Bloomberg ETF analyst James Seyffart.

The May 5 Lineup

The lineup includes the Roundhill Democratic President ETF (BLUP) and Roundhill Republican President ETF (REDP), tied to the November 2028 winner.

Four more funds cover Democratic and Republican control of the House and Senate after the 2026 midterms.

Each fund gains exposure through swap agreements referencing event contracts traded on CFTC-regulated exchanges like Kalshi.

If the targeted party wins, the contracts …

Full story available on Benzinga.com

This post was originally published here

On Wednesday, BXP (NYSE:BXP) discussed first-quarter financial results during its earnings call. The full transcript is provided below.

This transcript is brought to you by Benzinga APIs. For real-time access to our entire catalog, please visit https://www.benzinga.com/apis/ for a consultation.

Access the full call at https://edge.media-server.com/mmc/p/jt9ce37r/

Summary

BXP reported a successful Q1 2026, with FFO per share exceeding estimates by $0.02 and guidance for 2026 raised by $0.01.

The company achieved strong leasing activity with over 1.1 million square feet leased and a significant increase in occupancy rates.

BXP is benefiting from AI-driven demand, particularly in San Francisco, New York, and Seattle, contributing to leasing successes.

Capital raising and portfolio optimization continue, with $360 million raised in Q1 and plans for further asset sales.

Development projects are progressing, with a focus on multifamily and select office projects, aiming for high returns.

Management remains optimistic about achieving occupancy and FFO growth targets over the next two years.

Full Transcript

OPERATOR

Good day and thank you for standing by. Welcome to Q1 2026 BXP earnings conference call. At this time all participants are in a listen only mode. After the speaker’s presentation, there will be a question and answer session. To ask a question during the session you will need to press star 11 on your telephone. You will then hear an automated message advising your hand is raised to withdraw your question. Please press star 11 again. In the interest of time, please limit yourselves to one question. Please be advised that today’s conference is being recorded. I would now like to hand the conference over to your first speaker, Helen Hahn, VP of Investor Relations. Please go ahead.

Helen Hahn (VP of Investor Relations)

Good morning and welcome to BXP’s First Quarter 2026 Earnings Conference Call. The press release and supplemental package were distributed last night and furnished on Form 8K. In the supplemental package, BXP has reconciled all non GAAP financial measures to the most directly comparable GAAP measure in accordance with Reg G. If you did not receive a copy, these documents are available in the Investors section of our website@investors.bxp.com A webcast of this call will be available for 12 months. At this time we would like to inform you that certain statements made during this conference call which are not historical may constitute forward looking statements within the meaning of the Private Securities Litigation Reform Act. Although BXP believes the expectations reflected in any forward looking statements are based on reasonable assumptions, it can give no assurance that its expectations will be attained. Factors and risks that could cause actual results to differ materially from those expressed or implied by forward looking statements were detailed in yesterday’s press release and from time to time in BXP’s filings with the SEC. BXP does not undertake a duty to update any forward looking statements. I’d like to welcome Owen Thomas, Chairman and Chief Executive Officer Doug Linde, president and Mike LaBelle, chief financial officer. During the Q and A portion of our call, our regional management teams will be available to address any questions. We ask that those of you participating in the Q and A portion of the call to please limit yourself to one and only one question. If you have an additional query or follow up, please feel free to rejoin the queue. I would now like to turn the call over to Owen Thomas for his formal remarks.

Owen Thomas (Chairman and Chief Executive Officer)

Thank you Helen and good morning to all of you. BXP had a successful first quarter. Our FFO per share result exceeded our own estimate by $0.02. Our FFO per share guidance for 2026 was raised by $0.01 and we made continued strong progress on our business plan articulated at last year’s investor conference by completing significant leasing, closing additional asset sales and progressing our development pipeline. Last week we also released our annual Sustainability and Impact Report outlining the positive outcomes achieved for shareholders and other important constituents from our industry leading sustainability efforts. Our first business plan priority is to Lease space and improve Portfolio Occupancy There is no question that AI has been and continues to be enormously beneficial to BXP’s leasing activity. Despite the market anxiety regarding the impact of AI on job creation and resultant leasing demand, we are experiencing direct benefits by leasing space to AI companies in San Francisco, New York and Seattle as well as indirect benefits from both leasing space to companies displaced by growing AI firms and to our core financial, legal and business services clients serving the rapidly growing AI industry. The near and medium term negative impacts of AI on jobs are more likely in support functions which are less present in premier workplaces and in gateway markets. We had a strong first quarter completing over 1.1 million square feet of leasing. Our in service portfolio occupancy rose 70 basis points to 87.4% and the spread between our leased and occupied square footage widened 80 basis points to 3.5%, a precursor to more occupancy gains ahead. The environment for leasing Premier Workplaces remains healthy and very active. Our current and prospective clients are generally experiencing increasing earnings due to the growing economy in the US we are seeing more client growth and contraction in our leasing activity. In many cases our clients are also upgrading their space and or location to more readily implement their tightening in person work policies. All of these client factors, growth, more use of space and upgrading have led to the consistent strength and outperformance of the Premier workplace segment of the office market where BXP is a clear market leader. Premier Workplaces represent roughly the top 14% of space and 8% of buildings in the four CBD markets where BXP has a major presence. Direct vacancy for Premier workplaces in these four markets is 8.5% versus 13.8% for the broader office market. While asking rents for Premier Workplaces continue to command a premium of more than 60% over the non premier buildings. Over the last three years, net absorption for Premier workplaces has been a positive 11.9 million square feet versus only 420,000 square feet for the balance of the market. For the non premier workplace segment, all markets had negative absorption except New York City. Given these positive market and client trends and BXP’s strong leasing over the last year, we have started to realize our forecasted occupancy gains the last two quarters, reinforcing our confidence that our target of 4 percentage points of total occupancy improvement over 2026 and 2027 remains achievable. Our second business plan goal is to raise capital and optimize our portfolio through asset sales. During our investor conference we communicated an objective to sell land, residential and non strategic office assets for approximately $1.9 billion in net aggregate sale proceeds by 2028. We continue to make great progress in the first quarter. We have raised 360 million in total net sale proceeds so far this year and $1.2 billion since our investor conference, including land sales for $250 million, apartment sales for $460 million and office lab retail sales for $500 million. Further, we have under contract the sale of three assets with total net proceeds of approximately $40 million and are in various stages of marketing several additional assets as of now. Future net proceeds from dispositions projected in 2026 could aggregate up to an additional $400 million and we are consistently exploring more asset sales. We have been able to achieve attractively valued land sales by creatively positioning our office land for more valuable uses, particularly residential, across multiple jurisdictions. We have received or are pursuing entitlements for over 3,500 residential units on land intended for office use, which is creating significant value for shareholders and will be the backbone of both our apartment development and land sales activity going forward. We have now sold three high quality stabilized apartment buildings which we built all at a mid 4% cap rate. A notable office transaction we completed in the first quarter was the sale to our partner of our 50% interest in the Marriott headquarters building in Bethesda, Maryland which we developed in 2021. The 743,000 square foot building is fully leased to Marriott and sold for a gross price of $430 million or $589 a square foot and a 6.8% initial cap rate. The Bethesda market is not strategic for bxp. We were able to achieve attractive exit pricing and the development was very profitable for shareholders, generating a $35 million gain on a $47 million investment supporting our disposition efforts. Office transaction volume in the private markets remains healthy with financing available at scale, particularly in the CMBS market. In the first quarter, significant office sales were $14.1 billion, down from the seasonally elevated fourth quarter, but notably up 72% from the first quarter of 2025. In addition to the Marriott headquarters sale, there were a couple of other transactions with relevance to BXP’s portfolio in New York City, 575 Fifth Avenue sold for 383 million or $734 a square foot and a 5.1% cap rate for the office portion of the building. The asset comprises 525,000 square feet and is 90% leased. In San Francisco, the Transamerica Pyramid sold for an allocated price of $600 million or $1,113 a square foot. The 525,000 square foot building is only 60% leased so the in place cap rate was 2.9% but expected to be in the high 7% range in several years once the asset is leased and stabilized. The third business plan goal is to grow FFO through new development selectively with office given market conditions and more actively for multifamily with an equity partner for office. We have and expect to allocate more capital to developments than acquisitions because we continue to find premier work place development opportunities with pre leasing that we believe will generate cash yields upon delivery roughly 150 to 250 basis points higher than cap rates for lower quality asset acquisitions with ongoing capex requirements. The trade off is timing as developments obviously take several years to deliver. For Multifamily we have three projects with over 1400 units under construction, are in various stages of entitlement and or design for nearly 5,000 units and have one project in Herndon, Virginia which we plan to commence in 2026. We expect to continue to capitalize. New development starts with financial partners owning the majority of the equity. BXP’s largest development underway is 343 Madison Avenue, our market leading premier workplace tower in New York City with direct access to Grand Central Terminal. As previously reported, we have a lease commitment for 29% of the building located in the mid rise. We are also negotiating leases with tenants for another 27% of the building which will bring us to 56% committed with available space at both the podium and high rise of the tower. Given strong market conditions and the lack of available competitive product, we are making multiple client presentations every week for the remaining space we have procured. 83% of the construction costs have realized anticipated savings from our original budget and our projections remain on track for a stabilized unleveraged cash return of 7.5 to 8% upon delivery in 2029. We are in discussions with several potential equity partners for a 30 to 50% leveraged interest in the property and also have an agreed letter of intent with a consortium of banks for construction financing at attractive terms. We intend to complete the recapitalization in 2026. BXP’s current development pipeline, comprising six office, life, science and residential projects underway, totaling 3.4 million square feet and $3.6 billion of BXP investment, will deliver external growth over the longer term. So in conclusion we continue to successfully lease space and improve occupancy, creatively reposition and monetize non core assets and de risk our development pipeline through leasing, construction and capital raising successes. New construction for office has virtually halted leading to higher occupancy and rent growth. In many sub markets where BXP operate, debt and equity capital is available. For premier workplaces, BXP is building market share given our stability and consistent service to our clients and in many markets less competition. BXP remains comfortably on track with our business plan which if successful will lead to increasing portfolio occupancy and FFO per share, deleveraging external growth from development and a more highly concentrated CBD and premier workplace in service portfolio in the years ahead. And let me turn over our report to Doug.

Doug Linde (President)

Thanks Owen Good morning everybody. I’m going to speak towards demand this morning. For the bulk of my comments, we can debate whether technology companies today are overstaffed, whether remote work strategies have had a demonstrable impact on premier property demand, whether the massive capital investment from data center infrastructure has led to a different perspective on human capital from the large tech companies, and whether new AI models and AI agents will lead to changes in the makeup of the workforce. There are no answers, just conjectures. What we do know is that the US Economy has gone through many technology cycles since the invention of the personal computer 45 years ago, and in this cycle today there is dramatic incremental office demand growth from new organizations that are developing AI. This new technology demand is focused in San Francisco and more recently in New York City. OpenAI and Anthropic are clearly the most recognizable expansions, but there are many meaningful space occupiers expanding across our markets. Databricks, Perplexity, Decagon AI, Harvey, AI Sierra AI, Snowflake, to name a few. With Decagon AI and Snowflake being new tenants in the BXP roster, it’s clear that the clients that are growing are not the tech titans that expanded during the last decade, but there is meaningful office using growth in our markets. CBRE reports that there has been 3 million square feet of positive office absorption in San Francisco over the last seven quarters, including an extraordinary 1.4 million square feet in the first quarter of 2026. This backdrop is important because it is increasingly translating into tangible leasing activity. In the first quarter, BXP’s total leasing volume was 1.14 million square feet. As I discussed during our Investor day in Service vacant space leasing and covering near term lease expirations will drive our occupancy improvements and same store revenue growth. During the first quarter we executed leases on 700,000 square feet of vacant space and renewed or backfilled 235,000 square feet of 26 and 27 expirations post March 31st. Our current pipeline of leases in negotiation consists of 1.7 million square feet and covers 500,000 square feet of existing vacancies and 500,000 square feet of 26and 27 expirations. We start the second quarter with 1.44 million square feet of executed leases on vacant space that we expect to commence in 2026. In the next three quarters, the remaining calendar year of 26 expirations are down to 770,000 square feet. So if nothing else were to change we should pick up 670,000 square feet or 150 basis points of occupancy and end the year at 89%. The majority of our remaining 26 expirations are known, so near term upside will stem from leasing currently vacant space with immediate revenue commencement. We ended 25 with in service occupancy of 86.7. Our occupancy at the end of the first quarter is 87.4, an increase of 70 basis points, with about 57% of that gain stemming from improvements in the portfolio leasing and the balance due to changes in the portfolio including the sales described in the press release and the suburban office buildings I highlighted last quarter that we removed from service and expected demolish and then redevelop the higher value residential uses. Consistent with our portfolio optimization strategy, curvets are progressing quickly in Santa Monica and Waltham, Mass. Separately, we are finalizing documentation with an institutional partner to commence development at Worldgate in Hernet, Virginia where we purchased 300,000 square feet of office buildings and re entitled this as residential townhomes and apartments. We anticipate closing the venture during the second quarter and immediately commencing construction. We are in active conversations with new and renewing clients across all of our markets. Our total discussion pipeline, in addition to the 1.7 million square feet in negotiation is another 1.4 million square feet and we continue to anticipate a minimum of 4 million square feet of leasing in 2026. Consistent with what we put forth in our 2026 guidance post March 31, we’ve executed 300,000 square feet of leases so the total for the year stands at 1.5 million square feet as of today. We made a change to the way we were reporting our second generation leasing statistics this quarter. Instead of providing statistics on leases based on the economic impact date of the lease commencement, which is backward looking, we are showing the change in the rents for all the leases in executed in the current quarter where the comparative lease expired during the prior 24 months from the date of the new lease. Since all that data is in our supplemental, I’m not going to repeat it. I do have a few comments on the transactions behind the aggregate numbers. In Boston the data includes 100,000 square foot lease in the Urban Edge space that was previously leased to biogen. In New York, the bulk of the executed leases this quarter we’re at Times Square Tower where we backfilled a …

Full story available on Benzinga.com

This post was originally published here

Later today, Federal Reserve Chair Jerome Powell will hold what is probably the final meeting of his tenure. Yet, with the federal funds rate at 3.5%–3.75%, the final curveball isn’t the pressure from Washington, but a genuine stagflationary dilemma that leaves the central bank with no room to move.

Fed entered 2026 flirting with a rate cut down the road. The U.S. dollar sank, precious metals surged, and equities kept above the water, hoping that the “wait-and-see” approach eases or succumbs to Washington.

Yet, that hope dispersed once the war with Iran drove renewed cost-side inflation. The World Bank has warned of a 24% surge in energy prices this year—the largest in four years—driven by the ongoing conflict in the Middle East and by severe supply shocks from the closure of the Strait of Hormuz.

“The war is hitting the global economy in cumulative waves through higher energy prices, then higher food prices, and then higher inflation, which will push up interest rates and make debt more expensive,” Indermit Gill, World Bank’s chief economist, wrote in a report.

With Brent oil forecast to average $86/bbl and potentially hit $115/bbl if hostilities escalate, Powell cannot pivot to easing without risking an inflationary spiral.

The Growth Trap

While …

Full story available on Benzinga.com

This post was originally published here

Waste Management (NYSE:WM) reported first-quarter financial results on Wednesday. The transcript from the company’s first-quarter earnings call has been provided below.

This transcript is brought to you by Benzinga APIs. For real-time access to our entire catalog, please visit https://www.benzinga.com/apis/ for a consultation.

The full earnings call is available at https://edge.media-server.com/mmc/p/4g576nv7/

Summary

Waste Management reported a strong Q1 2026 with operating EBITDA growing by nearly 6% year-over-year, driven by solid performance in the collection and disposal business and growth in sustainability businesses.

The company achieved a 6.4% growth in operating EBITDA in its collection and disposal business, supported by customer focus and operational excellence. Sustainable investments are yielding returns with a doubling of operating EBITDA in renewable energy.

Free cash flow doubled to $920 million, allowing Waste Management to return $730 million to shareholders through dividends and share repurchases. The company remains confident in meeting its full-year financial guidance.

Management highlighted strong pricing execution with core price growth exceeding expectations, especially in commercial and landfill lines, and noted opportunities for tuck-in acquisitions in 2026.

Despite headwinds from winter weather affecting volumes, Waste Management expects improvement in the second half of the year, with special waste and industrial volumes showing positive trends.

Full Transcript

OPERATOR

Thank you for standing by and welcome to the WM’s first quarter 2026 earnings conference call. At this time, all participants are in listen only mode. After the speaker’s presentation, there will be a question and answer session. To ask a question during the session, you’ll need to press Star one one on your telephone. If your question has been answered and you’d like to remove yourself from the queue, simply press star 11 again. As a reminder, today’s program is being recorded. And now I’d like to introduce your host for today’s program, Ed Eagle, Vice President, Investor Relations. Please go ahead, sir.

Ed Eagle (Vice President, Investor Relations)

Thank you, Jonathan Good morning everyone and thank you for joining us for our first quarter 2026 earnings conference call. With me this morning are Jim Fish, Chief Executive Officer, John Morris, President and Chief Operating Officer, and David Reed, Executive Vice President and Chief Financial Officer. You will hear prepared comments from each of them today. Jim will cover high level financials and provide a strategic update. John will cover an operating overview and David will cover the details of the financials. Before we get started, please note that we have filed a Form 8K that includes the earnings press release and is available on our website@www.wm.com. the Form 8K, the press release and the schedules of the press release include important information. During the call you will hear forward looking statements which are based on current expectations, projections or opinions about future periods. All forward looking statements are subject to risks and uncertainties that could cause actual results to differ materially. Some of these risks and uncertainties are discussed in today’s press release and in our filings with the SEC, including our most recent Form 10K and Form 10Qs. Jim and John will discuss our results in the areas of yield and volume which unless stated otherwise, are more specifically references to internal revenue growth or IRG from yield or volume. During the call, Jim, John and David will discuss Operating ebitda, which is income from operations before depreciation, depletion, amortization and accretion. Beginning this year, landfill accretion expense was moved from operating expense to depreciation, depletion, amortization and accretion to enhance comparability and better reflect operating performance. For comparability purposes. 2025 actuals have been updated to reflect that change. Any comparisons unless otherwise stated will be with the prior year period. Net income, EPS income from operations and margin, operating EBITDA and Margin, Operating expense and margin and SGA expense and margin have been adjusted to enhance comparability by excluding certain items that management believes do not reflect our fundamental business performance or results of operations. These adjusted measures, in addition to free cash flow, are non GAAP measures. Please refer to our earnings press release and tables, which can be found at the company’s website@www.wm.com for reconciliations to the most comparable GAAP measures and additional information about our use of non GAAP measures. This call is being recorded and will be available 24 hours a day beginning approximately 1pm Eastern Time today. To hear a replay of the call, access the WM website at www.investors.wm.com. time sensitive information provided during today’s call, which is occurring on April 29, 2026, May no longer be accurate at the time of a replay. Any redistribution, retransmission or rebroadcasting of this call in any form without the expressed written consent of WM is prohibited. Now I’ll turn the call over to WM CEO Jim Fish.

Jim Fish (Chief Executive Officer)

All right, thanks Ed and thank you all for joining us. The WM team again delivered strong quarterly results with earnings and cash flow results that achieved our expectations. What continues to set us apart is our ability to consistently achieve strong performance regardless of external factors Q1 operating EBITDA grew by nearly 6% compared to the first quarter of 2025, driven by solid performance in our collection and disposal business and further supported by growth in our sustainability businesses and ongoing optimization of healthcare solutions. This momentum start the year, combined with our proven operational execution and resilient business model reinforces our confidence in achieving our full year financial guidance in the first quarter. Our results clearly advanced each of our four strategic priorities for 2026. First, we grew our collection and disposal business achieving 6.4% operating EBITDA growth supported by our focus on customer lifetime value, operational excellence and network advantages. Our strategically positioned post collection network is driving profitable MSW volume growth while our technology leadership leads to differentiated services and lower costs. Additionally, our people first culture and disciplined approach to retention are driving meaningful improvements in safety, service reliability and operational efficiency. As we look ahead, we continue to see opportunities for tuck in acquisitions that complement our existing portfolio that we expect to close in 2026. Second, our sustainability investments continue to generate meaningful returns, underscoring the value of the capital we’ve deployed over time in renewable energy. Operating EBITDA more than doubled in the quarter driven by the completion of seven new renewable natural gas facilities since the first quarter of 2025. In the recycling segment, even though pricing per single stream Commodities declined 27%, operating EBITDA grew by 18% as we realized automation benefits that lower labor costs and higher quality material and processed 9% more volume in 2026. We’re on track to substantially complete the sustainability capital expenditure program we laid out in 2023. Third, in healthcare solutions, we continue to advance the business towards scalable accretive growth. While revenue was impacted by volume losses from last year, effective cost management and synergy capture drove operating EBITDA growth of nearly 12% in the quarter. Importantly, we expect an inflection in revenue growth in the second half of 2026 as the ERP is stabilized and the benefits of our integrated offering become more evident. And finally, turning to capital allocation, our strong operating performance translated into significant free cash flow generation with Q1 free cash flow of $920 million nearly doubling from the prior year. This enabled us to return about $730 million to shareholders through dividends and share repurchases. As we close out the first quarter, our performance reinforces both the strength of our strategy and its alignment with the long term trends shaping our business. We’re delivering consistent results in our core operations, realizing returns from years of disciplined investment and sustainability, advancing healthcare solutions towards scalable growth, and pairing that execution with a thoughtful shareholder focused approach to capital allocation. As we progress through 2026, we’re well positioned to continue to produce strong results and harvest the benefits of our investments. I want to thank our employees for their continued dedication and hard work. Now I’ll turn the call over to John to discuss our operational results.

John Morris (President and Chief Operating Officer)

Thanks Jim and good morning. The first quarter once again demonstrated the strength and resilience of our operating model and the progress we continue to make in optimizing our business. Despite a softer volume environment driven largely by winter weather impacts and the absence of last year’s wildfire related volumes, we delivered strong financial performance. By remaining focused on disciplined price execution, technology enabled efficiency and cost control. This is clearly visible in our collection and disposal business where we delivered operating EBITDA growth of more than 6% year over year, with margin expanding approximately 110 basis points. From a cost perspective, our focus on operational excellence continues to drive meaningful results. Operating expenses as a percentage of revenue improved 70 basis points and came in below 60% for the fifth consecutive quarter, underscoring the durability of the structural changes we’re making across the business. Automation and technology continue to help us flex costs and drive efficiency as volumes fluctuate. As an example, whole dollars, repair and maintenance costs were actually lower year over year and improved by approximately 30 basis points as a percentage of revenue. This improvement reflects innovative solutions and disciplined fleet actions, including the use of augmented reality tools to improve technician efficiency and continued benefits from rightsizing the fleet. Together, these initiatives are improving asset utilization and delivering sustainable cost savings. Equally important, our people first approach continues to show up in our results. Total driver and technician turnover, both voluntary and involuntary, remained low at 17.2%, improving 130 basis points year over year. The strong retention supports, safer operations, higher service reliability and greater efficiency across the business. Notably, our first quarter safety performance was our best ever Q1 performance for safety related incidents, which is particularly impressive given the challenging winter weather conditions. Together, these results reflect the engagement, consistency and dedication our teams bring to executing our strategy every day. Turning to the top Line Pricing execution remains strong. Each of collection and disposal’s core price of 6.3% and yield of 3.9% exceeded our expectations. With pricing dollars up year over year. Core price growth in our commercial and landfill lines of business each exceeded 7.5%, reflecting the value of our service offerings, consistent execution of the field and focus on price to cost spread. Shifting to Volumes we began the year softer than expected with about half of the shortfall in collection and disposal volumes driven by severe winter weather. We did see several areas of underlying strength and stability. MSW volumes were 2.7% and special waste volumes were 6.7%. When excluding wildfire volumes from the prior year, industrial collection volumes returned to modest growth in the quarter supported by continued internalization of solid waste from Healthcare Solutions customers. While volumes were a headwind early in the year, we expect improvement from seasonality as well as the lapping of a couple of larger low margin contract losses in the balance of the year. In Q1, our energy surcharge program recovered the increase in both direct and indirect fuel costs we saw in the first quarter. Higher revenue from fuel recovery created a 20 paces per 20 basis point drag on operating EBITDA margin. Putting together these pieces on pricing volume and energy surcharges, we expect to achieve our full year revenue guidance in 2026. Turning to healthcare solutions, we continue to see the benefits of integration into our core operating structure. Operating EBITDA margin improved by 200 basis points in the quarter while SGA costs decreased roughly 20% year over year, reflecting discipline, operational alignment and the benefits of WM’s integrated business model. We remain on track to achieve a run rate of $300 million of total synergies at the end of 2027 with results reflected across all of our business segments. So in closing, I want to thank our teams for their continued focus, discipline and commitment to serving our customers the strong start to the year reinforces our confidence in our strategy, operating model and ability to perform consistently in a dynamic operating environment. And with that, I’ll turn the call over to David to walk through our financial results in more detail.

David Reed (Executive Vice President and Chief Financial Officer)

Thanks, John, and good morning. We are pleased with our strong start to 2026, particularly when looking at the drivers of our first quarter operating EBITDA margin expansion, which reflects solid contributions from across the business. The collection and disposal business expanded margin by 110 basis points driven by strong pricing and our success using technology and automation to reduce cost. This growth includes the 20 basis point headwind John mentioned from the impact of higher fuel prices. Our recycling and renewable energy businesses together contributed approximately 50 basis points of margin expansion, reflecting accretive growth from investments in renewable natural gas facilities and recycling, automation and new market projects. Healthcare Solutions contributed another 20 basis points of margin expansion due to effective cost management and synergy capture. These contributions were partially offset by 40 basis points of increased spending on technology initiatives and 70 basis points related to higher cost and timing related impacts from incentive compensation and employee benefit costs. The strong execution translated into robust cash generation. Operating cash flow was $1.5 billion in the quarter, an increase of nearly $300 million compared to the first quarter of 2025. The increase was driven by working capital improvements and our strong earnings growth. Capital expenditures totaled $650 million in the quarter, including $61 million directed to sustainability growth investments. Capital spending was approximately 22% lower year over year as expected, reflecting normalized spend on collection vehicles and lower sustainability capital as several projects reach completion during 2025. Combining all of this first quarter free cash flow nearly doubled to $920 million, putting us on track to achieve our full year Guidance As Jim mentioned, we allocated the majority of our free cash flow to shareholder returns in the first quarter. We returned $385 million to shareholders in dividends and we resumed share buybacks, repurchasing $344 million of our shares. Our leverage ratio at the end of the quarter was 2.94 times, returning to within our target range of between 2.5 and 3 times. Our effective tax rate was approximately 18% in the first quarter, lower than planned, driven largely by the benefit of production tax credits related to our renewable natural gas business. During the quarter, the IRS clarified the qualification for these credits and we now expect to realize benefits during the next several years. Another value add from our strategic decision to grow our renewable natural gas portfolio. That benefit is approximately $27 million for the 2025 tax year and 30 to $35 million annually from this year through 2029. As a result of receiving 2025 and 2026 production tax credits, we now expect a full year effective tax rate of approximately 23% in 2026. In closing, I want to thank the entire WM team for their continued focus and execution. Their dedication has driven a strong start to the year and positions us well to deliver on our full year financial guidance. Through our disciplined approach to operations and capital allocation and investment, we remain confident in our ability to create long term value for shareholders. With that, Jonathan, let’s open up the line for questions.

OPERATOR

Certainly. And our first question comes from the line of Jerry Revich from Wells Fargo. Your question please.

Jerry Revich (Equity Analyst)

Yes, hi, good morning everyone. I just want to unpack the really strong margin performance despite the lower volumes in the quarter. Really nice price cost. As we think about the volume cadence over the balance of the year, can we just double click on what gives us confidence that volume trends will be better in the back half of the year? Can we just expand on how you would quantify the weather impact and I don’t know if you want to talk about it month by month or just give us more visibility on that point.

David Reed (Executive Vice President and Chief Financial Officer)

Yeah, just in terms of the margin trajectory for the back half of the year, I mean you do know that Q2 will be a tough comp for us with the Wildfire volumes, but we do expect EBITDA margin to lift nicely from there in the second half and follow a pattern similar to what we saw in 2025. And we had obviously a strong start to our pricing plan for the year. And that also gives us confidence with the margin trajectory.

Jim Fish (Chief Executive Officer)

And then Jerry, as far as volume goes for the remainder of the year, I mean if you first quarter because of the weather impact and look, we don’t normally talk about weather because it happens every year, but this year in particular along that east coast, you know, three feet of snow in Boston, I don’t think they’ve had that in 15 years. So it did impact us. We had a number of facilities that were shut down. John could tell you the more direct numbers, but I think some of our facilities were shut down for as many as 10 days, including by the way, our stair cycle facilities, facilities that were shut down. So it did have a significant impact on volume. As we look at volume going forward, there’s a couple of things that give us reason to be optimistic specifically, and John mentioned it, special waste, which we knew was going to be a difficult comp because of Southern California fire volume last year, including the fire volume, it was down, I think about 1.5%. But excluding it, as John mentioned, it was actually up 6.7%. And the reason that’s meaningful is because it gives us an indication of what special waste will look like, what’s the pipeline look like and what will they look like. What will the special waste volumes look like when we anniversary this fire volume, which is for the most part at the end of Q2, we did get some fire volume in Q3 in the month of July and then it almost all went away at the end of July. So we will get to kind of a clean year over year for special waste by the time we get to the month of August. And this gives us a bit of an indication that that special waste volume should be pretty strong for us. 6.7% is a pretty decent number. And then John also mentioned MSW volume. Just looked at the numbers for last week. MSW volume was over 4% positive for us. So that’s a positive for us. And then the other one that I would mention is industrial volumes which have finally shown a reversal of probably a six or seven quarter trend. We’ve been negative on roll off volumes for at least kind of a year and a half. And we finally got to a point where we’re showing it was I think the real number was like 0.2 positive. So it was just slightly positive and last year’s was like 1.5% negative. So I think we’re fairly encouraged with volume numbers. Are we going to hit our guidance for the year? Don’t know. And we’ll give, we’ll really kind of take a refresh of our guidance numbers at the end of Q2. But we are encouraged with what we’re seeing on the volume side.

Jerry Revich (Equity Analyst)

Okay, I appreciate the color. And then just to unpack the comments about the tough margin comp in 2Q, David, I think normally you folks are up somewhere around 150 to 200 basis points margins 2Q versus 1Q. And you know, given the weather that we just stepped through, it does look like you should be in a position for good year over year margin expansion in 2Q. Even with the tough comps from Wildfire standpoint, just given the run rate in 1Q, I just want to make sure we’re on the same page with you and not missing any moving pieces in the 1Q results as we think about the normal seasonality for 2Q.

David Reed (Executive Vice President and Chief Financial Officer)

Yeah, Jerry. I would say this, John. I think the outsized impact of the wildfires in Q2 is really worth noting. Again, I think the revenue number was 85 ish million dollars and probably strong flow through on that EBITDA. So if you take that out, what I would point you to, if you look back in the tables, you can see whether it’s collection, disposal, recycling, renewable energy, healthcare, you can see the margin improvement in, in Q1, but I think net of the fire headwinds, I think we’re going to see good, we’re going to see good margin improvement in Q1 and Q2, but it will be muted somewhat by that volume not repeating in the landfill line of business. Thank you. Sure.

OPERATOR

Our next question comes from.

Brian

Brian. Is Brian up next? Hi, good morning. Can you hear me? Yes, we can hear you now. Okay. Yep. Good morning. Thanks for taking the question. Yeah, overall really strong margin expansion in the quarter. The only item that sort of jumped out at us in a negative way was just the magnitude of the increase in corporate expense. I think you had been flagging that that was going to be up because of some technology related …

Full story available on Benzinga.com

This post was originally published here

On Wednesday, Seven Hills Realty Trust (NASDAQ:SEVN) discussed first-quarter financial results during its earnings call. The full transcript is provided below.

This transcript is brought to you by Benzinga APIs. For real-time access to our entire catalog, please visit https://www.benzinga.com/apis/ for a consultation.

View the webcast at https://event.choruscall.com/mediaframe/webcast.html?webcastid=m6CKm8dC

Summary

Seven Hills Realty Trust reported first quarter distributable earnings of $5.3 million, or $0.24 per share, at the high end of their guidance, driven by the strength of their loan portfolio and disciplined underwriting.

The company originated three new loans totaling $67.5 million, increasing total outstanding loan commitments to approximately $776 million, and has three additional loans in process totaling $78 million.

Management remains focused on senior secured commercial real estate lending, emphasizing disciplined execution and generating compelling risk-adjusted returns, despite recent geopolitical and market volatility.

The company maintains strong liquidity with $110 million of cash on hand and $400 million of available capacity under secured financing facilities, and expects second-quarter distributable earnings to be between $0.23 and $0.25 per share.

Management highlighted their ability to source opportunities across various property types and geographies, and noted a strong loan pipeline of over $125 million in term sheets for new loan opportunities.

Full Transcript

OPERATOR

Good morning and welcome to Seven Hills Realty Trust’s first quarter 2026 financial results conference call. All participants will be in listen only mode. Should you need assistance, please signal a conference specialist by pressing the star key followed by zero. After today’s presentation, there will be an opportunity to ask questions. To ask a question, you may press star then one on your telephone keypad. To withdraw your question, please press star then two. Please note this event is being recorded. I would now like to turn the call over to Matt Murphy, Manager of Investor Relations. Please go ahead.

Matt Murphy (Manager of Investor Relations)

Good morning. Joining me on today’s call are Tom Lorenzini, President and Chief Investment Officer, Matt Brown, Chief Financial Officer and Treasurer and Jared Lewis, Vice President. Today’s call includes a presentation by management followed by a question and answer session with analysts. Please note that the recording, broadcast and transcription of today’s conference call is prohibited without the prior written consent of the Company. Also note that today’s conference call contains forward looking statements within the meaning of the Private Securities Litigation Reform act of 1995 and other securities laws. These forward looking statements are based on Seven Hills beliefs and expectations as of today, April 29, 2026 and actual results may differ materially from those that we project. The Company undertakes no obligation to revise or publicly release the results of any revision to the forward looking statements made in today’s conference call. Additional information concerning factors that could cause those differences is contained in our filings with the securities and Exchange Commission or SEC, which can be accessed from the SEC’s website. Investors are cautioned not to place undue reliance upon any forward looking statements. In addition, we will be discussing non GAAP financial numbers during this call including distributable earnings and distributable earnings per share. A reconciliation of GAAP to non GAAP financial measures can be found in our earnings release presentation which can be found on our website@7REIT.com with that, I will now turn the call over to Tom.

Tom Lorenzini (President and Chief Investment Officer)

Thank you Matt and good morning everyone. On our call today, I will start by providing an update on our first quarter performance and recent investment activity followed by an overview of our loan portfolio. Then Jared will discuss current market conditions in our pipeline before Matt reviews our financial results and guidance. Yesterday we reported solid first quarter results reflecting the continued strength of our fully performing loan portfolio and our disciplined underwriting approach. Distributable earnings for the quarter came in at $5.3 million or $0.24 per share, which was at the high end of our guidance. We reached a new high water mark with approximately $776 million in total outstanding loan commitments after originating three new loans totaling $67.5 million during the quarter, reflecting our continued progress in deploying the capital raised from our December rates offering. First quarter closings included a $30.5 million loan secured by a medical office property In Atlanta, a $19.5 million loan secured by a grocery anchored retail property in Palm Desert, California, and a $17.5 million loan secured by a Select Service Hotel in Scottsdale, Arizona. We also have three additional loans in process that we expect to close in the near term totaling approximately $78 million, which Jared will speak to in more detail. These originations reflect our ability to source opportunities across property types and geographies while maintaining disciplined underwriting. Importantly, we remain selective in deploying capital and continue to focus on opportunities that meet our return thresholds. Originations so far in 2026 have been executed at a net interest margin of approximately 195 basis points, representing the highest level we have achieved over the past four years when, including the impact of exit fees, total returns are incrementally higher. We believe this reflects both the strength of our platform and an improved first quarter transaction environment. Turning to our loan portfolio, as of March 31st we had total loan commitments of approximately $776 million across 26 floating rate first mortgage loans. Our portfolio continues to demonstrate strong credit performance with a weighted average risk rating of 2.8. No realized losses in all loans current on debt service. Our weighted average all in yield at quarter end was 7.8% and our weighted average loan to value at origination remained conservative at 66%. During the quarter we received the full repayment of a $16 million loan secured by a hotel in Lake Mary, Florida, and subsequent to quarter end we received an additional $54.6 million from the repayment of a multifamily loan in Ohio. We are also expecting the repayment of a $26.5 million loan secured by an office building in suburban Chicago as early as this week upon payoff. This will reduce our overall office exposure to approximately 21% of the current portfolio. This repayment activity meaningfully increases our available capital and supports continued deployment into new investments. With recent loan repayments, we currently have approximately $110 million of cash on hand and nearly $400 million of available capacity under our secured financing facilities. As previously announced, we extended the maturities of our UBS and Wells Fargo financing facilities to 2028 and doubled the capacity of the Wells Fargo facility to $250 million, further enhancing our ability to deploy capital and continue growing the portfolio. In summary, we believe Seven Hills is well positioned to capitalize on an active pipeline of middle market lending opportunities. While recent headlines have raised concerns around private credit, it is important to note that Seven Hills remains narrowly focused on senior secured commercial real estate lending. This approach is reinforced by RMR’s multi decade track record managing and operating commercial real estate, providing deep asset level insight, disciplined underwriting and proven experience across market cycles. With strong liquidity expectations of improving transaction activity and attractive lending spreads, we remain focused on disciplined execution and generating compelling risk adjusted returns for our shareholders. With that, I’ll turn the call over to Jared.

Jared Lewis (Vice President)

Thanks Tom. Since our last call, we’ve seen increased volatility across the capital markets, driven in part by the ongoing conflict in Iran and its impact on investor sentiment. Interest rates have also moved higher, with the 10 year treasury rate increasing from approximately 3.95% at the end of February to 4.39% today and the expectation is that the FOMC will maintain its target range for the federal funds rate at 3.5% to 3.75% later this afternoon. While the year began with strong transaction activity, continuing the momentum we saw at the end of 2025, recent market volatility has started to have an impact on owners decision making. Over the past month we have seen some moderation in acquisition and sales activity as market participants …

Full story available on Benzinga.com

This post was originally published here

Generac Hldgs (NYSE:GNRC) reported first-quarter financial results on Wednesday. The transcript from the company’s first-quarter earnings call has been provided below.

Benzinga APIs provide real-time access to earnings call transcripts and financial data. Visit https://www.benzinga.com/apis/ to learn more.

View the webcast at https://edge.media-server.com/mmc/p/734quh73

Summary

Generac Hldgs reported a 12% year-over-year increase in net sales for Q1 2026, driven mainly by a 28% rise in the commercial and industrial (CNI) segment, supported by data center demand and recent acquisitions.

The company raised its full-year guidance for net sales and adjusted EBITDA margin, citing strong performance in the CNI segment and expected contributions from the Enercon acquisition.

The backlog for data center-related orders increased significantly, providing visibility through 2027, with notable progress in securing hyperscale data center customer commitments.

Generac Hldgs’ residential segment saw improved EBITDA margins due to cost efficiencies from the new Generac Home organizational structure and favorable sales mix.

Management highlighted ongoing investments in capacity expansion to meet rising demand, particularly for large megawatt generator shipments, and discussed plans for further capacity increases and potential M&A to support growth.

Full Transcript

OPERATOR

Good day and thank you for standing by. Welcome to the first quarter 2026 Generac Holdings Earnings Conference Call at this time, all participants are in a listen only mode. After the speaker’s presentation, there will be a question and answer session. To ask a question during this session, you’ll need to press star 11 on your telephone. You will then hear an automated message advising your hand is raised to withdraw your question. Please press star 11 again. Please be advised that today’s conference is being recorded. I would now like to hand the conference over to today’s speaker, Chris Roseman, Director of Corporate Finance and Investor Relations.

Chris Roseman (Director, Corporate Finance and Investor Relations)

Please go ahead sir Good morning and welcome to our first quarter 2026 earnings call. I’d like to thank everyone for joining us this morning. With me today is Aaron Yogfeld, President and Chief Executive Officer and York Ragan, Chief Financial Officer. We’ll begin our call today by commenting on forward looking statements. Certain statements made during this presentation as well as other information provided from time to time by Generac’s employees may contain forward looking statements and involve risks and uncertainties that could cause actual results to differ materially from those in these forward looking statements. Please see our earnings release or SEC filings for a list of words or expressions that identify such statements and the associated risk factors. In addition, we will make reference to certain non GAAP measures during today’s call. Additional information regarding these measures, including reconciliation to comparable US GAAP measures, is available in our earnings release and SEC filings. I’ll now turn the call over to Aaron.

Aaron Yogfeld (President and Chief Executive Officer)

Thanks Chris Good morning everyone and thank you for joining us today. Our first quarter results reflect a return to strong growth as net sales increased 12% year over year with healthy gross margin performance and robust operating leverage. Growth during the quarter was led by a 28% increase in our commercial and industrial segment sales primarily driven by continued momentum in the data center end market and the Almond acquisition. First quarter adjusted EBITDA margin of 18.3% expanded significantly from the prior year and was stronger than anticipated driven by strong execution, favorable sales mix and lower than expected input costs and operating expenses. Given our first quarter outperformance, the continued strength in our Commercial and Industrial (CNI) segment including an increase in projected global data center revenue and the expected contribution from the acquisition of Enercon. We are raising our full year net sales and adjusted EBITDA margin outlook this morning. Now, discussing our performance by segment in more detail, we’re continuing to progress through the final stages of vendor approval with two hyperscale data center customers and we are very confident that we will be able to secure meaningful future volume commitments from these accounts. As previously disclosed, we received a non binding notice to proceed for approximately $600 million in 2027 deliveries with a certain hyperscale customer and we have begun discussing site level specifications for these projects and as we prepare to ramp our supply chain and production to meet this accelerating demand. We believe the successful navigation of these rigorous approval processes will solidify Generac as a top tier global supplier of large megawatt diesel backup power generators in the years ahead. Importantly, we have also realized significant order activity from both new and existing data center customers, increasing our current backlog to more than 700 million, which does not include the anticipated impact of the notice to proceed opportunity mentioned above and represents an increase of approximately 300 million since our fourth quarter update in mid February. This backlog growth provides visibility through 2027 even before considering the significant expected contribution from other hyperscale related opportunities and ongoing momentum with non hyperscale customers. As we prepare for meaningful growth in large megawatt generator shipments in the coming quarters, our new facility in Sussex, Wisconsin remains on track to begin production in the second half of this year, supporting the expected increase in our domestic generator manufacturing and assembly capacity for these products to more than a billion dollars by the fourth quarter. We believe this expanded footprint will allow us to capture an increasing share of the rapidly growing demand for backup power solutions from large data center customers and together with our international Commercial and Industrial (CNI) production base, provides us with unique global flexibility and scale to serve this market. Additionally, on April 1st we completed the previously announced acquisition of Enercon, a leading designer and manufacturer of generator enclosures and switchgear. This acquisition enhances our competitive positioning for large megawatt generators by giving us direct access to the design and manufacturing processes that are an important element of the bespoke content included with large megawatt generators. Additionally, our ability to invest in additional capacity for these highly customized genset packages will allow us to solve for a growing industry bottleneck and enable us to better control overall customer lead times for our products. By bringing these packaging capabilities in house, we expect to expand our margin profile, further improving the profitability for products sold into the markets for these products, including data center applications. In addition, Enercon’s expertise in other product categories such as switchgear and packaged electronics controls also enables our participation in interesting adjacent market opportunities which we are currently evaluating as we fully integrate this business into our Commercial and Industrial (CNI) segment. During the first quarter, shipments to our domestic industrial distributor channel increased from the prior year and project quoting activity remains solid to start the year, while product lead times for this channel have continued to normalize over the last several quarters. We expect modest growth for the full year supported by stable near term end market demand as well as our continuing investments in distribution that are helping to drive market share gains. Order rates from domestic telecom customers improved sequentially during the quarter, providing visibility to better than previously expected growth for the remainder of the year. Our telecom customers continue to invest in further hardening of their networks as dependence on wireless communications increases and global tower and network hub counts are expected to continue to grow well into the future. Additionally, the evolving telecom and digital infrastructure landscape is expanding our opportunity set with new and existing customers. We are working to leverage our track record of highly engineered solutions, market expertise and customer relationships in traditional telecom applications to capitalize on these opportunities, including data center adjacent applications. Domestic mobile product shipments to both national and independent rental equipment customers exceeded our expectations during the quarter and increased at a strong rate from the prior year. The acquisition of Almond in January contributed to the strong year over year growth and outperformed our prior expectations with respect to both sales and adjusted EBITDA contribution. Many of our rental customers have begun to invest in new equipment as part of a re fleeting cycle and this timely acquisition has both broadened our customer base for mobile products and provided us with additional capacity and flexibility within our domestic manufacturing footprint. Additionally, robust order rates from our existing national rental customers are contributing to our increased overall net sales outlook for 2026. International shipments also increased at a strong rate year over year, driven primarily by revenue from products sold to the data center end market. Global shipments of our controlled solutions and the favorable impact from foreign currency sales increased across most regions, partially offset by softness in the Middle east and Latin American regions resulting from geopolitical instability and trade policy uncertainty. With a strong start to the year, we are increasing Our full year 2026 Commercial and Industrial (CNI) segment net sales guidance as a result of the increased expectations across our data center, telecom and rental markets as well as contributions from the Enercon acquisition. This is partially offset by softness in certain international regions. As previously mentioned, we now expect Commercial and Industrial (CNI) segment net sales to increase in the mid to high 20s percent range, which represents an increase from our prior guidance for growth in the low to mid 20s percent range for this segment. And now I’d like to provide an update on our residential segment for both the quarter and the year. At our Investor Day in March, we introduced Generac Home, a new organizational structure within our residential segment that brings together our home standby portable generator and energy technology teams into a single group as our residential backup power and energy technology solutions are increasingly integrated. This combination enables us to better leverage synergies across our product development and supply chains, operations, sales and marketing, and customer service capabilities. The unification of these teams will allow us to further streamline our software platforms to better serve our customers as well as accelerate the development of products and solutions to help homeowners solve for the increasing power reliance, resiliency and cost challenges they are facing. Importantly, the efficiencies resulting from this new structure reflect the continued recalibration of our clean energy operating expenses and are expected to enable cost savings that support our projected residential segment adjusted EBITDA margins expansion in the coming years. We’ve already begun to realize these benefits as evidenced by the expansion of our residential segment EBITDA margins by nearly 500 basis points as compared to the prior year first quarter, driven largely by lower operating expenses in the current quarter. Looking at our first quarter residential segment results in more detail, Home standby generator sales were approximately flat from the prior year with higher pricing offsetting lower volumes as compared to a strong prior year period that included the benefit from an active 2024 hurricane season. The current quarter’s performance was slightly ahead of our expectations as we experienced stronger than anticipated demand following Winter Storm Firm. This event and the related media coverage preceding it helped drive awareness for our products, resulting in strong year over year growth in home consultations and for home standby generators and higher shipments of portable generators. However, despite the elevated outage activity from Winter Storm Firm, overall power outage activity for the first quarter was approximately in line with the long term baseline average activations or installations of home standby generators declined as expected from the first quarter of 2025, primarily driven by markets that were impacted by elevated hurricane activity in the second half of 2024. We expect activations will return to growth in the second half of this year, underpinned by our assumption for a return to a more normal baseline average power outage environment as compared to the exceptionally soft outage environment experienced in the second half of 2025. Our residential dealer network expanded further during the quarter and now includes more than 9,500 dealers, representing an increase of approximately 300 from the prior year. Continuing interest in the home standby category from these partners provides us with further confidence in the significant growth opportunity that remains for home standby generators as contractors continue to see value with their involvement in the category. Additionally, as we continue to integrate the teams within our new Generac Home organization, we intend to also unify our distribution networks with the goal of providing homeowners and channel partners greater access to to a wider range of home energy solutions with enhanced service and support capabilities. First quarter sales of our residential, solar and storage solutions decreased from the prior year as expected following the successful completion of our Department of Energy program in Puerto Rico. Throughout the quarter we continued to execute against our plan of ramping production of Power Micro, the first Generac branded microinverter product with a contract manufacturing partner here in the US The Power Micro product offering is expected to deliver strong gross margin contribution as sales increase throughout the second half of 2026 and into 2027. The attractive margin profile for these products, together with our ongoing focus on operational efficiencies within the new Generac home structure are expected to contribute to our longer term residential segment margin expansion. A significant focus for the Generac home business is to market and sell our differentiated residential energy EcoSystem and with Ecobee positioned as the energy management hub of the home an important metric, ecobee’s connected home count grew to continue to grow in the quarter to more than 5 million homes with service attach rates further increasing and providing us with a growing high margin recurring revenue stream to complement ecobee’s expanding hardware market share. Profitability continued to improve as well, with ecobee delivering its first positive adjusted EBITDA during first quarter which is normally a seasonally softer quarter for these products. We are expecting continued strong growth in Ecobee shipments for the full year 2026 and as a result we believe the benefits of a scaling top line together with a strong gross margin profile and disciplined operating expense investment will support continued improvement and profitability into the future. In closing this morning, our first quarter results and increased 2026 outlook provide an early look at the significant earnings growth potential of our business. Given the dramatic sales increase in our Commercial and Industrial (CNI) segment, healthy gross margin performance and realization of strong operating leverage based on our continued progress in courting multiple hyperscale data center customers, combined with the improved competitive positioning and profitability resulting from the recent Entercon acquisition, our confidence in capturing a growing share of the generational growth opportunity in the data center market has only increased. Additionally, the megatrends of lower power quality and higher power prices remain firmly intact and continue to support long term growth expectations for our residential segment highlighted by the 50 plus billion dollar penetration opportunity that we believe exists for home standby generators. We remain guided by our Powering a Smarter World enterprise strategy and we believe that we are on the cusp of a special moment in the history of Generac. As a result of the more balanced growth drivers we’re experiencing across our entire business. With that, I’d now like to turn the call over to York to walk through some of the first quarter financial results and our updated outlook in some more detail. York.

York Ragan (Chief Financial Officer)

Thanks Aaron. Looking at first quarter 2026 results in more detail, Overall consolidated net sales during the quarter increased 12% to 1.06 billion as compared to 942 million in the prior year. First quarter the net effect of acquisitions, divestitures and foreign currency had an approximate 4% favorable impact on revenue growth during the quarter. Residential segment total sales increased approximately 1% to 552 million as compared to 549 million in the prior year. This sales increase was primarily driven by higher portable generator shipments due to Winter storm fern in January 2026, partially offset by a decline in energy storage system sales due to the completion of our DOE Puerto Rico program. Home standby generator sales were approximately flat versus prior year as higher pricing was offset by lower volumes due to a strong prior year period that included the benefit from a substantial 2024 hurricane season. Commercial and industrial segment total sales increased approximately 28% to 510 million from 399 million in the prior year quarter, including an approximate 10% net favorable impact from the combination of acquisitions, divestitures and foreign currency. Favorable FX and the Allman CNI mobile products acquisition contributed to this inorganic growth, partially offset by two small divestitures that closed during the quarter. The core total sales growth for the segment was primarily driven by revenue from products sold to global data center customers. In addition, increased shipments to our domestic industrial, distributor and rental channels and higher sales of our control solutions to the global power generation market also contributed modestly to the CNI segment sales growth during the quarter. Consolidated gross Profit margin was 38.7% compared to 39.5% in the prior year. First quarter the 0.8% decrease in gross margin was primarily driven by the higher mix of CNI sales in the quarter, partially offset by favorable price cost realization as compared to our prior expectations. We experienced better than expected sales of our higher margin home standby generators following Winter Storm fern. This favorable sales mix together with strong execution and lower than expected input costs supported our first quarter gross margin outperformance relative to our previous guidance. Operating expenses increased 4.6 million or 2% compared to the first quarter of 2025. The increase was primarily driven by higher intangible amortization from the Almond acquisition. Importantly, we were able to realize strong operating leverage on higher shipment volumes while also capitalizing on operational efficiencies by recalibrating our clean energy spending as part of our Generac Home reorganization. To that end, opex as a percent of sales excluding intangible amortization expense improved from 27.9% in Q1 of 2025 to 24.8% in Q1 of 2026. Overall adjusted EBITDA before deducting for non controlling interest as defined in our earnings release was 193 million or 18.3% of net sales in the first quarter as compared to 150 million or 15.9% of net sales in the prior year. As just discussed, the improved operating leverage on higher sales volumes coupled with reduced residential OPEX drove this significant increase in adjusted EBITDA margins versus prior year. Importantly, this represents strong outperformance compared to our prior expectations, helping to contribute to our higher full year 2026 guidance that I will discuss shortly. Adjusted EBITDA for The residential segment was 139 million or 25.1% of total residential sales as compared to 112 million in the prior year or 20.3%. This significant margin increase versus prior year was primarily driven by favorable price realization and operational efficiencies from the reorganization of Generac Home, resulting in lower operating expenses partially offset by higher costs from tariffs and commodity prices. Adjusted EBITDA for the commercial and industrial segment before deducting for Non controlling interest was 67 million or 13.0% of CNI total sales as compared to 45 million or 11.4% of total sales in the prior year. This margin increase was primarily driven by improved price cost realization, the favorable impact of the almond acquisition and operating leverage on higher shipment volumes. Now switching back to our overall financial performance for the first quarter of 2016 on a consolidated basis. As disclosed in our earnings release, GAAP net income for the company in the quarter was $73 million as compared to $44 million in 1Q25. The current year includes a modest noncash loss from the net impact of two small divestitures that closed during the quarter as we continue to trim the portfolio of non core assets. The prior year includes a $10 million noncash loss to reflect the change in fair value of our Wallbox investment. GAAP income taxes during the current year first quarter were $23.6 million or an effective tax rate of 24.4% as compared to 14.2 million or an effective tax rate of 44.3% for the prior year. Diluted net Income per share for the company on a GAAP basis was $1.24 in 1Q26 compared to $0.73 in the prior year. Adjusted net income for the company as defined in Our earnings release was 106 million in the current year quarter or $1.80 per share. This compares to adjusted net income of 75 million in the prior year or $1.26 per share. Cash flow from operations was $119 million in the current year quarter as compared to $58 million in the prior year first quarter and free cash flow as defined in our earnings release was $90 million as compared to $27 million in the same quarter last year. The strong increase in free cash flow was primarily driven by higher operating earnings and a lower use of cash for working capital as compared to the prior year from a uses of cash standpoint, we closed the Almond acquisition in January 2026 by funding the $123 million purchase price in cash subsequent to March 31 quarter end. We closed the Enercon acquisition on April 1. We funded the $122 million initial purchase price with $77 million in cash and $45 million in stock. Total debt outstanding at the end of the quarter was 1.32 billion, resulting in a gross debt leverage ratio at the end of the first quarter of 1.7 times on an as reported basis, which is within our target gross debt leverage range of 1 to 2 times adjusted EBITDA. With that, I will now provide further comments on our updated outlook for 2026. As disclosed in our earnings release this morning, we are raising our full year 2026 outlook for net sales and adjusted EBITDA. Given further momentum across certain CNIN markets, the acquisition of Enercon and our first quarter outperformance. As a result of these factors, we now expect consolidated net sales for the full year to increase at a mid to high teens rate as compared to the prior year, which includes an approximate 2% favorable impact from the net effect of foreign currency acquisitions and divestitures. This net sales update compares to our previous …

Full story available on Benzinga.com

This post was originally published here

Yum China Holdings, Inc. (NYSE:YUMC) shares moved higher on Wednesday after the company delivered a strong quarterly performance supported by steady demand and expanding digital engagement.

Growth in delivery, loyal customer base expansion and continued store development reinforced confidence in the company’s long-term strategy.

• Yum Brands stock is building positive momentum. Why is YUM stock advancing?

Quarterly Metrics

The company reported first-quarter adjusted earnings per share of 87 cents, beating the analyst consensus estimate of 86 cents. Quarterly sales of $3.271 billion (plus 10% year over year) outpaced the Street view of $3.235 billion.

Total system sales grew 4% year over year, excluding foreign currency translation.

“The late timing of Chinese New Year and the extra April spring break affected gathering patterns and same-store sales growth in …

Full story available on Benzinga.com

This post was originally published here

Legendary macro trader Paul Tudor Jones called Bitcoin (CRYPTO: BTC) “unequivocally, the best inflation hedge that there is” and argued it beats gold on scarcity value with its fixed 21 million supply cap.

Why Bitcoin Beats Gold As Inflation Hedge

Jones, founder and CIO of Tudor Investment Corp., made the case for Bitcoin on the Invest Like the Best podcast Tuesday, pointing to its finite supply as the key differentiator from gold.

“Gold increases supply every year by a couple of percent. Bitcoin, there’s a finite amount that can be mined. It’s decentralized. And so in that sense, it has the greatest scarcity value of anything,” Jones explained.

Bitcoin has less than 1 million BTC left that can be mined out of its 21 million fixed cap.

Jones first advocated for owning Bitcoin as a hedge against central bank …

Full story available on Benzinga.com

This post was originally published here

On Wednesday, American Assets Trust (NYSE:AAT) discussed first-quarter financial results during its earnings call. The full transcript is provided below.

This transcript is brought to you by Benzinga APIs. For real-time access to our entire catalog, please visit https://www.benzinga.com/apis/ for a consultation.

Access the full call at https://edge.media-server.com/mmc/p/ikzn8r8j/

Summary

American Assets Trust reported first quarter 2026 FFO of $0.51 per diluted share, starting the year in line with expectations.

The company successfully recast and upsized its unsecured credit facility, increasing the revolving line of credit from $400 million to $500 million, enhancing financial flexibility.

Office leasing showed strong activity with a 4.8% cash leasing spread and an 86% leased rate for the same store office portfolio.

Retail assets remained robust with a 98% lease rate, while multifamily operations navigated a competitive supply environment with stable results.

The company reaffirmed its full-year FFO guidance range of $1.96 to $2.10 per share, with potential to reach the upper end if certain factors align.

The board approved a quarterly dividend of $0.34 per share, maintaining the current payout ratio despite elevated levels due to leasing-related capital expenditures.

Management highlighted the impact of AI on office demand and investments in technology to improve operations.

Tourism recovery at Waikiki Beachwalk remains gradual, with long-term confidence in the asset’s value despite current challenges.

Full Transcript

OPERATOR

Good morning and welcome to the American Assets Trust first quarter 2026 earnings call. All participants will be in a listen only mode. Should you need assistance, please signal a conference specialist by pressing the star key followed by zero. After today’s presentation, there will be an opportunity to ask questions. To ask a question, you may press star then one on your touchtone phone. To withdraw your questions, please press Star then two. Please note this event is being recorded. I would now like to turn the call over to Meliana Leverton, Associate General Counsel of American Assets Trust. Please go ahead.

Meliana Leverton (Associate General Counsel)

Thank you and good morning. The statements made on this earnings call include forward looking statements based on current expectations, which statements are subject to risks and uncertainties discussed in the Company’s filings with the SEC. You are cautioned not to place undue reliance on these forward looking statements as actual events could cause the Company’s results to differ materially from these forward looking statements. Yesterday afternoon, American Assets Trust’s earnings release and supplemental information were furnished to the SEC on Form 8K. Both are now available on the Investor SECtion of its website americanassetstrust.com. it is now my pleasure to turn the call over to Adam Weil, President and CEO of American Assets Trust.

Adam Weil (President and CEO)

Good morning everyone and thank you for joining us today. At American Assets Trust we continue to approach this market with the same mindset that has guided us across cycles. Patient, disciplined and with a long term focus. That mindset, combined with the quality of our assets and our platform, guides how we allocate capital, manage risk and run our business. We started 2026 in line with our expectations, generating 51 cents of FFO per diluted share and continuing to make progress against the priorities we laid out last quarter. Across the portfolio we saw encouraging activity, most notably in office leasing. While our retail assets remained highly leased and consistent, our multi family teams operated well through a competitive supply environment and Waikiki Beachwalk delivered steady results against a still mixed tourism backdrop. Before turning to the portfolio, I want to highlight a significant balance sheet accomplishment. On April 1, we successfully completed the recast and upsize of our unsecured credit facility. We increased our revolving line of credit from $400 million to $500 million and extended the maturity of the revolver and our $100 million term loan to April 1, 2030. Altogether, this facility provides us with $600 million of total unsecured borrowing capacity. This outcome reflects the quality of our portfolio, the strength of our banking relationships and the confidence of our lender group has in our credit. Importantly, it gives us enhanced financial flexibility and Runway as we execute our leasing and operating objectives now with no debt maturities until 2027, that added capacity is particularly valuable in the current market. While the macro backdrop remains uneven, our tenants are generally well capitalized and the markets where we operate continue to benefit from diversified economies, strong demographics and meaningful barriers to new supply. Those structural advantages matter, particularly during periods when the broader landscape is less predictable. One topic that has generated considerable discussion in our office segment is artificial intelligence. AI is driving investment, business formation and growth across technology, infrastructure and innovation oriented companies along with the professional and advisory ecosystem that supports them. While its impact on office demand will vary by industry, we believe the net effect in our markets has been constructive. At the same time, the bar for office space keeps rising. When companies make office commitments today, they are focused on location, amenities, flexibility, ownership quality and the ability to attract talent attributes that define our post office portfolio. On our own platform, we are investing in technology to improve how we operate, from work order management and preventative maintenance analytics to tenant communication tools, while also building the data foundation for future AI capabilities. We are early in this effort, but we believe it can become a differentiator as we improve the tenant experience and our operating margins. In office, the momentum we flagged last quarter carried forward Demand concentrates at the top of the market and well located, well amenitized buildings with strong ownership. That is where we compete. Our office portfolio ended the quarter 84.5% leased and our same store office portfolio ended the quarter 86% leased, same store office cash NOI came in essentially flat year over year modestly ahead of our internal expectations, reflecting the known move outs we’ve previously previously discussed. During the quarter we executed approximately 237,000 square feet of office leases with comparable cash leasing spreads of 4.8% and straight line leasing spreads of 10.6%. Meanwhile, of our 14 non comparable leases in Q1, which are now separately disclosed in our supplemental, 12 were new tenants, nine of which were in our Spec Suite program. Underscoring the role that program is playing in converting demand into executed leases, we entered the second quarter on solid footing, including approximately 244,000 square feet of previously signed leases not yet commenced, another 122,000 square feet in lease documentation, and a proposal pipeline of over 200,000 square feet at La Jolla Commons Tower 3. The building is currently 49% leased with proposals out on another 30% of the building. The UTC submarket has limited large block availabilities outside of Tower 3 and with no meaningful new supply on the horizon we believe we are in a strong position to capture large tenant requirements in the submarket, including several active requirements we are tracking today. At 1 Beach street the building is currently 36% leased. While 1 larger opportunity we referenced last quarter did not move forward, our leasing focus has shifted toward building a broader pipeline of smaller and mid sized tenants. We already have permits in hand and work underway to advance our spec suite build out, positioning us to capture tenants seeking high quality move in ready space. Prospect activity has improved and the execution across the portfolio has been strong. We remain confident that the trajectory of our office portfolio, including our progress towards stabilizing Tower 3 and one beach will translate into increased cash flow as these leases convert to revenue. Last quarter I mentioned our goal of ending the year …

Full story available on Benzinga.com

This post was originally published here

Artisan Partners Asset (NYSE:APAM) released first-quarter financial results and hosted an earnings call on Wednesday. Read the complete transcript below.

This content is powered by Benzinga APIs. For comprehensive financial data and transcripts, visit https://www.benzinga.com/apis/.

View the webcast at https://edge.media-server.com/mmc/p/o64yqh5n/

Summary

Artisan Partners Asset reported strong long-term investment performance, with a high percentage of AUM outperforming benchmarks over multiple timeframes.

The company experienced net outflows of $3.1 billion in Q1, primarily due to client reallocations and shifts to passive alternatives in some equity strategies.

Despite outflows, there were positive net inflows in 13 investment strategies, notably in sustainable emerging markets and credit businesses.

New strategic initiatives included onboarding Grandview Property Partners and expanding distribution talent in EMEA; an application was filed with the SEC for ETF share classes.

Financial performance showed a decrease in AUM to $173 billion by March 31, 2026, but revenues were up 9% year-over-year; the dividend was adjusted to reflect lower cash generation.

Management highlighted the robust pipeline for expanding credit and alternatives, with potential for further acquisitions and team lift-outs.

Full Transcript

OPERATOR

Welcome to the Artisan Partners Asset Management Business Update and Earnings Call. Today’s call will include remarks from Jason Gottlieb, CEO, and CJ Daly, CFO. Following these remarks, we will open the line for questions. Our latest results and investor presentation are available on the Investor Relations section of our website. Before we begin today, I would like to remind you that comments made during today’s call, including responses to questions, may include forward looking statements. These are subject to known and unknown risks and uncertainties, including but not limited to, the factors set forth in our earnings release and detailed in our Securities and Exchange Commission filings. These risks and uncertainties may cause actual results to differ materially from those disclosed in the statement. We assume no obligation to update or revise any of these statements following the presentation. In addition, some of our remarks today will include references to non-GAAP financial measures. You can find reconciliations of these measures to the most comparable GAAP measures in the Earnings Release and Supplemental Materials which can be found on our Investor Relations website. Also, please note that nothing on this call constitutes an offer or solicitation to purchase or sell an interest in any artisan investment product or a recommendation for any investment service. I will now turn the call over to Jason Gottlieb. Welcome to the Artisan Partners Asset Management Business Update and Earnings Call. Today’s call will include remarks from Jason Gottlieb, CEO, and CJ Daly, CFO. Following these remarks, we will open the line for questions. Our latest results and investor presentation are available on the Investor Relations section of our website. Before we begin today, I would like to remind you that comments made during today’s call, including responses to questions, may include forward looking statements. These are subject to known and unknown risks and uncertainties, including but not limited to the factors set forth in our earnings release and detailed in our Securities and Exchange Commission filings. These risks and uncertainties may cause actual results to differ materially from those disclosed in the statement and we assume no obligation to update or revise any of these statements following the presentation. In addition, some of our remarks today will include references to non-GAAP financial measures. You can find reconciliations of these measures to the most comparable GAAP measures in the Earnings Release and Supplemental materials which can be found on our Investor Relations website. Also, please note that nothing on this call constitutes an offer or solicitation to purchase or sell an interest in any artisan investment product or a recommendation for any investment service. I will now turn it over to Jason Gottlieb.

Jason Gottlieb (Chief Executive Officer)

Thank you for joining the call today. At Artisan Partners, our purpose is to generate and compound wealth for our clients over the long-term we do so by maintaining an ideal home for investment talent, providing a unique combination of autonomy, degrees of freedom, resources and support. Our model has proven repeatable over time as we have steadily expanded our capabilities across equities, credit and alternatives across a wide range of market environments. We have maintained our focus on high value added investing, driving positive outcomes for both our clients and our shareholders. Long term investment performance remains strong across our platform with 74% of our Assets Under Management (AUM) outperforming their benchmarks over 3 years, 76% over 5 years and 99% over 10 years gross of fees. All 12 artisan strategies with track records over 10 years have outperformed their benchmarks since inception net of fees. These 12 strategies have compounded capital at average annual rates between 6% to nearly 13% and have exceeded their benchmarks by an average of 202 basis points annually net of fees. Highlighting our track record of positive long-term investment outcomes, two of our investment teams were recently recognized by Morningstar and Lipper for Investment Excellence. Morningstar nominated The Global Value team’s Dan O’ Keefe for the 2025 Morningstar Award for Investing Excellence Outstanding Equity Portfolio Manager. Lipper named the team’s Global Value fund Institutional Class the best fund in its Global Large Cap Value Funds category for the three, five and ten year periods ended December 31, 2025. Lipper also named Select Equity fund Institutional Class the best fund in its Global Multi Cap Value Funds category for the trailing three ended December 31, 2025. Lipper also named the M-Sights Capital Group’s Global Unconstrained Fund Institutional Class as the best fund in its Global Income Funds category over the trailing three year period ending December 31, 2025. External recognition is not our goal, but the consistency with which Artisan Partners has earned accolades like these across time teams and asset classes validates the quality of our platform and repeatability of our business model and for both talent and clients. Congratulations to the Global Value Team and the M-Sights Capital Group on these recent recognitions. Shorter term trailing one year performance has been weighed down by underperformance in a couple of our largest equity strategies, all of which have strong long-term track records. Turning to slide 4, firm-wide net outflows in the first quarter were 3.1 billion. Outflows were concentrated in a few equity strategies where we saw clients de-risking reallocating after periods of asset class outperformance and some shifting to passive alternatives. Those outflows mask positive business developments across many parts of the platform. Year to date we have net inflows in 13 of our investment strategies the sustainable emerging market strategy raised 250 million in the first quarter and assets under management are nearing 3 billion. We have continued our multiyear success in growing our credit businesses with $800 million of net inflows in the first quarter. This was our 15th consecutive quarter of positive credit flows in alternatives. We raised $300 million in the first quarter, primarily in the Global Unconstrained strategy where we continue to build a realizable pipeline. We expect to see continued strong business development in credit and alternatives. While the backdrop in equities is more challenging and and difficult to predict, our teams have been operating efficiently during a recent market volatility. At the end of last week our Assets Under Management (AUM) was back up to nearly $184 billion, near the all time high that we achieved in late February. Our business and financial model …

Full story available on Benzinga.com

This post was originally published here

Bitcoin (CRYPTO: BTC) remains range-bound in the short term, but BitMEX co-founder Arthur Hayes says the broader trend is still firmly upward, with significant long-term upside driven primarily by global liquidity conditions.

$100,000 First, Then $125,000 In Focus

Hayes said Bitcoin could reach $100,000 after the northern hemisphere summer, with a potential move toward $125,000 by the end of 2026 if macro liquidity conditions continue to improve.

He argued that the primary driver is not regulation or political developments, but expanding dollar liquidity and global macroeconomic conditions.

According to Hayes, Bitcoin is already outperforming traditional markets such as the Nasdaq, and he expects that trend to continue into the fall …

Full story available on Benzinga.com

This post was originally published here

UMB Financial (NASDAQ:UMBF) released first-quarter financial results and hosted an earnings call on Wednesday. Read the complete transcript below.

This content is powered by Benzinga APIs. For comprehensive financial data and transcripts, visit https://www.benzinga.com/apis/.

View the webcast at https://events.q4inc.com/attendee/387352285

Summary

UMB Financial reported a strong quarter with results surpassing expectations, including a 10.8% annualized loan growth and a 9 basis point core margin expansion.

The company emphasized its minimal exposure to the private credit industry, with less than 1% of loans to private credit funds and additional disclosures provided for clarity.

Fee income showed strong performance, particularly in corporate trusts, investment banking, and fund services, contributing to positive operating leverage.

Capital levels improved with a common equity tier 1 ratio increase to 11.1%, and the company executed share repurchases while maintaining a focus on organic growth.

Management expressed confidence in maintaining positive operating leverage throughout 2026 and highlighted strong momentum in newer markets and robust loan pipelines.

Full Transcript

Kay Gregory (Investor Relations)

Please go ahead Good morning and welcome to our first quarter 2026 call. Mariner Kemper, chairman and CEO and Ram Shankar, CFO will share a few comments about our results. Then we’ll open the call for questions from Equity Research analysts. Jim Ryan, President of the holding company and CEO of UMB bank along with Tom Terry, Chief Credit Officer, will be available for the question and answer session. Before we begin, let me remind you that today’s presentation contains forward looking statements, including the discussion of future financial and operating results as well as other opportunities Management foresees. Forward looking statements and any pro forma metrics are subject to assumptions, risks and uncertainties as outlined in our SEC filings and summarized in our presentation on slide 50. Actual results may differ from those set forth in forward looking statements which speak only as of today. We undertake no obligation to update them except to the extent required by securities laws. Presentation materials are available online at investorrelations.umb.com and include reconciliations of non GAAP financial measures. All per share metrics refer to common shares and are on a diluted share basis. Now I’ll turn the call over to Mariner Kemper.

Mariner Kemper (Chairman and CEO)

Thank you Kay and good morning. Everyone will share some brief comments, then open it up for questions. We reported another strong quarter with results well ahead of expectations. We had 10.8% linked quarter annualized loan growth boosted by 2.3 billion in gross production, 9 basis points of core margin expansion driven by a 24 basis point decrease in the cost of interest bearing deposits, High quality credit metrics including 19 basis points of net charge off provision of 27 million driven mostly by the 1.4 billion increase in period end loan balances and finally continued momentum in our fee businesses with strong contributions from corporate trusts, investment banking and fund services where assets under administration increased nearly 20 billion from the prior quarter and stands at 565 billion. I’ll let Ram get into more detail around our results in a moment, but First, I’d like to address some of the headlines around the private credit industry which appear to exaggerate exposures and risks at regional banks. Private credit has been around for years and has been and will continue to be an important part of capital formation on a global basis. We have heard some concern that due to our varied lines of business we may have some outsized exposures and could impact our performance. The fact is that we have negligible exposure to the private credit industry and what exposure we do have is to high quality and experienced operators that have diversified holdings, strong credit structures and low leverage at the fund level, all underwritten to low loan to value metrics. We are proud to partner with a few of the strongest players by providing asset servicing solutions to their funds. This quarter we’ve added additional disclosures to our IR deck to explain what private credit means to us and more importantly, what it doesn’t. First on slide 31 we have outlined our total NDFI lending exposure, providing additional color to the standard call report categories. As you can see, our total NDFI exposure is 2.6 billion, or just 6.6% of total loans. Within that total, approximately 300 million or less than 1% of the loans are to private credit funds. Further, a third of those loans are subscription lines which carry an even lower level of risk. As I noted earlier, these private credit funds are primarily secured by diversified holdings of senior secured loans, have strong borrowing bases, minimal exposure to at risk industries, low leverage, and they have continued to see strong gross inflows. Just under 1 billion of our NDFI loans are to private equity funds with the largest portion of these being subscription lines, also known as capital call lines. As you can see from the definition Included on page 31, subscription lines inherently carry even lower risk to lenders as they are short term lines that are repaid with funds received from on capital calls made to investors who are contractually obligated to contribute the capital to the fund upon request. The slide gives other detail and characteristics of our high quality portfolio, including the fact that over 98% of NDFI balances are pass rated. As you have heard us say before, lending to NDFIs is not a new phenomenon and has long been a part of our CNI portfolio with minimal historic losses. Turning to our fee income exposure to private credit funds, we’ve added some additional detail on asset servicing and custody. Slide on page 36 approximately 43 billion of our more than 565 billion in assets under administration is related to private credit, representing just 7.6% of the total. More significantly, the AUA High private credit fund increased nearly 5% from the end of the prior quarter. The related annual fee income totaled approximately 13 million, or just 1.6% of annualized first quarter fee income and similarly, any deposit impact from these funds is immaterial. Moving on, our capital levels continue to build with March 31st common equity tier 1 ratio of 11.1, a 20 basis point improvement from December. While our capital priorities remain the same with organic growth at the top of our list, our board approved an increased share repurchase authorization and as you can see in our earnings release, we opportunistically repurchased approximately 178,000 shares in March. We will continue to remain opportunistic in the second quarter. Finally, our results this quarter drove positive operating leverage of 6.4% on a linked quarter basis, a 155 basis point improvement in operating rotce, and an operating efficiency ratio of 47.6%. We continue to expect positive operating leverage for the full year of 2026, even with the impact of lower expected contractual accretion benefits. I’m extremely pleased with the performance of our newer markets and I’m excited to continue the momentum throughout the remainder of this year. And now I’ll turn it over to RAM for some additional detail on the drivers of our first quarter results.

Ram

Ram thank you mariner the first quarter included $51 million in net interest income from purchase accounting adjustments, 15.1 million of which was related to accelerated accretion from early payoffs of acquired loans. The benefit to net interest margin from total accretion was approximately 33 basis points. On slide 10 is the projected contractual accretion, which is estimated at approximately 71 million for the remainder of 2026 and 79 million for 2027. These totals do not include any estimates for accelerated payoffs. Slides 12 and 13 include some key highlights and drivers of our quarter over quarter variances. Non interest income for the quarter was 204.8 million, an increase of 6.4 million or 3.2%. Drivers included strong performance from both fund services and corporate trusts, increased deposit service charges and investment banking revenue where municipal trading income increased by 39% from fourth quarter levels. Within the other income category, we had 5.9 million in non recurring gains on previously charged off HTLF loans, a variance of 5.4 million from the fourth quarter. And we had a $3.8 million decline in coli income, which has a similar offset in reduced deferred compensation expense adjusting for investment gains, the non recurring items I noted and mark to market on coli. Our fee income for the first quarter was approximately 198 million. On the expense side we had just 4.4 million in merger related costs compared to elevated levels in the prior quarter when the largest portion of contract termination and conversion expenses were recognized. Excluding the impact of one time costs, operating non interest expense was 375.4 million, a reduction of 4.2% compared to the fourth quarter. Largest drivers included a reduction of 5.9 million in salaries and benefits, expense related to lower bonus and commissions accruals following strong fourth quarter performance and a 3.9 million reduction in deferred compensation expense partially offset by seasonal increases in payroll taxes, insurance and 401k expense. Compared to the guidance I provided last quarter, the favorability in expenses was driven by timing of marketing and other spend sooner than expected synergies realized on contract terminations and deferred compensation expense. Looking ahead, we would expect second quarter operating expense to be in line with the current consensus expectations of 383 million doll. The increase from first quarter primarily reflects one additional salary day as well as the impact of our merit cycle that went into effect in April. Turning to the balance sheet, driving the 10.8% annualized growth that Mariner mentioned was 22% annualized growth in average C and I balances led by strong activity in Texas. Other regions including California, St. Louis, Colorado and Utah posted double digit quarterly growth. It’s great to see the momentum building in several of our acquired regions along with Utah where we opened our first fiscal bank location in December. Our pipeline remains strong heading into the second quarter. Average deposits as shown on slide 25 were essentially flat in the first quarter as the 10.4% linked quarter annualized increase in DDAs was largely offset by lower interest bearing deposit balances. We added a metric this quarter that adds customer repurchase agreement balances which are deposit surrogates. Average customer funding increased 702 million or 1.2% from the prior quarter and 4.8% on a linked quarter annualized basis. This balance remix coupled with the residual impact of the rate cuts in the fourth quarter drove our cost of total deposits down by 19 basis points to 2.06% while cost of interest bearing deposits declined by 24 basis points to 2.79%. We realized a blended beta of 70% on total deposits for the quarter driven by favorable mix shift as well as continued outperformance for pricing on our soft index deposits. Reported net interest margin for the first quarter was 3.38% excluding the 33 basis points contribution from purchase accounting adjustments. Core margin was 3.05% increasing 9 basis points sequentially. The primary drivers of the linked quarter increase in core net interest margin included benefits of a favorable deposit mix shift and repricing of deposits following the reduction in short term interest rates and the positive impact of day count in the quarter, partially offset by loan repricing and lower loan fees and the impact of liquidity balances and a lower benefit from free funds relative to the first quarter adjusted margin of 3.05% that excludes accretion. We expect second quarter margin to be relatively flat as the benefits from fixed asset repricing are offset by day effect and stable deposit costs and mix shift. I will add my typical caveat that actual margin and net interest income will depend on the levels of DDA growth and excess liquidity, any SOFR movements and mix shift within the lending and funding portfolios. Finally, our effective tax rate was 21.1% for the first quarter compared to 20.3 for the fourth quarter. Looking ahead, our tax rate is expected to be between 20 and 22% for 2026. Now I’ll turn it back over to the operator to begin the question and answer session.

Rebecca (Conference Operator)

At this time I would like to remind everyone, in order to ask a question, press star, then the number one on your telephone keypad. We’ll pause for just a moment to compile the Q and A roster. Your first question comes from the line of John Ostrom, with RBC Capital Markets. Your line is open.

John Ostrom (Equity Analyst)

Good morning everyone. Hey, good morning. Maybe Mariner or Jim for you guys on the pipelines. Good number, the 2.3 billion. Maybe it’s a little seasonality in there, but do you expect that to continue to grow from here? And you flagged this in the release, but have you seen any impact on pipelines from some of the geopolitical risks or higher energy costs?

Mariner Kemper (Chairman and CEO)

I’ll take that first, Jim, feel free to add anything. You know, I think this, this is a good news story that I don’t really have anything new to tell you. You know, from being in this seat for 22 years. It’s the same thing every quarter for 22 years, which is, you know, the next quarter looks pretty good and it’s not seasonal at all. And we continue to book loans based on our strategy, bottoms up capability, capacity of the officer, market share opportunity in the markets that we’re in and in the verticals we’re in and there is a very long Runway for us across our entire footprint, including some new very big markets like California, anything.

Jim

The only thing I would add is it’s continues to be strong and it’s from cross section from all markets.

John Ostrom (Equity Analyst)

Yeah. Okay. And then anything on the payoffs and pay downs slowing? I know that that number jumps around, but it was a pretty big step down in the quarter and I guess. Is there anything you would flag on that?

Mariner Kemper (Chairman and CEO)

No, actually I would say that the anticipated payoffs and pay downs in the first quarter actually materialized. So we expected to happen happen and it can kind of bump around the reality of it as we look forward. If you know we’re going to be higher for longer instead of seeing rates come down, we’re not likely to see as much payoff pay down for the rest of the year. If that’s going to …

Full story available on Benzinga.com

This post was originally published here

Apollo Comml Real Est (NYSE:ARI) reported first-quarter financial results on Wednesday. The transcript from the company’s first-quarter earnings call has been provided below.

This transcript is brought to you by Benzinga APIs. For real-time access to our entire catalog, please visit https://www.benzinga.com/apis/ for a consultation.

The full earnings call is available at https://edge.media-server.com/mmc/p/yw7ihdnf/

Summary

Apollo Comml Real Est completed the sale of its $9 billion loan portfolio to Athene, resulting in $1.3 billion in cash and four REO assets valued at approximately $900 million.

The company is evaluating new commercial real estate strategies to enhance stockholder returns and expects to update on this in the coming months.

First quarter 2026 net income was $23 million or $0.16 per diluted share, with distributable earnings of $31 million or $0.22 per diluted share.

The company’s net interest income decreased slightly year-over-year, with interest expense rising due to higher secured debt balances.

Apollo Comml Real Est repurchased 6.8 million shares year-to-date, contributing to a $0.07 increase in book value per share.

The Board has authorized a new $150 million share repurchase program, with book value per share at $12.01 as of March 31, 2026.

The company anticipates paying a quarterly dividend with an 8% annualized yield on book value per share, subject to Board approval.

Apollo Comml Real Est is considering various asset classes for strategic investment but is cautious about market conditions and interest rates.

Full Transcript

OPERATOR

I’d like to remind everyone that today’s call and webcast are being recorded. Please note that they are the property of Apollo Comml Real Est And that any unauthorized broadcast in any form is strictly prohibited. Information about the audio replay of this call is available in our earnings press release. I’d also like to call your attention to the customary safe harbor disclosure in our press release regarding forward looking statements. Today’s conference call and webcast may include forward looking statements and projections, and we ask that you refer to our most recent filings with the SEC for important factors that could cause actual results to differ materially from these statements and projections. In addition, we will be discussing certain non GAAP measures on this call which management believes are relevant to assessing the company’s financial performance. These measures are reconciled to the GAAP figures in our earnings presentation, which is available in the Stockholders section of our website. We do not undertake any obligation to update our forward looking statements or projections unless required by law. To obtain copies of our latest SEC filings, please visit our website at www.apollocref.com or call us at 212-515-3200. At this time I’d like to turn the call over to the Company’s Chief Executive Officer, Stuart Rothstein.

Stuart Rothstein (Chief Executive Officer)

Thank you Operator Good morning and thank you for joining us on the Apollo Commercial Real Estate Finance Inc. First quarter 2026 earnings call. I am joined today by Anastasia Maronova, our Chief Financial Officer, and Scott Wiener, Chief Investment Officer. This call comes at a pivotal moment for ARI. As previously announced, we completed the sale of the company’s $9 billion loan portfolio to Athene on April 24 following repayment of ARI’s financing facilities, other indebtedness and transaction expenses. ARI’s total assets now consist of approximately $1.3 billion of cash along with four REO assets representing approximately $900 million in gross value. The sale delivered ARI stockholders a compelling premium to where the stock has traded in recent years and we believe this outcome demonstrates our unwavering commitment to maximizing stockholder value. As previously indicated, ARI’s management team, Board of Directors and other senior investment professionals at Apollo are in process of evaluating a range of commercial real estate related strategies for ARI, with the goal to deliver attractive go forward returns for stockholders. We have spent a significant amount of time since the announcement at the end of January exploring different strategies and speaking with bankers and other industry experts. We anticipate having an update on the strategy exploration in the coming months. Shifting now to a brief update on the four remaining REO assets As a reminder, two assets, the Brooklyn, a multifamily asset in Brooklynlyn and the Mayflower hotel in Washington D.C. represent approximately 80% of the REO net equity value at the Brooklyn. The market rate residential component is approximately 80% leased and affordable units are approximately 70% leased with 95% of units selected. Both components are expected to reach stabilization by this summer. We continue to monitor the market and think through the appropriate exit strategy either pre or post stabilization while continuing efforts to add value to the western parcel. With respect to the two hotels, the Mayflower had a strong first quarter with net cash flow well ahead of budget. Driven by margin improvements and higher occupancy, we see opportunity for continued improvement in year over year performance and subject to market conditions, we expect more clarity on exit strategy in the second half of the year. Turning to the Cortland Grand first quarter performance was below budget due to broader market softness. Though we expect business interruption insurance from the offline units and the benefit from the upcoming Soccer World cup over the summer to bring full year performance in line with our expectations. We are in active dialogue with several potential buyers regarding alternative uses as we think through potential exit strategies. Lastly, for the two remaining former hospital assets which combined represent approximately $24 …

Full story available on Benzinga.com

This post was originally published here

Bloom Energy Corp (NYSE:BE) posted upbeat financial results for the first quarter after the market close on Tuesday.

Bloom Energy reported first-quarter revenue of $751.05 million, beating analyst estimates of $551.56 million, according to Benzinga Pro. The company reported first-quarter adjusted earnings of 44 cents per share, beating estimates of 13 cents per share.

“We at Bloom are ushering in the era of digital power for the digital age. Bloom is rapidly becoming the standard and ‘go-to choice’ for on-site power,” said KR Sridhar, founder, chairman and CEO of Bloom Energy.

Bloom Energy raised its full-year 2026 revenue guidance from a range of $3.10 billion to $3.30 billion to a new range …

Full story available on Benzinga.com

This post was originally published here

Markel Group (NYSE:MKL) held its first-quarter earnings conference call on Wednesday. Below is the complete transcript from the call.

Benzinga APIs provide real-time access to earnings call transcripts and financial data. Visit https://www.benzinga.com/apis/ to learn more.

View the webcast at https://events.q4inc.com/attendee/748073455

Summary

Markel Group reported Q1 2026 operating revenues of $3.6 billion, flat compared to Q1 2025, with adjusted operating income up 4% to $498 million due to improved underwriting performance.

The company emphasized strategic exits from the global reinsurance and Hagerty programs, which impacted gross written premiums but are expected to benefit profitability and return on equity long-term.

Markel Group continues to focus on share repurchases as a primary capital allocation strategy, having reduced its share count by 10% over the past five years, with plans to accelerate this pace.

Management highlighted the importance of operational excellence, particularly through AI and technology advancements, to improve efficiency and underwriting accuracy.

Future outlook remains positive with expectations of continued growth and healthy returns across all business segments, despite current cyclical pressures in certain end markets.

Full Transcript

OPERATOR

Good morning and welcome to the Markel Group first quarter 2026 conference call. All participants will be in a listen only mode. Should you need assistance, please signal a conference specialist by pressing the star key followed by zero. After today’s presentation, there will be an opportunity to ask questions. To ask a question you may press star, then one on your touchtone phone. To withdraw your question, please press star then one again during the call today we may make forward looking statements within the meaning of the Private Securities Litigation Reform act of 1995. They are based on current assumptions and opinions concerning a variety of known and unknown risks. Actual results may differ materially from those contained in or suggested by such forward looking statements. Additional information about factors that could cause actual results to differ materially from those projected in the forward looking statements is included in the press release for our first quarter 2026 results as well as our most recent annual report on Form 10-K and quarterly report on Form 10-Q, including under the captions, safe harbor and cautionary statements and risk factors. We may also discuss certain non GAAP financial measures during the call today. You may find the most directly comparable GAAP measures and a reconciliation to GAAP for these measures in the press release for our first quarter 2026 results or in our most recent Form 10-Q. The press release for our first quarter 2026 results as well as our Form 10-K and Form 10-Q can be found on our website at www.markelgroup.com in the Investor Relations section. Please note this event is being recorded. I would now like to turn the conference over to Tom Gaynor, Chief Executive Officer. Please go ahead.

Tom Gaynor (Chief Executive Officer)

Thank you so much. Good morning, Billy, and good morning to all. Alright, this is indeed Tom Gaynor and I’m joined this morning by my teammates, Brian Costanzo, our Chief Financial Officer, and Simon Wilson, the CEO of our insurance operations and Executive Vice President of the Markel Group Group. Andrew Crowley, the President of Markel Group Ventures and Executive Vice President of the Markel Group Group, is also with us and available for questions. Thank you all for joining us today. Our headline is that we continue to do more of what’s working and less of what’s not. I’m deeply grateful to my colleagues who continue to adapt and improve our operations throughout Markel Group Group. We all look forward to sharing our progress with you this morning. We’re also delighted to take your thoughtful questions and for your ongoing interest in Markel Group. First, I’ll make a few opening comments, then Brian will run through the financial results. Following Brian’s comments will turn the bulk of the call over to Simon who will address our ongoing actions in our insurance operations and our progress to date. Insurance is our largest business and the one where the most change continues to be underway. As such, it’s appropriate to focus and allocate the most time there. Following Simon’s comments, we will open the floor for questions. Continuing to do more of what works and constantly learning and iterating it’s not a new idea at Markel Group. It’s been a hallmark of the company for nearly 100 years. As we state in our cultural statement that we call the Markel Group style. We look for a better way to do things. That means being creative, adapting to changes in technology, up to and including those being brought about by the development of AI and every other form of change and progress underway. Internally, we control what we can control. We’ve taken extensive steps to focus on serving our customers, improve efficiency, develop new products and services, expand our geographical reach by opening and developing new markets and continuously improving and refining our operations in every nook and cranny throughout the company. I’m beyond grateful to my teammates for their unrelenting actions to continuously learn and improve our financial results show that our actions are working. Brian will give you details and explain some of the nuances from one off events and business mix changes from last year. But net net we’re confident that we are making progress and that it is showing up in our results externally. Outside our four walls we continue to see cyclical pressures and softness in some end markets. For example, property related insurance coverages and certain industrial end markets like transportation equipment and residential construction continue to show normal signs of cyclicality. Longer term, those markets provide ample opportunity for good returns on our capital and continued growth. But they do not do so in straight upward line curves are involved both up and down and that is normal. In aggregate, our businesses continue to produce healthy amounts of adjusted operating income, cash and long term growth. Your company contains diverse, resilient, high quality businesses designed to produce all weather returns and cash flows. That is the design of the Markel Group Group. With these cash flows we enjoy a 360 degree set of reinvestment opportunities to put that cash to work. We continue to deploy that cash with patience and discipline. Each incremental dollar goes to the highest and best use available. Sometimes that means funding incremental growth in one of our existing businesses. Sometimes that means adding to our investment portfolio publicly traded securities. Sometimes that means acquiring new businesses and sometimes that means repurchasing our own shares. Sometimes that also means building up our liquidity and optionality for future opportunities Something we’ve been emphasizing of late. We maintain a strong balance sheet. We believe balance sheet strength will provide timely and unique advantages to grow and long term stability to our operations. As we observe the broader investment landscape and participate in conversations, we are observing more data points about global conflict, supply chain disruptions, low consumer sentiment and softening job markets. Despite those factors, the animal spirits in the financial market seems largely unfazed. As such, the number of external opportunities that appear attractive to us remain limited. Fortunately, as we’ve demonstrated over the last several years, we can and are continuing to repurchase our own shares. In 2023, we repurchased 445 million of our own stock. In 2024, we made 573 million of repurchases. In 2025, we did $430 million in share repurchases, as well as redeeming $600 million of preferred stock. We’ve done that largely with cash from operations and not by levering the balance sheet. So far in 2026, we’ve repurchased 134 million of our own shares and we remain highly attentive to opportunities to continue to do so. At this point, we’ve reduced our share count by roughly 10% from the peak of nearly $14 million. It’s taken slightly more than five years for that 10% reduction to occur. At current prices, I would expect it to take us less than 5 years to purchase the next 10% of the share count. The math suggests that repurchasing our own shares makes sense as our number one on the list of capital allocation choices right now. We remain disciplined and methodical as we do so. That should help us to persist through thick and thin. And we think that that consistent behavior will serve our owners well. We also continue to have a balance sheet which keeps us in good shape to pursue opportunities when it makes sense to do so. We enjoy a strong degree of optionality. We maintain the flexibility and ability to play offense in a wide variety of environments, not just the one we see today. While we are reporting our quarterly results to Youth Day, we manage this business with a longer time frame. Looking out over the next five years, I think it’s reasonable to expect that our insurance operations will grow and earn healthy returns on equity. I expect the same from our industrial, consumer and financial operations. I expect our public equity portfolio to compound at healthy rates and for our fixed income operations to provide appropriate interest income while protecting and preserving our capital. All of our businesses will face natural ups and downs, but I am confident in the direction of travel. Those increasing amounts of earnings and cash flows should end up being divided by fewer share. We think that you as our fellow owners will be well rewarded with those results. In our equity operations, we continue to invest with discipline and patience, keeping with a long standing four part investment discipline. We invest in profitable businesses, good returns on capital and not too much debt run by people with equal measures of talent and integrity, with reinvestment opportunities and capital discipline at fair prices. There are no changes to that process in fixed income markets. Interest rates increased during the quarter. The good news is that we remain matched in currency and duration to our insurance liabilities and largely hold our fixed income securities to maturity. The other good news is that amidst rising concerns about credit quality, our portfolio remains as high quality and pristine as we know how to make it. There were no credit losses in our fixed income portfolio in the quarter and I do not expect any going forward. Our public equity portfolio declined 5.2% in the first quarter compared to a 4.4% decline in the S&P 500amid broader market volatility. Our approach is designed to withstand equity market volatility. We believe our public equities portfolio will continue to produce strong returns for our shareholders over the long term. In many ways, we’ve gone through a healthy amount of change in recent years at Markel. At our core, though we remain unchanged in the enduring things that matter, we remain dedicated to relentlessly compounding your capital. Our specialization and diversification, which we talked about in our very first annual report as a public company in 1986, remains just as relevant today as it was then and as time has shown, it works. I believe that will continue to be the case. Our values build value. With that, I’ll turn it over to Brian.

Brian Costanzo (Chief Financial Officer)

Thank you, Tom, and good morning everyone. Before reviewing our first quarter results, I want to briefly remind listeners of the reporting and disclosure enhancements we implemented beginning in the third quarter of 2025. These changes were designed to improve transparency and better align our reporting with how we manage the business. We now present operating revenues and adjusted operating income as key performance metrics, both of which exclude unrealized investment gains and losses as well as amortization expenses. We also now report our results across four operating segments, Markel Insurance, Industrial, Financial and Consumer and Other, while providing a divisional view of our insurance businesses, organic growth for our industrial, financial and consumer businesses, and annually providing capital metrics for all segments. With that, let’s turn to the results. Starting off with Markel Group consolidated results for the first quarter of 2026. Operating revenues, which exclude net investment gains, were 3.6 billion or flat when compared to Q1 20. Operating income, which includes unrealized gains and losses, was a loss of 273 million compared to income of 283 million in Q1 2025. Net investment losses were 728 million compared to net investment losses of 149 million in the first quarter of 2025. Adjusted operating income, which excludes net investment gains and amortization expenses totaled 498 million, a 4% increase versus the first quarter of 2025 driven primarily by improved underwriting performance in Markel Insurance offset by the non recurrence of a gain from our investment in velocity in the financial statement in the first quarter of 2025 and to a lesser extent lower margins in the industrial segment. Operating cash flow for the quarter was 16 million versus 376 million in Q1 2025. Operating cash flows for the quarter were net of payments totaling 108 million made to reinsure our exposures on our Hagerty business as part of the transition of that business to full fronting and also reflect lower premium collections resulting from the runoff of our global reinsurance business along with higher payments for income taxes. Comprehensive loss to shareholders was $340 million versus comprehensive income of 348 million in Q1 2025, driven largely by unrealized movements in our investment portfolio moving to Markel Insurance. Adjusted operating income for Markel Insurance in the first quarter 2026 was 369 million compared to 282 million in the first quarter 2025. Markel Insurance underwriting gross written premiums were 2.2 billion, a decrease of 21% for the for the quarter versus the first quarter 2025. This was driven by the expected impact from our exit of global REIT and the transition of our Hagerty program to a fronting model which together totaled 797 million in underwriting premiums in the first quarter of last year compared to just 23 million this year. As I mentioned on last quarter’s call, the exit of our $1 billion gross written premium global reinsurance business and the transition effective 1-1-2026 of our partnership with Hagerty to a pure fronting model will decrease underwriting gross written premiums for the full year 2026 by approximately $2 billion. A significant portion of the global reinsurance premiums were written in the first quarter of last year. We expect these changes over the long term to benefit our combined ratio adjusted operating income and our returns on equity adjusted underwriting. Gross written premiums which excludes the impact of the exit of Global RE and the Hagerty transition grew by 10% in the first quarter versus Q1 2025. This increase was driven by our International Division division within our Professional Liability and Marine and Energy products and our Programs & Solutions division driven by growth in personal lines and programs partially offset by a decrease in premium volume in our wholesale and specialty division due to declines in property driven by a softening rate environment and in general liability due to our continued underwriting actions and remixing of the casualty portfolio. Earned premium decreased 2% to just under 2 billion in the first quarter of 2026. The combined ratio for Markel Insurance was 93% compared to 96% in Q1 2025. The improvement in the combined ratio was driven by improvements in our current accident year loss ratio. First, we had lower catastrophe losses this year with 35 million or 2 points of losses from the Middle east conflict this year versus 66 million or 3 points of losses from the California wildfires in the first quarter of 2025. Second, we had a 4 point improvement in our attritional loss ratio driven by no losses on our CPI product line this year, a lower loss ratio within our International Division division and our US Property and general liability lines and the exit last year of our risk managed D and O book within our wholesale and specialty division. The Global REIT division reported a combined ratio in the first quarter of 114%. As we continue to build margins and solidify reserves. The results from the runoff of our Global Reinsurance division unfavorably impacted the insurance Segment’s combined ratio by 2 points. Prior year releases were 5 points in the current quarter versus 7 points in the first quarter of last year, down slightly due to lower takedowns this quarter within our international professional liability lines. At a divisional level within Markel Insurance starting with international gross written premium of 861 million was was up 28% versus Q1 2025. We grew across the international division driven by strong growth in professional liability. Cyber combined ratio of 90% compares to 89% in the first quarter of 2025 with the first quarter this year including 6 points of losses from the Middle east conflict and the first quarter of last year including six points of losses from the California Wildfires within our wholesale and specialty division. Gross written premium of 673 million declined 9% versus Q1 2025 driven by a softer property and marine premium rate environment and decreases in binding contractors and casualty combined ratio improved to 93% in Q1 26 versus 100% in Q1 2025 with the largest impact coming from lower loss ratios due to our underwriting actions and the exit of the risk managed DNO book last year. Within our Programs & Solutions division Gross written premium was 656 million in Q1 2026 versus 806 million in Q1 2025. The 19% reduction was driven by the previously announced shift of our Hagerty program to a full fronting arrangement which reduced gross written premium by 220 million. Excluding this impact, the Programs & Solutions division gross written premium was up 12% driven by personalized property programs and growth in our Bermuda platform. Our programs and solution combined ratio improved to 91% compared to 97% in Q1 2025 due to improved loss ratios, primarily due to three points of impact from the California wildfires in the first quarter of last year and more favorable development on prior year loss reserves. Moving now to the consolidated investment portfolio, net Investment income for Q1 2025 totaled 256 million, up 8% from Q1 of last year. This reflects higher interest income on fixed maturity securities and higher dividend income on equity securities due to higher yields and higher average holdings in 2026 compared to 2025. These increases were partially offset by lower interest income on cash and cash equivalents driven by lower average cash and cash equivalent holdings and lower short term interest rates in 2026 compared to 2025. Fixed income portfolio yield during the quarter was 3.7% and reinvestment yields averaged 4.1%. Within the public equity portfolio, losses totaled 728 million versus 149 million last year. We made net purchases of 28 million during the quarter. The portfolio ended the quarter with a market value of 12.3 billion and and pre tax unrealized gains of 8.2 billion. Moving to the industrial segment, industrial segment revenues for the quarter …

Full story available on Benzinga.com

This post was originally published here

Ashland (NYSE:ASH) held its second-quarter earnings conference call on Wednesday. Below is the complete transcript from the call.

This content is powered by Benzinga APIs. For comprehensive financial data and transcripts, visit https://www.benzinga.com/apis/.

The full earnings call is available at https://edge.media-server.com/mmc/p/oe5gsqsh/

Summary

Ashland reported second quarter sales of $482 million, a 1% year-over-year increase, with adjusted EBITDA at $98 million, down 9% due to operational disruptions.

Life Sciences segment saw steady demand driven by pharma, while Personal Care experienced strong volume growth in biofunctional actives and microbial protection.

The company updated its fiscal 2026 guidance to reflect sales between $1.835 to $1.87 billion and adjusted EBITDA of $385 to $400 million, citing geopolitical impacts and productivity challenges at Hopewell as key factors.

Operational highlights included completion of Calvert City repairs, ongoing manufacturing optimizations, and strong innovation momentum with new product introductions.

Management emphasized resilience in consumer-focused demand, execution of strategic pricing actions, and continued focus on operational reliability and cost management.

Full Transcript

OPERATOR

Good day and thank you for standing by. Welcome to Ashland’s second quarter 2026 earnings call. At this time, all participants are in a listen only mode. After the speaker’s presentation, there will be a question and answer session. To ask a question during the session, you will need to press star 11 on your telephone. You will then hear an automated message advising that your hand is raised to withdraw your question. Please press star. Please be advised that today’s conference is being recorded. I would now like to hand the conference over to your first speaker today, Sandy Klugman, Director of Investor Relations. Please go ahead.

Sandy Klugman (Director of Investor Relations)

Thank you. Hello everyone and welcome to Ashland’s second quarter fiscal 2026 earnings conference call and webcast. My name is Sandy Klugman and I am Ashland’s Director of Investor Relations. Joining me on the call today are Guillermo Novo Chair and CEO William Whitaker, CFO, as well as our business unit leaders, Alessandra Fascini, Life Sciences and Intermediates Jim Minicucci, Personal Care and Dago Caceres, Specialty Additives. Please note that we will be referencing slides during today’s call. We encourage you to follow along with webcast materials available at ashland.com under Investor Relations, please turn to Slide 2. As a reminder, today’s presentation contains forward looking statements regarding our fiscal 2026 outlook and other matters as detailed on Slide 2 and in our Form 10-Q. These statements are subject to risks and uncertainties that could cause future results to differ materially from today’s projections. We believe any such statements are based on reasonable assumptions, but there is no assurance these expectations will be achieved. We will also reference certain adjusted financial metrics, both actual and projected, which are non-GAAP measures. We present these adjusted figures to provide additional insight into our ongoing business performance. GAAP reconciliations are available on our website and in the appendix of these slides. I’ll now hand the call over to Guillermo for his opening remarks.

Guillermo Novo (Chair and CEO)

Thanks Sandy and welcome to everyone joining us. I’ll start with a brief overview of our second quarter performance. Then William will review the financials and outlook followed by a deeper business unit detail with the team. Please turn to slide 5. Overall second quarter results reflect resilient underlying commercial performance amid stable demand conditions with pricing and portfolio mix action remaining a central focus across the organization. Life Sciences delivered steady results supported by resilient pharma demand. Injectables, tablet coatings and high purity excipients continue to drive growth, marking a fourth consecutive quarter of volume gains. Progress across our innovate and globalized pillars remains strong with continued adoption of differentiated new product introductions. Personal care generated broad based portfolio growth driven by strong volume gains and execution across bio-functional actives, care ingredients and microbial protection. Biofunctional actives delivered robust double digit year over year growth while microbial protection continued to gain share following our globalized investments. Specialty additives operated in a mixed market environment. Coatings volumes grew year over year reflecting share gains and new product traction while construction sales remained lower reflecting deliberate portfolio mix actions and slightly softer demand. Overall results returned to flat year over year which is an important step forward given that we have not yet fully lapped our prior year. China impact, Intermediates operated in a stable but trough level environment with results impacted by both commercial and operating effects of the Calvert City outage. The team will cover more later, but operational performance was impacted by specific issues during the quarter, all of which are internal and not reflective of underlying demand trends. Despite these headwinds, commercial execution across much of the portfolio was solid and we continue to see encouraging demand trends in Q3. Please turn to Slide 6. Now I’ll walk through our second quarter results which reflect disciplined execution across the portfolio in a mixed market environment. Teams remain focused on cost control, operating discipline and customer service while managing through operational headwinds during the quarter. Structural actions taken over the past several years continue to support the underlying economics of the business even as near term performance was pressured by temporary execution challenges. Working capital was a key strength in the quarter, driving strong operating cash flow and reinforcing our focus on cash discipline. Looking across the portfolio, the quarter demonstrated resilient underlying performance and continued progress in strengthening the business foundation with demand conditions generally stable across the portfolio and margin pressures primarily driven by specific operational issues rather than end market weakness. Please turn to Slide 7. First, our consumer focused businesses, principally life science and personal care, continue to provide stability supported by resilient end market demand. Second, innovation and globalization initiatives are gaining traction with accelerating momentum in higher value applications across the portfolio. Innovation has already exceeded our full year target after two quarters reflecting the strong pipeline execution and commercialization. Third, structural actions taken in prior periods are now embedded across the business, enhancing margin durability and positioning the portfolio to benefit as operating conditions normalize. Teams remain focused on disciplined execution and targeted corrective actions. Before turning the call over to William, I want to emphasize three themes for this resilient consumer focused demand, accelerating innovation and globalization momentum and continued commitment on improving execution. I’d like to now turn the call over to William to provide more detailed review of of our second quarter financial performance. William, thank you Guillermel. Please turn to Slide 9.

William Whitaker (Chief Financial Officer)

Second quarter sales were 482 million up 1% year over year, reflecting resilient demand conditions across much of the portfolio. Volumes were relatively stable overall, with growth in personal care offsetting softness in intermediates, while Life Sciences delivered steady performance. Pricing declined modestly year over year, primarily reflecting carryover impacts from prior period pricing actions supporting targeted share gain activity generally across the segments. Foreign exchange was a meaningful tailwind contributing approximately 16 million or 3% to reported sales. Adjusted EBITDA was 98 million, down 9% year over year, reflecting approximately 10 million of previously disclosed temporary impacts including the Calvert City startup delay and weather related operational disruptions during the quarter. Excluding these discrete items, underlying performance reflected softer pricing offset by disciplined cost control and Foreign Exchange benefits consistent with the resilience we are seeing across the portfolio. As previously discussed, Calvert City impacted results in the second quarter. Repairs are now complete and the facility is back online. Adjusted EBITDA margin was approximately 20%, down 220 basis points year over year, largely reflecting these temporary operational disruptions. Adjusted EPS excluding intangible amortization was $0.91 down 8% year over year, consistent with the EBITDA decline. Cash generation and conversion was notable strengths in the quarter. Cash flow provided by operating activities totaled 50 million, up from 9 million in the prior year driven by disciplined working capital management including meaningful inventory reductions. Ongoing free cash flow was 29 million, representing solid conversion driven by working capital improvements and reduced capital expenditures. We ended the quarter with total available liquidity of approximately 939 million and net debt just over a billion, resulting in net leverage of roughly 2.7 times. The balance sheet remains strong, providing flexibility to support operations, invest in strategic priorities and maintain disciplined capital allocation. With that, I’ll turn the call over to our business unit leaders for a closer look at segment performance. Alessandra, over to you for Life Sciences.

Alessandra Fascini

Thank you, William. Good morning everyone. Please turn to slide 10 for Life Sciences. Life Sciences sales were $172 million flat year over year. Results reflected resilient pharmaceutical demand partially offset by softness in select non pharma end markets and modest pricing pressure. Pharma delivered low single digit growth for a fourth consecutive quarter supported by strength across differentiated cellulose excipients, injectables and tablet coatings. Outside of Pharma, nutrition and other non pharma markets remained softer reflecting customer order timing rather than underlining market deterioration. Pricing declined modestly year over year, largely reflecting carryover impacts from prior period actions while remaining stable sequentially. Foreign exchange contributed approximately $6 million to sales during the quarter. Looking at our globalized initiatives, Injectables continued delivering quarter over quarter growth with a record second quarter results. Positive lead indicators on sales pipeline, new product uptake and new orders signal continued growth momentum in this high margin segment. Tim Coates continued its double digit growth trajectory with versus prior year fueling capacity release initiatives. Turning to innovation growth was supported by expanding adoption of low-nitrite oral solid dosage excipients and high purity injectable and bioprocessing products. New product success in this segment reinforced Ashland’s differentiation in regulated high value markets fully aligned with our growth strategy. Looking ahead, we have positioned the second half of the year for multiple new product launches across oral Solidose, Injectables and Crop care, supporting sustained growth and portfolio renewal. These initiatives continue to reinforce portfolio differentiation and long term growth opportunities. Turning to profitability, Adjusted EBITDA was $50 million down 11% year over year. Adjusted EBITDA margin was 29% reflecting the combined impact of modestly lower pricing and higher costs including approximately $5 million of weather related disruption and Calvert City startup delays during the quarter. These headwinds were partially offset by favorable mix, disciplined execution and foreign exchange which contributed approximately $3 million to EBITDA. Importantly, underlying pharma demand remains resilient and recently announced pricing actions are now being implemented across the portfolio. Life Sciences continues to benefit from durable end market fundamentals, strong customer engagement and sustained momentum across our innovate and globalized pillars. Please turn to Slide 11 for intermediates. Intermediates operated in a challenging but stable trough market environment consistent with expectations entering fiscal year 2026, demand conditions remained stable with sales and pricing at trough levels across the BDO value chain. Sales worth $35 million down 5% year over year reflecting continued pressure across the BDO value chain and commercial and operating impacts related to the Culvert City outage. Merchant sales were $26 million compared to $27 million last year as relatively steady volumes were partially offset by modest pricing pressure and disciplined commercial actions including controlled merchant activity. Captive BDO sales were down approximately $1 million year over year, primarily reflecting the covered Citi impacts during the quarter. Foreign exchange provided a modest $1 million benefit to sales in the quarter. Turning to profitability, adjusted EBITDA was $5 million up from $2 million in the prior year quarter. The improvement reflected disciplined cost management and favorable manufacturing input and actions which more than offset covered city related impacts and ongoing pressure across the BDO value chain. Now I will turn the call over to Jim to discuss Personal Care.

Jim Minicucci (Leader of Personal Care)

Thank you Alessandra. I’ll now highlight our personal care results. Please turn to Slide 12 for Personal Care. Personal Care delivered resilient results supported by broad based demand and strong execution across the portfolio. Sales were $150 million up 3% year over year or 4% on a comparable basis. Driven by growth across all three business lines. Biofunctional Actives delivered another quarter of double digit growth supported by continued adoption of colopepto and customer expansions across Europe and North America. Microbial Protection delivered robust growth across the portfolio and and geographies driven by new customer wins and continued share expansion within Care Ingredients. The portfolio remained resilient with strong growth across hair and skin care categories, particularly in Asia Pacific and Latin America. Previously reported customer specific outages from the prior quarter have now returned to more normalized levels. Foreign Exchange contributed approximately $5 million to sales during the quarter. Turning to innovation, Bio-functional Actives recently launched Etranite, our 2026 flagship ingredient. Etranite targets key skin longevity markers and was recognized with an industry award at the IN Cosmetics Global event earlier this month. Care Ingredients launched a new hair care conditioning polymer from our GWAR technology which is already gaining customer adoption. Overall, Personal Care continues to benefit from strong momentum across our globalize and Innovate platforms, reinforcing growth in consumer focused applications. Turning to profitability, adjusted EBITDA was $43 million compared to $44 million in the prior year quarter. The slight decline was driven by operational outages from weather related events which were predominantly offset by volume growth and mix. Adjusted EBITDA margin was approximately 29% demonstrating the strength of the portfolio and benefit of ongoing commercial and productivity efforts. Foreign Exchange contributed approximately $2 million to EBITDA. In summary, personal Care delivered robust sales growth across all three business lines demonstrating strong margin resilience, disciplined execution and meaningful progress across its Innovate and globalized initiatives. With that, I’ll turn the call over

Dago Caceres (Leader of Specialty Additives)

to Dago to review the results of Specialty Additives. Thank you Jim. Please turn to Slide 13 Specialty additives operated in a mixed demand environment during the second quarter with performance varying by end market and region. Overall results reflected disciplined commercial execution with targeted pricing actions supporting share gains and specific operational headwinds. Sales were 134 million flat year over year as volume growth for the second consecutive quarter was largely offset by softer pricing and the lapping of a difficult prior year comparison. Following share losses in China. Breaking down the segments, architectural coatings returned to year over year growth supported by share gains and new product traction. Volume trends improved relative to prior quarters as commercial initiatives gained momentum while underlying demand remains generally flat with continued regional variability. Construction volumes were lower reflecting deliberate portfolio mix management actions associated with network optimization and relative muted end market demand. Other end markets were mixed with volumes growth in performance specialties offset by softer energy demand tied to customer specific impacts. In the Middle east, pricing declined modestly year over year reflecting targeted share gain opportunities. Foreign Exchange contributed approximately 4 million to reported sales. Turning to profitability, adjusted EBITDA was 16 million down from 26 million in the prior year. Quarter adjusted EBITDA margin was 11.9% reflecting softer pricing and higher manufacturing related cost including approximately 2 million from weather related disruptions, a discrete bad debt reserve related to a Middle east energy customer as well as productivity challenges associated with the hubwell scale up. Notably regarding the HEC scale-up, product quality and customer service levels have been maintained and achieving profitable scale remains a key operational focus. While near term performance has been impacted, these actions are expected to enhance long term reliability and cost efficiency across our cellulosic network. All other sites continue to operate reliably and our global network supported uninterrupted customer supply. Overall, the focus remains on targeted actions to improve operational performance, strengthen cost control and and advanced differentiation across the applications, positioning the business to benefit as market conditions normalize. With that, I’ll turn the call back to William.

William Whitaker (Chief Financial Officer)

Thanks Dago. Please turn to slide 15. Given recent geopolitical developments in the Middle East, I want to briefly highlight how Ashland is positioned in this environment, starting with exposure. Ashland’s direct exposure is limited and manageable. The Middle east and North Africa represent approximately 5% of total sales, largely concentrated in Turkey and Egypt, and we have no manufacturing footprint in the region which significantly reduces operational risk. From a cost perspective, Ashland is structurally advantaged.. We are less reliant on petrochemical and energy intensive feedstocks across our portfolio. Energy intensive inputs represent roughly 15% of sales with the majority source from North America supporting lower cost volatility and more resilient margins as energy prices fluctuate. The team is advancing pricing actions to address cost escalation and given the additives represent a relatively small share of our customers overall cost structure. We expect to be able to recover these increases from a demand standpoint. Visibility remains solid supported by a strong order book and a portfolio concentrated in resilient consumer facing end markets including pharma and personal care. Finally, based on prior dislocations, we expect security of supply to become increasingly important to our customers Ongoing geopolitical disruptions, anti dumping actions and reassessments of single region sourcings are reinforcing the value of reliable, diversified supply chains, positioning Ashland as a preferred partner for critical applications. Taken together while the environment remains dynamic, Ashland’s limited exposure, advantaged cost structure, resilient demand profile and supply chain reliability position us well to manage volatility. Please turn to Slide 16. I’d like to spend a few minutes on our execution agenda with a specific focus on manufacturing, including the challenges we encountered at Hopewell, our progress across the broader commitment and how this ties to our longer term cost savings targets. Starting with Hopewell, our HCC scale-up has progressed more slowly than planned which impacted second quarter performance. As Dago mentioned, our product quality and customer service have been maintained. However, productivity yield and cost performance did not ramp as expected. These challenges are execution related and internal and we have taken targeted actions to address them including tightening operating discipline, increasing leadership focus on the site and advancing specific technical workstreams. While productivity has been below expectations, results have stabilized and we are seeing sequential improvement. We continue to take targeted actions, though the financial benefits will take time to flow through the results. Importantly, the issues at Hopewell do not change the strategic rationale for the consolidation. The site remains critical to simplifying the network and lowering the structural cost base of our cellulosex platform. Outside of Hopewell, manufacturing optimization efforts continue to progress in line with expectations. VPND and small plant consolidation initiatives remain on track. with benefits weighted towards the second half of fiscal 2026. As a result of timing delays at HopeWell, our fiscal 2026 manufacturing optimization benefit has been reduced by approximately 10 to 12 million. That reflects delayed realization, not a reduction in the underlying opportunity. Stepping back, our longer term manufacturing optimization targets remain intact. We continue to expect 50 to 55 million of sustainable annual cost savings with an opportunity to reach approximately 60 million as China volumes recover. Execute remains a core pillar of our strategy focused on simplifying the footprint, improving reliability and strengthening cost competitiveness. While near term execution has been uneven, the actions underway are designed to ensure we deliver the full value of the program over time. I’ll address how this translates into our outlook and expectations for the remainder of fiscal 2026. In a moment, please turn to slide 17. I’d now like to briefly update you on the progress across our Globalize and Innovate platforms. Starting with Globalize, performance has accelerated year over year with incremental contribution increasing approximately 8 million to $11 million fiscal year to date. Globalized businesses delivered double digit year over year Growth in the quarter and incremental sales are ahead of plan to date, reflecting continued traction from prior investments across our regions. Turning to Innovate, momentum has been even stronger. Innovate has already exceeded its full year target after just two quarters, reflecting accelerated commercialization across the portfolio. Performance has been …

Full story available on Benzinga.com

This post was originally published here

Bank of N.T Butterfield (NYSE:NTB) held its first-quarter earnings conference call on Wednesday. Below is the complete transcript from the call.

This content is powered by Benzinga APIs. For comprehensive financial data and transcripts, visit https://www.benzinga.com/apis/.

Access the full call at https://event.choruscall.com/mediaframe/webcast.html?webcastid=WgcTWjtc

Summary

Bank of N.T Butterfield reported a strong start to 2026 with net income of $62.6 million, core net income of $63.2 million, and a net interest margin of 2.75%.

The company completed the acquisition of Rawlinson Hunter in Guernsey, enhancing its private trust business and increasing assets under administration to $146 billion.

Management highlighted ongoing strategic initiatives in acquisitions, aiming to drive growth in island banking and trust sectors, while maintaining disciplined cost management and capital allocation.

Full Transcript

Bailey (Conference Operator)

Good morning, my name is Bailey and I will be your conference operator today. At this time I would like to welcome everyone to the first quarter 2026 earnings call for the Bank of N.T Butterfield & Son Limited. All participants will be in a listen only mode. Should you need assistance, please signal a conference specialist by pressing the star key, then zero on your telephone keypad. After today’s presentation, there will be an opportunity to ask questions. To ask a question, you may press star then one on your telephone keypad. To withdraw your question, please press star then two. Please note this event is being recorded. I would now like to turn the call over to Noah Fields, Butterfield’s Head of Investor Relations. Please go ahead.

Noah Fields (Head of Investor Relations)

Thank you. Good morning everyone and thank you for joining us. Today we will be reviewing Butterfield’s first quarter 2026 financial results. On the call I am joined by Michael Collins, Butterfield’s Chairman and Chief Executive Officer, Michael Scrum, President and Chief Financial Officer and Jody Feldman, Managing Director of Bermuda. Following their prepared remarks, we will open the call up for a question and answer session. Yesterday afternoon we issued a press Release announcing our first quarter 2026 results. The press release and financial statements, along with a slide presentation that we will refer to during our remarks on this call are available on the Investor Relations section of our website at www.butterfieldgroup.com. before I turn the call over to Michael Collins, I would like to remind everyone that today’s discussion will refer to certain non GAAP measures which we believe are important in evaluating the company’s performance. For a reconciliation of these measures to US GAAP, please refer to the earnings press release and slide presentation. Today’s call and associated materials may also contain certain forward looking statements which are subject to risks, uncertainties and other factors that may cause actual results to differ materially from those contemplated by these statements. Additional information regarding these risks can be found in our SEC filings. I will now turn the call over to Michael Collins.

Michael Collins (Chairman and Chief Executive Officer)

Thank you Noah and thanks to everyone joining the call today. The first quarter of 2026 represents a strong start to the year with solid financial performance and continued execution of our disciplined growth strategy. We were pleased to announce the agreement to acquire Rawlinson Hunter in Guernsey, reinforcing our commitment to build scale in key markets. Demand across our core businesses of banking, wealth management and trust remained robust and reflecting the strength of our client relationships and the resilience of our franchise. Net interest income benefited from lower costs while deposit volumes remained stable across all jurisdictions. At the same time, we improved non interest expenses, demonstrating our ability to manage costs effectively in a low rate, more volatile environment. I am also pleased to report that following our announcement in February, the acquisition of Rawlinson Hunter in Guernsey has now closed. This is a strategically important transaction that enhances the scale and capability of our private trust business in Guernsey and further our position as a leading international provider of trust services with group assets under administration of $146 billion. Looking ahead, acquisitions remain a key driver of our growth. We will continue to pursue high quality opportunities in island banking and trust that align with our strategy and deliver long term value for our stakeholders. Butterfield is a leading offshore bank and wealth manager with strong leading market positions in Bermuda and the Cayman Islands and an expanding retail presence in the Channel Islands. Across markets we deliver a broad range of services including trust, private banking, asset management and custody which are designed around the needs of our clients. We also support international private trust clients in the Bahamas, Switzerland and Singapore and originate high net worth residential mortgages for prime London properties through our London office. I will now turn to the first quarter highlights on page 5. Butterfield reported net income of $62.6 million and core net income of $63.2 million. We reported core earnings per share of $1.55 with a core return on average common equity of 24.1% in the first quarter. The net interest margin was 2.75% in the first quarter, an increase of 6 basis points from the prior quarter. With the cost of deposits falling 13 basis points to 124 basis points from the prior quarter. We again are announcing a quarterly cash dividend of $0.50 per share during the first quarter. We continued to repurchase shares with a total of 800,000 shares at a cost of $42.4 million. We continue our active capital management and plan to continue to return excess capital that we do not require to support the business and growth initiatives. I will now turn the call over to Jody for an update on Bermuda and Cayman markets and businesses.

Jody Feldman (Managing Director of Bermuda)

Thank you Michael Starting with Bermuda, the economic outlook remains constructive, underpinned by steady growth and a thriving international business sector anchored by reinsurance. Real GDP growth is estimated at 3% for 2025, reflecting continued economic momentum. Bermuda’s fiscal position has improved markedly, with the government projecting a record surplus of 472 million for the 2027 fiscal year, largely driven by revenues from the new corporate income tax. While economic growth is positive, Bermuda continues to navigate structural challenges including a high cost of living and doing business, an aging population and limited availability of affordable housing. These factors remain important considerations as the island Plans for sustainable long Term growth the hospitality sector is benefiting from renewed investment with $182 million of capital spent. Plan for infrastructure and tourism revitalization the partial reopening of the Fairmont Southampton in late 2026 followed by a full reopening in 2027 is expected to bring hotel room inventory above pre pandemic levels. We are also encouraged by plans for the redevelopment of Elbow Beach Resort, which is expected to commence later this year. Finally, Bermuda continues to reinforce its global profile as a premier destination for international sporting events including the PGA Tour Butterfield Bermuda Championship, the Newport to Bermuda Sailing Race and Sail GP Events not only support tourism and international visibility, but also reinforce Bermuda’s position as a high quality jurisdiction for business visitors and residents alike. Now turning to the Cayman Islands, GDP forecasts suggest that growth is expected to moderate in 2026 to around 2% for the year, which is a steadier and more stable pace of development following the past few years a 4 to 6% GDP growth. Unlike Bermuda, Cayman has seen significant population increases which are forecasted to grow to the low 90,000 over the next couple of years. Tourism and financial services continue to grow. January and February saw record stayover arrivals consisting primarily of US Tourists. Financial services in Cayman continue to grow with reinsurance a growing industry and the international fund services business remaining a cornerstone. The Cayman government continues to be fiscally disciplined with 202627 budget expectations of a modest surplus, suggesting Cayman is entering a slower growth phase following rapid expansion. I will now turn the call over to Michael Scrum for more detail on the quarter.

Michael Scrum (President and Chief Financial Officer)

Michael thank you Jody and good morning. On slide six we report summary of net interest income and net interest margin in the first quarter we reported net interest income before provision for credit losses of $93.3 million, an increase of $700,000 from the prior quarter. Net interest margin increased six basis points to 2.75% compared to 2.669% in the prior quarter. This increase is largely due to lower deposit costs and increased investment yields, partially offset by treasury and loan yields as central banks cut market interest rates as well as a lower day count in the first quarter of 2026. We expect for them to be broadly stable with a slight positive bias for the remainder of this year. Average investment volumes increased as assets were deployed into higher yielding available for sale investment securities, helping to increase the average investment yield by six basis points to 2.78%. Average loan balances were stable compared to the prior quarter. Net Loan volumes actually increased during the quarter in Jersey and Cayman. However, the impact of exchange translation from the weakening of the pound sterling against the US Dollar masked this uptick. During the quarter, the bank continued to pursue its conservative strategy of reinvesting the paydowns and investment maturities into a mix of US agency, MBS securities and medium term US treasuries. Slide 7 provides a summary of non interest income which totaled $62.6 million, a decrease of $3.7 million over last quarter. This was due to expected decrease in seasonally higher comparative fourth quarter banking fees. Cost fees were also down due to lower time based and special fees compared to the prior quarter. Exchange fees …

Full story available on Benzinga.com

This post was originally published here

Centene Corporation (NYSE:CNC) on Tuesday posted better-than-expected first-quarter earnings and 2026 outlook.

The company reported a first-quarter 2026 adjusted loss of $3.37, beating the consensus of $2.13 per share, approximately 50 cents better than the company’s expectations. Centene’s sales reached $49.94 billion, exceeding the consensus estimate of $47.53 billion.

In an investor call, the company said, “Medicaid results in the quarter were ahead of our previous projection, outperforming our HBR expectation in the period within that, we experienced a flu season that was lighter than our original forecast and saw a slight utilization benefit from weather events.”

Centene expects fiscal 2026 adjusted earnings of more than $3.40, versus prior guidance of $3 per share, compared to the …

Full story available on Benzinga.com

This post was originally published here

MGP Ingredients (NASDAQ:MGPI) held its first-quarter earnings conference call on Wednesday. Below is the complete transcript from the call.

This transcript is brought to you by Benzinga APIs. For real-time access to our entire catalog, please visit https://www.benzinga.com/apis/ for a consultation.

The full earnings call is available at https://event.choruscall.com/mediaframe/webcast.html?webcastid=ZipI6U1z

Summary

MGP Ingredients reported first-quarter 2026 sales of $106.4 million, a decline from the previous year but aligned with expectations. Adjusted EBITDA was $15 million, and adjusted EPS was $0.15, both surpassing projections despite being lower year-over-year.

The company is focusing on strategic initiatives, including temporary idling of distillation operations in Kentucky to align operations with inventory levels. This move affects 33 employees but is not anticipated to impact product availability.

Future guidance is reaffirmed with expected net sales between $480 million and $500 million for 2026. Adjusted EBITDA is projected between $90 million and $98 million, with efforts to offset reduced gross profit outlook through cost management.

MGP Ingredients is concentrating resources on approximately 10 key brands and has discontinued over 30 tail brands in Q1 2026. The company is also investing in digital marketing and national account expansion.

Despite a challenging industry backdrop, the company is making progress in ingredient solutions, with a 29% increase in sales driven by higher sales volumes and improved operational reliability.

Full Transcript

OPERATOR

Good morning and welcome to MGP Ingredients first quarter 2026 earnings conference call with Julie Francis, President and CEO and Brandon Gaul, CFO. All participants will be in listen only mode. Should you need assistance, please signal a conference specialist by pressing the Star key followed by zero. After today’s presentation, there will be an opportunity to ask questions. To ask a question, you may press Star then one on a touchtone phone. To withdraw your question, please press Star then two. Please also note that this event is being recorded today. In addition, this call may involve certain forward looking statements. The Company’s actual results could differ materially from any forward looking statements due to a number of factors, including the risk factors to described in the Company’s annual and quarterly reports filed with the SEC. The Company assumes no obligation to update any forward looking statements made during the call except as required by law. This call will contain references to certain non GAAP measures which the Company believes are useful in evaluating the Company’s performance. A reconciliation of these measures to the most comparable GAAP measures is included in today’s earnings release which was issued this morning before the markets opened and is available at www.mgpingredients.com.. at this time I would like to turn the call over to Julie Francis, President and CEO of MGP Ingredients.

Julie Francis (President and CEO)

Good morning. I’d like to thank you all for joining us today on our first quarter 2026 earnings call. Let’s kick it off with a review of some of our quarterly results and progress made against our key initiatives and then Brandon can go into the financial metrics during his comments. Sales in the first quarter of 2026 came in at $106.4 million down versus the prior year, but in line with our expectations. Adjusted EBITDA of $15 million and adjusted basic EPS of $0.15 also declined versus the first quarter of last year. However, both of these key metrics were ahead of expectations. We are pleased with this performance as it helps to validate the work we’ve been doing to drive progress in our business while simultaneously navigating a challenging industry backdrop in the first quarter. We continue to focus our energy on the areas we can control and to sharpen our strategic focus and strengthen execution across the organization for brand experience. We maintained momentum in our Premium plus portfolio in the first quarter which was led by Penelope Bourbon and benefited from improved demand for select mid price offerings. We also delivered solid growth in Ingredient Solutions as the improvement the team has made in operational reliability are taking hold and delivering results. While I plan to talk more about our segment performance later. I’d like to share a few recent actions we have taken. As you know, we have been strengthening and revamping our strategy, marketing and supply chain functions in order to add specific capabilities to address new and existing opportunities and to build out best in class processes designed to balance improved commercial planning while driving disciplined execution and long term success. As part of these efforts, we recently announced there will be a temporary idling of our distilling operations in Kentucky at Limestone Branch and Los Angeles Row starting in May. Like many companies across the industry, we are navigating this challenging environment and taking the steps we believe are necessary to better align our operations and inventory. While this temporary idling will unfortunately affect 33 employees, it is not expected to impact the availability of our products or our services to our customers and it is necessary to adjust our production to align with current inventory levels. We would like to remind everyone that our largest facility in Lawrenceburg, Indiana remains fully operational and will continue to operate to serve our brands, clients and customers shifting to our business segments I’ll begin with Branded Spirits which remains the focus as our primary long term growth driver. As expected, first quarter sales were down year over year. However we continue to see constructive progress particularly within the premium plus and mid price tiers. We view these price tiers as critical to the long term health of our portfolio and we are pleased to see they both saw growth in the quarter. Importantly, Gross margin expanded 180 basis points to 47.8% reflecting improved mix and early benefits from our revenue growth management initiatives. Gross profit of $21.1 million was down versus the prior year and primarily driven by an expected decline in sales of private label products. Within our other category, premium plus sales increased 1.5% supported by continued consumer demand for our differentiated high quality offerings and and the increasing effectiveness of our focused growth strategies. Penelope Bourbon once again delivered strong performance with sales up 10% year over year. As you recall, this brand is cycling the highly successful launch of Penelope we did in the first quarter of last year. Even against this comparison, we saw growth driven by sustained and growing momentum in our core SKU Penelope Four Grain along with strong consumer response to limited time releases such as Havana Rye and American Light Whiskey. We are also encouraged by the early traction from our new ready to pour offerings including our Black Walnut and Apple Cinnamon old fashioned products which continue to expand Penelope’s consumption occasions. Turning to Yellowstone Despite a year over year decline for the first quarter we are seeing early signs of stabilization and recovery supported by deliberate investments in innovation and digital capabilities. Our ultra premium limited release Yellowstone Recollection has been exceptionally well received earning strong critical acclaim and press coverage. With consumer demand exceeding our initial expectations, as discussed in our last earnings call, we continue to increase our investment in digital marketing and media capabilities. Yellowstone is the first brand we’ve deployed a fully integrated digital activation strategy combining best in class social media execution with targeted paid media in focus states including select control states in Pennsylvania in California for example. This approach combined with revenue growth management initiatives drove robust double digit growth for Yellowstone in the first quarter versus the prior year. Turning to tequila where our Elmo brand delivered year over year growth driven by continued progress in price pack architecture efforts. This included expanded 1.75 liter offerings and the introduction of three 75 milliliter sizes as consumers increasingly adopt premium tequila across a broader range of occasions and price points. Similarly, exotico tequila was up strong double digits fueled by the addition of a 1 liter offering which is enabling continued gains in on premise distribution alongside price optimization. Additionally, the 375 milliliter size is allowing consumers to trade up from Mixto tequila to high quality 100% agave tequila at an attractive price point in off premise channels for mid and value price Portfolios. Combined sales declined 3% in the first quarter. These are improving trends as we continue to prioritize our strongest performing SKUs and channels. Revenue growth management and price pack channel optimization remain critical levers in these categories and we are encouraged by early results as we execute against this strategy. Looking ahead, we are intentionally concentrating resources behind approximately 10 of our most promising brands with a clear focus focus on purposeful differentiation and innovation to support sustainable long term growth. At the same time, we are managing the portfolio with discipline. As discussed on our prior call, we have initiated comprehensive portfolio review and rationalization. During the first quarter of 2026 we discontinued more than 30 tail brands with approximately 15 additional brands planned to be discontinued by the end of this year. Combined these brands represent approximately 1% of segment net sales and we expect when annualized will represent an estimated 20 basis point of improvement to the segment’s gross margin profile. For our branded spirit segment, we are excited about the opportunities ahead across our broader portfolio. As with all growth trajectories, we will take many steps forward, some bigger and some smaller. We also will likely alternate between some really healthy quarters and some softer ones as we continue to successfully prioritize our best performing offerings and ramp up our investment in these brands while continuing to cycle new product introductions. Turning to distilling solutions where despite the challenging domestic whiskey supply environment, our first quarter results came in as expected. Segment sales of $28 million decreased 40% over a year while gross profit of $8.6 million declined 54%. As elevated inventory levels continued in the first quarter, we maintained our focus on creating a differentiated value proposition to better position MGP as a long term strategic partner for both large and small customers. Our brown goods customers expansion efforts are taking hold as demonstrated by growth of 9% in aged sales and the addition of more than 20 new customers in the first quarter, including a significant national private label whiskey customer. We are proud of the customer expansion progress we are making, particularly given the current industry backdrop. As discussed on our last earnings call, we are also broadening our premium white good offerings and these efforts are focused on complementing our brown goods portfolio. During the quarter, we transacted our first customer sale under this new highly customized initiative. While we are pleased with the progress we are making, given the unique and highly customized nature of these product offerings, these projects will take time to fully commercialize and scale. That said, we now expect growth from this initiative to be picking up in the second half of this year. Our focus on premium white goods is designed to leverage the scale, heritage and quality of our Indiana distillery to produce premium gin and grain neutral spirits which can then be customized to meet each customer specific needs. We expect that this effort will allow us to move beyond commoditized offerings, generate more attractive economics and better asset utilization rates and also serve as a bridge to longer term and deeper relationships with strategic customers. Our efforts are also …

Full story available on Benzinga.com

This post was originally published here

AbbVie (NYSE:ABBV) held its first-quarter earnings conference call on Wednesday. Below is the complete transcript from the call.

This content is powered by Benzinga APIs. For comprehensive financial data and transcripts, visit https://www.benzinga.com/apis/.

View the webcast at https://edge.media-server.com/mmc/p/o3mif4f8/

Watch this earnings call stream on YouTube.

Summary

AbbVie reported a strong start to 2026 with first-quarter earnings exceeding expectations, achieving an adjusted EPS of $2.65 and total net revenues of $15 billion, reflecting a 12.4% sales growth.

The company raised its full-year adjusted EPS guidance to between $14.08 and $14.28 due to robust performance, particularly in Immunology and Neuroscience.

Significant advancements were made in R&D, with promising data from Skyrizi in Crohn’s disease and Rinvoq’s regulatory submissions for Alopecia Areata, alongside strategic transactions expanding the oncology pipeline.

AbbVie announced strategic investments in new manufacturing sites, including a $1.4 billion campus in North Carolina, to support long-term growth in key therapeutic areas.

Management expressed confidence in the company’s competitive position, highlighting sustained growth potential and financial capacity to pursue business development opportunities.

Full Transcript

Operator

Good morning and thank you for standing by. Welcome to the AbbVie first quarter 2026 earnings conference call. All participants will be able to listen only until the question and answer portion of this call. You may ask a question by pressing Star one on your phone. Today’s call is also being recorded. If you have any objections, you may disconnect at this time. I would now like to introduce Ms. Liz Shea, senior Vice President, Investor Relations. Good morning and thanks for joining us. Also on the call with me today are Rob Michael, Chairman and Chief Executive Officer Jeff Stewart, Executive Vice President, Chief Commercial Officer Rupal Thakar, Executive Vice President, Research and Development and Chief Financial Officer and Scott Runtz, Executive Vice President, Chief Financial Officer before we get started, I’ll note that some statements we make today may be considered forward looking statements based on our current expectations. AbbVie cautions that these forward looking statements are subject to risks and uncertainties that may cause our actual results to differ materially from those indicated in our forward looking statements. Additional information about these risks and uncertainties is included in our SEC filings. AbbVie undertakes no obligation to update these forward looking statements except as required by law. On today’s conference call, non GAAP financial measures will be used to help investors understand AbbVie’s business performance. These non GAAP financial measures are reconciled with comparable GAAP financial measures in our earnings release and regulatory filings from today which can be found on our website. Following our prepared remarks, we’ll take your questions. So with that, I’ll turn the call over to Rob.

Rob Michael (Chairman and Chief Executive Officer)

Thank you Liz Good morning everyone and thank you for joining us. AbbVie is off to an excellent start to the year with first quarter results exceeding our expectations across our diverse portfolio, we are delivering top tier growth and continue to strengthen our long term outlook with pipeline advancements and strategic transactions. Turning to our first quarter performance, we achieved adjusted earnings per share of $2.65 which is $0.07 above our guidance midpoint. Total net revenues were $15 billion, beating our expectations by 300 million and reflecting robust sales growth of 12.4%. I’m especially pleased with the momentum in Immunology and Neuroscience which are both delivering share gains in growing markets. Based on this strong performance, we are raising our full year adjusted earnings per share guidance by $0.12 and now expect adjusted EPS between $14.08 and $14.28. Turning now to RD, we are making meaningful progress advancing programs across all stages of development. Recent highlights include the US Regulatory submissions of RINVOQ for Alopecia Areata giving us a potential new source of growth in dermatology and Skyrizi subq induction in Crohn’s, with an approval decision expected later this year. We also saw promising interim data from our Crohn’s platform study combining Skyrizi and our own Alpha 4 Beta 7, which has potential to deliver transformational efficacy in obesity. We announced early stage data for our Amylin analog 295 with very encouraging weight loss results in oncology. We are now expecting the regulatory submission for etentomig by the end of this year, which is earlier than our previous expectations. We also expanded our emerging oncology pipeline by closing the Remigen agreement, giving us a novel PD1VEGF bispecific antibody. We will continue to augment our portfolio with business development to access external innovation and given our strong growth outlook, we have significant financial capacity to pursue both early and late stage opportunities. Lastly, as part of AbbVie’s $100 billion commitment to U.S. r&D and capital investments over the next decade, we recently announced construction of several new manufacturing sites. This includes a $1.4 billion investment to build a full pharmaceutical manufacturing campus in North Carolina and a $380 million investment for two new plants in North Chicago. These strategic investments will strengthen Abby’s ability to produce medical breakthroughs in immunology, neuroscience, oncology and obesity. In summary, the fundamentals of our business are strong and we are well positioned to deliver top tier growth for the long term. With that, I’ll turn the call over to Jeff for additional comments on our commercial highlights.

Jeff Stewart (Executive Vice President, Chief Commercial Officer)

Jeff thank you Rob. I’ll start with the quarterly results for immunology which delivered total revenues of $7.3 billion, reflecting impressive sales growth of a billion dollars. Skyrizi total sales were $4.5 billion, up 29.2% on an operational basis exceeding our expectations. We continue to demonstrate exceptional performance across psoriatic disease where we are gaining share and have clear leadership over all biologics and orals by a very wide margin. The psoriatic market is growing robustly and we feel extremely confident in Skyrizi’s best in class profile, including high endurable efficacy on both skin and joints as well as simple quarterly dosing which collectively gives us a distinct advantage relative to all the existing and emerging therapies in this area and we continue to generate compelling evidence to support Skyrizi as the preferred treatment option for psoriatic disease. At the recent AAD meeting we presented new data highlighting Skyrizi’s strong efficacy in genital and scalp psoriasis which are very difficult to treat, areas often leading to significant social and emotional burden to patients. The FDA has recently approved adding the new study results in these high impact areas to the Skyrizi label. We also now have long term efficacy in radiographic data in psoriatic arthritis demonstrating Skyrizi’s durable efficacy with nearly 90% of patients showing no radiographic progression through five years of treatment. This data will enhance our existing leadership in the important PSA segment where Skyrizi is the frontline inplay patient share leader in both the derm and room segments. Performance also remains very robust in IBD where Skyrizi is on track to deliver more than 30% global sales growth across Crohn’s disease and ulcerative colitis this year. Competitive dynamics within IBD are playing out in line with our expectations with Skyrizi continuing to capture a leading share of total new patient starts in the US in the quarter, including very significant in play leadership in the frontline setting which is the strongest signal of overall physician preference for Skyrizi. I’m also pleased with the compelling results from our recent subcutaneous induction study for Crohn’s with data particularly in the bio naive population that we believe compares very favorably versus the competition and we look forward to providing an additional dosing option for physicians and IBD patients later this year. Turning now to Rinvoq which is also performing above our expectations, Global sales were $2.1 billion, up 20.2% on an operational basis. Demand remains strong across all of Rinvoq’s indications. We are now achieving high teens in play patient share in RA and are seeing a nice inflection in prescriptions across gastro, especially in uc following the recent expanded label supporting access to Rinvoq earlier in the treatment paradigm for IBD patients. We are also planning for the potential near term commercialization of two additional indications, Vitiligo and alopecia areata, which will meaningfully expand Rinvoq’s dermatology label and where we have also recently expanded our field force to support these emerging opportunities. Lastly, in Immunology Humira Global sales were $688 million down 40.3% on an operational basis reflecting biosimilar competition and in line with our expectations moving to neuroscience where we continue to outperform our expectations as well. Total revenues were nearly $2.9 billion, up 24.3% on an operational basis. In Migraine our leading portfolio continues to gain market share with Ubrelvi Qlipta and Botox Therapeutic each delivering robust double digit sales growth. In psychiatry, Vailar Global sales were $905 million, up 18.4%, reflecting strong prescription growth in both bipolar disorder and adjunctive mdd. Vralar has significant leadership with new prescription share roughly double the next closest branded competitor and we expect continued momentum following the introduction of new lower doses allowing prescribing flexibility as well as pediatric usage. Moving to Parkinson’s disease, we continue to see encouraging uptake for Vilev, which is on track to achieve blockbuster revenue this year. Total sales were $201 million, up approximately 10% on a sequential basis. We are also preparing for the potential approval and launch of Tavapadone in the US later this year, an exciting new oral treatment for patients with Parkinson’s and a very complementary addition to our growing Parkinson’s portfolio. With Vilev and Duodopa, Tavapadone has demonstrated strong efficacy as both a monotherapy as well as an add on to the standard of care and we believe it will be a sizable commercial opportunity. Moving now to Oncology where total revenues were more than $1.6 billion, down 3% on an operational basis. Venclexta continues to perform very well, especially in CLL as combination use with BTK inhibitors are emerging as a preferred fixed treatment duration globally. We’ve recently received full approvals in the US and the UK as well as positive CHMP opinion for venclexta’s use with BTKs for that fixed treatment course. Total Venclexta sales were $770 million, up 9.7% on an operational basis. Continued sales growth from Elihir, Epkinley and Amrellis also helped to partially offset the expected sales decline for Imbruvica which was down 24.7% due to IRA pricing and competitive share pressure. Turning now to Esthetics which delivered global sales of nearly $1.2 billion, up 5.1% on an operational basis. Botox Cosmetic total revenues were $668 million, up 17% reflecting a favorable price comparison in the US as well as modest market growth globally. Juvederm Global sales were $232 million, down 2.9% reflecting continued headwinds in key dermal filler markets. While economic headwinds have continued to impact market conditions globally, the long term prospects for the category remain attractive given high consumer interest and low penetration rates. As the industry leader, we are investing in promotion and innovation to support patient activation. I’m particularly excited about the potential for Trenabot E our fast acting short duration toxin which once approved we expect will be market expanding and complements our toxin portfolio very nicely. While Trinibat E is delayed in the U.S. we continue to anticipate approval and launches this year in key international markets including Europe, Canada and Japan. So overall I’m extremely pleased with the execution and continued strong performance across our commercial portfolio. And with that I’ll turn the call over to Rupal for comments on our R and D highlights.

Rupal Thakar (Executive Vice President, Research and Development and Chief Financial Officer)

Rupal thank you Jeff. We continue to make good progress across our pipeline. I’ll start with dermatology programs in Immunology As Jeff just mentioned, new data was presented at the recent AAD meeting highlighting Skyrizi’s strong efficacy in genital and scalp psoriasis and long term efficacy including radiographic data in psoriatic arthritis. These recent presentations add to the growing body of evidence supporting Skyrizi’s best in class profile in psoriatic diseases. Its strong durable efficacy on both skin and joint measures, favorable safety and tolerability profile and convenient quarterly maintenance dosing give us confidence that Skyrizi will continue to be the preferred first line treatment option for patients with psoriatic disease. Additionally, discussions are ongoing with the FDA regarding revised label language related to tuberculosis evaluation for Skyrizi. While TB monitoring has become fairly routine prior to initiating treatment with biologics, updated language would allow healthcare providers to use their clinical judgment. Moving to Rinvoq, the regulatory application for Alopecia areata was recently submitted to the FDA Approval decisions are anticipated later this year in Europe and Japan and in early 2027 in the US in hydradenitis supertiva. Phase 3 studies for both Rinvoq and Lutekizumab are progressing well and remain on track for 16 week top line results in the second half of this year. Turning to gastroenterology, all co primary and key secondary endpoints were met in the phase 3 affirmed study with Skyrizi subcutaneous induction in Crohn’s disease demonstrating very high levels of endoscopic response and clinical remission. While not a direct head to head comparison when matching these data against results from the Skyrizi IV induction program, the sub Q induction achieved numerically higher results across key endpoints. We are extremely pleased with the strong performance demonstrated by subcutaneous induction, especially considering that this study enrolled a very difficult to treat patient population. Two thirds of the patients received prior advanced therapy with half failing two or more therapies and a third failing Ustekinumab or a JAK inhibitor. Data in those who had not previously experienced advanced therapy were particularly noteworthy where 61% of Skyrizi patients achieved endoscopic response and 73% achieved clinical remission at week 12. This is 45 points higher than placebo on both measures. These are very impressive results which will continue to support first line use. These data reinforce Skyrizi’s Best in Class profile and provide an additional induction dosing option for patients with Crohn’s disease. Our U.S. regulatory application was recently submitted with an approval decision anticipated later this year. Sub Q induction for ulcerative colitis is also being assessed and we will be discussing options with health authorities next onto other gastro programs. An interim analysis was recently completed on our Crohn’s disease platform study in the cohort evaluating Skyrizi plus our novel anti alpha 4 beta 7 antibody ABBV3A2. The combination resulted in a higher rate of endoscopic remission at week 12 and at week 24. The rate was double that of either monotherapy arm. Endoscopic remission was achieved by approximately 42% of patients receiving the combination at week 24. These results were observed in a broad population that had severe and refractory disease which included 82% advanced treatment failures and 53% of patients failing two or more advanced treatments. Of the patients that previously received advanced therapies, 63% failed an agent with an overlapping mechanism with the combination and 20% failed a JAK inhibitor. At baseline, patients had a mean Crohn’s disease activity index of 325 and a simple endoscopic score of 14 which represents a very treatment refractory patient population. Achieving this level of endoscopic remission in this setting is a particularly meaningful achievement as this endpoint is an objective measure of mucosal healing and is associated with long term benefits including reduced rates of hospitalization, surgery and disease progression. Safety of the combination was consistent with the profiles of the monotherapies. No new signals were observed. These results demonstrate the potentially transformative level of efficacy that our novel combination can achieve. The study is expected to complete in the third quarter with presentation at a medical meeting anticipated by early next year. A phase 2B study is planned to begin this summer in patients with Crohn’s disease and ulcerative colitis. To evaluate Skyrizi in combination with both 3a2 and with our extended half life TL1a antibody. In parallel, we will be evaluating phase 3 acceleration options for Skyrizi 3a2 in Crohn’s disease in the Skyrizi Lutekizumab cohort. The combination did not sufficiently differentiate from monotherapy Skyrizi and will not be moving forward in the early stage immunology pipeline. We are nearing completion of a phase 1 study for an IRAC4 inhibitor ABBV848 and plan to begin a phase 2 study in rheumatoid arthritis later this year. This potent inhibitor has the potential to provide biologic like efficacy, a favorable safety profile with no boxed warnings and convenient once daily oral dosing. I will now discuss neuroscience. Top line analysis was recently completed on our phase two trial evaluating ABBV932 in bipolar depression. In the study, the overall difference observed between the drug treated and placebo groups was not statistically significant. However, in a prespecified subgroup analysis of bipolar I patients an efficacy signal was observed. The safety profile of 932 was generally similar to placebo including rates of extrapyramidal events, demonstrating the potential for a more favorable tolerability profile compared to Vralar. We are evaluating next steps to continue 9,3 2 development in bipolar I patients. Dose escalation work continues for imraclidine in both schizophrenia and elderly patients. In schizophrenia. We have cleared the 100 milligram dose and will begin evaluating 150 milligrams. Phase 2 studies in monotherapy and adjunctive schizophrenia as well as psychosis related to Alzheimer’s, Parkinson’s and Lewy body dementia are planned to begin in the fourth quarter. Moving to our psychedelic acid bradysilicin, additional data from an ongoing phase two study in major depressive disorder will be available this year. Several studies are planned to begin in 2026, including a phase 3 trial for single course acute treatment in MDD, a phase 2b evaluating repeat dosing for chronic use in MDD and a proof of concept phase two in post traumatic stress disorder and in Parkinson’s disease. We remain on track for an approval decision for Tavapadone in the third quarter. Turning to our solid tumors program in oncology, TMAB A is progressing well across a broad range of tumor types. At the upcoming ASCO meeting, early stage safety and efficacy results for TMAB A in head and neck and ovarian cancers will be presented. Based on these results, we are engaging with regulators regarding ways to accelerate programs for TMAB A plus pembrolizumab in frontline head and neck cancer and TMAB A plus bevacizumab in frontline ovarian cancer. In colorectal cancer. We have made a decision to update our strategy in the third line plus setting and will now focus the pivotal program on TMAB A in combination with bevacizumab in an all comers population as opposed to pursuing monotherapy in CMET selected patients targeting all comers will allow TMAB A to reach a substantially broader population. TMAB A plus bevacizumab demonstrated improved response rates and disease control versus current standard of care regardless of C MED expression levels. Treatment with TMAB A at 2.4mg per kg/BEV achieved an objective response rate of 30% and a confirmed disease control rate of 97% compared to rates of 0% and 70% respectively for Longserve BEV. Given the expanded patient population for the ALL COMERS Phase 3 trial, we anticipate faster enrollment compared to the study in CMET selected patients. Initial data readout is expected in the second half of next year. In lung cancer, TMAB A received its first breakthrough therapy designation as a monotherapy in second line plus EGFR wild type non squamous non small cell lung cancer. We are in the process of planning a phase three trial in this setting in small cell lung cancer. A phase 3 trial for monotherapy ABBV706 recently began in relapsed refractory patients. Two phase 2 studies evaluating 706 triplet combinations in frontline patients are also planned to initiate this year. These Trials will evaluate 706 in combination with atezolizumab plus DLL3T cell engagers moving to ABBV 9609 dose escalation data in late line metastatic castration resistant prostate cancer will be presented at asco. Based on these results, we are in the process of discussing acceleration options with regulators in order to advance into phase three trials as quickly as possible. We also continue to augment our solid tumor pipeline through investments in external innovation including one with kestrel Therapeutics who recently began a phase one study to evaluate a pan KRAS inhibitor in advanced solid tumors harboring KRAS mutations. This next generation inhibitor has the potential to provide an improved efficacy and safety profile based on increased potency and specificity against the most relevant KRAS mutations while sparing H and nras isoforms. Our strategy is to combine this pan KRAS inhibitor with TMAB A in pancreatic lung and colorectal cancers in hematologic oncology. Our phase three trial evaluating monotherapy intent OMEG in third line plus multiple myeloma is tracking ahead of schedule. We anticipate a response rate readout in the third quarter with potential to also see an interim analysis on progression free survival. If this interim analysis is positive, regulatory submissions would occur later this year. Progress continues in earlier lines of therapy as well. The increasing use of anti CD38 antibodies in earlier treatment settings is driving a need for CD38 free BCMA combinations, particularly those that can provide the convenience of monthly BCMA dosing combined with an oral agent. Plans are underway for a Phase 3 study evaluating Entantmeg in combination with pomalidomide in second line plus patients, including those that were exposed or refractory to a CD38 antibody or …

Full story available on Benzinga.com

This post was originally published here

Varonis Systems Inc. (NASDAQ:VRNS) on Tuesday posted upbeat first-quarter sales on Tuesday.

The company reported total revenue of $173.1 million, up from $136.4 million a year earlier. The company reported a GAAP operating loss of $44.5 million, compared to $43.8 million a year earlier. On a non-GAAP basis, operating loss improved to $1.4 million from $6.5 million.

Yaki Faitelson, Varonis CEO, said, “Our Q1 results reflect strong execution across our business, and SaaS ARR, excluding conversions increased 29%. AI is forcing companies to prioritize data and AI security, and Varonis is uniquely positioned to help customers put the right guardrails in place so they can achieve automated outcomes and safely deploy AI with minimal effort. We …

Full story available on Benzinga.com

This post was originally published here

Renasant (NYSE:RNST) held its first-quarter earnings conference call on Wednesday. Below is the complete transcript from the call.

This content is powered by Benzinga APIs. For comprehensive financial data and transcripts, visit https://www.benzinga.com/apis/.

The full earnings call is available at https://event.choruscall.com/mediaframe/webcast.html?webcastid=SgFaqN4L

Summary

Renasant reported a strong financial performance for Q1 2026, with adjusted earnings per share increasing by 41% year over year to $0.93.

The company saw improvements in key financial metrics, including a rise in adjusted return on assets and return on tangible equity, and a significant reduction in the efficiency ratio.

Loans decreased by $71.8 million but deposits grew significantly by $626.4 million from the previous quarter.

Renasant achieved its merger cost savings goals and continues to focus on strategic hiring, having added 18 revenue producers in Q1.

The management reaffirmed a mid-single-digit growth outlook for both loan and deposit growth for the year, despite some challenges in loan growth during Q1.

Non-interest income saw a decline due to the absence of a one-time gain from the previous quarter, though SBA loan sales performed well.

The company plans to maintain its strong capital position, with CET1 ratio targets remaining around 11.25% by year-end, and continues to be active in stock buybacks.

Credit quality remained stable, with a focus on maintaining a strong allowance for loan and lease losses due to macroeconomic uncertainties.

Full Transcript

OPERATOR

Good morning and welcome to The Renaissance Corporation 2026 First Quarter Earnings Conference call and webcast. All participants will be in listen only mode. Should you need assistance, please signal a conference specialist by pressing Star then zero on your telephone keypad. After today’s presentation, there will be an opportunity to ask questions. To ask a question, you may press Star then one on your telephone keypad. To withdraw your question, please press Star then two. Please note this event is being recorded. I would now like to turn the conference over to Kelly Hutchison, Executive Vice President and Chief Accounting Officer with Renaissance Corporation. Please go ahead.

Kelly Hutchison (Executive Vice President and Chief Accounting Officer)

Good morning and thank you for joining us for Renasant Corporation’s quarterly webcast and conference call. Participating in the call today are members of Renaissance Executive Management Team. Before we begin, please note that many of our comments during this call will be forward looking statements which involve risk and uncertainty. There are many factors that could cause actual results to differ materially from the anticipated results or other expectations expressed in the forward looking statements. Such factors include, but are not limited, changes in the mix and cost of our funding sources, interest rate fluctuation, regulatory changes, portfolio performance and other factors discussed in our recent filings with the securities and Exchange Commission, including our recently filed earnings release which has been posted to Our corporate site www.renasant.com under the Press Releases link under the News and Market Data tab. We undertake no obligation, and we specifically disclaim any obligation to update or revise forward looking statements to reflect changed assumptions, the occurrence of unanticipated events or changes to future operating results over time. In addition, some of the financial measures that we may discuss this morning are non GAAP financial measures. A reconciliation of the non GAAP measures to the most comparable GAAP measures can be found in our earnings release. And now I will turn the call over to our President and Chief Executive Officer Kevin Chapman.

Kevin Chapman (President and Chief Executive Officer)

Thank you Kelly and good morning. Two years ago, we challenged ourselves by setting aspirational goals to improve our financial performance. At that time, we targeted the first quarter of 2026 as a key measuring stick that would show the financial benefits of our work. Frankly, the strong results for the first quarter exceed our goals. Adjusted earnings per share were $0.93 in the first quarter, representing a 41% increase year over year. For the quarter, adjusted return on assets grew from 95 basis points in 2025 to 133 basis points in in 2026, our adjusted return on tangible equity grew from 10.3% to 16.3% and last of all, the efficiency ratio improved from 65.5% to 55.7%. I am extremely proud of our team’s accomplishments to remain customer centric while we went through our largest merger conversion and integration. As we move forward, the Renasant team is engaged and focused on the priorities for our company to continue to grow customer relationships and hiring talented bankers. I will now turn the call over to Jim to give more details on the financial results.

Jim

Thank you Kevin and good morning. Looking at the balance sheet loans were down $71.8 million on a linked quarter basis or 1.5%. Annualized deposits were up $626.4 million from the fourth quarter or 11.8%. Annualized reported net interest margin decreased 2 basis points to 3.87% while adjusted margin decreased 1 basis point to 3.61%. On a linked quarter basis, our adjusted total cost of deposits decreased 3 basis points to 1.94% while our adjusted loan yields decreased 7 basis points to 6.04%. From a capital standpoint, all regulatory capital ratios remain in excess of required minimums to be considered well capitalized. We record a credit loss provision on loans of $8.1 million comprised of $4.2 million for funded loans and $3.9 million for unfunded commitments. Net charge offs were $2.3 million and the ACL as a percentage of total loans increased 2 basis points quarter over quarter to 1.56%. Turning to the income statement, our adjusted pre provision net revenue was $118.3 million. Net interest income decreased $3.8 million quarter over quarter. Non interest income was $50.3 million in the first quarter, a linked quarter decrease of $0.9 million. The decline in non interest income is primarily related to the recognition in the fourth quarter of a one time gain of $2 million resulting from the exit of low income housing tax credit partnerships. The absence of this gain in the first quarter was partially offset by strong performance on SBA loan sales. Non interest expense was $155.3 million for the first quarter. Excluding merger and conversion expenses of $10.6 million in the fourth quarter, this is a linked quarter decrease of $4.9 million. I will now turn the call back over to Kevin.

Kevin Chapman (President and Chief Executive Officer)

Thank you, Jim. We believe that Renasant is uniquely positioned to capitalize on organic growth opportunities. We appreciate your interest in Renasant and look forward to further discussing our results with you this morning. I will now turn the call over to the operator for questions.

OPERATOR

Thank you. We will now begin the question and answer session to ask a Question, you may press star then one or two. Your telephone keypad. If you’re using a speakerphone, please pick up your handset before pressing the keys. If at any time your question has been addressed and you’d like to withdraw your question, please Press Star Then 2. At this time, we will pause momentarily to assemble our roster. The first question comes from Michael Rose with Raymond James. Please go ahead.

Michael Rose (Equity Analyst)

Hey, good morning, guys. Thanks for taking my questions. Just wanted to start on expenses. Obviously a lot of hard work has been done on the cost savings from the merger. The step down was maybe a little bit better than I think you guys had talked about last quarter. Maybe Kevin, if you can just give us an update on where the merger cost savings stand. I would assume that you’ve got most of them at this point, but wanted to see if there’s anything left. Maybe you can also talk about kind of the reduction in employee headcount that you’ve had. And if we can kind of assume that there’d be a little bit of growth off of this $155 million rate that we saw in the first quarter. Just trying to get kind of a near term outlook.

Jim

Thanks, Michael. It’s Jim. I’ll start and I’m sure Kevin will add some color. But we’re really pleased with what’s happened in that line item. I mean, we, it’s been a focus, as you know, for the company for a number of years and we started to see the, you know, real progress beginning, call it 18 months ago even before we started to see the benefits from the merger. With the first, we could see it start to bend down. So that’s been a focus and remains a focus in terms of where we go from here. I mean, as you point out, we hit our goals with respect to expense saves from the first. So very pleased with that. I don’t see a lot of savings associated with the merger from this point on. I think we’ve realized most of those expense saves. That’s not to say that we can’t do more just as a company as a whole. But I think expenses that are expense saves that are truly related to the merger are pretty much in this run rate. Looking forward there, I guess there are a couple things. We will have merit increases obviously in the second quarter and there’s a day count factor as we look to Q2 and beyond, but I think so I think we do have those things which will cause expenses to drift up moderately. The other variable, and this is probably something Kevin should speak to, but is we have seen and are seeing opportunities to hire. As you know, there’s a lot of dislocation going on in the marketplace. And so we have seen, we’ve seen that already and expect to see more of it. I would say that’s the part of the picture on NIE that’ll be a little hard to predict. And Kevin, please add to that.

Kevin Chapman (President and Chief Executive Officer)

Yeah, I will. Thank you. Jim and Michael, good morning. I’ll just add you mentioned about the headcount. So if you go back to June of 24, which we announced the merger with the first in July, but if you look at just our combined FTEs, we were just shy of 3400 employees. If you just take us plus them, that’s what our FTEs were at 331, that number will be about 2950. So we’ve carved out 420 employees over that time period. Not all of them were due to to the cost saves of the merger. Prior to that, Renasant was highly focused on accountability and ensuring that we had the right team for what we wanted the goals to be. So I agree with Jim that our cost save number we’ve achieved. But the accountability measures and the requirements to be higher performing at Renaissance haven’t changed. And so we’ll continue to focus on that. Find incremental ways to improve cost costs, to reallocate expenses to higher performing endeavors. That effort will not change. But that didn’t occur because of the first. That was happening long before that. Jim also mentioned the new hires. I think one thing that is hidden in the focus on expenses that we’ve had over the past couple of quarters is the hiring we’ve been doing, the cost saves and the expenses fences where they land today. That includes new hires that we’ve been making along all along the past several quarters. In Q1 we hired 18 revenue producers. In Q4 we hired six. And in Q3 of last year we hired nine. So if you look at the real cost saves associated with the merger, associated with accountability measures, it’s much deeper than optically what we’re showing in the numbers. But we’re extremely excited about the hiring, the hiring opportunities we have, the market dislocation that is giving us the opportunity to have conversations with extremely talented bankers all throughout the Southeast. And I think we’ve said it in the past, you know, we kind of grade out, you grade out your employees A, B, C, D and F. I think we’ve said this, that we will always hire a rated talent when they’re available. And maybe I’ll say it a Little bit more pointedly, we won’t flinch at the opportunity to hire a rated talent and we’re seeing that opportunity all around us right now.

Michael Rose (Equity Analyst)

That’s great, Kevin. So I’m not trying to pin you down, but just as a starting point, it sounds like with the puts and takes, maybe a couple million dollars higher in the second quarter is what we could expect or is that fair? Just trying to better appreciate kind of a starting run rate. With the seasonality aspect,

Jim

I would say this, that, you know, from Q1, probably a low single digit percent increase and that factors in some of the hiring Kevin’s talking about. But that’s the variable that’s hard to predict because as Kevin points out, we see opportunities to be, you know, opportunistic and we intend to pursue those. So that’s the piece that Michael’s a little tough to, to forecast, but at its base, I would give you that that day count and merit, you know, is probably call it, I don’t know, low single digits. And then we’ll see what comes from the hiring, which will add to that.

Michael …

Full story available on Benzinga.com

This post was originally published here

Omega Healthcare Invts (NYSE:OHI) released first-quarter financial results and hosted an earnings call on Wednesday. Read the complete transcript below.

This transcript is brought to you by Benzinga APIs. For real-time access to our entire catalog, please visit https://www.benzinga.com/apis/ for a consultation.

The full earnings call is available at https://events.q4inc.com/attendee/811963547

Summary

Omega Healthcare Invts reported a strong first quarter with adjusted funds from operations (AFFO) of $0.82 per share and funds available for distribution (FAD) of $0.78 per share, driven by acquisitions and active portfolio management.

The company increased the low end of its AFFO guidance, with a midpoint now at $3.22, reflecting confidence in sustained FAD growth and a robust pipeline of investment opportunities.

Strategic initiatives include a $480 million asset sale of Communicare facilities, expected to generate $0.03 of annual AFFO and FAD accretion, and $326 million in new investments in 2026, focusing on skilled nursing, senior housing, and long-term care real estate.

Management highlighted a strong balance sheet with a fixed charge coverage ratio of 6.3 times and leverage at 3.5 times, with significant liquidity to support future investments.

Future outlook remains positive, with a focus on capital allocation to drive sustainable FAD per share growth and exploring opportunities in both U.S. and UK markets, despite a competitive landscape.

Full Transcript

OPERATOR

Ladies and Gentlemen, thank you for standing by. Welcome to Omega Healthcare Investors Inc. First quarter earnings conference call. All lines have been placed on mute to prevent any background noise. After the speaker’s remarks, there will be a question and answer session. If you would like to ask a question during this time, simply press STAR followed by the number one on your telephone keypad. If you would like to withdraw your question, press STAR one again. Thank you. I will now turn the conference over to Michelle Weber. You may begin.

Michelle Weber (Operator)

Thank you and good morning. With me today is Omega CEO Taylor Pickett, President Matthew Gorman, CFO Bob Stevenson, CIO Vikas Gupta and Megan Kroll, Senior Vice President, Data, Intelligence and Government Relations. Comments made during this conference call that are not historical facts may be forward looking statements such as statements regarding our financial projections, potential transactions, operator prospects and outlook. Generally, factors that could cause actual results to differ materially from those in the forward looking statements are detailed in the company’s filings with the SEC. During the call today we will refer to some non GAAP financial measures such as NAREIT FFO, adjusted FFO, FAD and EBITDA. Reconciliations of these non GAAP measures to the most comparable measure under Generally Accepted Accounting principles are available in the quarterly supplement. In addition, certain operator coverage and financial information that we discuss is based on data provided by our operators and that has not been independently verified by Omega. I will now turn the call over to Taylor.

Taylor Pickett (Chief Executive Officer)

Thanks Michelle. Good morning and thank you for joining our first quarter 2026 earnings conference call. Today I will discuss our first quarter financial results and certain key operating trends. First quarter adjusted funds from operations AFFO of $0.82 per share and FAD (Funds Available for Distribution) of $0.78 per share. Reflects strong revenue and EBITDA growth principally fueled by acquisitions and active portfolio management. Our dividend payout ratio has dropped to 82% for AFFO and 86% for FAT. Our exceptional first quarter results reflect our high quality capital allocation throughout 2025 and the first quarter of 2026. We continue to find and close RIDEA transactions while still allocating meaningful capital to SNF facilities and UK care homes. We expect our capital allocation and active portfolio management will drive significant future AFFO and FAD growth. Our active portfolio management is highlighted by our planned and partially completed second quarter sales generating 480 million in proceeds. We expect the redeployment of this capital will result in approximately $0.03 of annual AFFO and FAD accretion.. I will now turn the call over to Matthew.

Matthew Gorman (President)

Thanks Taylor and good morning everyone. We have spoken in previous calls about the team’s focus on creating shareholder value by growing fad per share on a sustainable basis and we saw this focus continue to bear fruit in the first quarter as our FAD PER share increased 9.5% over the same quarter last year. This, along with a robust pipeline of investment opportunities gave us comfort to be able to increase the low end of our AFFO guidance, moving the Midpoint up by $0.02 to $3.22. At the same time, our first quarter investments reflect the breadth of our capital allocation focus. We invested in both Triple Net and RIDEA structures in skilled nursing, seniors housing and long term care real estate across the United States, the UK and Canada, and we closed on our equity investment in Savers Operating company. In addition, we are in the process of selling a portfolio of 18 CommuniCare assets for $480 million. Vikas will provide additional details around the sale. However, from an overarching perspective, it was about putting assets into the hands of strong stewards at a price that made sense for each party while also enhancing our credit with CommuniCare. While we would not expect to see this be a core element of our capital allocation strategy, we will continue to evaluate our portfolio and work with our operating partners to find innovative ways to both protect and enhance shareholder value over time. Finally, I would like to thank the team who continue to work tirelessly to execute on our vision, as well as our operating partners and their staff who work every day to look after some of the sickest and most frail members of our community. Without them, none of this would be possible. I will now turn the call over to Vikas.

Vikas Gupta (Chief Investment Officer)

Thank you Matthew and good morning everyone. Today I will discuss the most recent performance trends for Omega’s operating portfolio including an update on Genesys, additional detail on our strategic sales, Omega’s investment activity year to date and an update on our pipeline. Turning to portfolio performance, Core portfolio coverage continues to trend in a favorable direction above industry average coverage levels with our trailing twelve month operator EBITDAR coverage for our Triple Net and Mortgage core Portfolio as of December 31, 2025 at 1.58x compared to our third quarter 2025 reported coverage of 1.57 times. This represents the highest coverage in our portfolio in over a decade and reflects the combination of a relatively favorable operating backdrop. Combined with our active portfolio management where we have focused on strengthening the lease credit across our portfolio, the Genesis bankruptcy process continues to move forward with a few notable events having taken place in recent weeks. In March we committed to fund up to 26.7 million or 1/3 of a new aggregate $80 million DIP loan. As of the end of the first quarter, we have funded our 25 million portion of the initial 75 million advance. Proceeds from this new Super Priority DIP financing are used to fully repay the original DIP loan and to fund working capital needs. Additionally, the debtors have advised that 101 West State street has submitted a qualified financing commitment as required by the Asset Purchase Agreement. The closing date, which can contractually be extended to the end of the third quarter, is conditioned on several factors including receipt of regulatory change of ownership approvals. We anticipate that 101 West State Street will assume our Genesis MAS release and our DIP loan and term loan will be paid off from the consideration received by the debtors at closing. We remain confident that our term loan is fully collateralized based on the underlying collateral and the ascribed value of the Genesis Estate. These assumptions, along with all elements of the bankruptcy process are subject to further developments and events in the bankruptcy proceeding. As Taylor and Matthew mentioned, we’re in the process of a strategic sale of 18 communicare assets located in Maryland and West Virginia for contractual purchase price of 480 million and a rent discount at a blended 7.7%. Subsequent to quarter end, 12 Maryland facilities were sold and we expect the remaining six West Virginia facilities to be sold in the second quarter. While asset sales are not typically a core component of our capital allocation strategy, the strong pricing offered for these facilities combined with the improvement of our credit with Communicare presented an opportunity to realize significant value for our shareholders. Turning to New investments, Our transaction activity for 2026 started strong with 326 million in new investments year to date. Similar to previous quarters, these transactions varied in size and asset type, but demonstrate our ability to continue to develop, underwrite and close accretive transactions in our core asset classes. We continue to support the growth of existing and new operators in the US Skilled nursing space and UK care home space as well as expand our new senior housing Radia portfolio. As Matthew said earlier, our primary goal is to allocate capital with a focus on growing fad per share on a sustainable basis. During the first quarter of 2026, Omega completed a total of 251 million in new investments, not including 13 million in CapEx. These new investments included the previously announced purchase of 9.9% of the equity interest in Savers Operating Company, the $109 million acquisition of 13 Georgia skilled nursing facilities, and a $10 million investment in an Alabama senior housing RIDEA transaction. Our other first quarter investments included the purchase of a UK care home for 7 million and 27 million in real estate loans. The weighted average yield on these leases and loans was was 10.9%. Subsequent to quarter end we closed 75 million of additional investments. We purchased two Indiana skilled nursing facilities for 33 million and three senior housing facilities in Rhode island for 42 million. The skilled nursing facilities will be leased to a current Omega operator at a lease yield of 10%. The senior housing facilities will be operated by Omega and managed by a third party manager via a RIDEA structure. Turning to the Pipeline Our pipeline includes both marketed and off market opportunities in the US and the uk. A large component of these opportunities are US Senior housing assets that will be structured and operated using our new RIDEA platform. As mentioned previously, we’ve built out our infrastructure at Omega with an experienced team of investment professionals that are finding deals that meet our investment criteria and then coupling them with proven third party managers who we believe will deliver on those underwritten expectations. We continue to pursue deals that will achieve IRRs in the mid teens range. In addition to senior housing right year deals, we are aggressively pursuing both US Skilled Nursing and UK care home deals in uk. We’ve built out our team to help find off market transactions and quickly evaluate opportunities with existing and new operators in order to continue deploying meaningful capital through both Triple Net and RIDEA structures. I will now turn the call over to Bob.

Bob Stevenson (Chief Financial Officer)

Thanks Vikas and good morning. Turning to our financials for the first quarter of 2026, revenue for the first quarter was $323 million compared to $277 million for the first quarter of 2025. The year over year increase is primarily the result of the timing and impact of revenue from new Investments completed throughout 2025 and 26, annual escalators and active portfolio management. Our net income for the first quarter 2026 was $159 million or $0.47 per common share compared to $112 million or $0.33 per common share for the first quarter of 2025. Our adjusted FFO was $260 million or $0.82 per share for the quarter and our FAD was $247 million or $0.78 per share and both are adjusted for several items outlined in our NAREIT FFO adjusted FFO and FAD reconciliations to net income found in our earnings release as well as our first quarter financial supplemental posted to our website. Our first quarter 2026 adjusted FFO and FAD were both 2 pennies greater than our fourth quarter AFFO and FAD, with the increase primarily resulting from incremental net income from $585 million in new investments completed during the fourth and first quarters and revenue from annual escalators of $2 million. These were partially offset by income related to $53 million in asset sales and $88 million in loan repayments over the past two quarters, resulting in a $1.4 million reduction to our first quarter adjusted FFO and FAD, as well as the impact from the issuance of a combined 7.7 million common shares of stock and OP units over the past two quarters to fund the new investments. Our balance sheet remains incredibly strong, our debt is well laddered and we have significant liquidity. At March 31st we have $425 million in borrowings on our credit facility. However, we also have $26 million in available cash and assets held for sale which we expect to sell for approximately $480 million. Additionally, we have over $1.5 billion in available capacity on our $2 billion revolver with our next scheduled debt maturity not until April 2027. At quarter end, our fixed charge coverage ratio was 6.3 times and our leverage remained flat at 3.5 times. We are excited as our balance sheet and cost of capital continue to position us to accretively fund our active pipeline. Turning to Guidance as we press release yesterday we narrowed our full year adjusted income AFFO guidance to A range between $3.19 to $3.25 per share. This is a two penny increase over the midpoint of our February guidance. I’d like to take a moment to highlight a few of the guidance assumptions we outlined in our earnings release. Our guidance includes the impact of new investments completed as of April 27 and does not include any additional investments not outlined in our press release. It includes the impact of scheduled loan repayments and expected asset sales of the $159 million in mortgages and other real estate loans that are scheduled to mature in 2026. It assumes 65 million will convert to fee simple real estate and that the balance will be repaid. Additionally, 224 million in non real estate backed loans at March 31, 2026 are expected to be repaid throughout 2026, which includes approximately $159.5 million in Genesis loans. The …

Full story available on Benzinga.com

This post was originally published here

Alliancebernstein Holding LP (NYSE:AB) on Tuesday posted in-line earnings for the first quarter.

The company reported quarterly earnings of 83 cents per share which met the analyst consensus estimate. The company reported quarterly sales of $1.201 billion which beat the analyst consensus estimate of $894.721 million.

“The first quarter of 2026 unfolded against a difficult geopolitical backdrop associated with market volatility,” said Seth Bernstein, CEO of AllianceBernstein. “Firmwide net active outflows totaled $6.3 billion, reflecting a more risk-averse environment, despite continued momentum across structurally growing areas—including private markets, active ETFs, SMAs, insurance, …

Full story available on Benzinga.com

This post was originally published here

Carpenter Tech (NYSE:CRS) held its third-quarter earnings conference call on Wednesday. Below is the complete transcript from the call.

Benzinga APIs provide real-time access to earnings call transcripts and financial data. Visit https://www.benzinga.com/apis/ to learn more.

Access the full call at https://events.q4inc.com/attendee/872739090

Summary

Carpenter Tech reported record third-quarter operating income of $187 million, a 20% increase from the prior record quarter, driven by strong demand and operational execution.

The company achieved significant margin expansion in the SAO segment, with a record adjusted operating margin of 35.6%, due to productivity gains and pricing strategies.

Strong market demand was noted in aerospace and defense, with increasing orders reflecting OEM production plans; however, the medical market showed a sequential decline.

Carpenter Tech generated $193.5 million in cash from operations and $124.8 million in adjusted free cash flow, supporting capital expenditures and share repurchases.

The company increased its free cash flow outlook for fiscal year 2026 to at least $350 million and highlighted ongoing investments in a Brownfield capacity expansion project.

Management emphasized a positive financial outlook, noting that current earnings targets for fiscal year 2027 are outdated, with updated guidance to be provided in the next earnings call.

Expedite requests from customers are increasing, indicating urgency in supply chain demands, particularly in aerospace structural materials.

Carpenter Tech is executing a balanced capital allocation strategy, including share repurchases and dividend payments, supported by strong liquidity.

Full Transcript

OPERATOR

Hello and welcome. My name is Ellie and I will be your conference operator for today. At this time I would like to welcome everyone to the Carpenter Technology Carpenter Tech third quarter fiscal year 2026 earnings presentation call. Please note that this call is being recorded. After the prepared remarks, there will be a question and answer session. If you’d like to ask a question during that time, please press STAR followed by one on your telephone keypad. Thank you. I would now like to hand the call over to John Hewitt, Vice President of Investment Relations. You may now go ahead please.

John Hewitt (Vice President of Investment Relations)

Thank you. Operator, good morning everyone and welcome to the Carpenter Tech Earnings Conference call for the fiscal 2026 third quarter ended March 31, 2026. This call is also being broadcast over the Internet along with presentation slides. For those of you listening by phone, you may experience a time delay in slide movement. Speakers on the call today are Tony Taine, Chairman and Chief Executive Officer Tim Lane, Senior Vice President and Chief Financial Officer and Brian Malloy, President and Chief Operating Officer. Statements made by management during this earnings presentation that are forward looking statements are based on current expectations. Risk factors that could cause actual results to differ materially from these forward looking statements can be found in Carpenter technologies most recent SEC filings, including the Company’s report on Form 10K for the year ended June 30, 2025, Forms 10Q for the quarters ended September 30, 2025 and December 31, 2025 and the exhibits attached to those filings. Please also note that in the following discussion, unless otherwise noted, when management discuss the sales or revenue, that reference excludes surcharge when referring to operating margins that is based on adjusted operating income excluding special items and sales excluding surcharge. I will now turn the call over to Tony.

Tony Taine (Chairman and Chief Executive Officer)

Thank you John and good morning to everyone. I will begin on slide 4 with a review of our safety performance. We ended the third quarter of fiscal year 2026 with a total case incident rate of 1.3. We continue to make progress as a result of targeted actions we’ve implemented across the organization centered on standardized work and disciplined safety practices. As always, we remain committed to our ultimate goal and a zero injury workplace. Let’s turn to Slide 5 for an overview of our third quarter performance. Carpenter Tech just delivered another record quarter reflecting the accelerating demand across our high value markets and our continued strong operational execution. This record performance is best understood through four key takeaways that highlight the strength, durability and trajectory of the business. 1. Record Earnings in the third quarter we generated 187 million in operating income, exceeding our previous record set in the second quarter by 20%. Certainly we have earned a reputation of setting meaningful financial targets and then exceeding them, and we did it again in this quarter. But it must be noted the ability to increase earnings by 20% sequentially over what was a record quarter and in a market that is still accelerating must be recognized as superior performance. We are extremely proud of the Carpenter Technology team for their commitment to performance and their focus on continuous improvement. Importantly, these record earnings translated directly into another step change in cash flow generation. In the third quarter we generated 1 93.5 million in cash from operating activities and 1,2 4.8 million of adjusted free cash flow. 2. Expanding operating margins the Specialty Alloys Operations (SAO) segment delivered an adjusted operating margin of 35.6% in the quarter, another new record for the business. This margin compares to 33.1% in the prior quarter and 29.1% a year ago. This meaningful margin expansion clearly demonstrates the impact of ongoing productivity gains, product mix optimization and pricing actions. As a result of the expanding margins, the Specialty Alloys Operations (SAO) segment recorded 208 million in operating income, an increase of 19% sequentially and another all time record for the segment. 3. Strengthening market demand we see clear and accelerating demand signals across the aerospace and defense in use market reflected in both OEM production plans and order intake. Notably, bookings for aerospace structural materials continue to increase up substantially this quarter. Remember, the submarket for aerospace structural material has been the most impacted by the OEM build rates. Therefore, increasing orders from our aerospace structural customers is is a clear signal that the supply chain is accelerating the ramp to support the expected OEM build rates going forward. And four Pricing continues to be to be a tailwind. As I’ve said many times, pricing has been and will continue to be a tailwind for the business. Against a backdrop of strong demand, customers are prioritizing security of supply and we are continuing to realize pricing that reflects the value we deliver. While no long term agreements were completed in the quarter, several are currently in negotiation. These long term agreements support attractive economics for us while providing our customers with the supply chain certainty they need, making them strategically beneficial for both sides. Now let’s turn to slide 6 and have a closer look at our third quarter sales and market dynamics. In the third quarter of fiscal year 2026 we delivered strong top line growth with total sales excluding raw material surcharge up 10% year over year and up 11% sequentially reflecting higher volumes and continued pricing strength. The higher volumes were the result of increased operating time, improved productivity and increasing demand for aerospace materials, primarily in the aerospace structural submarket. Looking ahead, we expect continued productivity improvements and healthy demand across our core end use markets to support further sales growth. Now let me review our key end use markets starting with aerospace and defense. Sales in the aerospace and defense end use market were up 13% sequentially and up 17% year over year. Our sales growth reflects accelerating activity across the aerospace supply chain as OEMs continue to push towards higher build rates. Let me give some color on what we see happening in the aerospace market. With backlogs of new plane orders reaching new records every quarter, Boeing and Airbus are ramping production. Notably, Boeing is Now consistently producing 42 737s per month. As reported on their recent earnings call, they are poised to go to 47 per month this summer and have their sights set on 52 and beyond due to the growing demand. As a result, the supply chain is building confidence and our customer order intake has been increasing. Even with the increasing orders, OEMs are still concerned that the supply chain is not ordering material fast enough. We agree as we have seen order intake increase significantly, but we know from experience that it is still not enough to support the desired ramp. Over the last three months we’ve had customers reach out requesting urgent deliveries to avoid line shutdowns for specific applications. We also continue to have customers across engine programs telling us our material is needed sooner. The Boeing comment inventories that had been helping with recent output are now coming down is significant and it will drive urgency to yet another level. We expect this urgency will continue to spread throughout the supply chain as inventories run short, further tightening the market for our materials. Moving on to the medical end use market, our sales were down 9% sequentially and 29% compared to the prior year. Third quarter on a positive note, bookings were up significantly in the quarter, supporting our expectation the medical end use market will begin to recover and return to growth in the near term. In the energy end use market, sales increased 32% sequentially and 44% year over year, driven by higher volumes supporting industrial gas turbine builds. The demand from our Industrial Gas Turbine (IGT) customers, primarily driven by the growing energy needs of data centers, remains strong across multiple platform types and OEMs. Keep in mind that the production flow for the Industrial Gas Turbine (IGT) material goes across similar flow paths as aerospace material. As a result, quarterly sales for Industrial Gas Turbine (IGT) material can fluctuate due to order timing and production scheduling. Taking a step back, we are clearly operating in an accelerated demand environment across our highest value end use markets. Combined with our differentiated capabilities and capacity this positions Carpenter Technology for meaningful growth both in the near term and over the long term. Now I will turn it over to Tim for the financial summary.

Tim Lane (Senior Vice President and Chief Financial Officer)

Thanks Tony Good morning everyone. I’ll start in the income statement Summary on slide 8. Starting at the top, sales excluding surcharge increased 10% year over year on 15% higher volume. Sequentially, sales were up 11% on 10% higher volume. The improving productivity, product mix and pricing are evident in our gross profit, which increased to 251.8 million in the current quarter, up 25% from the same quarter last year and up 15% sequentially. Selling general and administrative or Selling, General and Administrative (SG&A) expenses were 65.3 million in the third quarter, up roughly 2 million both sequentially and versus the same quarter last year. The Selling, General and Administrative (SG&A) line includes corporate costs which were 27.3 million. This is up 1.1 million sequentially and up 2.9 million from the third quarter of fiscal year 2025. For the upcoming fourth quarter of fiscal year 2026, we expect corporate costs to be between 25 to 26 million. Operating income was $186.5 million in the current quarter, which is 35% higher than our third quarter of fiscal year 2025 and up 20% from our recent second quarter. As Tony mentioned earlier, this represents another record quarterly operating income result, breaking the previous record set last quarter. Moving on to our effective tax rate, which was 21% in the current quarter, this quarter’s effective tax rate was lower than anticipated, primarily due to discrete tax benefits associated with changes to the estimates for certain tax positions taken in the prior year. For the upcoming fourth quarter of fiscal year 2026, we expect the effective tax rate excluding discrete items to be about 23%. Finally, the earnings per diluted share was $2.77 per share for the quarter. Now turning to the next slide to talk about our cash generation and capital allocation priorities. In addition to the strong earnings performance, we generated meaningful cash flows driven by higher earnings and ongoing efforts to manage working capital closely, particularly inventory. To date, in fiscal year 2026, we generated $364.9 million of cash from operating activities. This is roughly 2 times the operating cash flows when compared to the same period last year. The cash generated from operations more than supports the capital spending in fiscal year 2026. To date, we have spent 157.6 million in fiscal year 2026. This includes the annual targeted capital expenditures of 125 million as well as the Brownfield capacity expansion project. As anticipated, capital spending ramped in our recent third quarter, totaling 68.7 million as activities around the capacity expansion project accelerated. A Brief update on this Project the Brownfield capacity expansion project remains on budget and on schedule. The construction phase is well underway and and key equipment deliveries have begun. The project team remains focused on not only completing construction and installation of equipment, but also preparing for activities to ensure a smooth startup of operations as we look to the balance of the year, we expect capital expenditures for fiscal year 2026 to finish at about 260 million. This is below the expectation we set at the beginning of the year based solely on changes in the estimates we made for the timing of cash spending related to the project. This doesn’t change our outlook for the full project that we set out when we announced the expansion with those details in mind. To date in fiscal year 2026 we have generated 207.3 million in adjusted free cash flow. We are increasing our outlook for free cash flow and currently expect to generate a at least 350 million of adjusted free cash flow in fiscal year 2026. As we have said many times before, our adjusted free cash flow generation is important as it enables us to deploy a balanced capital allocation approach that includes investing cash in attractive and accretive growth projects like the Brownfield capacity expansion and returning cash to shareholders. To that end, we continue to execute against our repurchase authorization and repurchased $133.9 million of shares in fiscal year 2026. This brings the total to $235.8 million spent to date against the $400 million authorization that we announced in July of 2024. And in addition to the buyback program, we also continue to fund a recurring and long standing quarterly dividend. Finally, our ability to deploy capital is also supported by our healthy liquidity and strong balance sheet. Last quarter we talked about the refinancing actions we took to strengthen both our balance sheet and liquidity. As of the most recent quarter end, our Total liquidity was 793.8 million, including 294.8 million of cash and 499 million of available borrowings under our credit facility. Our credit metrics remain very strong with our net debt …

Full story available on Benzinga.com

This post was originally published here

Ripple CEO Brad Garlinghouse has labeled XRP (CRYPTO: XRP) the company’s “North Star” as the token faces a breakout decision in the next 24 to 48 hours.

Garlinghouse: All Roads Lead To XRP

Garlinghouse on Wednesday reposted Reddit co-founder Alexis Ohanian, who emphasized that a CEO’s daily responsibility is to “communicate and re-communicate the North Star. Again and again.”

“100% All roads lead back to Ripple’s North Star, XRP,” Garlinghouse said. 

The statement reaffirms XRP as central to Ripple’s strategy in cross-border payments and XRP Ledger development amid global adoption efforts.

Ripple, OKX Expand RLUSD To 280+ Trading Pairs

Ripple and OKX partnered Wednesday to make RLUSD (CRYPTO: RLUSD) available for spot trading across over 280 pairs. 

The partnership allows traders to …

Full story available on Benzinga.com

This post was originally published here

Robinhood (NASDAQ:HOOD) is down to $73 Wednesday after Q1 crypto revenue plunged 47% to $134 million, yet Bernstein maintains its $130 target for the stock.

The Q1 Miss: Crypto Revenue Collapsed

Robinhood on Tuesday reported cryptocurrency revenues of $134 million and native-app notional trading volumes of $24 billion, year-over-year declines of 47% and 48% respectively. 

Crypto now accounts for just 13% of total revenue versus 17% in Q4 2025.

Q1 revenue hit $1.067 billion, a 7% miss versus estimates. Adjusted EBITDA of $534 million missed expectations by 9%. 

The company posted net income of $346 million, a 3% increase year-over-year, maintaining profitability despite the crypto collapse.

What Worked: Prediction Markets, Gold Subscribers

Prediction markets emerged as the primary growth driver with event contracts trading a record 8.8 billion units in Q1. 

This segment contributed $415 …

Full story available on Benzinga.com

This post was originally published here

Bitcoin (CRYPTO: BTC) tapped $77,000 early Wednesday as analysts debate how the change at the helm of the Federal Reserve will impact the apex crypto.

Powell Chairs His Last Meeting

In an Apr.29 podcast, Benjamin Cowen said Bitcoin has historically performed best under loose monetary conditions.

The upcoming Federal Open Market Committee meeting is notable as it is expected to be the final one led by Jerome Powell as Federal Reserve chair, marking what Cowen described as the “end of an era.”

Despite market expectations that new leadership could introduce rate cuts, Cowen argued this is unlikely in the near term.

He pointed to persistent inflation, driven …

Full story available on Benzinga.com

This post was originally published here

(Editor’s note: The future prices of benchmark tracking ETFs, the lede, and the headline were updated in the story.)

Dow Jones and S&P 500 futures declined, while Nasdaq rose in premarket on Wednesday, following Tuesday’s lower close.

New orders for manufactured durable goods in March increased by 0.8% to $318.9 billion, bouncing back after three consecutive monthly declines. When excluding the transportation sector, new orders grew by 0.9%.

In trade data, the U.S. advanced international trade deficit for goods widened to $87.9 billion in March, up from $83.5 billion in February. Meanwhile, advance wholesale inventories rose 1.4% to $932.8 billion, and advance retail inventories increased 0.7% to $823.5 billion.

Investors will be closely watching the Federal Reserve’s decision to gauge how the central bank is navigating interest rates amid the ongoing U.S.-Iran war. Additionally, Jerome Powell‘s press conference at 2:30 p.m. ET is widely considered to be his last as Chair of the Fed.

The CME Group’s FedWatch tool‘s projections show markets pricing a 100% likelihood of the Federal Reserve leaving the current interest rates unchanged in today’s meeting.

Four out of seven ‘Magnificent 7’ heavyweights will announce their earnings results today after the bell, which include Microsoft Corp. (NASDAQ:MSFT) and Meta Platforms Inc. (NASDAQ:META).

Meanwhile, the 10-year Treasury bond yielded 4.36%, and the two-year bond yield was at 3.85%.

Index Performance (+/-)
Dow Jones 0.09%
S&P 500 0.08%
Nasdaq 100 0.29%
Russell 2000 0.18%

The SPDR S&P 500 ETF Trust (NYSE:SPY) and Invesco QQQ Trust ETF (NASDAQ:QQQ), which track the S&P 500 and Nasdaq 100, respectively, were mixed in premarket on Wednesday. The SPY was down 0.11% at $710.90, while the QQQ advanced 0.10% to $658.22.

data-variant=”card”
data-news-mode=”manual”

>


Read Also:

JP Morgan Forecasts ‘Eye-Popping’ $200 Billion AI Spending Surge For Top US Cloud Service Providers Like Amazon, Microsoft, Alphabet

This post was originally published here

On CNBC’s “Mad Money Lightning Round,” Jim Cramer said Ondas Inc (NASDAQ:ONDS) is losing a lot of money and added that he would rather have to find something new and different that is distinct, while he doesn’t see anything distinct about Ondas.

As per recent news, Ondas completed its merger with U.S. defense prime contractor Mistral on April 24 in a $175 million deal, adding programs exceeding $1 billion and expanding direct prime participation across U.S. Department of War programs.

When asked about Beam Therapeutics Inc (NASDAQ:BEAM), he said, “We don’t want to buy any stocks that are heavily shorted because they are all by nature heavily shorted because they don’t have any earnings.”

Cramer said he likes Halliburton Co

Full story available on Benzinga.com

This post was originally published here

Bunge Global (NYSE:BG) reported first-quarter financial results on Wednesday. The transcript from the company’s first-quarter earnings call has been provided below.

This content is powered by Benzinga APIs. For comprehensive financial data and transcripts, visit https://www.benzinga.com/apis/.

Access the full call at https://event.choruscall.com/mediaframe/webcast.html?webcastid=9FnQRJZO

Summary

Bunge Global reported strong first quarter 2026 results, driven by higher soybean and softseed processing and refining performance, leading to an increase in full-year EPS guidance to $9-$9.50 from $7.50-$8.

The company highlighted strategic steps taken to maintain supply chain continuity amid geopolitical tensions, with a focus on biofuels as a growth area, supported by favorable policy decisions.

Operational highlights included strong performance in South America, particularly Argentina and Brazil, and robust results in North America, despite challenges in grain merchandising due to higher logistics and energy costs.

Bunge Global’s expanded footprint, following the integration of Itera, has enhanced its ability to navigate complex environments, with synergies from this integration running ahead of plan.

Management emphasized the company’s resilience and adaptability in a dynamic market, with future growth supported by a diversified portfolio and strategic investments in areas like soy protein processing.

Full Transcript

OPERATOR

Good day and welcome to The Bunge Global first quarter 2026 earnings release and conference call. All participants will be in a listen only mode. Should you need assistance, please signal a conference specialist by pressing the star key followed by zero. After today’s presentation there will be an opportunity to ask questions. To ask a question you may press star then one on a touchtone phone. To withdraw your question, please press Star then two. Please note this event is being recorded. I would now like to turn the conference over to Mark Hayden, Investor Relations. Please go ahead.

Mark Hayden (Investor Relations)

Great. Thank you Betsy and thank you all for joining us this morning for our first quarter 2026 earnings call. Before we get started, I want to let you know that we have slides to accompany our discussion. These can be found at the Investor center on our website at bunge.com under Events and Presentations. Reconciliations of our non GAAP measures to the most directly comparable GAAP financial measure are posted on our website as well. I’d like to direct you to slide 2 and remind you that today’s presentation includes forward looking statements that reflect Bunge’s current view with respect to future events, financial performance and industry conditions. These forward looking statements are subject to various risks and uncertainties. Bunge has provided additional information in its reports on file with the SEC concerning factors that could cause actual results to differ materially from those contained in this presentation and we encourage you to review these factors. On the call this morning are Greg Heckman, Bunge CEO, and John Kneppel, our CFO. I’ll now turn the call over to Greg.

Greg Heckman (Chief Executive Officer)

Thank you Mark and good morning everyone. I want to start by thanking our team for their hard work and adaptability in what has been a very dynamic start to the year. The first quarter of 2026 was one of the more rapidly changing operating environments we’ve seen in recent years and the team executed with the discipline and speed that defines this organization and delivered strong results. Even since our Investor Day last month, the world has changed considerably. The Middle East conflict which was just emerging when we gathered in March, has continued to evolve. In addition to the very real impacts to those involved, it has meaningfully disrupted global trade flows, logistics, costs and supply chains. In response, we are taking prudent operational steps to support the continuity of supply for our customers, including working with relevant regulators, policymakers and partners to preserve essential commodity flows and manage risk. These actions focus on maintaining flexibility in shipping arrangements and leveraging our global capabilities and regional capability to continue serving customers reliably in the US A bright spot in agriculture right now is biofuels. With everything going on in the world at the moment, having more biofuels in the supply is good for everyone. We need policy that supports the sector, and that’s exactly what the EPA did with the recent Renewable Volume Obligations (RVO) decision. We commend the agency for setting a volume that supports the investments made by fuel producers, oilseed processors and farmers in supplying biofuels to the market. Globally, there are many variables still at play, not the least of which is the uncertain duration of the Middle East conflict and the impact that will have on everything from farmer inputs, including fertilizer to fuel prices, and what that might mean for the mix of crops farmers plant in the next growing season. What we can say with confidence is that Bunge Global’s business is designed for complexity and change. Our combination of integrated global platform, disciplined risk management and operational excellence allows us to perform through the cycle and this quarter is clearly evidence of that. Looking at our operating results, the first quarter exceeded our expectations. The higher results were primarily driven by our soybean and softseed processing and refining segments, reflecting strong execution in a dynamic environment and improved market conditions. To drill down a little deeper, our results underscore the advantages of our larger platform and reach. While grain merchandising performance was impacted by distribution related factors including higher logistics and energy costs, those same conditions drove higher demand for renewable feedstocks. This in turn benefited our soy and softseed value chains. Turning to our outlook based on what we can see today, including the strength of Q1 and the forward curves, as we look at the balance of the year, we are increasing our full year adjusted EPS guidance range to $9 to $9.50 and that’s up from the $7.50 to $8 we provided on our fourth quarter call. While the current macroeconomic and geopolitical environments remain uncertain, our balanced footprint and diversified value chains give us the tools to adapt. The long term fundamentals driving demand for our products and services remain firmly in place and we’re well positioned to execute in any environment. With that, I’ll turn it over to John for a deeper look at our financials and outlook.

John Kneppel (Chief Financial Officer)

Thanks Greg and good morning everyone. Let’s turn to the earnings Highlights on Slide 5. Our reported first quarter earnings per share was $0.35 compared to $1.48 in the first quarter of 2025. Our reported results include an unfavorable mark to market timing difference of $1.28 per share and an unfavorable impact of $0.20 related to Vitera transaction and integration costs adjusted EPS was $1.83 in the first quarter versus $1.81 in the prior year. Adjusted segment Earnings before interest and taxes OR EBIT was $661 million in the quarter versus $406 million last year. In the soybean processing and refining segment, higher results were primarily driven by South America, reflecting stronger processing performance in Argentina and Brazil. North America also delivered higher results across both processing and refining in the destination value chain. Higher origination in Brazil was more than offset by lower processing results in Europe and Asia. Results in global Oil’s merchandising activities also increased reflecting strong execution. Higher process volumes were largely attributed to the combined company’s expanded production capacity in Argentina. Process volumes were also higher in North America and Brazil. Higher merchandise volumes reflected the combined company’s expanded soybean origination footprint. In the softseed processing and refining segment, results were higher across all regions. In Argentina, results increased in both processing and refining. In North America, higher processing results more than offset slightly lower refining results. In Europe, higher processing and biodiesel results more than offset lower refining results. Origination results in Canada and Australia increased reflecting our expanded footprint in large crops. Results from Global Oil’s merchandising activities also increased reflecting strong execution. Higher softseed process volumes primarily reflect the combined company’s increased production capacity in Argentina, Canada and Europe and higher merchandise volumes were driven by the company’s expanded softseeds origination footprint for the tropical oils and specialty ingredients segment. Higher results in Asia, Europe and Global oils merchandising activities were partially offset by lower results in North America. In the grain merchandising and milling segment, higher results in wheat milling, global cotton and commercial services were more than offset by lower results in ocean freight which was impacted by the significant spike in bunker fuel costs. Results in global grains merchandising were in line with the last year. Higher volumes primarily reflected the company’s expanded grain handling footprint and capabilities along with large global grain crops. Prior results included corn milling which was divested in 2025. The increase in corporate expenses was primarily driven by the addition of Viterra. The year over year comparison was also impacted by the timing of performance based compensation and a $15 million cash benefit received in 2025 related to a prior joint venture. Other results were in line with the prior year. Net interest expense of $136 million was up in the quarter compared to last year reflecting our expanded footprint in merchandising activities with the addition of Viterra partially offset by lower average net interest rates. Let’s turn to slide 6 where you can see our adjusted EPS and EBIT trends over the past four years along with the trailing 12 months. With the favorable biofuel environment, synergy capture and ramp up of inflight projects, the earnings trend is expected to improve Slide 7 details our capital allocation for the first quarter we generated $530 million of adjusted funds from operations. After allocating $95 million to sustaining CapEx, which includes maintenance, environmental health and safety, we had $435 million of discretionary cash flow available. We paid $136 million in dividends, invested approximately $240 million in growth and productivity related CapEx, and invested $105 million to acquire IFFs, soy protein concentrate and processing businesses. This results in a net use of $47 million. Moving to Slide 8, the quarter end readily marketable inventories or RMI exceeded net debt by approximately $400 million. Our adjusted leverage ratio, which reflects our adjusted net debt to adjusted EBITDA, was 1.6 times at the end of the first quarter versus 1.9 times at the end of 2025. Slide 9 highlights our liquidity position which remains strong. At the end of the first quarter we had committed credit facilities approximately $9.7 billion, all of which were unused and available. We also had essentially all of our $3 billion commercial paper program unutilized, providing ample liquidity to manage the ongoing capital needs of our larger combined company. Please turn to Slide 10 for the trailing twelve months, adjusted ROIC was 8% and ROIC was 6.7%. Adjusting for construction in progress in our large multi year projects and excess cash on our balance sheet, our adjusted ROIC would increase to 9% and ROIC to 7.2%. Moving to Slide 11 for the trailing 12 months, we produced discretionary cash flow of approximately $1.35 billion and a cash return on equity of 9.1% compared to our cost of equity of 7.2%. Please turn to Slide 12 and our 2026 outlook. Taking into account Q1 results, the current margin and macro environment of forward curves, we now Expect full year 2026 adjusted EPS in the range of $9 to $9.50, which is up from our previous range of $7.50 to $8. As Greg mentioned in his remarks, the environment remains complex. Forward curves in certain regions have reacted, but significant uncertainty remains, particularly in the second half of the year. For the full year, compared to our previous outlook, soybean and softseed processing and refining segment results are forecasted to be higher tropical oils and specialty ingredients and grain merchandising and milling segment results are expected to be lower and corporate and other results are expected to be in line. Additionally, we now expect the following for 2026 an adjusted annual effective tax rate in the range of 22 to 26%, which is down slightly from our previous expectation of 23 to 27% net interest expense in the range of 620 to $660 million, which is up from a previous range of 575 to 625 million, primarily due to higher short term debt levels, supporting an expected increase in working capital, capital expenditures in the range of 1.5 to $1.7 billion and depreciation and amortization of approximately $975 million. With that, I’ll turn things back over to Greg for some closing comments. Thanks John.

Greg Heckman (Chief Executive Officer)

So before we turn to Q and A, I just wanted to offer a few thoughts. The themes we laid out at Investor Day have not changed and this quarter reinforces them. Bunge today is stronger, more agile and better positioned than at any point in our history. We transformed our portfolio and strengthened our operating model with the integration of Viterra. We now have an unmatched global …

Full story available on Benzinga.com

This post was originally published here

Penske Automotive Group, Inc. (NYSE:PAG) shared its first-quarter financial results for 2026 on Wednesday morning. The international transportation services provider surpassed Wall Street expectations on both the top and bottom lines.

Penske Automotive Beats Earnings And Sales Estimates

The company reported quarterly adjusted earnings of $3.05 per share. This figure topped the analyst consensus estimate of $2.92. However, it represents a decrease from the $3.39 per share earned during the same period last year.

Quarterly sales reached $7.864 billion, comfortably beating the $7.708 billion analyst estimate. This marks a year-over-year increase from the $7.604 billion reported in the first quarter of 2025, according to

This post was originally published here

Blackbaud (NASDAQ:BLKB) released first-quarter financial results and hosted an earnings call on Wednesday. Read the complete transcript below.

Benzinga APIs provide real-time access to earnings call transcripts and financial data. Visit https://www.benzinga.com/apis/ to learn more.

The full earnings call is available at https://edge.media-server.com/mmc/p/9mdyh7dp/

Summary

Blackbaud reported solid execution and financial performance in Q1 2026, with a focus on efficiency and AI-driven product innovation.

The company achieved a 4.2% organic revenue growth to $281 million and a 20% increase in non-GAAP EPS to $1.14.

Blackbaud launched its first AgentIQ AI offering, indicating a strong future focus on AI capabilities to enhance customer engagement and operational efficiency.

Management reaffirmed its 2026 guidance, highlighting expected double-digit EPS growth driven by organic revenue growth and margin expansion.

The company continues to invest in AI and cybersecurity, aiming to leverage its extensive data and domain expertise for competitive differentiation.

Full Transcript

Tom Barth (Head of Investor Relations)

Good morning everyone. Thank you for joining us on Blackbaud’s first quarter 2026 earnings call. Joining me today on the call is Mike Ginnoni, Blackbaud CEO, President and Vice Chairman, and Chad Anderson, Blackbaud’s Executive Vice President and Chief Financial Officer. Please note that our comments today contain forward looking statements subject to risks and uncertainties that could cause actual results to differ materially from those projected. Please refer to our Most recent form 10K and other SEC filings for more information on those risks. Today’s discussion will focus on non GAAP results. Please refer to our press release and investor materials posted to our website for full details on our financial performance, including GAAP results, full year guidance and long term aspirational goals. We believe that a combination of GAAP and non GAAP measures provides a more representative view of how we measure our business. Unless otherwise specified, we will refer only to non GAAP financial measures on this call. Please note that non GAAP financial measures should not be considered in isolation from or as a substitute for GAAP measures. We’ve also provided a slide presentation with supplemental data and additional highlights and financial metrics. The earnings release supplemental tables and presentation are available in the Investor Relations section of our website on blackbaud.com and with that, let me turn the call over to you Mike.

Chad Anderson (Executive Vice President and Chief Financial Officer)

Thank you, Tom. Good morning, everyone. We appreciate you joining today. We delivered solid execution against our operating plan plan to start 2026 with a continued focus on efficiency and a strong pace of product innovation. AI enablement remains key to our success, both in terms of the capabilities we are delivering to customers and in the way Blackbaud is operating. We continue to invest aggressively in innovation to produce meaningful product enhancements throughout our portfolio, portfolio, including generative and agentic AI capabilities. Our products enable our customers to dramatically improve engagement levels, raise more money and lead their organizations while increasing operational efficiency, ultimately allowing them to spend more time executing on their missions and less time on administrative tasks. No company can better help our customers deliver on their meaningful missions than Blackbaud. Blackbaud brings nearly 45 years of specialized domain expertise serving as a system of record for our customers with deeply embedded workflows purpose built for the social impact sector. Further, we have invested and continue to invest heavily in cybersecurity and AI governance to help ensure that our customers data remains secure and that our AI solutions use data responsibly. Many organizations in our vertical markets have limited IT resources and face turnover and staffing shortages. We win because our solutions are intuitive, require fewer complex customizations and integrations and translate advances like AI into practical outcomes customers can trust, building confidence that is supporting longer contract terms at renewal. As I mentioned last quarter, over 20% of our customers are on four year or longer term contract terms. This quarter we continue to see a nice mix of new customer logo wins and selling additional solutions to our existing customers. Several examples of new logos were competitive displacements across many of our verticals. This includes several private K-12 schools that purchased our Total school solution, a performing arts center who moved to Financial Edge NXT and Advisory plus to unlock potential donors and meet their expansive goals, a well known veterans organization which replaced a fragmented siloed fundraising environment with our end to end solution, allowing a better view of their donors and improving their collaboration across their fundraising team and a UK based nonprofit buying Raiser’s Edge NXT as part of a wider digital transformation project and now can benefit from our AI innovation and solutions. To be clear, we are all in on AI and are confident that AI strengthens our ability to deliver differentiated solutions and drive future growth as well as also improving how we run Blackbaud while in the first quarter our first Agent IQ AI offering, the fundraising Development Agent, launched into general availability ahead of schedule. We’re still early stages of broader commercialization which we view as potential upside over time as we make guidance and investment decisions. Our engineering teams are using leading generative AI tools such as Microsoft, GitHub, Copilot, Anthropic, Claude, and other approved solutions to accelerate development, reduce time to remediate software issues and increased throughput on new product delivery. We’re also expanding generative AI features across our portfolio including blackbaud AI Chat which provides contextual answers and can initiate actions within workflows. Blackbaud AI Chat, is differentiated because it’s embedded within our systems of record, leveraging customer permissioned data, Blackbaud specific data and years of social good benchmarks within a governed environment. Our competitive differentiation is clear. We have a data moat, one of the most robust sets of philanthropic and social impact data processed and secured in real time combined with decades of domain expertise. Native integrations across systems of record engagement, financial accounting and intelligence further strengthen that advantage. These AI capabilities are seeing strong adoption momentum. Usage of AI powered workflows has expanded meaningfully over the past several quarters and more than half of our Raiser’s Edge NXT customers use machine learning enabled donor prospecting, generating nearly 30 billion predictions annually and creating a feedback loop that improves outcomes across our customer base. These capabilities are powered by an extensive and diverse set of data sources including blackbaud Institute survey and benchmarking data, license data sets from leading providers, identity resolution capabilities and specialized philanthropic data sets such as blackbaud Giving Search. Our Applied Intelligence layer aggregates behavioral signals across the ecosystem to feed predictive analytics and advanced AI models. Supported by strong governance, cybersecurity and a focus on data integrity, we have embedded new agentic AI solutions in our products that can operate with appropriate access to customer permissioned data and workflows. Agents for Good is a new product category for Blackbaud and as I mentioned earlier in Q1 we launched our first agent for good solution, the Blackbaud Fundraising Development Agent, which is an agentic virtual team member member that can proactively take on complex tasks, workflows and initiatives while operating within strong governance and oversight by power users. This agent, natively embedded within the trusted blackbaud environment, enables teams to identify and steward donors that they do not have the capacity to reach today, unlocking new revenue streams at a fraction of the cost possible in the past. This fundraising development agent is a new revenue line and a significant accomplishment for blackbaud to frame this a bit. The pricing model is an annual subscription fee similar to the majority of our products. It’s still early, but we expect the price will be in the tens of thousands per year and we expect to cross sell subscriptions to thousands of existing customers in addition to new logo sales. Applicable donations raised by the development agent would be processed through blackbaud integrated payments platform, driving additional transactional revenue. This new development agent is already producing results for our early adopter customers and is now commercially available with several new customers in Q1. Additionally, we have run a number of webinars and sales events for existing customers where attendance was oversubscribed and the reception was enthusiastic. We couldn’t be more pleased and this development agent is the first of many agents …

Full story available on Benzinga.com

This post was originally published here

Daqo New Energy (NYSE:DQ) held its first-quarter earnings conference call on Wednesday. Below is the complete transcript from the call.

This content is powered by Benzinga APIs. For comprehensive financial data and transcripts, visit https://www.benzinga.com/apis/.

Access the full call at https://event.choruscall.com/mediaframe/webcast.html?webcastid=iLpvzzAF

Summary

Daqo New Energy reported a net loss of $88.4 million in Q1 2026, compared to a net loss of $7.3 million in Q4 2025, primarily due to decreased sales volumes and increased provisions for inventory impairment.

The company maintained a strong balance sheet with cash and equivalents totaling $559.4 million and zero debt, providing liquidity to navigate market challenges.

Production exceeded guidance with 43,402 metric tons of polysilicon produced, though sales volume declined due to low market prices.

Daqo New Energy expects Q2 2026 polysilicon production to be between 35,000 and 40,000 metric tons, with full-year guidance remaining at 140,000 to 170,000 metric tons.

Management is optimistic about future market recovery and aims to maintain competitive advantage through technology and cost optimization, despite current industry overcapacity and geopolitical tensions.

Full Transcript

OPERATOR

Good day and welcome to the Dawnergy first quarter 2026 results conference call all participants will be in listen only mode. Should you need assistance, please signal a conference specialist by pressing the star key followed by zero. After today’s presentation, there will be an opportunity to ask questions. To ask a question, you may press star then one on a touchtone phone. To withdraw your question, please press Star then two. Please note this event is being recorded. I would now like to turn the conference over to Jesse Zhao, Director of Investor Relations. Please go ahead.

Jesse Zhao (Director of Investor Relations)

Hello everyone. I’m Jesse Zhao, the Investor Relations Director of Daqo New Energy. Thank you for joining our conference call today. Daco New Energy just issued its financial results for the first quarter of 2026 which can be found on our website at www.daqosolar.com. today, attending the conference call, we have our Deputy CEO, Ms. Anita Xu, our CFO, Mr. Mingyang and myself. Our Chairman and CEO, Mr. Xiang Xu is on a business trip now, so Ms. Anita Xu will deliver our management remarks on behalf of Mr. Xiang Xu. Today’s call will begin with an update from Mr. Xu on market conditions and company operations and then Mr. Yang will discuss the company’s financial performance for the quarter. After that, we will open the floor to Q and A from the audience. Before we begin the formal remarks, I would like to remind you that certain statements on today’s call, including expected future operational and financial performance and industry growth are forward looking statements that are made under the safe harbor provisions of the U.S. private securities led Litigation Reform act of 1995. These statements involve inherent risks and uncertainties. A number of factors could cause actual results to differ materially from those contained in any forward looking statement. Further information regarding this and other risks is included in the reports or documents we have filed with or furnished to the securities and Exchange Commission. These statements only reflect our current and preliminary view as of today and may be subject to change. Our ability to achieve these projections is subject to risks and uncertainties. All information provided in today’s call is as of today and we undertake no duty to update such information except as required on the applicable rule. Also during the call, we will occasionally reference monetary amounts in US dollar terms. Please keep in mind that our 5 functional currency is the Chinese RMB. We offer these translations into US dollars solely for the convenience of the audience. Now I will turn the call to our Deputy CEO, Ms. Anita Xu. Ms. Hsu, please go ahead.

Anita Xu (Deputy CEO)

Thank you, Jesse. Hello everyone, this is Anita. I’ll now deliver our management remarks on behalf of our CEO, Mr. Xiang Xu in the first quarter of 2026, market sentiment across the solar PV industry remained cautious amid seasonal softness and elevated inventory levels. It was further exacerbated by rising module prices driven by higher silver, aluminum and glass costs, which led to market slowdown in China. Geopolitical tensions in the Middle east also weighed on end market demand in the region. Against this backdrop, persistent industry overcapacity continued to exert downward pressure on polysilicon prices, resulting in quarterly operating and net losses. Notwithstanding these headwinds, we continue to maintain a robust and healthy balance sheet with zero debt. As of March 31, 2026, we held a cash balance of US$559.4 million, short term investments of US$288.3 million, bank notes receivable of 20.8 million, held-to-maturity investment of 50.3 million and a fixed term bank deposit balance of US$1.1 billion. In total, these assets that can be converted into cash stood at US$2 billion, providing us with ample liquidity. This solid financial position gives us the confidence and strategic flexibility to navigate the current market downturn. On the operational front, we continue to take proactive measures to navigate challenging market conditions and weak selling prices. With name plate capacity utilization rate operating at about approximately 57%, total production volume at our two Polysilicon facilities was 43,402 metric tons for the quarter, exceeding our guidance range of 35,000 metric tons to 40,000 metric tons. With market prices for polysilicon experiencing a notable decline to be below production costs during the quarter, we adhered to the Chinese Authority self regulation guidelines but declining to increase engaged in below cost sales, we adopted a disciplined wait and see approach pending further implementation of the national anti evolution policies we highlighted last quarter. As a result, our sales volume dropped to 4,482 metric tons while average selling price increased 2.3% sequentially to 5.96 US dollar per kg. On the cost side, total production and cash cost increased marginally by 2% and 3% respectively on a sequential basis primarily driven by exchange rate movements. However, despite higher silicon metal costs, manufacturing costs in R and B terms actually declined slightly on a sequential basis, reflecting our continued improvements in manufacturing efficiency. In light of the current market dynamics, we expect total polysilicon production volume in the second quarter of 2026 to be approximately 35,000 metric ton to 40,000 metric tons. For the full year of 2026, we expect production volume to remain in the range of 140,000 to 170,000 metric tons with the solar market impacted by seasonality surrounding the Chinese New Year holiday and the absence of concrete updates, capacity rationalization policies, capacity transactions and shipment volumes remained low during the quarter. Intact Polysilicon prices dropped from 48 to 55 RMB per kg at the end of 2025 to 35 to 37 RMB per kg by the end of the first quarter. However, Polsicum prices heading into the second quarter are showing signs of bottoming out with weekly declines gradually easing. While producers awaited clear guidance guidelines from authorities to tackle the capacity, a weak demand outlook and industry inventory buildup and financial pressure forced several peers to adjust their production pricing strategies toward a more market oriented approach. As a result, industry level policy monthly supply fell to approximately 93,000 metric times in the quarter, representing an industry average utilization rate of just 39%. Looking ahead, we expect government authorities to strengthen the anti evolution policies necessary to address these industry wide overcapacity issues. As an encouraging move April 17, the Ministry of Industry and Information Technology, the National Development and Reform Commission, the State Administration for Market Regulation, the National Energy Administration and other key national departments showing you how the symposium on regulating market competition within the solar PV sector, reinforcing the urgent need to address irrational competition and curb destructive evolution. Additionally, all relevant authorities are not required to deploy concerted measures to strengthen industry governance and promote the high quality development of the solar PV industry, including in respect of capacity regulations, standards, guidelines.

OPERATOR

Pardon me, ladies and gentlemen, it’s appeared we’ve lost connection to our speakers. Please stand by while we reconnect. Pardon me, this is the operator. We have reconnected the speakers and will continue. Please proceed.

Anita Xu (Deputy CEO)

Okay, okay, thank you. Sorry, apologies, my line got disconnected. So, continuing with the April 17 symposium, all relevant authorities are now required to deploy concerted measures to strengthen industry governance and promote the high quality development of the solar PV industry, including in respect of capacity, regulation, standards guidance, innovation driven development, price, law enforcement, quality supervision, mergers and acquisitions and intellectual property rights protection. More broadly, the solar PV industry continues to exhibit compelling long term growth prospects. Growing vulnerabilities in global energy markets have sparked widespread concerns about national energy security in which the solar PV and renewable energy sectors can play a crucial role. As one of the world’s lowest cost producers of the highest quality N type pulse silicon, backed by a robust balance sheet and zero debt, we remain optimistic about the sector and are well positioned to capitalize on the anticipated market recovery and long term growth opportunities. We’ll continue to strengthen our competitive edge through advancements in high efficiency N type technologies and cost optimization via digital transformation AI adoption. As the world accelerates its transition to clean energy, we are confident in our ability to play a leading role in shaping that future. So now I’ll turn the call to our CFO, Mr. Ming Yang, who will discuss the company’s financial performance for the quarter min. Please go ahead.

Ming Yang (Chief Financial Officer)

Thank you Anita and hello everyone. This is Ming Yang, CFO of Daqo New Energy. We appreciate you joining our earnings conference call today. I will now go over the company’s first quarter 2026 financial performance. Revenues were 26.7 million compared to 221.7 million in the fourth quarter of 2025 and 124 million in the first quarter of 2025. The decreasing revenue compared to the fourth quarter of 2025 was primarily due to a decrease in sales volumes. The company reduced sales in light of the relatively low selling prices. Gross loss was 139.4 million compared to a gross profit of 15.4 million in the fourth quarter of 2025 and gross loss of 81.5 million in the first quarter of 2025. Gross margin was negative 521% compared to 7% in the fourth quarter of 2025 and negative.65 point in the first quarter of 2025. The decrease in gross margin compared …

Full story available on Benzinga.com

This post was originally published here

U.S. equities rallied strongly this month, with the benchmark S&P 500 Index heading for its strongest monthly performance since November 2020, surging over 9% so far in April.

SPDR S&P 500 ETF Trust (NYSE:SPY), which tracks the S&P 500 Index, mirrored the rally and reached new highs. It has gained 9.6% so far this month.

Semiconductor Stocks Lead The Charge

In a Tuesday post on X, The Kobeissi Letter said: “This rally has been driven by semiconductor stocks, which are up 37.2% month-to-date.”

The Philadelphia Semiconductor Index notched 18 straight sessions of gains, the longest winning streak on record, last week amid a wave of blowout earnings and analyst upgrades.

The so-called “Magnificent Seven” cohort has also contributed to gains, rising over 16% in April.

The S&P 500 has already notched 10 all-time highs so far in 2026, underscoring how quickly sentiment has flipped from March’s slide.

The sharp rally follows a …

Full story available on Benzinga.com

This post was originally published here

On Wednesday, President Donald Trump expressed his frustration over Iran’s inability to finalize a deal, emphasizing the need for the country to “get smart soon.”

Trump took to his Truth Social platform and said: “Iran can’t get their act together. They don’t know how to sign a nonnuclear deal. They better get smart soon,” he wrote.

He also attached a picture of himself wielding a weapon in a battlefield with the words: “NO MORE MR. NICE GUY!”

data-variant=”card”
data-news-mode=”manual”

>


Read Also:

Treasury Warns Banks Of Sanctions Over Chinese Refineries Buying Iranian Oil, As Scott Bessent Flags Tehran’s $170 Million Daily Loss

This post was originally published here

Lithia Motors Inc. (NYSE:LAD) reported first-quarter 2026 financial results Wednesday, topping analyst expectations on both the top and bottom lines despite a year-over-year dip in adjusted profits.

Earnings And Revenue Performance

The Medford-Oregon-based auto retailer posted adjusted diluted earnings of $7.34 per share. This figure surpassed the analyst consensus estimate of $6.83. However, it marked a decrease from the $7.93 per share reported in the prior-year period.

Quarterly sales reached $9.271 billion, edging past the estimated $9.222 billion. This represents a slight climb from the $9.178 billion recorded during the same period last year, according to Benzinga Pro.

Used Vehicle …

Full story available on Benzinga.com

This post was originally published here

Ford Motor Company (NYSE:F) will release earnings for its first quarter after the closing bell on Wednesday, April 29.

Analysts expect the Dearborn, Michigan-based company to report quarterly earnings of 19 cents per share, up from 14 cents per share in the year-ago period. The consensus estimate for Ford’s quarterly revenue is $38.93 billion (it reported $37.42 billion last year), according to Benzinga Pro.

The company has topped analyst estimates for revenue in four straight quarters and in seven of the last 10 quarters overall.

Ford shares fell 0.7% to close at $12.40 on Tuesday.

Benzinga readers can access the latest analyst ratings on the Analyst Stock Ratings page. Readers can sort by stock ticker, company name, analyst firm, rating change or other variables.

Let’s have a look at how Benzinga’s most-accurate …

Full story available on Benzinga.com

This post was originally published here

TORONTO, April 29, 2026 /CNW/ – Global X Investments Canada Inc. (“Global X” or the “Manager“) is pleased to announce today’s launch of the Global X Space Tech Index ETF (“ORBX” or the “ETF“), an ETF designed to provide targeted exposure to companies driving the growth and commercialization of the global space economy, including space technologies and components, launch and orbital services, space exploration and tourism, and satellite-enabled communications and data services.

With today’s launch, ORBX is the only Canadian-listed ETF focused on the space economy. Units of the ETF begin trading today on the Toronto Stock Exchange (“TSX“) under the ticker symbol ORBX.

The Space Economy

The global space economy was once a speculative frontier dominated by national governments, but it is rapidly transitioning into a potential $1 trillion revenue opportunity driven by commercial activity. Advances in launch technology, satellite miniaturization, reusable rockets, robotics, and data analytics have made space-based applications more viable than at any point in history.

Reusable rocket technology has dramatically lowered the cost of reaching orbit, enabling new business models across launch services, satellite networks, and downstream data and connectivity applications. Active satellites in orbit have grown from approximately 1,000 in 2010 to more than 12,000 in 2025, with estimates suggesting this figure could approach 100,000 by 2030. By 2035, the satellite broadband market alone is projected to grow at a 16% compound annual growth rate to approximately $100 billion.

The high-profile IPO candidates on the horizon and the successful Artemis II mission are powerful reminders that the space economy is entering a more commercial, more visible and more investable phase,” said Chris McHaney, Executive Vice President, Investment Management & Strategy at Global X. “Space innovation is increasingly tied to real-world infrastructure, including global broadband, secure communications, Earth observation, launch services and advanced components. ORBX gives Canadian investors a targeted way to access the public companies enabling that growth across the global space value chain.

More details on ORBX are outlined in the table below:

ETF Name

Currency

Unit Type

Ticker
Symbol

Target
Exposure

Exchange

Full story available on Benzinga.com

This post was originally published here

Key Takeaways

  • A major portion of China’s massive $1.2 trillion trade surplus is flowing into the Hong Kong stock market, according to a Caixin analysis
  • The recent passing of legendary investor Mark Mobius underscores a reality that an old guard of early China bulls is dying out and not being replaced

image credit: Bamboo Works

We’re currently witnessing a pair of fascinating developments in the Chinese equities space. A recent analysis by Caixin suggests that a significant portion of China’s $1.2 trillion trade surplus is unexpectedly flowing into the Hong Kong stock market. At the same time, the death of celebrity investor Mark Mobius this month highlights a broader trend: the legendary China bulls of the past are fading away, and they aren’t being replaced. These two stories underscore a profound shift in the Chinese market — one driven by surprising internal capital flows, the other by a structural decline in Western investor optimism.

Caixin’s analysis shows that instead of going into China’s forex reserves or domestic infrastructure building, a massive chunk of the country’s export surplus is being funneled directly into Hong Kong equities. This is a fascinating revelation. If hundreds of billions of dollars from China’s export machine — which really is just thousands of individual companies — are flowing into this offshore market, it helps explain the exchange’s prolonged rally and how it’s been able to effortlessly absorb so many fairly large IPOs from Mainland firms.

Inevitably, some of this surplus is being used by companies expanding overseas to build manufacturing plants in Southeast Asia, Europe, and Latin America. Yet, a substantial amount is still hitting the stock market. From a broader macro standpoint, one might wonder what this means for the Chinese …

Full story available on Benzinga.com

This post was originally published here

U.S. stock futures were higher this morning, with the Nasdaq 100 futures gaining around 100 points on Wednesday.

Shares of Robinhood Markets Inc (NASDAQ:HOOD) fell sharply in pre-market trading after the company reported worse-than-expected first-quarter financial results.

Robinhood reported first-quarter revenue of $1.07 billion, up 15% year-over-year. The revenue total missed a Street consensus estimate of $1.18 billion, according to data from Benzinga Pro. The company reported earnings per share of 38 cents in the quarter, missing a Street consensus estimate of 46 cents per share.

Robinhood shares dipped 10.7% to $73.30 in pre-market trading.

Here are some other stocks moving lower in pre-market trading.

  • O-i Glass, Inc (NYSE:OI) fell 20.9% to $8.10 in pre-market trading after the company reported mixed first-quarter …

Full story available on Benzinga.com

This post was originally published here

Investor Paul Tudor Jones highlighted the potential economic crisis that could be triggered by the U.S. economy’s growing dependency on equity prices.

Jones, in a podcast with Patrick O’Shaughnessy on Tuesday, pointed out that the U.S. is more reliant on equity prices “than ever,” with the stock market cap currently standing at 252% of GDP. This is a significant increase from the 65% in 1929 and 170% in 2000.

He suggested that a mean reversion to the past 25 or 30-year PE could result in a 30-35% crash. As a result, 10% of the American tax revenues, which come from capital gains, would be reduced to “zero.” Such a correction, Jones warned, could severely impact the economy, potentially causing a budget deficit blow-up and a hit to the bond market.

Furthermore, Jones noted that the U.S. is “over-equitized,” with the highest individual equity weightings in the country’s history. He also highlighted that the proportion of private equity in institutional portfolios has increased from 7% in 2007-2008 to 16% currently, making the market much more …

Full story available on Benzinga.com

This post was originally published here

Snap Inc. (NYSE:SNAP) is approaching historic financial and user growth milestones, driven by surging subscription numbers and an aggressive pivot toward artificial intelligence (AI) and augmented reality hardware.

A ‘Crucible Moment’ For Snap’s Bottom Line

In a recent Stripe podcast interview, Snap CEO Evan Spiegel outlined a bullish trajectory for the camera and messaging company, characterizing the lead-up to 2026 as a pivotal era.

“We’ve described it as the crucible moment,” Spiegel said, noting that the company is currently “on the verge of net income profitability, which is really exciting for us.”

A significant driver of this financial turnaround is the rapid expansion of Snap’s non-advertising income streams. Spiegel revealed that the company’s direct revenue business, primarily fueled by its premium subscription service, has achieved remarkable scale.

“We just announced we hit 25 million Snapchat+ subscribers, over a billion run rate on the direct revenue business,” he stated. This revenue diversification is providing a crucial financial cushion as Snap invests heavily in computationally expensive AI development and custom hardware.

The $500M Savings Plan: Layoffs And New CFO

To guarantee this profitable trajectory, Snap is executing an aggressive cost-reduction strategy. The company recently announced the impending May departure of long-time CFO Derek Andersen, who will be succeeded by Doug Hott.

Alongside this executive transition, Snap is cutting approximately …

Full story available on Benzinga.com

This post was originally published here

Nucor Corp.‘s (NYSE:NUE) strong start to 2026, along with strong first-quarter earnings, has propelled the stock’s Benzinga Edge momentum score to new heights.

Momentum Reaches The Top Tier

Over the past week, the steelmaker’s momentum ranking surged from an 88.46 to a 91.73 percentile. This momentum metric measures a stock’s relative strength based on its price movement patterns and volatility over multiple timeframes, ranked as a percentile against other stocks.

This technical breakout directly reflects Nucor’s impressive market performance in 2026. This coincides with Nucor demonstrating positive Benzinga Edge Stock Rankings‘ price trends across short, medium, and long-term durations.

Benzinga Edge Stock Rankings for NUE.

data-variant=”card”
data-news-mode=”manual”

>


Read Also:

Microsoft Stock’s Quality Score Spikes As Truist Sees 59% Upside Amid AI Strategy Shift

This post was originally published here

On CNBC’s “Halftime Report Final Trades,” Joshua Brown, co-founder and CEO of Ritholtz Wealth Management, named Apple Inc. (NASDAQ:AAPL) ahead of quarterly earnings.

Apple will release earnings results for the second quarter, after the closing bell on Thursday, April 30. Analysts expect the company to report quarterly earnings at $1.94 per share on revenue of $109.72 billion.

Brian Belski, founder, CEO & chief investment officer at Humilis Investment Strategies, picked Waste Connections Inc (NYSE:WCN).

Supporting his view, Waste Connections reported better-than-expected first-quarter financial results on April 22. Waste Connections reported quarterly earnings of $1.23 per share, which beat the analyst consensus estimate of $1.18 per share. The company reported quarterly …

Full story available on Benzinga.com

This post was originally published here

Bitcoin trades above $77,000 on Wednesday morning, supported by optimism following remarks from the SEC chair at the Bitcoin 2026 event.

Bitcoin ETFs saw $89.7 million in net outflows on Tuesday, while Ethereum ETFs reported $21.8 million in net outflows.  


Cryptocurrency

Ticker

Price
Bitcoin (CRYPTO: BTC) $77,620.71
Ethereum (CRYPTO: ETH) $2,334.55
Solana (CRYPTO: SOL) $85.32
XRP (CRYPTO: XRP) $1.39
Dogecoin (CRYPTO: DOGE) $0.1100
Shiba Inu (CRYPTO: SHIB) $0.056473

Meme coin market capitalization is down 2.8% to …

Full story available on Benzinga.com

This post was originally published here

Bitcoin (CRYPTO: BTC) is up roughly 20% from its February lows, and Bitwise Chief Investment Officer Matt Hougan says Strategy Inc. (NASDAQ:MSTR) chairman Michael Saylor is the single biggest factor behind the move.

Strategy Added $7.2 Billion In 8 Weeks

Strategy purchased $7.2 billion of Bitcoin over the past eight weeks, outpacing the $3.8 billion in ETF inflows since March 1. 

The purchases were financed entirely by issuing STRC, Strategy’s perpetual preferred stock currently yielding 11.5% annually.

Hougan explained that Strategy’s goal with STRC is to have it trade at $100 per share while offering high dividend yields. 

The company maintains that price by adjusting the yield up or down. If STRC trades below $100, Strategy can increase the interest rate to attract buyers. If it trades above $100, Strategy can issue more shares …

Full story available on Benzinga.com

This post was originally published here

Robinhood Markets Inc. (NASDAQ:HOOD) missed Wall Street’s first-quarter estimates, even as revenue climbed and customer deposits stayed strong.

On Tuesday, the brokerage posted first-quarter revenue of $1.07 billion, up 15% from a year earlier but below analysts’ expectations of $1.18 billion.

Cryptocurrency revenue came in at $134 million, declining 47% from the year-ago period.

“I want to get away from talking about the price of Bitcoin or all of the other native crypto assets,” said CEO Vladimir Tenev during the quarterly conference call. “Our strategy is to take crypto infrastructure and apply it to assets that have real-world utility. That’s why we care so much about tokenization.”

This content is powered by Benzinga APIs. For comprehensive financial data …

Full story available on Benzinga.com

This post was originally published here

On Tuesday, venture capitalist Chamath Palihapitiya said the software industry risks missing a deeper productivity problem as companies prioritize faster coding through AI while neglecting the reasoning behind engineering decisions.

AI Coding Speed Vs Engineering Context

In a post on X, Palihapitiya argued that the “missing layer” in software engineering is not coding speed but structured documentation of decision-making context.

“The missing layer in successful software development usually isn’t writing code faster but, rather, documenting the reasoning and shared context behind the decisions you made,” he wrote.

Palihapitiya said critical architectural choices are often scattered across Slack threads, ticketing systems, or remain in individuals’ minds, limiting how much knowledge a team can collectively build over time.

“This means that the individual may get faster, but the team’s collective knowledge doesn’t compound,” he said.

He added that without capturing this “why” layer, teams risk repeatedly solving the same problems and failing to scale understanding across projects and new contributors, including AI tools.

He also described an ideal future development …

Full story available on Benzinga.com

This post was originally published here

Top Wall Street analysts changed their outlook on these top names. For a complete view of all analyst rating changes, including upgrades and downgrades, please see our analyst ratings page.

  • Baird cut the price target for Qiagen N.V. (NYSE:QGEN) from $53 to $43. Baird analyst Catherine Schulte upgraded the stock from Neutral to Outperform. Qiagen shares closed at $34.02 on Tuesday. See how other analysts view this stock.
  • Evercore ISI Group slashed Armstrong World Industries Inc (NYSE:AWI) price target from $203 to $200. Evercore ISI Group analyst Stephen Kim upgraded the stock from In-Line to Outperform. Armstrong World shares closed at $169.84 on Tuesday. See how other analysts view this stock.
  • Stifel raised price target for Crane Co (NYSE:CR) from $200 to $215. Stifel analyst Nathan Jones upgraded the stock from Hold to Buy. Crane shares closed at $177.93 on Tuesday. See how other analysts view this stock.
  • BTIG raised the price target for A10 …

Full story available on Benzinga.com

This post was originally published here

General Motors Co. (NYSE:GM) on Tuesday announced that it was rolling out Alphabet Inc.‘s (NASDAQ:GOOGL) (NASDAQ:GOOG) artificial intelligence model Google Gemini for over 4 million vehicles in the U.S. across its lineup via an update in the coming months.

In an official statement, GM shared that the company will be rolling out the AI model to all of the GMC, Cadillac, Buick and Chevrolet vehicles starting from the 2022 model year with Google Built‑in. “With Gemini, you can speak naturally without memorizing commands or repeating context,” the statement said.

data-variant=”card”
data-news-mode=”manual”

>


Read Also:

Pentagon AI Chief Confirms Google Gemini’s Growing Role In Classified Defense Work While Anthropic Remains Shut Out: ‘Overreliance On One Vendor…’

This post was originally published here

The most oversold stocks in the communication services sector presents an opportunity to buy into undervalued companies.

The RSI is a momentum indicator, which compares a stock’s strength on days when prices go up to its strength on days when prices go down. When compared to a stock’s price action, it can give traders a better sense of how a stock may perform in the short term. An asset is typically considered oversold when the RSI is below 30, according to Benzinga Pro.

Here’s the latest list of major oversold players in this sector, having an RSI near or below 30.

Charter Communications Inc (NASDAQ:CHTR)

  • On April 24, Charter Communications reported worse-than-expected first-quarter EPS results. “We remain confident about our ability to win in the marketplace and grow over the longer term. That confidence is founded on our advanced network, our core operating strategy of delivering great products at great prices and our focus on …

Full story available on Benzinga.com

This post was originally published here

Elon Musk on Tuesday shared his views on SpaceX’s reported pay package, which could be tied to the colonization of Mars and orbital datacenters.

Good Deal, Says Elon Musk

User @beffjezos quoted a post on X that shared details about the purported pay package. The user predicted what Musk’s SpaceX package could look like. “$10T if we reach Kardashev Type I,” the user shared and “$1000T if we reach Kardashev II,” they added.

data-variant=”card”
data-news-mode=”manual”

>


Read Also:

Elon Musk To Retain Dominant Voting Power In SpaceX Post-IPO, Buys $1.4 Billion Worth Of Shares: Report

This post was originally published here

Alphabet Inc. (NASDAQ:GOOGL) (NASDAQ:GOOG) will release earnings for its first quarter after the closing bell on Wednesday, April 29.

Analysts expect the Mountain View, California-based company to report quarterly earnings of $2.67 per share. That’s down from $2.81 per share in the year-ago period. The consensus estimate for Alphabet’s quarterly revenue is $107.03 billion (it reported $90.23 billion last year), according to Benzinga Pro.

Google will invest $10 billion in AI startup Anthropic, with a potential additional $30 billion tied to performance milestones, according to a report published on Friday.

Shares of Alphabet fell 0.2% to close at $349.78 on Tuesday.

Benzinga readers can access the latest analyst ratings on the Analyst Stock Ratings page. Readers can sort by stock ticker, company name, analyst firm, rating …

Full story available on Benzinga.com

This post was originally published here

Hedge fund billionaire Ken Griffin has questioned whether wealthy individuals truly understand the risks of investing in private credit, warning they may struggle to access their money in a downturn.

Griffin, founder of $67 billion hedge fund Citadel and trading firm Citadel Securities, made the comments in an interview with the Financial Times, as the private credit industry faces mounting redemption pressures and growing concerns over bad loans.

Liquidity Mismatch At The Core

“The real issue here is the liquidity mismatch between the wealthy investors and the duration of the investments,” Griffin said. “We live in a world where investors have become accustomed to having immediate liquidity for their investments — investing in private credit is a different story.”

Griffin also questioned whether wealthy investors fully grasped what they were buying into. “Retail was viewed as a phenomenal channel from which to raise assets,” he said. “But did the retail investors really understand the nature of the investment they were making?”

The private credit industry comprising funds that make direct loans to private equity-owned companies, has more than $3.5 trillion in assets, according to the Alternative Investment Management Association.

Firms including Blackstone (NYSE:BX), Apollo Global Management

Full story available on Benzinga.com

This post was originally published here

During times of turbulence and uncertainty in the markets, many investors turn to dividend-yielding stocks. These are often companies that have high free cash flows and reward shareholders with a high dividend payout.

Benzinga readers can review the latest analyst takes on their favorite stocks by visiting Analyst Stock Ratings page. Traders can sort through Benzinga’s extensive database of analyst ratings, including by analyst accuracy.

Below are the ratings of the most accurate analysts for three high-yielding stocks in the financial sector.

Golub Capital BDC Inc (NASDAQ:GBDC)

  • Dividend Yield: 11.18%
  • RBC Capital analyst Kenneth Lee initiated coverage on the stock with an Outperform rating and a price target of $15 on April 17, 2026. This analyst has an accuracy rate of 62%
  • Wells Fargo analyst Finian O’Shea maintained an Overweight rating and cut the price target from $14 to $13 on Feb. 6, 2026. This analyst has an accuracy rate of 62%.
  • Recent News: Golub Capital BDC announced that it will report its financial results for the second quarter on Monday, …

Full story available on Benzinga.com

This post was originally published here

Daniel Newman, CEO of Futurum Group, suggested that Microsoft‘s (NASDAQ:MSFT) Q3 earnings may hold a surprise.

Newman took to X on Tuesday to highlight CEO Satya Nadella‘s announcement of Copilot deployment to about 743,000 Accenture (NYSE:ACN) employees.

Nadella called it the “largest” rollout of the AI-driven tool to date. The deployment began in 2023 and has since scaled with 89% monthly active usage.

“MSFT Copilot Numbers may surprise this quarter?” wrote Newman.

Accenture’s chief information officer, Tony Leraris, describes Copilot as a “personal digital colleague”. A 2025 company study of 200,000 users found 97% completed routine tasks up to 15× faster with Copilot, while 53% reported major productivity gains.

data-variant=”card”

This post was originally published here

TORONTO, April 29, 2026 /CNW/ – CIBC (TSX:CM) (NYSE:CM) – CIBC Global Asset Management (CIBC GAM) today announced the expansion of its target maturity bond funds with the launch of five new CIBC Investment Grade Bond Funds and two new laddered funds (CIBC 1-5 Year Laddered Investment Grade Bond Fund and CIBC 1-5 Year U.S. Laddered Investment Grade Bond Fund) – each available in Series A, Series F and Series O.

Additionally, all new funds offer ETF series units with the exception of the CIBC 1-5 Year U.S. Laddered Investment Grade Bond Fund. These ETF Series units have completed their initial offering and are now available for trading on Cboe Canada.

“Building on the success of our CIBC Investment Grade Bond Funds, we are pleased to expand our lineup of target maturity funds to help investors achieve their shorter-term savings goals,” said Eric Bélanger, President and Chief Executive Officer, CIBC Global Asset Management. “The new CIBC 1-5 Year Laddered Investment Grade Bond Funds offer pre-built bond laddering, providing regular …

Full story available on Benzinga.com

This post was originally published here

On Tuesday, U.S. drivers faced the steepest pump prices in about four years as the Iran conflict and stalled diplomacy kept crude markets tight. The average cost of a gallon of gasoline hit $4.23, a level not seen since April 2022, according to AAA.

Pump prices are up more than 40% since the fighting began in late February. United States Gasoline ETF (NYSE:UGA), which allows investors to make a direct play on gasoline, gained about 2% on Tuesday.

Why Gas Prices Are Surging Again

The milestone came as negotiations around the reopening of the Strait of Hormuz and constraints tied to Iran’s nuclear program remained stuck. This will continue to disrupt oil flows through the Hormuz, which handles about one-fifth of global shipments, and send oil prices soaring.

Oil is doing most of the heavy lifting behind the jump, since crude makes up about 51% of what drivers pay at the pump, according to the CBS

Full story available on Benzinga.com

This post was originally published here

Tesla Inc.‘s (NASDAQ:TSLA) Chinese rivals BYD Co. Ltd. (OTC:BYDDY) (OTC:BYDDF) and Geely Automobile Holdings Ltd. (OTC:GELYF) (OTC:GELHY) reported declining profits amid slowing demand and fluctuating foreign exchange.

BYD Reports Profit Decline

On Tuesday, BYD released its quarterly financial report, sharing that its profits plunged 55% as profits of over $594 million were reported attributable to shareholders in the company. BYD’s Q1 revenue was around $21.97 billion, down 11.82% YoY from the same period in 2025.

data-variant=”card”
data-news-mode=”manual”

>


Read Also:

China’s BYD Says US Not Needed As EV Demand Surges

This post was originally published here

Brinker International, Inc. (NYSE:EAT) will release earnings for its third quarter before the opening bell on Wednesday, April 29.

Analysts expect the Dallas, Texas-based company to report quarterly earnings of $2.86 per share. That’s up from $2.66 per share in the year-ago period. The consensus estimate for Brinker’s quarterly revenue is $1.47 billion (it reported $1.43 billion last year), according to Benzinga Pro.

On March 2, Brinker International promoted George Felix to EVP, chief marketing officer.

Shares of Brinker fell 3.7% to close at $129.14 on Tuesday.

Benzinga readers can access the latest analyst ratings on the Analyst Stock Ratings page. Readers can sort by stock ticker, company name, analyst firm, rating change or other variables.

Let’s have a look at how Benzinga’s most-accurate analysts have rated the company in …

Full story available on Benzinga.com

This post was originally published here

OPKO Health (NASDAQ:OPK) reported first-quarter financial results on Tuesday. The transcript from the company’s first-quarter earnings call has been provided below.

This transcript is brought to you by Benzinga APIs. For real-time access to our entire catalog, please visit https://www.benzinga.com/apis/ for a consultation.

View the webcast at https://event.choruscall.com/mediaframe/webcast.html?webcastid=q9mua2Tv

Summary

OPKO Health Inc reported first quarter 2026 revenue of $124.2 million, a decrease from $149.9 million in Q1 2025, with a consolidated operating loss of $51 million, improving from a $67.2 million loss in the previous year.

The company is advancing its Modex product development pipeline, including several clinical trials for oncology and immunology treatments, and anticipates multiple clinical and partnership milestones in 2026.

Collaboration with Regeneron and BARDA is progressing, with potential milestones exceeding $1 billion and significant funding for infectious disease programs, respectively.

The diagnostics business is focusing on its core regional operations, with a targeted strategy to achieve breakeven by mid-year and expand its 4Kscore test offering.

OPKO Health Inc maintains a strong cash position of $341 million to support ongoing operations and R&D investments, with plans for future revenue growth driven by its biopharmaceutical and diagnostics segments.

Full Transcript

OPERATOR

Good day and welcome to the OpcoHealth First Quarter 2026 Financial Results Conference call. All participants will be in listen only mode. Should you need assistance, please signal a conference specialist by pressing the star key followed by zero. After today’s presentation, there will be an opportunity to ask questions. To ask a question, you may press star then one on your touchstone phone. To withdraw your question, please press Star then two. Please note this event is being recorded. I would now like to turn the conference over to Yvonne Briggs. Please go ahead.

Yvonne Briggs (Investor Relations)

Thank you operator and good afternoon, this is Yvonne Briggs with Alliance Advisors IR. Thank you all for joining today’s call to discuss OPKO Health Inc financial results for the first quarter of 2026. I’d like to remind you that any statements made during this call by management, other than statements of historical fact, will be considered forward looking and as such are subject to risks and uncertainties that could materially affect the company’s results. Those forward looking statements include, without limitation, the various risks described in the company’s SEC filings, including the Annual Report on Form 10-K for the year ended December 31, 2025. Furthermore, this conference call contains time sensitive information that is accurate only as of the date of the live broadcast, April 28, 2026. Except as required by law, OPCO undertakes no obligation to revise or update any forward looking statements to reflect events or circumstances after the date of this call. Regarding the format of today’s call, Dr. Philip Frost, chairman and Chief Executive Officer, will provide opening remarks. Dr. Elias Sirhouny, Vice Chairman and President, will then provide an overview of OPKO’s therapeutic segment as well as BioReference Health. After that, Adam Logel, OPKO’s CFO, will review the company’s first quarter financial results and discuss OPKO’s financial outlook. And then we’ll open the call to questions. Now I’d like to turn the call over to Dr.

Philip Frost (Chairman and Chief Executive Officer)

Thank you for joining us today. During the first quarter we made meaningful progress with our strategic initiatives, with particular emphasis on advancing our MODEX product development pipeline. MODEX now has five programs in the clinic spanning vaccines, oncology and immunology, all with the potential to be first and best in class in their therapeutic areas. Days after the close of the first quarter, we dosed our first subjects in the phase 1 clinical trial of MDX2301, our BARDA funded multispecific antibody for the prevention of COVID in high risk populations. Shortly thereafter, we announced the dosing of the first patient in a phase 1 trial to evaluate MDX 2003, a tetra specific T cell engager in patients with relapsed or refractory B cell lymphoma. We also continue to advance our other oncology candidates in Clinical Development, MDx2001, a tetraspecific T cell engager targeting solid tumors, and MDx2004, a multispecific immune rejuvenator. Over the course of this year, we expect MODEX to achieve a number of clinical and partnership milestones as these programs progress and in the case of our EBV vaccine approach, later stage development with our partner Merck. Our collaboration with Regeneron is progressing well as we align their extensive antibody binder libraries with our multispecific engineering platform across various indications in metabolism, oncology and immunology. This collaboration is another example of strategic partnerships that are a good source of non dilutive capital to support our RD efforts. The potential total value of the regenerant collaboration exceeds $1 billion in milestones plus future royalties in our diagnostics business. Q1 reflects our second full quarter with the new BioReference footprint following our oncology divestiture. We’re now centered on our core regional clinical laboratory operations in New York and New Jersey, our correctional health business and our national specialty urology testing franchise anchored by the 4K score test. We continue to streamline our infrastructure and cost base to achieve profitable growth from this segment. We closed the quarter with a solid cash balance. This reflects past asset sales, continued R and D support from our partners, and contributions from our international pharmaceutical operations. This financial strength enables us to fund our RD portfolio at a meaningful level and to return capital to shareholders through our stock repurchase program. With that overview, I’ll turn the call over to Elias.

Elias Sirhouny (Vice Chairman and President)

Well, thank you Phil, and good afternoon everyone. Let me start with the biopharmaceutical side of our business because that’s where we’re making tremendous progress advancing our pipeline right now. As Dr. Frost said, we now have five assets in the clinic and expect an additional program for our in vivo CAR T cell platform to commence first in human clinical trials this year. So let me review our programs and provide updates on each of them. Our collaboration with Merck is focused on a vaccine against Epstein Barr virus that combines four Epstein-Barr Virus (EBV) antigens developed by MODEX with Merck’s adjuvants. In the phase one trial, Merck enrolled over 200 subjects to evaluate safety, tolerability and immunogenicity, and various subgroup studies and analysis are underway to understand the responses in Epstein-Barr Virus (EBV) naive subjects and patients as young as 12 years of age, which will be important for future studies. So we expect Merck to have the data needed to inform a Phase two design by the end of this year, with initiation of a phase 2 clinical study anticipated next year. Subject to Merck’s decisions and announcements now for MDX 2001, which is our lead immuno oncology candidate for solid tumors including head and neck, esophageal, pancreatic, lung and prostate cancers. MDX2001, as you know, is a tetra specific T cell engager directed at two tumor antigens, CMET and TROP 2 and 2T cell activators CD3 and CD28. The goal is to drive a deeper and more durable response by simultaneously recognizing heterogeneous tumor antigen expression and providing both CD3 and CD28 activators and enhancers to T cells, thereby enhancing activation and T cell survival. Enrollment of Phase one studies continuing into two parallel cohorts to support dose escalation and optimize the dosing regimen. We have dosed more than 30 patients so far across multiple tumor types and have reached dose levels approximately tenfold higher than the starting dose, all with acceptable safety. We plan to present phase 1a data at a conference in the second half of this year. In addition, phase 1b is expected to start later this year, focusing on the tumor types most likely to show signs of efficacy. We’re also commencing work to enable subcutaneous formulations for our next program, MDX2004, which is our first in class multi specific immune rejuvenator that simultaneously engages CD3, CD28 and 41 BB to not only activate but also expand and sustain stem like and memory T cells in the immune system. Preclinical data has demonstrated that MDX 2004 expands stem T cells, increases the T cell activation and stimulates proliferation of CD8 and CD4 memory subsets and so these its potential as a pipeline in a product across cancers and chronic infections among the elderly and immune impaired subjects. MDX 2004 entered phase one in the third quarter of late last year and we’re currently in the dose escalation stage in heavily pretreated cancer patients. The trial includes both PD1 naive patients and patients previously treated with PD1 inhibitors with the goal of determining whether immune rejuvenation can restore or prolong responses. Our objective this year is to complete Phase 1A, define an appropriate dose and schedule, and prepare for expansion into select tumor types and longer term into broader immune impairment indications. Now our newest molecule in the clinic is MDX 2003. It’s our T3 specific T cell engager and expander targeting both CD19 and CD20 on B cells and CD3 and CD28 on T cells. The intent is to address tumor antigen heterogeneity and escape mechanisms, which we see with CD19 only or CD20 only approaches by maintaining activity even when 1B cell marker is lost while CD28CO stimulation supports sustained T cell function. We recently initiated a phase one trial in B cell lymphomas and leukemias in Australia and Israel, with additional sites to follow in parallel. We’re evaluating the optimal path to explore autoimmune indications for MDX 2003, which has a potential to play a role in autoimmunity. In March, MODEX presented two posters at the ESMO Targeted Anti Cancer Therapies Congress 2026 in Paris, further highlighting the breadth of our oncology portfolio. One presentation profiled MDX 2004 describing the ongoing first in human trial in patients with advanced tumors and introducing the concept of immune rejuvenation as a differentiated approach to restoring antitumor immunity. The second was focused on MDX 2003 and showcased its potent preclinical activity across multiple B cell malignancy models and its potential relevance in autoimmunity. In addition to our own research, we’re very pleased with the progress under our collaboration with regeneron, which, as Dr. Frost mentioned, combines their extensive library of clinically validated monoclonal antibody binders with our modular multispecific architecture across immunology, oncology and metabolic diseases. Together, the teams are focused on advancing four initial discovery programs using the MODEX platform to rapidly generate and optimize multi specific antibody candidates with the potential to expand into additional targets over time. Regeneron is responsible for funding preclinical clinical and commercial development of the selected assets, while OPCO is eligible for research development, regulatory and commercial milestones that could exceed $1 billion, as well as tiered royalties on global sales up to the low double digits. Now moving to infectious diseases, MDX2301 is the first MODEX multi specific antibody program to enter the clinic under our collaboration with BARDA. MDX2301 is a tetravalent bispecific antibody that targets distinct and conserved regions of the SARS CoV2 spike receptor binding domain and it is designed for broad coverage and long duration of protection because it really attacks two separate regions of the virus which prevents escape of the virus through mutations. The initial indications are prophylaxis in high risk immunocompromised populations who cannot be protected by immunization vaccination and used in post exposure outbreak settings with potential expansion into acute treatment of COVID and the treatment of long Covid. To date, remarkably, this multispecific antibody has demonstrated high potency against all known variants of SARS COV2V2 and continues to be effective against all circulating variants of the virus. We initiated the Phase 1 trial of MDX 2301 which is evaluating safety and tolerability across different routes of administration and dosing regimens in healthy volunteers and in adults at high risk for severe co occurring and the first dose cohort is completed and BARDA is funding the program including the clinical trial costs. BARDA is also supporting our Multi Specific Influenza program which targets conserved regions of hemagglutinin to enable broad coverage across influenza A and B strains. We’re currently conducting pre IND work using challenge models to select the lead clinical candidate and we expect this program to move closer to the commencement of clinical trials with the potential for additional financial support from BARDA. To date, BARDA has committed over $100 million since the inception of these two programs. Now, over the past several years MODEX has also built a multimodal in vivo CAR T and gene delivery platform that we believe is highly differentiated versus traditional ex vivo CAR T approaches because it combines our unique multi specific technology with proprietary in vivo CAR technologies. Using lipid nanoparticles conjugated with cell specific multi specific antibodies on the surface, we can deliver MRNA or DNA payloads encoding cars directly to specific immune cell subset not only just T cells but also B cells or NK cells to generate functional CAR T cells in vivo at lower effective doses. Preclinical data has been obtained in humanized mice and non human primates and a presentation of this work will be made at the ASGCT meeting in Boston next month and we believe this technology offers several potential advantages. It is off the shelf, can be redosed and leverages our multi specific antibodies for cell specific targeting and built in activation via CD3 CD28. It also uses site specific antibody conjugation and proprietary lipids to support manufacturability at scale and reduce off target delivery to the liver. In non human primate studies we have shown proof of concept for in vivo CAR T generation, deep B cell depletion in blood and tissues and a favorable tolerability profile. These effects were achieved at doses that were a fraction of those reported for completing platforms for competing platforms. Sorry, we’re now in IND enabling studies for our lead CD19 targeted in vivo CAR T program and expect entry into the clinic by the end of this year or early 2027. Now turning to our endocrine and metabolic programs, we continue to advance our subcutaneous injection formulation of UBCO. ADA 006 for the treatment of MASH 88006 is an analog of the natural GLP1 glucagon hormone occipital modulin and we’re planning a first in human single ascending dose and multiple ascending dose phase 12 a clinical study with data expected by the second half of 2027. The findings will be used to guide the further development of our oral oxyntomodulin in partnership with Entera Bio. We also recently expanded our relationship with Entera to include a third joint program for a first in class long acting PTH tablets for patients with hypoparathyroidism and this program combines opsco’s proprietary long acting PTH variants, Bonanteros and Tab technology and we in NTERA each hold a 50% ownership interest in this program and we will share development costs equally. Presuming favorable PK PD data, we’re targeting an IND filing later this year. Now our international pharmaceutical operations continue to experience solid growth during Q1 with healthy contributions to the overall business. For the quarter, global pharmaceutical product sales grew about 9% versus the prior year due to favorable demand trends as well as foreign currency tailwinds. Our partner Pfizer continues its global commercial expansion of our long acting growth hormone product enGENE. …

Full story available on Benzinga.com

This post was originally published here

F5 (NASDAQ:FFIV) reported second-quarter financial results on Tuesday. The transcript from the company’s second-quarter earnings call has been provided below.

This content is powered by Benzinga APIs. For comprehensive financial data and transcripts, visit https://www.benzinga.com/apis/.

View the webcast at https://events.q4inc.com/attendee/456000253

Summary

F5 Inc reported a strong Q2 with an 11% increase in revenue, driven by a 22% growth in product revenue, including 26% growth in systems and 17% in software.

The company is capitalizing on trends like hybrid multi-cloud adoption, expanding threat landscapes, and AI integration, raising its FY26 revenue growth outlook to 7-8%.

F5 Inc’s non-GAAP EPS grew by 14% year-over-year, with a record $348 million in free cash flow, and the company plans to repurchase at least 50% of its free cash flow in shares.

The company highlighted significant wins in AI-driven security solutions and increased demand for their application and API security offerings.

F5 Inc’s strategic initiatives include significant investments in hybrid multi-cloud solutions and AI-powered security innovations, positioning it for future growth amid evolving market dynamics.

Full Transcript

OPERATOR

Good afternoon and welcome to the F5 Inc. Second Quarter Fiscal 2026 Financial Results Conference call. All lines have been placed on mute to prevent any background noise. After the Speaker’s remarks, there will be a question and answer session. If you would like to ask a question during this time, simply press the star key followed by the number one on your telephone keypad. If you would like to withdraw your question, press Star one again. Also, today’s conference is being recorded. If anyone has any objections, please disconnect at this time. I’ll now turn the call over to Ms. Suzanne DeLong. Ma’am, you may begin.

Suzanne DeLong (President of Investor Relations)

Hello and welcome. I’m Suzanne DeLong, F5 Inc’s President of Investor Relations. We are here to discuss our second quarter fiscal year 2026 financial results. Francois Loco Dinou, F5’s chairman, president and CEO, and Cooper Werner, F5’s executive vice president and CFO, will be making prepared remarks on today’s call. Other members of the F5 executive team are also here to answer questions during the Q and A session. Today’s press release is available on our website at f5.com where an archived version of today’s audio will be available through July 27, 2026. We will post the slide deck accompanying today’s webcast to our IR site following this call. To access the replay of today’s webcast by phone, dial 800-770-2030 or 609-800-9909 and use meeting ID 607-6834. The telephonic replay will be available through Midnight Pacific Time, April 29, 2026. For additional information or follow up questions, please reach out to me directly at s.delong@f5.com Our discussion today will contain forward looking statements which include words such as believe, anticipate, expect, and target. These forward looking statements involve uncertainties and risks that may cause our actual results to differ materially from those expressed or implied by these statements. We summarize factors that may affect our results in the press release announcing our financial results and in detail in our SEC filings. In addition, we will reference non GAAP metrics during today’s discussion. Please see our full GAAP to Non GAAP reconciliation in today’s press release and in the appendix of our earnings slide deck. Please note that F5 has no duty to update any information presented in this call before I pass the call to Francois. I am pleased to announce that F5 will be hosting an Analyst and Investor event in New York on Thursday, May 28, 2026. Details about the event will be provided in a press release soon. I’ll now turn the call over to Francois.

Francois Loco Dinou (Chairman, President, and CEO)

Thank you, Suzanne and hello everyone. Our team delivered another robust quarter with 11% revenue growth. Product revenue grew 22%, marking our seventh consecutive quarter of double digit product growth. This includes strong 26% systems revenue growth and 17% software revenue growth. Hybrid multi cloud has become a strategic architecture and it is increasing demand across F5’s core markets. Customers are rapidly scaling their digital infrastructures to improve resiliency, meet data sovereignty requirements and get ready for AI. Our strong Q2 performance reflects those dynamics and F5’s alignment with where customers are headed. We captured robust international demand for digital sovereignty initiatives. We also converted hybrid multi cloud adoption into meaningful systems and software growth. We capitalized on heightened demand for best in class security solutions and we built on AI momentum with another standout quarter for AI wins. As a result of our strong growth and our proven operating model, we delivered 14% non GAAP earnings growth and a record $348 million in free cash flow. The powerful combination of secular and cyclical demand trends is providing strong Q3 visibility and A growing pipeline. As a result, we are raising our fiscal year 2026 outlook to reflect revenue growth of 7 to 8%, up from 5 to 6% previously. Cooper will elaborate on our outlook in his remarks. Our outlook for stronger growth is reinforced by what we are seeing in the market. We see three forces significantly reshaping how our customers operate hybrid multi cloud adoption, threat landscape expansion and AI inference inflection. First, hybrid multi cloud adoption workloads now span on premises, private cloud and multiple public clouds. Our research shows more than 90% of enterprises run hybrid multi cloud today across an average of 19 locations. Organizations need flexibility, resiliency and digital sovereignty in every environment and they are investing to support these demands. Second, threat landscape expansion as AI models become more capable, attackers are using them to launch attacks against production applications at higher volumes and with greater variation than traditional defenses were designed for. Our customers see this and they are responding. They are deploying more application security and prioritizing best in class defenses. The era of checkbox security is over. AI applications require best in class security to match both the volume and the sophistication of AI driven attacks. Third, the AI inference inflection organizations are connecting their applications and APIs to AI models and inference calls are becoming a regular part of how applications run. Our research shows 78% of enterprises run inference themselves using more than seven models on average. Organizations are standardizing on a new architecture with models distributed across the data center, the cloud and the edge and the next shift is already on the way. AI agents are moving into production and enterprises are adapting their applications for agent interaction. This is driving more compute, more data delivery and more security to protect inference. These three market forces are driving demand across our business. Because of accelerating hybrid multi cloud adoption. We are taking an already strong refresh cycle and leveraging it into significant opportunities for expansion, competitive displacement and platform consolidation. I will double click on each of these spotlighting customer examples from the quarter. With this refresh we are seeing a refresh plus dynamic that is different from prior cycles. Customers are deploying higher performance, higher capacity F5 systems as they upgrade their data centers to support modern applications, digital resilience and sovereignty. And as customers refresh, we are capitalizing on that moment to attach new use cases, expanding our footprint and growing overall wallet share. For example, this quarter a large healthcare services organization started with a life cycle refresh across hundreds of legacy systems. As the project progressed, they expanded the scope to support an AI driven consumer engagement platform. F5 became the control point for secure low latency traffic and data movement across applications, storage and their GPU server environment that gave the customer a more resilient foundation for both sensitive internal workloads and new AI interactions. At scale Our deliberate investment in hybrid multi cloud solutions is translating into market share gains. We are winning customers from competitors who did not build the same breadth and depth of capabilities across on premises software and SaaS. In Q2 we displaced a long standing incumbent at a Fortune 100 energy company whose environment had hit scalability limits. The customer needed a platform that could scale into cloud while maintaining strong on premises performance. Their incumbent provider was unable to serve workloads in hybrid multi cloud environments. S5 Modernized traffic management and simplified operations, improving reliability and creating a clean path for long term cloud adoption. Hybrid multi cloud customers require stronger performance and security with fewer tools and simpler operations. We are replacing point products with a unified approach that improves performance and security and is easier to operate at scale. For example, during Q2 an energy and utilities provider and existing big IP customer needed to secure APIs with better visibility and automation across their data center, cloud and edge environments. They selected F5 distributed cloud services to simplify their approach and standardize API protection across their full footprint with simpler management. Moving on to Threat Landscape Extension the pace and scope with which the threat landscape is expanding is driving demand for best in class application and API security both on premises and across cloud environments. For example, this quarter a software and managed service provider needed to standardize application and API security across a rapidly expanding hybrid multi cloud estate. Built through acquisitions, they lacked a consistent way to enforce front door and API protections across their multiple public cloud environments and on premises. With F5 they deployed a single policy and management layer with security enforced locally in every environment. Supporting strict privacy, audit and healthcare requirements, F5 enabled faster regional expansion with stronger security and improved data sovereignty alignment. Finally, the AI inference inflection is driving demand for F5. We are seeing this indirectly through hybrid multi cloud adoption and the requirements that come with it. We are also seeing it directly through our three primary AI use cases. With our industry leading traffic management, we are winning new AI insertion points including AI data delivery and AI factory load balancing. And we are capturing AI runtime security wins, protecting AI applications, APIs and models from emerging threats such as model abuse, data leakage and prompt injection. In an AI data delivery win, a global payments company needed a more resilient way to move rapidly growing AI data between storage and compute as they scale the training and retrieval workloads. F5 improved performance and resiliency while displacing both an in house solution and a competitor, positioning us at the center of the customer’s AI infrastructure strategy. In an AI runtime security win, an industrial automation firm needed a scalable way to assess risk and govern a growing number of AI applications and models. They chose F5 based on the depth of our red teaming insights and strong integration with their existing security stack. In an AI factory load balancing win, a major manufacturer and existing F5 customer needed to support operations and establish a digital twin of their manufacturing environment for simulation and optimization. They deployed big IP as the production traffic layer across their GPU server environment, improving availability and offloading encryption. Taken together, these wins underscore two things. The forces reshaping our customers environments are real and F5 is well positioned to capture them. Staying ahead of the pace of change requires relentless innovation. In Q2 we brought multiple new capabilities to market, strengthening our leadership in application delivery and security for the AI era and driving greater value for customers. We introduced AI powered capabilities in distributed cloud waf, replacing manual policy tuning with automated outcome based threat blocking. Our F5 trained model helps customers stay ahead of increasingly sophisticated AI driven attacks that are growing in both speed and complexity. We launched agentic bot Defense, extending our industry leading bot defense to autonomous AI agents, a new and fast growing category of traffic. The result is that customers can confidently adopt agentic AI while ensuring only verified trusted agents reach their applications. We released F5AI remediate which closes the loop between our AI Red Team and AI Guardrails products. It collapses the path from vulnerability discovery to runtime protection from days or weeks into minutes. And finally, we launched F5 Insight for ADSP, providing deeper visibility across application estates. The result is that customers can identify and resolve issues faster with less guesswork. We are innovating so customers can run faster, stay protected and simplify their hybrid, multi cloud and AI environment. And we are accelerating that innovation by rapidly integrating AI into our solutions to create practical capabilities customers can deploy quickly. That innovation engine is also sharpening our view of what’s next as we look ahead. We have conviction in the power and durability of hybrid multi cloud, the expanding threat landscape and inflecting AI inference as the main drivers for F5. We look forward to digging deeper into these drivers and our expectations for how they will shape F5’s longer term growth outlook at our May Analyst and Investor event. Now I will turn the call over to Cooper who will walk through our Q2 results and our outlook.

Cooper Werner (Executive Vice President and CFO)

Cooper thank you Francois and hello everyone. I will review our Q2 results before I provide our guidance for Q3 and and update our outlook for FY26. We delivered a strong Q2 growing revenue 11% to $812 million with a mix of 51% product revenue and 49% services revenue. Product revenue totaled 411 million, increasing 22% year over year, while services revenue of 401 million grew 2% year over year. Systems revenue totaled 226 million, up 26% over Q2 FY25. Our software revenue of 184 million grew 17% year over year. Subscription based software revenue totaled 165 million, up 20% year on year representing 90% of our Q2 software revenue. Perpetual licensed software totaled 19 million, down 4% year over year. Revenue from recurring sources contributed 70% of our Q2 revenue. Our recurring revenue consists of our subscription based revenue and the maintenance portion of our services revenue shifting to revenue distribution by region. Revenue from The Americas grew 3% year over year representing 50% of total revenue. Both our EMEA and APAC regions delivered very strong quarters. EMEA grew 22% representing 32% of revenue. APAC grew 19% representing 18% of revenue. Looking at our major verticals, Enterprise customers contributed 66% of Q2’s product bookings. Government customers represented a strong 24% of product bookings, including 8% from U.S. federal. Finally, service providers contributed 9% of Q2 product bookings. Our continued financial discipline contributed to our strong Q2 operating results. GAAP gross margin was 81.4%. Non GAAP gross margin was 83.7%. Our GAAP operating expenses were $482 million. Our non GAAP operating expenses were $406 billion. Our GAAP operating margin was 22.1%. Our non GAAP operating margin was 33.8%. Our GAAP effective tax rate for the quarter was 21.9%. Our non GAAP effective tax rate was 21.5%. Our GAAP net income for the quarter was 148 million or $2.58 per share. Our non GAAP net income was 223 million or $3.90 per share, reflecting 14% EPS growth from the year ago period. I will now turn to cash flow and balance sheet Metrics. We generated $366 million in cash flow from operations in Q2 and free cash flow of 348 million, both records highlighting the strength of our operating model. Capex was 18 million. DSO for the quarter was 47 days. Cash and investments totaled 1.46 billion at quarter end. Deferred revenue was 2.12 billion, up 10% from the year ago period. In Q2 we repurchased $100 million worth of F5 shares at an average price of $269 per share. We had $522 million remaining on our authorized share repurchase program as of the end of the quarter. Finally, we ended the quarter with approximately 6,500 employees. I will now speak to our outlook and guidance beginning with Q3 followed by our full year view. We expect the market trends we’ve outlined hybrid multi cloud adoption, threat landscape expansion and AI inferencing reflection to drive strong demand for our products and services. In the second half of FY26. We expect Q3 revenue in a range of 820 million to 840 million, reflecting approximately 6.5% growth at the midpoint. We expect non GAAP gross margin in the range of 82.5 to 83.5%. We estimate Q3 non GAAP operating expenses of 406 to 418 million. We expect Q3 share based compensation expense of approximately 68 to 70 million. We anticipate Q3 non GAAP EPS in a range of $3.91 to $4.03 per share. Turning to our fiscal year 2026 outlook, with continued strong close rates in Q2 and strong pipeline creation into the second half, we are raising our FY26 outlook we now expect FY26 revenue growth of 7 to 8%, up from our prior outlook of 5 to 6%. We continue to expect mid single digit software revenue growth, double digit systems revenue growth and low single digit services revenue growth for the year. Our gross and operating margin outlook for FY26 is unchanged. We expect FY26 non GAAP gross margin in a range of 82.5 to 83.5%. On modeling note, we expect higher component costs primarily related to memory will cause gross margins to step down sequentially from Q3 into Q4. We expect non GAAP operating margin in a range of 34 to 35%. We now expect our FY26 non GAAP effective tax rate will be in a range of 20 to 21%. Reflecting the strength of our second quarter and our increased revenue outlook, we now expect FY26 non GAAP EPS in a range of $16.25 to $16.55, up from the prior range of $15.65 to $16.05. Finally, we expect our full year share repurchase to be at least 50% of our free cash flow. I will now pass the call back to Francois.

Francois Loco Dinou (Chairman, President, and CEO)

Thank you Cooper Looking ahead, our strengths are well matched to the secular shift transforming IT infrastructure, hybrid, multi cloud adoption, threat landscape expansion and AI inference inflection. We expect these trends to support continued growth for F5 in fiscal 2026 and beyond. F5 is built for hybrid, multi cloud and the AI era. We deliver and secure every app and API anywhere with one unified platform across on premises, multiple public clouds and the edge. Our application delivery and security platform reduces complexity, customers get centralized security, high performance delivery and consistent policy without stitching together point products and we provide a control point for traffic, APIs and data flows as applications and AI become more distributed. Operator, please open the call to questions.

OPERATOR

We will now begin the question and answer session. If you have dialed in and would like to ask a question, please press Star one on your telephone keypad to raise your …

Full story available on Benzinga.com

This post was originally published here

The S&P 500 fell 0.49% on Tuesday to close at 7,138.80, pulling back from record highs as investors took profits ahead of a pivotal day for megacap earnings and the Federal Reserve’s rate decision.

The Polygon-based (CRYPTO: POL) Polymarket crowd is leaning bullish heading into Wednesday, with the April 29 market showing 61% odds of an “Up” open for the benchmark index.

Why That Number Matters

Wednesday could test whether the recent rally has more room to run.

Investors are bracing for results from four of the “Magnificent Seven” after the close — Alphabet (NASDAQ:GOOGL) (NASDAQ:GOOG), Amazon (NASDAQ:AMZN), Meta Platforms

Full story available on Benzinga.com

This post was originally published here

The Trump administration is reportedly developing a strategy to bypass Anthropic‘s supply chain risk designation, potentially allowing the onboarding of its powerful AI model, Mythos.

The White House is working on a draft executive action that could provide a way to mitigate the ongoing dispute with Anthropic, Axios reported on Tuesday.

Earlier this month, White House Chief of Staff Susie Wiles and Treasury Secretary Scott Bessent held a meeting with Anthropic CEO Dario Amodei. The meeting was described as a “productive introductory meeting” on potential collaborations between the government and the company, as per the publication.

This week, the White House is meeting companies across sectors to discuss possible executive action and best practices for deploying Mythos. The talks also include potential guidance that could overturn the Office of Management and Budget’s directive against using Anthropic in government operations.

Mythos is a restricted AI model developed by Anthropic for sensitive …

Full story available on Benzinga.com

This post was originally published here

Shares of Brown-Forman (NYSE:BF) declined 5.88% in premarket trading on Wednesday, after French spirits behemoth Pernod Ricard S.A. (OTC:PRNDY) and the Jack Daniel’s whiskey maker mutually called off the merger talks on Tuesday.

Pernod Ricard said it remains confident in its strategy and team, and is focused on delivering long-term value for stakeholders, while Brown-Forman said it aims to expand globally, strengthening its brands, and improving operational efficiency.

According to the Wall Street Journal, there were differences over the deal’s structure and financial aspects, and both companies failed to reach a consensus on the proposed merger terms. Also, both Pernod and Brown-Forman have significant family ownership, and any deal with Brown-Forman would need the Brown family’s approval, who hold a majority of the …

Full story available on Benzinga.com

This post was originally published here

Amidst today’s fast-paced and highly competitive business environment, it is crucial for investors and industry enthusiasts to conduct comprehensive company evaluations. In this article, we will delve into an extensive industry comparison, evaluating Advanced Micro Devices (NASDAQ:AMD) in comparison to its major competitors within the Semiconductors & Semiconductor Equipment industry. By analyzing critical financial metrics, market position, and growth potential, our objective is to provide valuable insights for investors and offer a deeper understanding of company’s performance in the industry.

Advanced Micro Devices Background

Advanced Micro Devices designs a variety of digital semiconductors for markets such as PCs, gaming consoles, data centers (including artificial intelligence), industrial, and automotive applications. AMD’s traditional strength was in central processing units and graphics processing units used in PCs and data centers. However, AMD is emerging as a prominent player in AI GPUs and related hardware. Additionally, the firm supplies the chips found in prominent game consoles such as the Sony PlayStation and Microsoft Xbox.

Company P/E P/B P/S ROE EBITDA (in billions) Gross Profit (in billions) Revenue Growth
Advanced Micro Devices Inc 123.84 8.36 15.27 2.44% $2.86 $5.58 34.11%
NVIDIA Corp 43.50 32.93 24.20 31.11% $51.28 $51.09 73.21%
Broadcom Inc 77.94 23.70 28.49 9.12% $11.15 $13.16 29.47%
Micron Technology Inc 23.80 7.85 9.84 21.0% $18.48 $17.75 196.29%
Texas Instruments Inc 45.30 14.37 13.11 9.35% $2.42 $2.8 18.58%
Analog Devices Inc 70.07 5.54 16.14 2.46% $1.52 $2.04 30.42%
Qualcomm Inc 30.24 6.94 3.66 13.57% $4.11 $6.68 5.0%
Marvell Technology Inc 49.91 9.36 16.26 2.79% $0.75 $1.15 22.08%
Monolithic Power Systems Inc 116.96 20.92 26.04 4.95% $0.21 $0.41 20.83%
NXP Semiconductors NV 22.03 5.32 4.64 4.53% $0.98 $1.81 7.2%
ON Semiconductor Corp 321.72 4.78 6.41 2.33% $0.45 $0.55 -11.17%
GLOBALFOUNDRIES Inc 37.42 2.74 4.89 1.68% $0.73 $0.51 0.0%
Astera Labs Inc 150.25 23.03 38.61 3.41% $0.07 $0.2 91.77%
Credo Technology Group Holding Ltd 91.16 16.55 28.85 10.03% $0.16 $0.28 201.49%
Tower Semiconductor Ltd 99.77 7.48 14.04 2.78% $0.2 $0.12 13.69%
First Solar Inc 13.78 2.21 4.04 5.62% $0.7 $0.67 11.15%
MACOM Technology Solutions Holdings Inc 120.19 14.72 19.51 3.64% $0.07 $0.15 24.52%
Lattice Semiconductor Corp 5695.50 21.83 30.09 -1.08% $0.01 $0.1 24.16%
Average 412.33 12.96 16.99 7.49% $5.49 $5.85 44.63%

Full story available on Benzinga.com

This post was originally published here

Seagate Technology Holdings PLC (NASDAQ:STX) shares surged following a massive third-quarter earnings beat fueled by rising artificial intelligence (AI) demand—a trend highlighted by CNBC’s Jim Cramer and detailed by CEO Dave Mosley during the company’s latest earnings call.

The ‘Smart Moment’ And Agentic AI

Following Seagate’s latest earnings call, Cramer took to X to highlight a specific exchange regarding the future of AI data storage.

“Smart moment on the Seagate call where they are asked to talk about use cases that use a lot of memory and can spiral into gigantic data sets: the process of FAQs,” Cramer posted.

He was referring to comments made by Mosely regarding the rise of Agentic AI. Mosley explained that AI-driven frequently asked questions are evolving from simple periodic queries into continuous, autonomous workflows.

These intelligent agents “reference enormous data sets to draw your conclusion and you may actually create new data,” driving an unprecedented need for mass capacity hard drives.

Full story available on Benzinga.com

This post was originally published here

Economist Peter Schiff questioned on Tuesday Bitcoin’s (CRYPTO: BTC) decline over the past year, despite Strategy Inc. (NASDAQ:MSTR) substantially boosting its BTC reserves during the same time.

Schiff Targets Saylor’s Strategy Again

In an X post, Schiff chose the 2025 Bitcoin Conference as the reference point. He noted that Michael Saylor’s firm increased its Bitcoin holdings from 2.76% of the total supply at that time to 3.9%—right as the key 2026 conference kicks off.

The 2025 Conference was held in Las Vegas from May 27 to May 29. At the time, Strategy held 580,250 BTC. Earlier this week, it reported its latest purchase, boosting the reserves to 818,334 BTC, suggesting a nearly 40% increase.

Moreover, BTC traded around $109,000 during the 2025 event. It has since declined by about 30%.

“A 40% increase in market share didn’t stop Bitcoin from falling by 30%. …

Full story available on Benzinga.com

This post was originally published here

Bed Bath & Beyond, Inc. (NYSE:BBBY) stock soared after the company reported first-quarter results after Monday’s closing bell, beating analyst revenue estimates. 

Here’s a look at the details inside the report. 

BBBY Q1 Details       

Bed Bath & Beyond reported quarterly adjusted losses of 25 cents per share, which met analyst estimates, according to Benzinga Pro data. 

Quarterly revenue came in with sales at $247.76 million, which beat the $240.09 million Street estimate.

“Notably this was the first quarter of significant revenue growth …

Full story available on Benzinga.com

This post was originally published here

Elon Musk labeled OpenAI founder Sam Altman “Scam Altman” on Monday as anonymous crypto investigator ZachXBT accused Worldcoin (CRYPTO: WLD) of launching with a “predatory low float” structure reminiscent of FTX tactics.

The Worldcoin Allegations

ZachXBT jumped into the conversation under Musk’s post, describing Worldcoin’s WLD token as targeting people in low-income countries by offering small amounts of WLD in exchange for iris scans. 

Instead of creating verified digital identities, the project spawned a black market for verified World IDs trading for as little as $5 to $15.

ZachXBT pointed to unsustainable token inflation and regular over-the-counter sales by insiders, calling the whole setup exploitative. 

He previously labeled WLD “the biggest scam token of the bull run” in July 2024, accusing the team and venture capital backers of complicity in price manipulation and misleading marketing.

The investigator framed Worldcoin as Altman’s “other company” which deserves the …

Full story available on Benzinga.com

This post was originally published here

Billionaire investor Michael Novogratz said Bitcoin (CRYPTO: BTC) could struggle to reclaim the $100,000 level without a meaningful shift in macroeconomic conditions, particularly monetary policy.

Fed Policy Key To Next Move

Speaking on the broader crypto outlook to Bloomberg on Tuesday, Novogratz said a sustained move higher in Bitcoin would likely require central banks, especially the Federal Reserve, to ease policy.

However, he warned that persistent geopolitical tensions and inflation risks may keep policymakers cautious, limiting near-term upside.

At the time of his comments, Bitcoin was trading near $76,000, well below its prior peak around $126,000.

Meanwhile, Galaxy …

Full story available on Benzinga.com

This post was originally published here

Robinhood Markets, Inc. (NASDAQ:HOOD) shares fell Tuesday as a risk-off market weighed on growth stocks, with traders focused on how a crypto downturn could impact transaction-driven results ahead of earnings.

What To Watch Ahead Of Robinhood’s Q1 Earnings

Robinhood is set to report first-quarter results after the close on Tuesday, with attention on how declining cryptocurrency prices may have affected trading activity and revenue.

Cryptocurrencies accounted for 28% of fourth-quarter transaction-based revenue, making the drop in Bitcoin (CRYPTO: BTC) and Ethereum (CRYPTO: ETH) a key factor.

Investors are watching whether lower prices led to reduced user engagement and trading volumes.

Recent developments also shape sentiment. On April 22, Robinhood Ventures Fund I (NYSE:RVI) announced a $75 million investment in OpenAI, calling it one of its largest investments and signaling a push into frontier AI opportunities.

Robinhood Stock: …

Full story available on Benzinga.com

This post was originally published here

Three billionaire investors declared aggressive Bitcoin (CRYPTO: BTC) targets at Bitcoin 2026 in Las Vegas on Monday, with price calls ranging from $125,000 to warnings of a massive supply shock.

Tim Draper: Companies Must Hold 5% to 15% in Bitcoin

Tim Draper said businesses should allocate 5% to 15% of treasury to Bitcoin to hedge against fiat currency erosion and prepare for potential financial system disruptions.

“It’s irresponsible now for a company to operate and have a big treasury and not have some portion of that in Bitcoin,” Draper said. 

“If you want to protect your family, you want to protect your company, you want to protect your country, you better have some Bitcoin,” he added.

Meanwhile, Draper warned that increasing merchant acceptance of Bitcoin could trigger a bank run as retailers shift to accepting only Bitcoin. 

He cited Silicon Valley Bank’s collapse as evidence the banking system nearly …

Full story available on Benzinga.com

This post was originally published here

Bitcoin held near $76,000 while major altcoins remained subdued, as traders positioned cautiously ahead of the Federal Open Market Committee meeting.

Cryptocurrency Ticker Price
Bitcoin (CRYPTO: BTC) $76,200.02
Ethereum (CRYPTO: ETH) $2,292.36
Solana (CRYPTO: SOL) $83.66
XRP (CRYPTO: XRP) $1.38
Dogecoin (CRYPTO: DOGE) $0.09936
Shiba Inu (CRYPTO: SHIB) $0.056116

Notable Statistics:

  • Coinglass data shows 67,855 traders were liquidated in the past 24 hours for $192.38 million.       
  • SoSoValue data shows net outflows of $263.2 million from spot Bitcoin ETFs on Monday. Spot Ethereum ETFs saw net outflows of $50.5 million.
  • In the past 24 hours, top gainers include Humanity Protocol, siren and Terra Classic.

Notable Developments:

Full story available on Benzinga.com

This post was originally published here

American Bitcoin (NASDAQ:ABTC) has torched $500 million in shareholder value since September while Eric Trump’s personal fortune jumped from $190 million to $280 million, according to a Forbes report published Tuesday.

American Bitcoin Stock Down 92% From Peak

When American Bitcoin hit the Nasdaq on September 3, investors valued the company at $13.2 billion despite holding just $270 million of Bitcoin (CRYPTO: BTC). 

The stock is now down 92% from its peak after the company dumped 149 million shares to buy more Bitcoin.

Eric Trump pitched the company as mining Bitcoin for roughly $57,000 per coin when it traded around $116,000. 

But the all-in cost including machines, marketing, and capital allocation hit about $92,000 per Bitcoin at the time, leaving slim margins that evaporated when prices fell.

How The Stock Dumping Worked?

American Bitcoin sold …

Full story available on Benzinga.com

This post was originally published here

GraniteShares is expanding its push into income-focused thematic ETFs with the launch of two new YieldBOOST strategies tied to crypto and fintech. The GraniteShares YieldBOOST CRCL ETF (NASDAQ:CRY) and GraniteShares YieldBOOST Ether ETF (NASDAQ:XEY) began trading today, offering investors a way to tap income opportunities linked to Circle Internet Group and Ether without directly holding the underlying assets.

data-variant=”card”
data-news-mode=”manual”

>


Read Also:

Vanguard Bundles Bond ETFs Into Ready-Made Portfolios For Easier Income Investing

This post was originally published here

Baiya International Group Inc (NASDAQ:BIYA) shares are surging Tuesday afternoon, up over 100%, after the company laid out a crypto-focused “Ark Plan” that centers on a first digital-asset allocation target and a buyback framework.

Baiya International Targets ‘Token-Stock Synergy’

Baiya says public voting picked Binance Coin (CRYPTO: BNB) as the first “core digital asset allocation target,” with BNB winning 89.2% of votes versus 10.8% for TRUMP (CRYPTO: TRUMP). The plan’s first step calls for an initial $1 million purchase and four concurrent execution strategies built around Binance Coin.

Baiya intends to allocate 50% of realized revenue from these digital assets toward share buybacks, creating a “Token-Stock Synergy” designed to return value directly to shareholders.

To support this expansion, the company has filed for up to 30 million common shares to reserve capital for future phases of the Ark Plan. The execution framework utilizes four …

Full story available on Benzinga.com

This post was originally published here

Bitmine Immersion Technologies (NYSE:BMNR), a firm tied to Wall Street strategist Tom Lee, has just purchased roughly $233 million worth of Ethereum (CRYPTO: ETH). That is more than 100,000 ETH added in a single move, and it stands as one of the largest corporate Ethereum buys we have seen this year.

When one of Wall Street’s most respected voices puts such a huge amount into a single asset in seven days, it’s a clear statement.

BitMine Just Cornered 4% of Ethereum’s Entire Supply

Since december, 2025, this is the largest weekly ethereum purchase. Right now, BitMine Immersion Technologies hold close to 4% of the entire ethereum supply with nearly 5 million ETH tokens sitting in its balance sheet. 

Bitmine is not jumping in and out of Ethereum with the aim to catch short-term price swings. The company has been building its position steadily, and this latest purchase is just another step in that direction.

The message behind this massive move is simple: tom lee believes ethereum will be worth a lot more over time, and investors shouldn’t take this signal likely.

While many believe the crypto winter may last through the fall of 2026, Lee’s view is slightly different. He believes that the next …

Full story available on Benzinga.com

This post was originally published here

Bitcoin (CRYPTO: BTC) has climbed about 15% over the past month, with technical analysts pointing to a classic three-period pattern that may indicate a shift toward stronger bullish momentum.

Three-Period “Morning Star” Pattern

In an Apr. 28 post on X, crypto analyst Ali Martinez highlighted the formation of a Morning Star pattern on Bitcoin’s chart, a signal often associated with trend reversals.

The pattern unfolds over three periods, transitioning from strong selling pressure to indecision and then to renewed buying strength. Martinez said this reflects a shift from fear-driven selling to what he described as “aggressive conviction” among buyers.

He …

Full story available on Benzinga.com

This post was originally published here

Robinhood Markets Inc (NASDAQ:HOOD) reported first-quarter financial results Tuesday after market close.

Here are the key highlights.

Robinhood Q1 Earnings

Robinhood reported first-quarter revenue of $1.07 billion, up 15% year-over-year. The revenue total missed a Street consensus estimate of $1.18 billion, according to data from Benzinga Pro.

The company reported earnings per share of 38 cents in the quarter, missing a Street consensus estimate of 46 cents per share.

Transaction-based revenues were $623 million for the first quarter, up 7% year-over-year, broken down as follows:

  • Other transaction revenue: $147 million, +320% year-over-year
  • Options revenue: $260 million, +8% year-over-year
  • Equities revenue: $82 million, +46% year-over-year
  • Cryptocurrencies revenue: $134 million, down 47% year-over-year

The other category includes event contracts revenue. Event contracts were a record 8.8 billion traded in the first quarter.

The decline in cryptocurrencies revenue comes with the price of Bitcoin (CRYPTO: BTC) down in the first quarter compared to the end of 2025.

Net deposits were $18 billion in the first quarter. Chief Financial Officer

Full story available on Benzinga.com

This post was originally published here

Leading cryptocurrencies fell alongside stocks on Tuesday amid a report that AI giant OpenAI reportedly missed its key targets.

Cryptocurrency 24-Hour Gains +/- Price (Recorded at 9:35 p.m. EDT)
Bitcoin (CRYPTO: BTC) -1.12% $76,330.28
Ethereum (CRYPTO: ETH)
               
-0.82% $2,283.76
XRP (CRYPTO: XRP)                          -1.41% $1.37
Solana (CRYPTO: SOL)                          -0.75% $83.88
Dogecoin (CRYPTO: DOGE)              +0.34% $0.09955

Crypto Market Drags Lower

Bitcoin fell to an intraday low of $75,673, with trading activity substantially falling over the last 24 hours. Ethereum wobbled in the tight range between $2,250 and $2,300, while XRP also traded in the red.

Shares of Strategy Inc. (NASDAQ:MSTR) and Coinbase Global Inc. (NASDAQ:COIN) closed down 2.06% and 1.33%, respectively.

Over $190 million was liquidated in the past 24 hours, predominantly affecting long traders, according to Coinglass data.

Open interest in Bitcoin futures fell further by 3.54% over the last 24 hours. Binance derivatives traders remained bearish on the asset, placing more short positions vis-à-vis longs.

“Fear” sentiment persisted in the market, according to the Crypto Fear & Greed Index.

Top Gainers (24 Hours) 

Cryptocurrency (Market Cap>$100 M) Gains +/- Price (Recorded at 9:35 p.m. EDT)
SKYAI (SKYAI)       +33.02%     $0.2187
Humanity Protocol (H)                  +24.07%     $0.1757
Unibase (UB)             +19.61%     $0.05871

The global cryptocurrency market capitalization stood at $2.55 trillion, following a drop of 1.01% over the last 24 hours.

Stocks Retreat On …

Full story available on Benzinga.com

This post was originally published here

A judge dismissed on Tuesday rejected jailed cryptocurrency mogul Sam Bankman-Fried’s request for a new trial, labelling the new evidence brought by him as “wildly conspiratorial.”

Judge Questions SBF’s Key Arguments

Bankman-Fried, popularly known as SBF, filed a request for a new trial earlier in February, stating that Daniel Chapsky, former FTX head of partnerships, Ryan Salame, former FTX Digital Markets co-CEO, and Nishad Singh, former FTX engineering director, were “threatened” by the DOJ into silence or changing their statements.

Judge Lewis Kaplan, who sentenced Bankman-Fried to 25 years in prison for the FTX scam, said that none of the witnesses were “newly discovered” and that SBF was aware of them before the trial.

“He could have obtained or at least sought to compel their testimony. But he did neither. His assertion that their absence [or, in one case, the decision of the witness to testify against him] …

Full story available on Benzinga.com

This post was originally published here

American Bitcoin Corp. (NASDAQ:ABTC) co-founder Eric Trump lashed out on Tuesday at an article painting the firm as an “arbitrage play” targeting MAGA supporters.

Trump Brings Out The ‘China’ Angle

In an X post, Trump attributed the critical coverage to Forbes’ ownership by Hong Kong-based Integrated Whale Media Investments.

“Since being acquired by China, Forbes has become a political weapon and an embarrassment to journalism,” he said. “Educate yourselves as to the source of your information — in this case, China!”

Trump compared the current narrative to Forbes’ past reporting on his St. Jude Children’s Research Hospital fundraising, with some funds allegedly diverted to other charities linked to his family.

Forbes didn’t immediately return Benzinga’s request for comment.

Full story available on Benzinga.com

This post was originally published here

LONDON, April 29, 2026 /CNW/ — iFOREX today announced its admission to the Main Market of the London Stock Exchange (LSE) under the ticker IFRX, with a market valuation of approximately ÂŁ43.3 million. This milestone represents a major step in the Company’s global growth strategy and supports its continued expansion across international markets, including cryptocurrency CFD trading for retail investors in Latin America (LATAM) and beyond.

The listing underscores iFOREX’s commitment to combining traditional financial instruments with the evolving opportunities presented by the cryptocurrency market. Over the past decade, iFOREX has offered retail traders access to a broad portfolio of crypto CFDs, including Bitcoin (BTC), Ethereum (ETH), Ripple (XRP), Litecoin (LTC), and a growing range of other digital assets, alongside forex, commodities, indices, equities, and ETFs. The Company’s proprietary online and …

Full story available on Benzinga.com

This post was originally published here

T-Mobile US Inc. (NASDAQ:TMUS) reported first-quarter results after Tuesday’s closing bell, beating analyst estimates on the top and bottom lines. 

Here’s a look at the details inside the report. 

Q1 Details       

T-Mobile US reported quarterly earnings of $2.27 per share, which beat the consensus estimate of $2.02 by 12.38%, according to Benzinga Pro data. 

Quarterly revenue came in at $23.11 billion, which beat the Street estimate of $22.97 billion and was up from $20.89 billion in the same period last year.

T-Mobile reported the following first-quarter highlights:

  • Postpaid net …

Full story available on Benzinga.com

This post was originally published here

Visa, Inc. (NYSE:V) reported its second-quarter results after Tuesday’s closing bell, beating analyst estimates on the top and bottom lines. 

Here’s a look at the details inside the report. 

Q1 Details       

Visa reported quarterly earnings of $3.31 per share, which beat the Wall Street estimate of $3.10, according to Benzinga Pro data. 

Quarterly revenue came in at $11.23 billion, which beat the consensus estimate of $10.74 billion and was up from $9.59 billion in the same period last year.

data-variant=”card”

This post was originally published here

Bloom Energy Corp (NYSE:BE) posted financial results for the first quarter after the market close on Tuesday. Here’s a look at the key details from the quarter.

Bloom Energy Q1 Highlights

Bloom Energy reported first-quarter revenue of $751.05 million, beating analyst estimates of $551.56 million, according to Benzinga Pro. The company reported first-quarter adjusted earnings of 44 cents per share, beating estimates of 13 cents per share.

Total revenue grew 130.4% on a year-over-year basis. Product revenue accounted for $653.3 million of the company’s quarterly revenue, up 208.4% year-over-year.

Bloom Energy ended the quarter with approximately …

Full story available on Benzinga.com

This post was originally published here

Seagate Technology Holdings Plc. (NASDAQ:STX) stock climbed after the company reported third-quarter results following Tuesday’s closing bell, blowing past analyst estimates on the top and bottom lines. 

Here’s a look at the details inside the report. 

Seagate Q3 Details       

Seagate reported quarterly earnings of $4.10 per share, which beat the Street estimate of $3.50 by 17.14%, according to Benzinga Pro data.

Quarterly revenue came in at $3.11 billion, which beat the analyst consensus estimate of $2.95 …

Full story available on Benzinga.com

This post was originally published here

NXP Semiconductors NV (NASDAQ:NXPI) shares are trading higher after the company reported first-quarter financial results Tuesday after market close.

• NXP Semiconductors stock is at critical resistance. What’s behind NXPI new highs?

Here are the key highlights.

NXP Q1 Earnings

NXP reported first-quarter revenue of $3.18 billion, up 12% year-over-year. The revenue total beat a Street consensus estimate of $3.16 billion, according to data from Benzinga Pro.

The company reported quarterly earnings per share of $3.05, beating a Street consensus estimate of $2.95.

For quarterly revenue, Automotive was the biggest segment at $1.78 billion, followed by Industrial & IOT at $628 million and Mobile at $391 million. These …

Full story available on Benzinga.com

This post was originally published here

Teradyne Inc. (NASDAQ:TER) reported first-quarter results after Tuesday’s closing bell, beating analyst estimates on the top and bottom lines. 

Here’s a look at the details inside the report. 

Q1 Details       

Teradyne reported quarterly earnings of $2.56 per share, beating the consensus estimate of $2.10 by 21.9%, according to Benzinga Pro data. 

Quarterly revenue came in at $1.28 billion, which beat the Street estimate of $1.21 billion and was up from $685.68 million in the same period last year.

Teradyne said that its record-breaking quarterly results were “driven by AI-related demand strength across compute segments …

Full story available on Benzinga.com

This post was originally published here

Western Digital Corp (NASDAQ:WDC) shares are surging in Tuesday’s after-hours session in sympathy with Seagate Technology Holdings (NASDAQ:STX), which popped after reporting strong earnings results.

What Happened With Seagate

Seagate beat analyst estimates on the top and bottom lines in its fiscal third quarter, reporting revenue of $3.11 billion versus estimates of $2.95 billion, and adjusted earnings of $4.10 per share versus estimates of $3.50 per share.

“Seagate delivered outstanding March quarter results, exceeding the high end of our revenue and EPS guidance, achieving record margin performance, and generating close to $1 billion in free cash flow,” said Dave Mosley, chair …

Full story available on Benzinga.com

This post was originally published here

Varonis Systems Inc. (NASDAQ:VRNS) surged 18.16% in after-hours trading to $30.06 after reporting its first-quarter 2026 results on Tuesday. The stock closed the regular session at $25.44 before the sharp post-market move.

Revenue Growth Driven By SaaS Expansion

The company reported total revenue of $173.1 million, up from $136.4 million a year earlier. SaaS revenue was the main driver, rising to $161.1 million from $88.6 million in the prior-year quarter.

SaaS annual recurring revenue reached $683.2 million, up 69% year-over-year, while growth excluding conversions came in at 29%.

AI Security Push And Product Development

Varonis highlighted continued expansion in AI-driven data security, including the launch of Varonis Atlas following its acquisition of AllTrue.ai. The platform focuses on visibility and control across AI systems and enterprise data environments.

Management emphasized increasing demand for AI security tools as enterprises accelerate adoption of artificial intelligence.

data-variant=”card”

Full story available on Benzinga.com

This post was originally published here

Seagate Technology Holdings Plc (NASDAQ:STX) surged over 18% in after-hours trading on Tuesday following the company’s fiscal third-quarter 2026 results, which highlighted strong profitability and continued momentum tied to AI-driven demand.

Q3 Result

Seagate reported quarterly revenue of $3.11 billion, up from $2.16 billion in the same period last year. The company posted GAAP diluted earnings per share of $3.27, while non-GAAP diluted EPS came in at $4.10.

Net income rose to $748 million, compared to $340 million a year earlier, reflecting significant year-over-year growth. The company also delivered strong margins, with GAAP gross margin at 46.5% and non-GAAP gross margin at 47.0%.

Seagate generated $1.1 billion in operating cash flow and $953 million in free cash flow during the quarter. The company also strengthened its balance sheet by retiring $641 million in debt and returning $191 million to shareholders through dividends and share repurchases.

Management highlighted that …

Full story available on Benzinga.com

This post was originally published here

Block, Inc.‘s (NYSE:XYZ)Bitkey rolled out an updated version of its hardware Bitcoin (CRYPTO: BTC) wallet on Tuesday, adding a larger display while keeping its core design centered on multi-signature self-custody.

What’s New?

Bitkey said that the new screen, apart from validating transactions, would also confirm wallet settings that govern what happens “when things go wrong.”

“Who gets notified if someone tries to recover the wallet, where those notifications go, who can help you recover if you lose everything, how much you can spend without the hardware, and who inherits your funds,” Bitkey said that all these decisions could be verified on the device now. 

Bitkey said the upgraded device, priced at $250, still defaults to a two-of-three multisignature setup and …

Full story available on Benzinga.com

This post was originally published here

Cryptocurrency punters are dialing back expectations for Bitcoin (CRYPTO: BTC) hitting $150,000 this year.

Bitcoin To $150,000 Unlikely In 2026

Polygon (CRYPTO: POL)-based Polymarket currently assigns only a 10% chance of Bitcoin reaching the key milestone in 2026, down from 27% at the start of the year. The odds of it reaching $150,000 by June 30 were unsurprisingly at only 2%.

A whopping $18.36 million has been wagered on the outcome. The market resolves to “Yes” if any BTC/USDT 1-minute candle on Binance on the specified date has a final “High” price equal to or greater than $150,000.

This post was originally published here

XRP (CRYPTO: XRP) scarcity on Binance has hit its highest level since July 2024, but XRP has broken below $1.40 support on high volume as rising Bitcoin (CRYPTO: BTC) dominance draws capital away from altcoins.

The Scarcity Signal

The XRP scarcity index on Binance climbed to around 0.75 in recent days, reflecting a notable decline in available supply on the exchange, according to a CryptoQuant analyst.

The metric suggests an XRP supply shock is likely due to increased withdrawals or a slowdown in deposits.

Historically, such high levels are associated with investor accumulation as assets move to private wallets rather than staying on exchanges. 

This reduces the likelihood of …

Full story available on Benzinga.com

This post was originally published here

Bitcoin trades near $76,000 as institutional flows turned negative ahead of a closely watched Federal Reserve meeting.

Bitcoin ETFs saw $263.2 million in net outflows on Monday, while Ethereum ETFs reported $50.5 million in net outflows.  


Cryptocurrency

Ticker

Price
Bitcoin (CRYPTO: BTC) $76,365
Ethereum (CRYPTO: ETH) $2,277
Solana (CRYPTO: SOL) $83.62
XRP (CRYPTO: XRP) $1.38
Dogecoin (CRYPTO: DOGE) $0.09889
Shiba Inu (CRYPTO: SHIB) $0.056065

Meme coin market capitalization is down 3.5% to $36.4 billion over the past 24 hours.

Trader Commentary: 

Crypto industry expert Quinten Francois said Bitcoin remains confined within a trading …

Full story available on Benzinga.com

This post was originally published here

Cardano (CRYPTO: ADA) founder Charles Hoskinson warned that the quantum threat to Bitcoin (CRYPTO: BTC) is arriving faster than anticipated as 11 major companies passed the first gate in DARPA’s quantum benchmarking initiative.

The Timeline Is Accelerating

DARPA brought together 11 companies from IBM to Quantinuum through a three-stage process to determine whether functional quantum computers arrive by 2033 and whether they can break encryption. 

Within the next 12 to 24 months, the industry will know if this is a near-horizon problem or something for the 2040s or 2050s.

Ethereum (CRYPTO: ETH) developer Justin Drake previously says there’s at least a 10% chance of quantum computers breaking crypto by 2032. 

He recently revised that estimate forward after observing progress in neutral atom computing.

“The quantum threat is …

Full story available on Benzinga.com

This post was originally published here

Block Inc. (NYSE:SQ) published its first proof-of-reserves report Monday, disclosing total Bitcoin (CRYPTO: BTC) holdings of 28,355 BTC worth roughly $2.2 billion as of March 2026, confirmed by third-party auditors.

Block’s Bitcoin Holdings: Customer vs Corporate Split

Block’s Bitcoin reserves split into two categories: 19,357 BTC ($1.5 billion) held on behalf of customers and 8,997 BTC ($692.3 million) in corporate holdings. 

The report covers assets across Block’s corporate treasury, Square, and Cash App.

The company said users shouldn’t have to trust that their Bitcoin is there, they should be able to verify it. 

Using on-chain signatures, anyone can independently confirm Block’s holdings. Reserves are actively controlled, not just historically observed.

Block launched a proof-of-reserves dashboard that lets users verify wallet ownership …

Full story available on Benzinga.com

This post was originally published here

BlackRock (NYSE:BLK) is integrating its tokenized money market fund BUIDL with cryptocurrency exchange OKX as Bitcoin (CRYPTO: BTC) spot ETFs continue to attract significant inflows.

Under the arrangement, the fund can be used as collateral while continuing to generate yield from low-risk assets such as U.S. Treasuries.

The underlying assets remain held in custody by Standard Chartered, ensuring regulated backing while allowing traders to deploy the tokenized units as margin, Bloomberg reported on Tuesday.

The structure is designed to address a long-standing inefficiency in …

Full story available on Benzinga.com

This post was originally published here

On Monday, an X-based stock tracker, known for following the trades of Former House Speaker Nancy Pelosi (D-Calif), highlighted concerns over a well-timed purchase of Micron Technology Inc. (NASDAQ:MU) shares by Sen. John Fetterman (D-Pa.).

Micron’s Well-Timed Purchase

The tracker showed that Fetterman bought Micron shares for $321.80 on March 30, coinciding with the purchase date of what appears to have been a short-term bottom for the semiconductor giant. Since then, the stock has reportedly surged more than 60%.

The Pelosi tracker highlighted, “Coincidentally, that was the exact bottom, and he’s up +61%.”

Sen. Fetterman did not immediately respond to Benzinga’s request for comments.

The stock tracker also revealed that “Micron received $6.165B from the CHIPS Act, which is the largest award in the program. Fetterman sits on the Commerce Committee, which directly oversees CHIPS Act funding.”

Micron’s Rally Aligns …

Full story available on Benzinga.com

This post was originally published here

Jim Cramer on Monday highlighted a sudden shift in sentiment around Nvidia Corp (NASDAQ:NVDA), noting that bearish traders appear to have vanished as selling pressure dried up, potentially signaling renewed bullish momentum for the AI chip giant’s stock.

Nvidia Selling Pressure Appears To Ease

In a post on X, the market commentator said, “these sellers of Nvidia just disappeared!”, pointing to a potential shift in near-term market structure and a change in supply-demand balance for the AI chip giant. The comment suggests that bearish pressure on Nvidia shares may be easing, at least in the near term, as fewer investors appear willing to sell at current levels.

Cramer’s comments came as Nvidia stock rallied 4% on Monday to $216.61. The stock was seen 0.99% higher at $218.75 in the after-hours session.

The sentiment aligns with recent market enthusiasm and the broad sector rally driven by rising AI demand. The Philadelphia Semiconductor Index notched 18 straight sessions of gains, the longest winning streak on record, …

Full story available on Benzinga.com

This post was originally published here

While Wall Street is focusing on Nvidia Corp.‘s (NASDAQ:NVDA) historic rise, the massive capital expenditures driving the artificial intelligence (AI) boom are championing a few other semiconductor “worker bees.”

The End Of The ‘Magical Balance Sheet’

Speaking on Phil Ronsen‘s podcast, Steve Sosnick, Chief Strategist at Interactive Brokers, said the underlying fundamentals of the world’s largest technology companies are shifting.

Tech giants like Meta Platforms Inc. (NASDAQ:META) and Microsoft Corp. (NASDAQ:MSFT) are laying off thousands of employees while simultaneously committing massive sums to build out their AI infrastructure.

These tech behemoths “went from having almost a magical balance sheet” with phenomenal margins and low fixed costs, Sosnick noted, to aggressively spending “double-digit billions” to develop their AI computing capabilities.

Rise Of The ‘Worker Bees’

While Nvidia designs the ultra-powerful processors capturing the majority of financial headlines, Sosnick argues that the immediate beneficiaries of this historic spending spree are actually the foundational hardware providers.

“The beneficiary is something like Texas Instruments. The beneficiary has been SanDisk, Micron,” Sosnick explained.

“It turns out the bigger beneficiaries, at least in this part of the cycle, have not even been the highest-end chips like Nvidia. It’s the worker bees, so to speak—the analog chips, the memory chips.”

Companies like Micron Technology Inc.

Full story available on Benzinga.com

This post was originally published here

Classover Holdings Inc. (NASDAQ:KIDZ) shares jumped 20.64% to $1.17 in after-hours trading after the AI-driven education company announced on Monday it has been named to TIME’s list of America’s Top EdTech Companies of 2026.

Recognition Highlights AI, Robotics Expansion

The ranking, compiled by TIME in partnership with Statista, evaluated over 2,500 companies based on financial strength and industry impact, placing Classover 122nd out of 250. The recognition reflects the company’s expansion into AI-driven education and robotics, including partnerships with firms such as ICreate, Luka, and Walimaker to integrate coding companions and hands-on learning tools.

Classover has also been building out its AI-powered Tutor Studio, which uses AI agents to streamline course creation and scale offerings without a proportional increase in costs, while leveraging a dataset of over 450,000 hours of live …

Full story available on Benzinga.com

This post was originally published here

Dynatrace Inc (NYSE:DT) shares are trending after-hours following reports that activist investor Starboard Value has taken a significant stake in the AI software company and is pressing for strategic and financial changes.

Dynatrace rose 0.91% to $35.61 in the regular session on Monday, before jumping 7.95% to $38.44 in after-hours trading.

What Investors Should Know

Starboard Value is an activist investment firm that typically takes positions in undervalued companies and engages with management to unlock shareholder value through operational improvements, cost discipline, and capital allocation changes.

In Dynatrace, Starboard has become a top-five shareholder and has been engaging with management in recent months, according to a draft letter seen by The Wall Street Journal. The firm is pushing for stronger profitability by tightening sales and marketing expenses and accelerating shareholder returns.

The investor is specifically pushing Dynatrace to expand share buybacks beyond its existing $1 billion authorization and believes the company could return more than $2.5 billion to shareholders over the next three …

Full story available on Benzinga.com

This post was originally published here

Veteran trader Peter Brandt on Monday urged Bitcoin (CRYPTO: BTC) bulls who are predicting $250,000 in 2026 to tone down the hype and focus on more realistic price targets.

No Bullish Bottoming Pattern Yet

Brandt, a technical analyst with nearly 50 years of experience, attached a daily chart on X, showing Bitcoin trading in a defined channel pattern since late 2025

“While it does not preclude further price gains, it is NOT a bullish bottoming pattern,” Brandt stated. “Those of you predicting $250,000 in 2026 need to stop with the mushrooms.”

Last …

Full story available on Benzinga.com

This post was originally published here

Billionaire investor Mark Cuban proposed on Monday that states should allow anyone to incorporate businesses powered by AI agents and stablecoins, and charge a premium for the service.

Incorporation Using AI Agents?

In an X post, the “Shark Tank” personality said that if he were a state governor, he would “add the ability for anyone,” and slap premium fees to rake in revenue.

Cuban also recommended that the state register its incorporation agent on the popular AI agent marketplaces launched by leading companies.

“First to market makes a killing,” he added.

Not Everyone Is In Agreement

Thomas Unise, Head of AI consulting company eeko systems, questioned the value of AI agents for business incorporation, …

Full story available on Benzinga.com

This post was originally published here

Leading cryptocurrencies took a U-turn on Monday, while stocks closed at new records, as the White House confirmed that President Donald Trump discussed Iran’s new proposal to end the war.

Cryptocurrency 24-Hour Gains +/- Price (Recorded at 9:20 p.m. EDT)
Bitcoin (CRYPTO: BTC) -2.21% $77,290.59
Ethereum (CRYPTO: ETH)
               
-3.24% $2,385.89
XRP (CRYPTO: XRP)                          -2.80% $1.39
Solana (CRYPTO: SOL)                          -3.04% $84.78
Dogecoin (CRYPTO: DOGE)              -0.44% $0.09923

Crypto Market Corrects

Bitcoin pulled back sharply after Sunday’s spike, facing intense selling pressure as 24-hour trading volumes surged 44%.

Ethereum fell to an intraday low of $2,267 after breaking $2,400 the day before. Dogecoin and XRP also retreated.

Shares of Strategy Inc. (NASDAQ:MSTR) and Coinbase Global Inc. (NASDAQ:COIN) closed down 1.06% and 1.53%, respectively.

Over $330 million was liquidated in the past 24 hours, predominantly in bullish long positions, according to Coinglass data.

Open interest in Bitcoin futures fell 1.03% over the last 24 hours. Sentiment among Binance derivatives traders remained bearish, with more short positions vis-à-vis longs.

Market sentiment flipped from “Neutral” back to “Fear,” according to the Crypto Fear & Greed Index.

data-variant=”card”
data-news-mode=”manual”

>


Read Also:

Strategy Buys 3,273 Bitcoin For $255 Million: MSTR Targets $205

This post was originally published here

Amkor Tech (NASDAQ:AMKR) reported first-quarter financial results on Monday. The transcript from the company’s first-quarter earnings call has been provided below.

Benzinga APIs provide real-time access to earnings call transcripts and financial data. Visit https://www.benzinga.com/apis/ to learn more.

The full earnings call is available at https://event.choruscall.com/mediaframe/webcast.html?webcastid=83oloXM1

Summary

Amkor Tech reported record first quarter revenue of $1.68 billion, a 27% increase year-on-year, driven by growth across all end markets, with communications showing the strongest growth.

The company continues to invest in advanced packaging platforms, including hdfo, flip chip, and test, and is expanding its geographic footprint with new facilities in Arizona and Korea.

Amkor Tech expects second-quarter revenue between $1.75 and $1.85 billion, with projected gross margins of 14.5% to 15.5% and a full-year CapEx estimate of $2.5 to $3 billion.

Management highlighted strong demand in the semiconductor industry, while closely monitoring risks such as geopolitical tensions and material supply constraints.

The company is preparing for a multi-year value creation journey, with a focus on advanced packaging and strategic partnerships, and anticipates a significant ramp-up in the compute segment driven by AI and data center applications.

Full Transcript

OPERATOR

Good day ladies and gentlemen and welcome to the Amkor Technology first quarter 2026 earnings call. My name is Diego and I will be your conference facilitator today. At this time all participants are in a listen only mode. After the speaker’s remarks, we will conduct a question and answer session. As a reminder, this conference is being recorded. I would now like to turn the call over to Jennifer Ju, Head of Investor Relations. Ms. Ju, please go ahead.

Jennifer Ju (Head of Investor Relations)

Good afternoon and welcome to Amcor’s first quarter 2026 earnings conference call. Joining me today are CEO Kevin Engle and CFO Megan Faust. Our earnings press release was filed with the SEC this afternoon and is available on the Investor Relations page of our website along with the presentation slides that accompany today’s call. During this presentation we will use non GAAP financial measures and you can find the reconciliation to the comparable GAAP financial measures in the slides. We will make forward looking statements today based on our current beliefs, assumptions and expectations. Please refer to our press release for a disclaimer on forward looking statements and our SEC filings for a discussion on the risk factors and uncertainties that may affect our future results. I will now turn the call over to Kevin.

Kevin Engle (Chief Executive Officer)

Thank you Jennifer Good afternoon everyone. Thank you for joining us today. Amkor delivered a strong start to the year, achieving record first quarter revenue of $1.68 billion, up 27%. Year on year we saw growth across all end markets and we’re encouraged by the breadth of demand we’re seeing across our technology platforms. Communications delivered the strongest growth and mainstream posted its fourth consecutive quarter of both sequential and year on year growth. Leading chip companies continue to trust us for their advanced packaging and test needs. We are clearly benefiting from our partnerships and our leading technology as we execute on a growing set of advanced packaging programs. Earnings per diluted share were $0.33, significantly higher than last year, reflecting disciplined execution and continued progress on our margin initiatives. Overall, this was a quarter that reflected momentum and demand, disciplined execution by our teams and continued preparation for the advanced packaging ramps we expect in the second half of the year. As we discussed last quarter, overall semiconductor demand is robust. The industry backdrop remains dynamic. We are closely monitoring export controls and evaluating trade policies. We see supply dynamics around advanced silicon, advanced substrates and memory and are managing these risks with agility alongside our customers and suppliers. Some customer supplied materials are being delayed causing nonlinear loading. This has been expected and we are prioritizing production where materials are available to minimize impact. Uncertainty related to the geopolitical events in the Middle East have increased over the last few months to date, we have not seen any supply disruptions related to these dynamics. However, conditions in the region are putting additional pressure on material pricing. We’re working closely with our customers to offset these increases across the supply chain. Now let me share an update on our strategic initiatives. First, elevating technology leadership. We continue to invest in advanced packaging platforms including HDFO, flip chip and test. These are critical to next generation AI and high performance computing as discussed last quarter. We are engaged on several HDFO programs this year and the newest Data Center CPU program is expected to begin ramping this quarter. Our preparations in Korea remain on track to scale this program into high volume the second half of the year. Overall, we see increasing opportunities for the compute market from a diverse customer base. Second, expanding our geographic footprint in 2026. Our priorities include meeting construction milestones of our Arizona facility and expanding manufacturing space in Korea. In Arizona, we are excited to see the progress as we wrap up foundation work and move towards building steel construction. Construction of phase one is planned to be completed in 2027 in Korea. The new test building is on track for completion at the end of this year. This will provide incremental space to support data center demand going into 2027. Third, enhancing our strategic partnerships in key markets, we continue to strengthen collaboration with customers across the ecosystem including foundries, fabless companies, IDMs and OEMs. As part of our partnership engagement model, our customers are making contributions that help align technology roadmaps, support our capital investment and enable rapid ramps as new capacity comes online. Across all three pillars, we remain focused on margin improvements driven by operational excellence, increased utilization, favorable pricing and a sustained mix shift towards higher value advanced packaging. Our mainstream factories in the Philippines are seeing improving demand and we’re continuing to optimize cost. In Japan, utilization of our advanced sites in Korea and Taiwan is increasing, improving profitability. In just over three weeks, we will host our 2026 Investor Day. This will give us an opportunity to provide deeper view into our strategic pillars. We will explain Amcor’s position as the semiconductor industry turns to advanced packaging for value creation. We are well positioned for this shift and we are at the beginning of a multi year value creation journey. We’re excited about our future. We look forward to sharing more of our story at the event on May 21st. I’ll now turn the call over to Megan to provide more details on our first quarter performance and near term outlook.

Megan Faust (Chief Financial Officer)

Thank you Kevin and good afternoon everyone. Amkor delivered record first quarter revenue of $1.68 billion, increasing 27% year on year revenue was above the midpoint of guidance driven by stronger than expected performance across all end markets except computing where we saw softness in PCs and laptops. The communications end market was the largest contributor to our year on year growth increasing 42%. We saw healthy demand across premium tier smartphones, especially iOS due to our strong footprint in the current generation. Android demand also remained healthy for the second quarter. Communications revenue is expected to be stronger than seasonal increasing mid to high single digits sequentially driven by continued strength in the iOS ecosystem. Revenue in the computing end market increased 19% year on year. Record revenue within AI data center applications was driven by broad based strength across multiple customers. This was partially offset by softness in PCs and laptops. Computing is expected to grow mid single digits sequentially in the second quarter driven by the ramp of the new HDFO data center CPU device that Kevin mentioned. Automotive and industrial revenue increased 28% year on year. ADAS and infotainment demand drove record revenue for advanced technology in this end market. The recovery in the mainstream portion of automotive and industrial continued with Q1 marking the fourth consecutive quarter of sequential growth. Revenue within the automotive and industrial end market is expected to grow mid single digits sequentially in Q2. Consumer revenue increased 4% year on year due to broad based improvement in demand across customers. Revenue in Q2 is expected to grow low teens percent sequentially driven by wearable products. Gross margin of 14.2% exceeded the high end of our Q1 guidance range primarily due to favorable product mix. Gross profit for the quarter was $239 million, up 52% from last year due to increased volume and focused cost management. Operating expenses for $139 million for Q1 operating income was $100 million and operating income margin was 6%, an improvement of 360 basis points year on year. Our effective tax rate for the quarter was 12.8% lower than our full year target of 20% due to discrete tax benefits recognized in the quarter. Net income was $83 million and EPS was $0.33. EBITDA was $285 million and EBITDA margin was 16.9%. As we have grown revenue by delivering high value advanced packaging technology to our customers, we are benefiting from the operating leverage in our model. In addition, our actions to structurally manage costs are showing up in our results demonstrating our ability to drive sustained margin improvement. As of March 31st we held $1.8 billion in cash and short term investments and total liquidity was $2.9 billion. Total debt was $1.4 billion and our debt to EBITDA ratio was 1.1 times. Our strong balance sheet provides the financial flexibility and liquidity for this next investment cycle. Now Turning to our second quarter outlook, building on the strong momentum in the first quarter, Q2 revenue is expected to be between 1.75 and $1.85 billion, representing a 7% sequential increase at the midpoint. Gross margin is projected to be between 14.5 and 15.5%. We expect operating expenses of approximately $120 million, which includes a gain on the sale of real estate of approximately $20 million. Our full year 2026 effective tax rate is expected to be around 20%. Net income is forecasted to be between 105 and $130 million, resulting in EPS between 42 and 52 cents. Our 2026 CapEx estimate remains at 2.5 to $3 billion. As a reminder, 65 to 70% is projected for facilities expansion including phase one of our Arizona campus. About 30 to 35% is projected for HDFO test and other advanced packaging capacity. The remaining spend is projected for R and D and quality programs. We anticipate elevated CAPEX spend for facilities expansion through 2027 as we complete phase one of our Arizona campus. At that point we will begin recognizing depreciation and other startup costs as we build and train the workforce ahead of production in 2028. Similar to our Vietnam ramp up phase, these preparation costs will be recognized in OPEX until programs are qualified for production, at which point they will transition to cost of goods sold. As a result, we anticipate this will start to dilute operating income margin by approximately 1 to 2% beginning in 2027 and improving in 2028. Once at full scale, we expect Arizona will be a significant driver of operating income margin expansion reflecting the benefits of high value advanced packaging at what is planned to be our most automated factory to wrap up we are pleased with our first quarter performance and the momentum we are building in 2026. We remain confident in the full year outlook we provided last quarter with revenue growth driven by acceleration in computing and strong growth in advanced automotive. Our focus and discipline as we execute on our strategic pillars positions us well to continue generating improved financial results and sustained shareholder value. I would like to emphasize Kevin’s remarks regarding our upcoming Investor Day. We are embarking on a multi year value creation journey, investing today to drive materially stronger earnings power in the future. We look forward to sharing more with you at our event on May 21st. This concludes our prepared remarks. We will now open the call up for your questions. Operator.

OPERATOR

Thank you. And at this time we will conduct our question and answer session. In order to get through as many questions in the time allotted, please limit yourselves to one question and one follow up question. To ask your question, press Star 1 on your telephone keypad. The confirmation tone will indicate your line is in the question queue. You may press star two if …

Full story available on Benzinga.com

This post was originally published here

On Monday, Cadence Design Systems (NASDAQ:CDNS) discussed first-quarter financial results during its earnings call. The full transcript is provided below.

This transcript is brought to you by Benzinga APIs. For real-time access to our entire catalog, please visit https://www.benzinga.com/apis/ for a consultation.

View the webcast at https://events.q4inc.com/attendee/818860995

Summary

Cadence Design Systems reported a strong Q1 2026 with 19% year-over-year revenue growth, driven by demand for their AI-enabled solutions, resulting in a record backlog of $8 billion.

The company raised its full-year 2026 revenue growth outlook to 17%, reflecting confidence in their expanding agentic AI offerings which are expected to drive increased EDA consumption.

Cadence continues to lead in the semiconductor design transformation with new AI superagents (VitaStack, InnoStack) and a strategic collaboration with Google Cloud, enhancing their cloud-native platform capabilities.

The IP business showed a 22% year-over-year growth with significant competitive wins, while the core EDA business grew 18%, showcasing strong customer adoption of their AI-driven solutions.

Management highlighted robust opportunities in physical AI and emphasized ongoing strategic investments in R&D and go-to-market capabilities, despite short-term dilution from the Hexagon acquisition.

Full Transcript

Abby (Operator)

Ladies and gentlemen, good afternoon. My name is Abby and I will be your conference operator today. At this time, I would like to welcome everyone to the Cadence first quarter 2026 earnings conference call. All lines have been placed on mute to prevent any background noise. After the speaker’s remarks, there will be a question and answer session. If you would like to ask a question during this time, simply press star and then the number one on your telephone keypad. Thank you. And I will now turn the call over to Richard Gu, Vice President of Investor Relations for Cadence. Please go ahead.

Richard Gu (Vice President of Investor Relations)

Thank you, operator. I’d like to welcome everyone to our first quarter of 2026 earnings conference call. I’m joined today by Anirudh Devgan, President and Chief Executive Officer and John Wall, Senior Vice President and Chief Financial Officer. The webcast of this call and a copy of today’s prepared remarks will be available on our website, cadence.com today’s discussion will contain forward looking statements including our outlook on future business and operating results. Due to risks and uncertainties, actual results may differ materially from those projected or implied in today’s discussion. For information on factors that could cause actual results to differ, please Refer to our SEC filings, including our most recent Forms 10K and 10Q, CFO commentary and today’s earnings release. All forward looking statements during this call are based on estimates and information available to us as of today and we disclaim any obligation to update them. In addition, all financial measures discussed on this call are non GAAP unless otherwise specified. The non GAAP measures should not be considered in isolation from or as a substitute for GAAP results. Reconciliations of GAAP to non GAAP measures are included in today’s earnings release. For the Q and A session today, we would ask that you observe a limit of one question only. If time permits, you can re queue with additional questions now. I’ll turn the call over to Anirudh.

Anirudh Devgan

Thank you, Richard. Good afternoon everyone and thank you for joining us today. I’m pleased to report that Cadence had a strong start to 2026 with accelerating AI demand and disciplined execution delivering one of the best Q1s in company’s history. Our record backlog of of $8 billion was ahead of plan, reflecting strong customer confidence in our AI driven portfolio and its pivotal role in enabling delivery of their increasingly complex chip and system design roadmaps. Given the accelerating momentum of our business, we are raising our 2026 revenue growth outlook to 17% and expect to achieve the rule of 60 for the first time. Sean will provide more details in a moment. Agentic AI era is here, and Cadence is leading the transformation of semiconductor and system design. At Cadence live Silicon Valley 2026, we took a major step towards fully autonomous chip design, pioneering the industry’s most advanced and comprehensive Agentic full flow platform. We introduced AgentStack, the head agent framework for our AI super agents which enables knowledge sharing across the design flow and extend autonomous designs from chips to three DIC to systems. Building on our revolutionary chip Stack AI Super Agent for RTL design and verification, we introduced two new breakthrough AI superagents, Vita Stack for analog and Custom Design and InnoStack for digital implementation and sign off. Together, these solutions span the entire chip design flow, creating a connected continuous learning platform that brings the industry closer to comprehensive automation. As the industry begins transitioning to Agentic AI, the need for physically accurate and highly mathematical EDA solutions become even more critical. Our AGENTI AI solutions are built on decades of domain expertise, proprietary data and tightly integrated physically accurate engines delivering high fidelity results. We continue to view our platform as a three layer cake with accelerated compute and data as the base layer, principle, simulation and optimization as the critical middle layer and Agentic AI as the top layer. As I’ve said before, we believe the greatest value comes from the tight coupling of these layers reinforcing each other to deliver much better results. As these super agents invoke our simulation, verification and implementation engines at scale, we expect them to materially expand to EDA consumption and drive higher usage across our platforms. We announced a strategic collaboration with Google to optimize the chip stack AI Super Agent with Gemini on Google Cloud by combining LLM Reasoning with GCP Scalable Compute. This collaboration delivers a cloud native platform for next generation chip development. In Q1, we furthered our long standard partnership with MediaTek through a wide ranging expansion across our new Agentic AI offerings and core EDA3 DIC and system analysis solutions. Physical AI is emerging as the next big wave of intelligence as AI moves into autonomous systems, autos, drones and robotics, and Cadence is uniquely positioned to lead this transition. The addition of Hexagon’s DNE leading structural and multibody dynamics technologies transforms our system analysis portfolio to a leadership position in physical AI, enabling customers to build and train fundamentally new AI world models by narrowing the critical Sim 2 real gap. At cadence Live Silicon Valley, we announced an expanded partnership on AI and robotics with Nvidia. By combining our Agentic AI driven solutions with Nvidia’s advanced technologies, we are accelerating engineering workflows and boosting productivity across chip design, physical AI systems and hyperscale AI factories. Now let me provide an update on our businesses. Our IP business continued its strong momentum with 22% year over year revenue growth driven by accelerating demand of AI, High Performance Computing (HPC) and automotive workloads. Growing complexity of advanced node designs and chiplet based architectures is driving strong demands of our differentiated star IP portfolio. Across interface, memory and foundation IP we achieved meaningful competitive wins and customer expansions at marquee accounts reflecting the breadth of our portfolio and more importantly the differentiated performance of our solutions. We closed a record deal with a leading global foundry marking our largest IP engagement with this customer to date and reinforcing our leadership at the most advanced nodes. With strong market tailwinds, focused strategy and expanding customer proliferation, we remain very well positioned for continued growth in ip. Our core EDA business delivered another strong quarter with revenue growing 18% year over year driven by increasing proliferation of our solutions at market shaping customers. Our AI driven solutions and increasingly our Agentic offerings are becoming an important part of customer renewals and expansions. Demand for a hardware accelerated in Q1 resulting in our best quarter ever led by AI, High Performance Computing (HPC) customers and increasing demand in automotive and robotics. Palladium Z3 continues to be the gold standard for emulation and drove multiple competitive displacement. Momentum on verification software grew particularly in Excelium and Verisim. Sim AI and chip stack generated tremendous customer interest with a large number of evaluations underway led by AI driven cadence cerebral solution. Our digital platform continues to gain share especially at the most advanced nodes. A global semiconductor design leader significantly increased their innovus usage and adopted our digital sign off solutions and a marquee AI infrastructure company expanded their usage of our sign off solutions and their leading edge ASIC designs in custom and analog. Our AI driven virtuoso studio continued its strong momentum in design migration and layout automation as it gets increasingly deployed by analog and mixed signal leaders seeking greater productivity. Our system design analysis business delivered 18% year over year revenue growth as AI driven multiphysics simulation and 3D IC become essential to addressing growing system challenges. We have strong momentum in 3Dic where our unified multi die integrated design to analysis flow is helping customers address their rising chiplet and advanced packaging complexities. We also saw strong momentum, insigrity and clarity with multiple memory and advanced IC packaging customers expanding their deployments as they move to higher speed interfaces. Customer adoption is increasing as they look to address signal integrity, power integrity and thermal challenges earlier in the design flow through deployment of a full cadence sign off flow. In closing, I’m pleased with our strong execution and the broad based momentum of our business. As the Agentic AI era unfolds, Cadence is leading the charge to realizing much higher design productivity. Increasing design complexity and the growing need for productivity is creating a compelling long term opportunity for Cadence. With our differentiated solutions and expanding agentiq AI portfolio, I believe we are very well positioned to lead this transition and continue delivering meaningful innovation and value to our customers. Now I will turn it over to John to provide more details on the Q1 results and our updated 2026 outlook.

John Wall (Senior Vice President and Chief Financial Officer)

Thanks Anirudh and good afternoon everyone. I’m pleased to report that Cadence delivered excellent Results for the first quarter of 2026 with accelerating momentum and broad based strength across all our businesses. Robust design activity coupled with our Solid execution drove 19% year over year Revenue growth and 45% operating margin for Q1 first quarter bookings were ahead of expectations, resulting in record backlog of $8 billion. Here are some of the financial highlights from the first quarter, starting with the P and L total revenue was $1,474,000,000. GAAP operating margin was 29.3%, non GAAP operating margin was 44.7% GAAP EPS was $1.23 and non GAAP EPS was $1.96. Next, turning to the balance sheet and cash flow. Our cash balance was $1,407,000,000, while the principal value of debt outstanding was $2,925,000,000. Operating cash flow was $356,000,000. DSOs were 67 days and we used $200,000,000 to repurchase Cadence shares. Before I provide our updated outlook, I’d like to highlight that it contains the usual assumption that export control regulations that exist today remain substantially similar for the remainder of the year. For our updated outlook for 2026, we expect revenue in the range of $6,125,000,000 to $6,000,000,000 and $225,000,000 dollars. GAAP operating margin in the range of 27.5 to 28.5% non GAAP operating margin in the range Of 43.5 to 44.5% GAAP EPS in the range of $4.39 to $4.49 non GAAP EPS in the range of 7.85 to $7.95 operating cash flow in the range of 1.875 to $1.975 billion and we expect to use approximately 50% of our free cash flow to repurchase Cadence shares in 2026. With that in mind, for Q2, we expect revenue in the range of $1,555,000,000 to $1,595,000,000 GAAP operating margin in the range of 28.5 to 29.5% non GAAP operating margin in the range Of 44.5 to 45.5% GAAP EPS in the range Of $1.07 to $1.13 and non GAAP EPS in the range of $2.02 to $2.08. And as usual, we published a CFO commentary document on our investor relations website which includes our outlook for additional items as well as further analysis and GAAP to non GAAP reconciliations. In conclusion, Cadence is off to a strong start for the year. We are raising our 2026 revenue outlook to approximately 17% year over year growth. As always, I’d like to thank our customers, partners and our employees for their continued support and with that operator we will now take questions.

Abby (Operator)

Thank you. At this time I would like to remind everyone who wants to ask a question to please press STAR and then the number one on your telephone keypad. As a courtesy to all participants, we ask that you please limit yourself to one question. We will pause for just a moment to compile the Q and A roster. And our first question comes from the line of Charles Shih with Needham. Your line is open.

Charles Shih (Equity Analyst)

Hi, good afternoon. Thanks for taking my question. Anirudh, I think I have a pretty high level question, but this is probably top of the mind for a lot of investors. We obviously learned agentic AI is probably good for EDA, good for license, consumption, etc. But we’re still hearing some concerns around AI’s ability to actually write the software. And there are some doubts around whether AI can actually write better EDA based tools like Based Tool, I mean Virtuoso Universe, those kind of tools. And obviously there are always many EDA startups happening at the same time. And so the question is AI’s ability to write software worries you about the defensibility of the EDA based tool business? Obviously, once again we understand that agentic AI is good for consumption of the base tool business, but want to get your thoughts? Thank you.

Anirudh Devgan

Yeah, hi Charles, thanks for the question. So I mean there are multiple parts to this. Of course I’m super excited about agentic AI applied to chip design and eda. And your question is more specific to the base tool and whether AI can write those base tools. So first of all, I’m very confident in our position in the base tool and our competitive advantage. And just to remind everyone, I mean we have about 15,000 people now in cadence. About 10,000 are in R and D. We have more than half of them have advanced degrees. I think more than thousand of them have PhDs from the top universities. So we will anyway deploy AI internally like we are to write our software better. But I’m not worried that some other party will be able to write any better base tools. And our competitor of the base tool is anyway best in class. And I don’t see any reason that will change going forward. Okay, now what I’m super excited that we launched in CadenceLIVE is the agentic part and the interplay of the agentic tools with the base tools, the AI orchestration combined with physical accurate based tools. And that creates new opportunities for us both in terms of TAM expansion. Because what agentic AI allows us to, is to sell products in spaces we didn’t have products before, like RTL generation, verification, plan generation. And those products I think will be consumed more on a subscription plus consumption model. So this is entirely a new category for Cadence. And then in turn, like you said, agentic AI will drive more of our base tools. So I feel pretty good about this kind of three layer framework we have talked about and confident going forward.

Abby (Operator)

And our next question comes from the line of Jason Salino with Keybanc Capital Markets. Your line is open.

Jason Salino (Equity Analyst)

Great, thank you so much. Maybe just a clarifying question. So I noticed that the operating margin guide, you know, it’s coming down, you know, by a little bit curious if, if like what are the main drivers of that? John and I know we’re layering in kind of the Hexagon acquisition, but on like an absolute basis it’s, it’s relatively small layering in that, that opex. So maybe you can just help, help us understand the, the guide on the margin. Thank you.

John Wall (Senior Vice President and Chief Financial Officer)

Yeah, sure, Jason, thanks for the question. Yeah. What you’re seeing there is primarily the impact of including the hexagon design and engineering business in the current outlook. The strategic opportunity there is very large. But the 2026 PNL reflects the timing of integration that the, we announced in the press release when we, when we closed the deal that we expect 160 million of revenue this year. That’s, that’s in the guide now. We expect it to be dilutive by about 28 cents. The margin impact on the 160 million is kind of in the 5 to 10% range. But, but the dilution comes from, because we paid 30% of the acquisition price in shares and 70% in cash. So the interest component or the loss interest income on the cash causes a lot of the dilution impact in the short term. We’d expect it to be accretive in 2027. So I think the way to think about it is financially 2026 is an integration year and the guide includes the acquired cost base, the financing impact, the acquisition related integration costs and kind of near term dilution. And that’s why revenue moves higher while EPS and operating margin are lower than the February guide. So yeah, it’s 160 million. And I think in Q1 the impact was slightly less on the EPS that we had about 20 million of revenue from Q1 from Hexagon, so only about $0.01 kind of dilution impact. So EPS would have been like $0.01 higher if we didn’t have Hexagon.

Abby (Operator)

And our next question comes from the line of Vivek Arya with Bank of America securities. Your line is open.

Vivek Arya (Equity Analyst)

Thanks for taking my question. You know, Aniruddh, in the last year all we have been hearing nonstop are different news about chip shortages and growing kind of price of chips and just, you know, the pricing power that many of your customers have. And my question is what effect do shortages and the fact your customers have more pricing power, what effect does that have on their engagement with cadence? You know, does it restrict Chip start? Does it shift them towards higher ASP products? Just, just what impact do semiconductor shortages have on your growth and engagement trajectory? What, what has changed and …

Full story available on Benzinga.com

This post was originally published here

On Monday, Bed Bath & Beyond (NYSE:BBBY) discussed first-quarter financial results during its earnings call. The full transcript is provided below.

Benzinga APIs provide real-time access to earnings call transcripts and financial data. Visit https://www.benzinga.com/apis/ to learn more.

View the webcast at https://events.q4inc.com/analyst/478993577?pwd=g7emtfMu

Summary

Bed Bath & Beyond Inc reported a 7% increase in revenue year-over-year, marking the first revenue growth in 19 quarters, despite discontinuing Canadian operations.

The company achieved its lowest operating cost structure in over 12 years, contributing to a $5 million improvement in adjusted EBITDA and a $24 million decrease in net loss.

Strategic initiatives included acquisitions of Kirklands and the Container Store, with plans to integrate these into a three-pillar ecosystem focused on omnichannel retail, product and financial services, and home services.

Future outlook includes a target to remove $60 million in costs over the next nine months and a strategy to leverage data and AI for operational efficiency and customer engagement.

Management emphasized a shift towards being a data and technology company within the home space, with plans to use blockchain and tokenization for customer and home lifecycle management.

Full Transcript

OPERATOR

Hello everyone. Thank you for joining us and welcome to the Q1 2026 Bed Bath & Beyond Inc Earnings Conference Call. After today’s prepared remarks, we will host a question and answer session. If you would like to ask a question, please press star one to raise your hand. To withdraw your question, press star one again. I will now hand the conference over to Melissa Smith, the General Counsel and Corporate Secretary. Melissa, please go ahead.

Melissa Smith (General Counsel and Corporate Secretary)

Thank you. Good afternoon and welcome to Bed Bath Beyond Inc.’s first quarter 2026 earnings conference call. Joining me on the call today are Executive Chairman and Chief Executive Officer Marcus Lemonis, President Amy Sullivan, Chief Financial Officer Adrian Lee, and Chief Operating Officer Lisa Foley. Today’s discussion and our responses to your questions reflect management’s views as of today, April 27, 2026 and may include forward looking statements including without limitation, to statements regarding our future business strategy goals, financial performance outlook for the remainder of the quarter or any other period, anticipated growth, stock price, profitability, macroeconomic conditions, the value of any of our brands and investments, relationships with third parties and agreements we are entering into with them, margin improvement, expense reduction, marketing efficiencies, conversion, customer experience, changes to brands or websites, product offerings, the merger agreement with the Container Store, blockchain and tokenization efforts and strategies, and the timing of any of the foregoing. Actual results could differ materially from such statements. Additional information about risks, uncertainties and other important factors that could potentially impact our financial results is included in our Form 10K for the year ended December 31, 2025, in our Form 10Q for the quarter ended March 31, 2026 and in our subsequent filings with the SEC. During this call, we’ll discuss certain non GAAP financial measures. Our filings with the SEC, including our first quarter earnings release which is available on our Investor relations website@investors.bedbathandbeyond.com contain important additional disclosures regarding these non GAAP measures, including reconciliations of these measures to the most comparable GAAP measures. Following Management’s prepared remarks, we will open the call for questions. A slide presentation with supporting data is available for download on our Investor Relations website. Please review the important forward looking statements disclosure on slide two of that presentation. With that, Marcus, it’s all yours.

Marcus Lemonis (Executive Chairman and Chief Executive Officer)

Thank you so much. I am both honored and privileged to be serving as of January 1st as the CEO of Bed Bath & Beyond and I want to thank everybody for joining. Over the last two years our company has been focused on rebuilding this business, reconstructing the cost structure and lowering the hurdle for profitability with an intense amount of discipline and tough decisions around headcount, legacy technology and the cost of acquiring and retaining our customer base. The objective has been to reposition the company for growth with a definitive point of view of reclaiming profitability coupled with long term durability. That work was not about short term fixes or temporary solutions. It was about making structural changes to how we operate by simplifying the organization, removing layers, materially reducing our cost structure and aligning the team around a clear and consistent set of priorities focused on the homeowner asset allocation and data. These priorities have not changed. Were focused on driving top line growth, operating profitability and building something that is unique, durable and meaningful in the home space. In many cases those decisions were not immediately visible in the numbers last couple years were rough. Declining revenue while dramatically improving margins and lowering the cost structure created short term pressure on the perceived value of our company. Those changes were necessary because without resetting the foundation, there was no path to substantive profitability or to building something with purpose that would last. I knew the changes would take time to show up, but that when they did, they would appear in a way that were durable and repeatable. This is the eighth quarter in a row where the bottom line has improved. Back in January when I laid out our long term plan with our Everything Home 3 Pillow ecosystem, we as a team committed to inflect top line growth while continuing to reduce costs. That happened. We delivered revenue of approximately $248 million up 7% year over year or 9.4%. When you exclude our discontinuing operations from Canada, which marks the first time in 19 quarters that this business has delivered year over year growth, that result occurred concurrently. While our operating cost for the quarter reflected the lowest operating cost structure in over 12 years, the growth we are seeing is emerging from a fundamentally reset operating mindset, not incremental spending or short term activity. That shift becomes clearer as you look beneath the top line. We’re acquiring our customers more efficiently, our own channels are performing better and the engagement we are seeing is higher quality. As the quality of the business improves, the financial performance begins to reflect it adjusted ebitda improved by $5 million year over year and our net loss improved by $24 million. At the same time, the underlying trends are moving in the right direction. We’re encouraged by the stability of our active customer file with returning customers and orders delivered improving sequentially. These trends are important because they show that the foundation is not only holding up, but it’s beginning to build. Stabilizing the business was never the end goal. It was just my Starting Point Everything we are building starts with a simple idea. The home is not a single transaction. It is a life cycle that unfolds over time, providing us with an opportunity to use technology and data to create lifetime value from every single customer relationship. On average, homeowners remain in their home for approximately 11 to 12 years and during that period they move in, maintain their home, improve it, finance it, experience life events, and eventually transition out of it. Historically, those interactions have been fragmented across different companies and disconnected systems. What we are now building is a connected approach. As a reminder, we have organized the business into three pillars that reflect that life cycle. Lifecycle Lifecycle the Omnichannel platform is where the relationship begins. Yeah, the retail business online and in store. Our products and financial services platform allows us to participate more deeply in the economic activity tied to the home. And our home Services platform, maybe the one I’m most excited about, brings us directly physically into the home. Earlier this quarter we completed the first acquisition of our Omni Channel pillar. With the Kirkland’s transaction, we acquired Strategic Real Estate, a product development and sourcing organization second to none and Exceptional Management. Additionally, we announced the deal to acquire The Container Store. That transaction gives us Trophy Real Estate that is wildly underutilized, a world class distribution and supply chain system and a home services business with Elfa and ClosetWorks that will move into Pillar 3, a foundational culture and process that will sit at the hub of Pillar one and it comes with exceptional leadership as well. Between those two, we will absorb the capabilities our businesses and our customers want and eliminate all of the redundancies and inefficiencies quickly. Pillar two, our product and financial services group, is just getting started and as noted previously, will include property and casualty insurance and home warranties through a nationwide relationship with Brown and Brown Insurance via the Beyond Home Agency. It will also include America’s first homeowner credit union in partnership with a leading credit union. Additionally, this pillar will include our credit card program and product warranties. At the center of this pillar is a transaction agreed to in principle that includes a real estate brokerage, home title company and mortgage brokerage. This acquisition would not only create an origination engine for the overall ecosystem, but through technology and AI, will allow us to meet and transact with tens of millions of customers without a traditional cost of acquisition. The final pillar, and potentially the most exciting, is Pillar three, our home services business. Early this quarter we announced the intent to acquire F9 brands which includes Cabinets to Go Lumber Liquidators, Inc. and South Wind Building Products. This acquisition would serve as a platform Transaction bringing unbelievable executive management, warehouse and supply chain capabilities and over a half a billion dollars of revenue. Attached to that platform are ELFA and ClosetWorks organization systems which were part of The Container Store transaction. Lastly, we’ve agreed to in principle to acquire a nationwide network of installation and renovation professionals. We believe that’s part of building our moat together. We believe this creates a high margin pillar that is defensible against E commerce competitors and firmly differentiate our company as a service provider regardless of what’s happening with the economy. But what is equally important, what I want to be very clear about is how we are building this business. We are not acquiring companies for the sake of scale. We are acquiring capabilities. Many of these businesses and brands that I mentioned have had decades of success but struggled more recently as standalone entities. They became burdened with fixed costs, duplicative infrastructure and inefficient cost structures and debt that limited their ability to perform. What we see is something very different. We see capabilities that fill specific roles across our white paper for the entire homeowner life cycle. When you think about the white space of homeownership, each of these businesses represents a critical function that that customer needs over time, across those 11 or 12 years. Our strategy is to extract those capabilities, preserve what makes them valuable and eliminate very strongly eliminate the layers of cost and inefficiency that came with operating them independently. We preserve what works, we remove what does not work, and we connect everything through a single system. Earlier today we announced a partnership with BILT that allows that single operating connectivity system to work for the consumer. When we bring those capabilities together inside of one platform, supported by shared infrastructure and a unified data lake and a single customer identity, they become significantly more powerful together than they ever were apart. This is where our model is fundamentally divergent from traditional consolidation. Most consolidations focus on cost removal. That’s part of our model. And we’ll continue to eliminate those costs and inefficient operating expenses, including underperforming assets. But the real opportunity is not just cost. The real opportunity is the revenue that we believe we can create by understanding that single sign on unified customer layer, giving each of these brands and each of these businesses an opportunity to cross promote inside of one big data lake. By connecting these businesses through technology and artificial intelligence, we are building a system that allows us to engage with the same customer across multiple needs over time, dramatically lowering our cost of acquisition while increasing the lifetime value that customer could offer us. Each of these businesses has built and retained its own customer base by bringing those customer bases together into a single ecosystem. We create a competitive advantage that allows us to grow revenue at a disproportionate rate compared to standalone competitors. It’s over 100 million unique homeowners. That’s not theoretical, it’s structural. That is our business model when you look across the brands we’ve acquired and are in the process of acquiring, including Overstock, Bed, Bath and beyond, The Container Store, Bye Bye Baby, Kirkland’s Lumber Liquidators, Inc., Alpha Closet Works and Cabinets to go along with our partnerships across insurance, credit warranties and our planned acquisition in brokerage, mortgage, title, installation and renovation. What we are assembling is not a collection of businesses, it’s an ecosystem. Each business contributes a capability, each capability strengthens the platform and together they create something significantly more value than the sum of its parts. Each of these pillars has value independently, but the real value is when they work together. That’s what allows us to move from serving a customer once to serving the same customer repeatedly over time. With that, I’ll turn the call over to Adrienne.

Adrienne Lee

Thank you Marcus. I’ll now turn to our first quarter financial results. Revenue increased 7% year over year in the first quarter and 9% if you exclude the impact of discontinuing our Canadian operations. AOV improved 6% driven by our continued focus on improving assortment, driving a healthy mix in the living room, furniture and patio on the Bed Bath & Beyond site and an increased sales mix into overstock. Orders delivered increased by almost 1% in the period. Gross margin landed at 23.9% for the quarter, a decline compared to the same period last year but still within the bounds of our operating range. We maintained effective discounting tactics partially offset by lower sales and marketing expense, lapped loyalty points breakage from 1Q25 and saw benefits from improved carrier costs and exiting underperforming operations. Sales and marketing expense had improved efficiency of 50 basis points as a percent of revenue versus last year. This result was driven by disciplined spend and paid and improved return in own channels. G&A and tech expense of 36 million decreased by 5 million year over year or 8 million if you exclude the impact of one time costs from acquisition related activities. All in adjusted EBITDA came in at a loss of $8 million, a 41% or 5 million improvement versus the first quarter of 2025. Reported adjusted diluted Earnings Per Share (EPS) was a loss of $0.25 per share, a $0.17 improvement year over year. We ended the quarter with cash cash equivalents and restricted cash of 163 million. Cash used in operating activities improved year over year by more than 39 million or 77%, illustrating stabilization of operations. In the quarter, we invested approximately 26 million in acquisition related activities. With that, I’ll turn the call over to Amy.

Amy Sullivan (President)

Thank you, Adrienne. Our focus on the operating side is simple. Translate the strategy into consistent, disciplined execution and ensure that as we scale these capabilities, we do it in a way that is efficient, scalable and built to drive sustainable returns. This work is being led by a strong operating team. Lisa is driving execution across operations and shared services, while Kyla, who we announced this afternoon, is leading our technology transformation. Together, they are building the unified data and intelligence layer that connects the ecosystem and enables how we operate and scale. Today, the majority of our revenue is driven by an asset light, increasingly productive e commerce platform. We’re pairing that strength with a fleet of more than 320 stores, allowing us to serve the customer across channels while improving productivity and return on assets. As we scale, we are focused on identifying the capabilities that truly drive performance and building around them while decisively eliminating the inefficiencies that come from operating as fragmented, layered businesses. Across the fleet, we are evolving our store formats with clearer roles and stronger economics while taking a disciplined approach to underperforming locations through repositioning, consolidation or exit where returns do not meet our thresholds. That same discipline is driving our merchandising strategy where we are simplifying assortments, improving margin productivity and strengthening vendor partnerships across the organization. We are simplifying how we operate, consolidating systems and teams into a unified platform while removing layers that slow decision making and limit efficiency. This approach extends to our data and engagement layer as announced this morning. Our partnership with Bilt accelerates a unified customer identity and loyalty foundation across the portfolio, strengthening engagement and lifetime value across all our brands. Customer service is central to this transformation. As we consolidate these functions, we are raising the bar across every single brand and every touch point from so the customer experiences consistency regardless of how they engage with us. This is about building an operating model that scales, retaining what drives value and removing what does not. As we continue to integrate new capabilities into the platform, that same approach will apply across the ecosystem, ensuring we preserve what works and remove excess complexity across retail products and financial services and home services. The result is a simpler, more transparent and more accountable organization with a cost structure designed to drive profitable growth. With that, I’ll turn back to Marcus to close.

Marcus Lemonis (Executive Chairman and Chief Executive Officer)

Thanks Jamie. What you’re seeing this quarter is early proof of a model that is beginning to come together. …

Full story available on Benzinga.com

This post was originally published here

Kforce (NASDAQ:KFRC) reported first-quarter financial results on Monday. The transcript from the company’s first-quarter earnings call has been provided below.

This transcript is brought to you by Benzinga APIs. For real-time access to our entire catalog, please visit https://www.benzinga.com/apis/ for a consultation.

View the webcast at https://events.q4inc.com/attendee/458426539

Summary

Kforce Inc reported Q1 2026 revenues of $330.4 million, marking the first year-over-year growth since Q4 2022, with earnings per share of $0.46 exceeding expectations.

The company anticipates revenue growth in Q2 to accelerate to mid-single digits, driven by increased demand for flexible workforce solutions and AI-related projects.

Kforce Inc continues to focus on its integrated strategy and global talent strategy, including expanding its India Development center and establishing AI Innovation Studio and AI pods.

Management highlighted strong execution in pricing and service delivery, leading to higher gross margins and operating leverage.

The company returned $18.6 million to shareholders through dividends and share repurchases, maintaining a conservative leverage ratio of 1.2 times net debt to EBITDA.

Full Transcript

OPERATOR

Good day everyone and welcome to the Kforce Q1 2026 earnings call. As a reminder, this call is being recorded at this time. I would like to hand the call over to Mr. Joe Liberatore. Please go ahead Sir.

Joe Liberatore

Good afternoon and thank you for your time today. This call contains certain statements that are forward looking, are based upon current assumptions and expectations, are subject to risks and uncertainties. Actual results may vary materially from the factors listed in Kforce Inc’s public filing and other reports and filings with the SEC. We cannot undertake any duty to update any forward looking statements. You can find additional information about our results in our earnings release and our SEC filings. In addition, we have published our prepared remarks within the Investor Relation portion of our website. We are extremely pleased to have successfully driven results in the first quarter that again exceeded our expectations from both a revenue and profitability perspective. The momentum that we carried into the beginning of the year has continued to strengthen resulting in year over year revenue growth for the first time in several years. As Jeff Hackman will cover in more detail, our trajectory has continued to improve in the first month of the SECond quarter, which we expect will lead to accelerating year over year growth in Q2 in the mid single digits. I cannot be prouder of the tenacity of our people or more appreciative of the trust that our world class clients are increasingly placing in Kforce to drive more meaningful and valuable engagements with them. Our go to market approach which was born out of our integrated strategy efforts, appears to be paying dividends. Our people continue to operate more fully as one Kforce, leveraging the firm’s capabilities across all service offerings. While recent economic data continues to point to a generally softer labor market and professionally oriented roles, our performance reflects strong execution and a clear shift we’re seeing across our customer base. However, several of the leading indicators we track which have historically signaled strengthening demand for our services, are improving. Companies are increasingly turning to flexible talent strategies to move forward on significant backlog of high priority technology initiatives, especially in the age of artificial intelligence where CEOs remain cautious to add permanent headcount. At the same time, heightened geopolitical uncertainty, including the conflict involving Iran, has contributed to significant volatility in the global energy markets, resulting in sharp price increases across oil, gasoline, natural gas and electricity. In this environment, clients are focused on agility. We believe uncertainty is reinforcing the value of flexible workforce solutions as organizations seek to adapt while they gain greater clarity around geopolitical developments and the longer term impact of emerging technologies on their business and talent strategies. Against this backdrop, we remain optimistic that our recent operational data and several conSECutive quarters of improving revenue performance reflect a more typical historical cyclical pattern consistent with prior demand recoveries. As we have stated, we’ve witnessed and participated in transformative technology shifts before, such as personal computing, the emergence of the Internet, the mobile revolution and the move to cloud computing. Each of these periods of technological change impacted labor markets. Yet over time, workers, including technologists, have continued to upskill and retrain themselves to improve the relevancy of their skill sets. As technology has evolved over the last 50 plus years, we’ve placed skill sets that include mainframe operators, COBOL programmers, database administrators, web developers, mobile application developers, DevOps engineers, cloud architects, UI UX designers, data scientists, data engineers, AI platform engineers, AI product managers, prompt engineers, etc. The point is, the tasks change or in some cases completely go away. Job titles change, skill composition shifts and at the end of the day, new roles are created, new businesses are spurred, new industries are created resulting in a net positive amount of technology oriented job growth as society’s unquenchable thirst for technology advancements and productivity gains. We believe generative AI, and its offshoots into agentic AI and cognitive AI is in the early stages of the evolution and may just be starting to align with historical patterns we’ve experienced. Recruiting the right in demand talent, assembling effective teams and implementing target enterprise level initiatives are crucial for organizations seeking to successfully integrate and leverage these new tools to maintain a competitive advantage. Our strong position enables us to grow our client portfolio and bring on new client opportunities, thereby sustaining our history of consistent above market performance fueled by client share growth, ultimately strengthening the foundation that delivers enduring value to our shareholders. Our business model is intentionally simple, organically driven and intensely focused. By limiting inorganic growth within our existing service areas, we protect our teams from unnecessary complexity and distractions. That focus allows our people to do what they do best, build deep relationships and partner with clients to solve their most critical business challenges. Our strategy has been thoughtfully refined over time, not overhauled because it has proven durable. That focus, combined with unified and resilient culture, is a real differentiator for us and essential to our consistent market outperformance. As our operating trends continue to improve, we’re also making great progress on our key strategic initiatives, including the implementation of Workday scaling, our India Development center, advancing our internal AI initiatives and continued refinement of the execution of our integrated strategy. Further to that point, we are pleased to have recently announced the establishment of our AI Innovation Studio within our headquarters and associated AI pods in India to support evolving client needs. As I conclude my remarks, I want to acknowledge the outstanding people who make up the Kforce team. I’m incredibly proud of their fortitude, adaptability and dedication demonstrated across the firm, particularly given the challenging business environment over the past three years. I am grateful every day for the opportunity to work with colleagues who bring this level of skill and commitment. Thanks to their efforts, we are well positioned strategically and I feel confident in our trajectory and and the opportunities ahead. Dave Kelly, our Chief Operating Officer, will now give greater insights into our performance and recent operating trends. Jeff Hackman, Kforce’s Chief Financial Officer, will then provide additional detail on our financial results as well as our future financial expectations.

Dave Kelly (Chief Operating Officer)

Thank you, Joe. Total revenues of $330.4 million represented a return to overall revenue growth for the first time since the fourth quarter of 2022. Encouragingly, we were successful at delivering year over year flex revenue growth in both our technology and FA&A businesses. The first quarter is typically characterized by sequential revenue declines on a billing day basis due to calendar year assignment ends. This is a very normal part of our business and the broader sector. There’s been a lot of discussion about our ability and the sector’s ability to deliver revenue growth given the much speculated demand impact of AI tools, and technologies. A data point that we think is particularly relevant is that our first quarter performance was meaningfully better than the average sequential decline over the past 15 years. Prior to AI becoming an hourly topic of conversation. Our results were driven by a combination of lower levels of project ends and a faster than normal rebound in new assignment activity. Further to this point, as Jeff Hackman will cover in his particular remarks, the midpoint of our guidance contemplates year over year growth in Q2 of approximately 4%. While clients continue to take a measured approach to technology spending amid an uncertain macroeconomic environment, investments in critical initiatives, particularly in data, digital and platforms that underpin long term AI strategies are actively being prioritized by our clients. Our recent momentum and operating trends suggest clients are increasingly green lighting long postponed initiatives through the use of flexible workforce solutions that are strategic to their needs and don’t have an easy or obvious AI related solution. Importantly, improvements in our business have been broad based with positive trends evident across a wide range of industries within our client portfolio and utilizing a wide range of skill sets. While we certainly continue to see growth in AI related data, digital and cloud projects, we’re also seeing a ramp in demand for platform and application development roles and projects. The demand for technology is broad based. We continue to make targeted organic investments in our consulting solutions business to meet rising client demand for cost effective access to highly skilled talent. These investments are strengthening our value proposition by expanding flexible delivery models and deepening differentiated expertise. As a result, our consulting led offerings are positively contributing to the performance of our technology business supported by a strong pipeline of high quality opportunities. Our fully integrated delivery model offering a seamless client experience across consulting, project based work and staff augmentation spanning multiple technologies and skill sets remains a clear point of differentiation in the market. We’ve seen clear signs of improvement improving demand across the entire spectrum of our service models. This integrated approach has been a core driver of our technology performance, enabling meaningful gross profit expansion over the past year despite a challenging macroeconomic backdrop while maintaining stability in average bill rates. We leverage long standing client relationships as the foundation of our model and focus on simplifying the buying process and accelerating decision making. An increasingly important component of our ability to deliver cost effective solutions is our global talent strategy, including access to highly skilled professionals outside the United States. Our development center in Pune, combined with strong domestic sales and delivery capabilities and a high quality vendor network enables a scalable multi shore delivery model that comprehensively addresses client needs. Demand for this channel continues to accelerate, reinforcing its strategic importance and strengthening our confidence in the durability of this model. We now have a multi shore delivery model being utilized within 60% of our 25 largest clients. We’ve been able to maintain a stable average bill rate of approximately $90 per hour over the last three years while building a higher quality, higher margin revenue stream. The increasing mix of consulting oriented engagements which command higher bill rates and significantly stronger margin profiles, along with disciplined management of wage inflation and core technology skill sets is effectively offset the downward pressure on bill rates from a greater mix of consultants based outside of the US Demand across our core practice areas including data and AI, digital platform engineering and cloud remains strong and our pipeline of consulting opportunities continues to expand. These disciplines represent foundational capabilities for the development and deployment of AI solutions and we believe organizations will increasingly require access to specialized talent to execute their strategies, creating meaningful and durable growth opportunities for our firm. Over the last several years, we have made responsible adjustments to align headcount levels with revenue levels and productivity expectations. As noted in last quarter’s call, we implemented further refinements to our organization in the first quarter. Despite these actions, we believe we have sufficient capacity to absorb the near term improvements in demand levels without the need for significant incremental resources, particularly as we continue to enable greater efficiency through our use of AI Solutions. We remain committed to investing in our consulting solutions business and other strategic initiatives that we believe will drive long term revenue and profitability growth. The actions taken in the quarter provide increased confidence in our ability to continue making these investments while maintaining our previously stated profitability objectives. We are energized by the opportunities ahead and confident in our ability to sustain recent momentum while continuing to deliver strong results. Our success reflects the deep trust and long standing partnerships we built with our clients, candidates and consultants. These are relationships that continue to serve as the foundation for our growth and innovation. I will now turn the call over to Jeff Hackman, Kforce’s Chief Financial Officer.

Jeff Hackman (Chief Financial Officer)

Thank you Dave first quarter revenue of 330.4 million exceeded our expectations and earnings per share of 46 cents was above the high end of our guidance. Our results for the first quarter demonstrate our ability to grow revenues while also driving a higher quality of business as evidenced by better than expected gross margins in the quarter as well as generating enhanced operating leverage. Overall gross margins of 27.3% were up 60 basis points on a year over year basis due to expanding flex margins which more than offset the impact from lower direct hire mix. Sequentially, gross margins were up 10 basis points in a quarter when they were expected to be seasonally down as improved flex spreads and favorable health care costs more than offset the seasonal payroll tax resets. The success we have had expanding our margin profile can be attributed to our teams pricing more effectively with clients to more appropriately reflect the value of our services and the benefit of higher quality business that we have been strategically driving. We have discussed that solutions oriented engagements have an appreciably higher …

Full story available on Benzinga.com

This post was originally published here

U.S. stocks finished Monday on a mixed note, with the Dow Jones Industrial Average slipping 0.1% to 49,167.79, while the S&P 500 edged up 0.12% to 7,173.91 and the Nasdaq climbed 0.2% to 24,887.10.

These are the top stocks that gained the attention of retail traders and investors through the day.

Joby Aviation (NYSE:JOBY)

Joby Aviation’s stock rose by 6.35%, closing at $9.04. The stock reached an intraday high of $9.13 and a low of $8.57, with a 52-week range between $20.95 and $6.03. In the after-hours trading, the stock rose 5.08% to $9.50.

This positive movement follows the announcement of the first-ever point-to-point electric vertical takeoff and landing (eVTOL) air taxi demonstration flights in New York City. The flights are part of Joby’s 2026 Electric Skies Tour, aiming to showcase the potential for commercial air taxi services in urban settings. The campaign highlights the viability of electric air taxis, which are quieter and produce zero emissions compared to traditional aircraft. 

data-variant=”card”
data-news-mode=”manual”

>


Read Also:

Palmer Luckey Says Apple’s New CEO John Ternus May Have Built Early VR Gear He Used As A Teen: ‘His Only Non-Apple Job Was…’

This post was originally published here

Rambus, Inc. (NASDAQ:RMBS) shares were down after the company reported mixed first-quarter results after Monday’s closing bell. 

Here’s a look at the details inside the report. 

Q1 Details       

Rambus reported quarterly earnings of 63 cents per share, which missed the consensus estimate of 64 cents.

Quarterly revenue came in at $180.19 million, which beat the Street estimate of $177.93 million, according to Benzinga Pro data. 

“Rambus opened 2026 with a solid first …

Full story available on Benzinga.com

This post was originally published here

Sanmina Corp (NASDAQ:SANM) shares are moving higher in extended trading on Monday on the heels of the company’s fiscal second-quarter results. Here’s what you need to know from the report.

Sanmina Q2 Highlights

  • Q2 Revenue: $4.01 billion, versus estimates of $3.29 billion
  • Q2 Adjusted EPS: $3.16, versus estimates of $2.40

Sanmina generated $399 million in cash flow from operations and $342 million in free cash flow during the quarter. The company ended the period with $1.58 billion in cash and cash equivalents.

“ZT Systems revenue significantly exceeded our expectations, driven by strong execution and customer demand, resulting in …

Full story available on Benzinga.com

This post was originally published here

Investors in a Blue Owl Capital Inc. (NYSE:OWL) fund tendered less than 1% of their shares to Saba Capital Management, led by Boaz Weinstein and Cox Capital Partners, despite the firms’ offer to purchase the stakes at a considerable markdown.

Shares in Blue Owl Capital Corp. II, one of the firm’s non-traded business development companies (BDCs), were met with limited participation. The tender offer will not be extended, according to Bloomberg.

The lack of participation in the tender offer suggests that investors are choosing to hold their shares rather than sell at prices below their original purchase cost, amid the private credit sector’s chaos.

The $1.8 trillion private credit sector has been under fire in recent weeks as investors are concerned about …

Full story available on Benzinga.com

This post was originally published here

Business First Bancshares (NASDAQ:BFST) held its first-quarter earnings conference call on Monday. Below is the complete transcript from the call.

This content is powered by Benzinga APIs. For comprehensive financial data and transcripts, visit https://www.benzinga.com/apis/.

Access the full call at https://edge.media-server.com/mmc/p/6n7xau4t/

Summary

Business First Bancshares reported one of its best first quarters, with improved earnings, strengthened capital levels, and enhanced liquidity posture.

The company completed its acquisition of Progressive Bank, adding over $700 million in assets and expanding its presence in North Louisiana.

Significant new hires, including 11 production officers, were made to support future growth, particularly in the Houston market.

Partnership with Covecta aims to leverage AI capabilities to improve efficiency and reduce future hiring needs.

Non-interest expenses were lower than anticipated, with core expenses remaining flat compared to the previous year.

The Financial Services Group contributed to non-interest income, with notable activities in interest rate swaps and SBA loan sales.

The company raised $85 million through a self-managed private placement of subordinated debt, utilizing it to redeem existing debt.

Loan growth was lower than expected due to high payoffs, but future growth is anticipated with new hires and market opportunities.

Net interest margin decreased slightly due to lower-than-expected loan discount accretion.

Overall, the company remains optimistic about future performance, reiterating full-year loan growth guidance and aiming for a 1.25 ROA by year-end.

Full Transcript

OPERATOR

Good morning and thank you for standing by. My name is John and I will be your conference operator today. At this time I would like to welcome everyone to the business Business First Bancshares’ first quarter 2026 earnings call. All lines have been placed on mute to prevent any background noise. After the speaker’s remarks, there will be a question and answer session. If you would like to ask a question during this time, simply press star followed by the number one on your telephone keypad. And if you would like to withdraw your question, press star one again. I would now like to turn the conference over to Matt Seeley, Director of Corporate Strategy. Please go ahead. Thank you.

Matt Seeley (Director of Corporate Strategy)

Good morning and thank you all for joining. Earlier today we issued our first quarter 2026 earnings press release, a copy of which is available on our website along with the slide presentation that we’ll reference during today’s call. Please refer to slide three of our presentation which includes our safe harbor statements regarding forward looking statements and the use of non GAAP financial measures. For those of you joining by phone, please note the slide presentation is available on our website at www.b1bank.com. Please also note our safe harbor statements are available on page six of our earnings press release that was filed with the SEC today. All comments made during today’s call are subject to those safe harbor statements in our slide presentation and earnings release. I’m joined this morning by Business First Bancshares CEO and Chairman Jude Melville, Chief Financial Officer Greg Robertson, Chief Banking Officer Philip Jordan and President of B1Bank Jerry Vasquez. After the presentation, we’ll be happy to address any questions you may have. And with that, I’ll turn the call over to you.

Jude Melville (CEO and Chairman)

Jude: Okay, thanks, Matt. Good morning and thank you for joining us today. We know there are plenty of things you all could be doing on a Monday morning in a world environment as complex as the one in which we find ourselves. And we appreciate you choosing to spend this time with us. This was one of, if not the best first quarters that we have had as a company. We continue to improve earnings, strengthen capital levels and improve quality of our liquidity posture while consummating our second material acquisition in the past three years and making a number of non acquisitive investments that will pay off over the course of the next few years. A highlight for the quarter was the addition of a substantial number of new teammates. As I just mentioned, we closed the progressive transaction on January 1st. In balance sheet terms, the acquisition adds over 700 million in assets in nine branches across North Louisiana deepening our footprint in an area in which we were already a market leader. Asset quality of the acquired portfolio is stellar, as is the makeup of the expanded client base. On a very promising note, since we announced the acquisition, construction on the metaverse center project in Northeast Louisiana has accelerated and been expanded, and we expect tens of billions of dollars of private investment in a region in which we are as well situated to capture the benefits as any financial institution, large or small. The morale among our former progressive teammates is high and the working partnership is off to as smooth a start as any acquisition that we’ve had the honor to participate in, which bodes well for our ability to operate as one team over the course of this year, even before conversion is executed. We also added a material number of bankers organically. In our last call I mentioned the addition of John Heine, our new market president in Houston, former market President from Veritex Bank. To date, John has attracted an additional 11 teammates, including seven production officers, the majority of which are also former Veritex bankers. Also in Houston, we are honored to add Ben Marmond to lead our corporate banking activities in Texas. Ben was a longtime banker for Iberia and then first horizons, serving in leadership capacities across South Louisiana and for the past five years as president of the FHN Financial’s Houston Market. These new partners have already begun building a pipeline of opportunities and we anticipate them contributing meaningfully to our growth in the second half of the year as we seek to take advantage of MA lead disruption in the Houston market. We announced and have begun a partnership with Covecta, a provider of agency AI capabilities. I include this in my discussion on new teammates because over time we anticipate this partnership leading to both our more efficiently leveraging the talent we have on board and to our minimizing hiring as we continue to grow. We are beginning this effort focused on our consumer workflows in which we have already identified over 300 policy rules for potential automation anticipate expanding utilization of the partnership across broader use cases throughout the bank, including deposits and credit. This effort will take time to unfold, but we are more confident with each day that the potential is actionable and will prove to be meaningful. It’s important to note that as we explore the potential of agentic AI, we remain focused on governance, validation and human oversight so that as models, policies and industry requirements change, we retain our ability to manage that evolution in a disciplined and controlled way. A very positive note for the quarter is that even as we grow the team, we remain focused on cost control with non interest expenses for the quarter lower than anticipated after accounting for the increased costs associated with the progressive current run rate. Our core expenses were essentially flat quarter over quarter as well as in comparison to last year’s first quarter. We do anticipate the cost of the new hires adding incrementally to our expense rate over the second quarter, but note that the super majority of the hires were production oriented which should lead to further operating leverage improvements As a key component of our positive earning results. We are pleased to note the contribution of our non interest income primarily through the Financial Services Group and in particular their work providing interest rate swaps and SBA loan gains on sale. As you know, we’ve been working the past three years on diversifying our revenue streams with investments in this arena in part so that we might be able to continue to produce consistent earnings even in quarters in which our spread income was not as strong as we hoped. The potential of this effect was put to test in the first quarter as loan volumes were lower than anticipated due primarily to heightened loan payoffs and pay downs. In addition to the contribution to current earnings. We utilized the Financial Services Group to successfully complete a fully self managed private placement of subordinated debt just after quarter end, raising $85 million within our cohort of correspondent banking relationships. Of the $85 million raised we utilized $67 million to redeem existing sub debt, some of which had crossed the five year mark and had already lost about $10 million in capital treatment. The successful debt raise is important in and of itself, but I’m most excited about the way in which we accomplished it, both utilizing and contributing to our growing network of community bank partners. In closing, we feel very positive about the first quarter on a number of fronts and anticipated to be the start of a solid full year. We reiterate full year loan guidance on loan growth based on our sooner than expected hiring of production officers and we continue to forecast a 1.25 ROA end of year run rate. One of our guiding principles is belief in the compounding power of incremental improvement and we see that principle in action in our first quarter results. Thank you again for being with us. And with that I’ll turn it over to Greg.

Greg Robertson (Chief Financial Officer)

Thank you Jude and good morning everyone. As always, I’ll spend a few minutes reviewing our results and we’ll discuss our updated outlook before we open up to Q and A. First quarter GAAP net income and EPS available to common shareholders was 22.2 million and included 2.2 million merger related expenses, $28,000 gain on former bank premises and $80,000 gain on sale of securities. Excluding the non core items, Non GAAP core net income and EPS available to common holders was $24,000,073 per share. From our perspective, first quarter results marked another quarter of strong financial performance generating a 1.10 core ROAA and a core efficiency ratio of 62% for the quarter. Our first quarter earnings results were highlighted by continued discipline on the expense side and a meaningful contribution from our financial services correspondent banking group. As Jude mentioned also during the quarter we completed the acquisition of North Louisiana based Progressive bank which closed on January 1st of this year and added 774 million in total assets in nine new locations. From …

Full story available on Benzinga.com

This post was originally published here

Bloom Energy Corp (NYSE:BE) shares are trading higher in Monday’s after-hours session after Oracle Corp (NYSE:ORCL) announced it will use Bloom Energy fuel cells for Project Jupiter.

Project Jupiter To Utilize Bloom Energy Fuel Cells

After the market close on Monday, Oracle announced that the company and BorderPlex Digital Assets will utilize Bloom Energy fuel cells to power a planned AI data center campus in New Mexico.

The data center will now be supported by up to 2.45 GW of …

Full story available on Benzinga.com

This post was originally published here

Nucor Corp (NYSE:NUE) reported financial results for the first quarter on Monday after the close. Here’s a rundown of the steelmaker’s report.

Nucor Q1 Highlights

Nucor reported first-quarter revenue of $9.50 billion, beating analyst estimates of $8.88 billion, according to Benzinga Pro. The company reported earnings of $3.23 per share for the quarter, beating estimates of $2.80 per share.

Steel mills segment earnings increased due to higher average selling prices and volumes across all product groups. Steel products segment earnings rose on increased volumes and stable average realized pricing, and the raw materials segment increased due to higher average selling prices and volumes.

“All three of our operating segments reported sequential …

Full story available on Benzinga.com

This post was originally published here

Amkor Technology, Inc. (NASDAQ:AMKR) reported its first-quarter results after Monday’s closing bell, beating analyst estimates on the top and bottom lines. 

Here’s a look at the details inside the report. 

data-variant=”banner”
data-news-mode=”manual”

>


Read Also:

EXCLUSIVE | $9 Billion And Counting: GameStop Says It Will ‘Be Disciplined’ — But Shareholders Are Asking When

This post was originally published here

Celestica Inc. (NYSE:CLS) reported its first-quarter results after Monday’s closing bell, beating analyst estimates on the top and bottom lines. 

Here’s a look at the details inside the report. 

Q1 Details       

Celestica reported quarterly earnings of $2.16 per share, which beat the analyst consensus estimate of $2.07, according to Benzinga Pro data. 

Quarterly revenue clocked in at $4.05 billion, which beat the consensus estimate of $3.96 billion and was up from $2.65 billion in the same period last year.

Celestica reported the following Q1 highlights:

  • Revenue: $4.05 billion, increased 53% compared to $2.65 billion for the …

Full story available on Benzinga.com

This post was originally published here

One day, 2026 might enter the history books alongside 1973 as a year that reordered the global energy landscape.

The Iran war has effectively locked down the Strait of Hormuz and baked in the loss of at least 1 billion barrels of supply ― and the snowballing impact of the event is reordering global energy dependencies and trade relationships.

Such a shift is particularly profound for Asia, the world’s largest oil consumers, which is strongly dependent on energy from the Persian Gulf and is now forced to patch its supply chains.

This pivot is already visible in the data: Asia’s crude imports are on track for their lowest April level since 2016. In their place, refiners are aggressively sourcing U.S. WTI, U.S. Mars, Kazakh CPC Blend, and West African sweet crude to keep their economies afloat.

“It’s possible that oil flows through the Strait of Hormuz will never return to pre-war levels, Amrita Sen, director of research at Energy Aspects, said at the FT Commodities Global Summit in Lausanne.

America Becomes The World’s Backup Barrel

During a recent interview on CNBC’s Squawk Box, President Donald Trump noted a development in the physical market.

Trump said that the world’s largest oil tankers are …

Full story available on Benzinga.com

This post was originally published here

Bernstein analysts on Monday told clients “the best days of crypto are ahead,” pointing to Strategy Inc.’s (NASDAQ:MSTR) STRC perpetual preferred as a key engine driving the next leg of Bitcoin (CRYPTO: BTC) accumulation.

Polymarket bettors aren’t quite as convinced.

Bitcoin was changing hands around $77,000 Monday, closing in on the $80,000 level Bernstein flagged as a milestone on the way back up.

The bullish note from analyst Gautam Chhugani landed days after Strategy disclosed it now holds 818,334 BTC, following Michael Saylor’s largest single-day Bitcoin purchase on record.

The STRC Flywheel

Chhugani called STRC a “high-yield, low-volatility vehicle” pulling in income-focused investors and recycling that capital into more Bitcoin.

Strategy is proposing to shift the product from monthly to twice-monthly dividend payments while keeping the 11.5% annualized yield intact.

That mechanism, more than spot ETF inflows, is what Bernstein sees as the engine …

Full story available on Benzinga.com

This post was originally published here

Federal Reserve Chair Jerome Powell is days from one of the most consequential decisions of his career: walk away from the central bank when his chairmanship ends May 15, or stay on as a governor through January 2028 and deny Donald Trump a working majority on the Fed board.

Friday’s Justice Department decision to drop its criminal probe into Powell removed the last condition he had set before deciding. By Sunday, holdout Sen. Thom Tillis (R-N.C.) had dropped his block on Kevin Warsh’s confirmation as the next chair.

Modern Fed chairs almost always walk when their chairmanships end. Powell told reporters in March he had “not made that decision yet” and would base it on “what I think is best for the institution and the people we serve.”

The Working Majority Math

If Powell leaves, Donald Trump fills a fourth seat on the seven-member board alongside his three other appointees: Michelle Bowman, Christopher Waller and Warsh.

That …

Full story available on Benzinga.com

This post was originally published here

Nothing lasts forever.

This is especially true in the business world: Entrepreneurs and executives come and go, and industries and companies rise and fall.

These dynamics are very much at the core of TKer Stock Market Truth No. 9: There’s a lot of turnover in the stock market. Specifically, this observation concerns how stocks are regularly added to and removed from the market and the major indices.

But philosophically, Truth No. 9 also speaks to the many changes that long-lasting businesses experience during their time as going concerns.

People come and go 👋

Last Monday, Apple announced that Tim Cook, its CEO for 15 years, would step down from the top job in September.

This is a big deal as Cook oversaw many of the company’s wins, creating trillions of dollars of shareholder value. From the announcement:

He became CEO in 2011 and has overseen the introduction of numerous products and services, including new categories like Apple Watch, AirPods, and Apple Vision Pro, and services ranging from iCloud and Apple Pay to Apple TV and Apple Music. He was also instrumental in expanding existing product lines. Under Cook’s leadership Apple has grown from a market capitalization of approximately $350 billion to $4 trillion, representing a more than 1,000% increase, and yearly revenue has nearly quadrupled, from $108 billion in fiscal year 2011 to more than $416 billion in fiscal year 2025.

His departure surely has some investors concerned. Indeed, Apple shares fell 2.5% on the first trading day following the announcement, underperforming the market.

While leadership changes don’t always go as hoped, history also shows they can work out well. In fact, Apple is arguably the epitome of what shareholders hope for.

Cook had incredibly big shoes to fill in 2011 when he stepped in for visionary leader Steve Jobs. And he delivered.

“The fact of the matter is nobody is irreplaceable,” Berkshire Hathaway’s …

Full story available on Benzinga.com

This post was originally published here

TORONTO, April 27, 2026 /CNW/ – Montfort Capital Corp. (“Montfort” or the “Company”) (TSXV:MONT), announces that Janice Lederman and Paul Geyer have resigned from the Company’s Board of Directors, effective April 26, 2026.

“We thank both Jan and Paul for their years of service as Montfort directors and committee members,” said Howard Atkinson, Chair of the Board of Directors. “Their contributions to the Company have been meaningful.”

The Company does not intend to appoint replacement directors at this …

Full story available on Benzinga.com

This post was originally published here

Thrive Capital has bought a small stake in the San Francisco Giants through a new holding company called Thrive Eternal.

Thrive Eternal is a permanent holding company that will focus on assets with “qualities that cannot be replicated by technology,” founder Josh Kushner wrote in a post on X. 

“Thrive Eternal is built on the belief that the most enduring of these assets share common characteristics: they benefit from long-term stewardship, they compound through cultural resonance, and they are enhanced by technology rather than displaced by it,” Kushner wrote.

The vehicle is funded by existing investors in Thrive’s venture capital and growth equity funds. 

Details on the transaction were not disclosed, although Axios reported that it is for a sub-10% stake and includes both primary and secondary purchases. 

Sixth Street Partners and Arctos, two of the club’s existing institutional owners, have kept their stake in the franchise.The deal remains subject to MLB approval.

Big Names Join The Strategy

Last week, it was …

Full story available on Benzinga.com

This post was originally published here

Asian data center operator Princeton Digital Group (PDG), which is backed by private equity firm Warburg Pincus, is considering a minority sale.

PDG has hired Goldman Sachs to conduct a strategic review, which could result in new equity partners, Bloomberg reported. The process is still in its early stages and plans could change.

In 2017, Rangu Salgame and Varoon Raghavan founded PDG in partnership with Warburg Pincus. PDG develops and operates data centers in Singapore, Japan, India, Indonesia, China, Malaysia and South Korea. The company has more than 20 data centers across seven countries and “accelerates the growth of cloud and AI for global hyperscalers and enterprises,” its website states.

data-variant=”card”
data-news-mode=”manual”

>


Read Also:

KKR, Capital Group …

This post was originally published here

Steve Eisman, the investor who shorted subprime mortgages before the 2008 collapse, said the next credit cycle is brewing inside private equity’s software loan book, and generative AI is the trigger.

Eisman pressed Apollo Global Management Inc (NYSE:APO) co-head of global originations Chris Edson on his “Real Eisman Playbook” podcast about how the buyout industry’s largest single sector exposure may be quietly unraveling.

A Third Of Every Buyout

Software has accounted for roughly a third of all private equity buyouts over the past five to six years, Edson said, with total capital exposure across the direct lending market running into “hundreds of billions of dollars.”

That matters because the loans behind those buyouts were underwritten on the assumption that SaaS revenue is the most reliable cash flow in business.

Eisman summarized the model as “future number of seats multiplied by the average price,” calling …

Full story available on Benzinga.com

This post was originally published here

Gold enthusiast Peter Schiff said Monday that President Donald Trump has more in common with Rep. Alexandria Ocasio-Cortez (D-N.Y.) than Ronald Reagan, after the president floated using taxpayer money to buy Spirit Airlines out of bankruptcy.

If the proposal is sincere, Schiff posted on X, “either Trump doesn’t understand how capitalism works or doesn’t believe in its principles.”

The $500 Million Lifeline

Trump confirmed Thursday from the Oval Office that the government is weighing a taxpayer-funded takeover of the carrier, telling reporters he would “do it to save jobs” at the right price.

A tentative deal would hand Spirit a $500 million loan in exchange for warrants that could give the U.S. government as much as a 90% stake, according to CNBC. Spirit’s lawyer told a New York bankruptcy court Thursday that talks were at an advanced stage.

The airline …

Full story available on Benzinga.com

This post was originally published here

A new Federal Reserve Chairman has the potential to radically re-shape the way monetary policy is conducted in the U.S.- but, what’s the real story?

Revolution at the Fed?

A chorus of powerful men is calling for revolution at the Fed. David Malpas, former World Bank president being one of the most notable.

It’s not controversial anymore, the Fed is broken.

Jerome Powell’s time is up- a new Fed chair is coming soon. This past Tuesday, Kevin Warsh sat before the Senate Banking Committee for his confirmation hearing to become the next chairman of the Federal Reserve.

Outside of the typical political food fight, the most substantive part of the day was Warsh’s unusually blunt assessment of where the Fed has gone wrong and what he thinks needs to change.

Warsh called the ‘policy mistakes’ of 2021 and 2022 a “fatal policy error”. He said the kind of loose, reactive approach that oversaw M0 money supply increasing by over 85% and leaving inflation running red hot, left households and businesses still paying the price years later.

He criticized the Fed for enabling reckless fiscal policy from the Federal Government and its ridiculously large deficits.

M0 Money Supply (monetary base) – Percent Change from February 2020 to February 2022, and the end of balance sheet expansion.

His proposed fix?

A full “regime change” as he called it: a narrower focus on the core dual mandate of price stability and maximum employment, a fresh inflation framework (different metrics), far less reliance on unconventional tools, and a meaningfully smaller balance sheet.

“A SMALLER BALANCE SHEET?!”

The Reverse Money Printer

That last point matters. For more than a decade the Fed has leaned hard on quantitative easing (“QE”)- massive rounds of Fed money printing to buy financial assets from the banks that effectively printed trillions in new reserves to keep markets afloat and rates suppressed.

During the response to COVID, the Fed printed $3 trillion in bank reserves- just created out of thin air.

During the ongoing responses to the GFC, the Fed printed $3.2 trillion in bank reserves.

Remember, when the Fed …

Full story available on Benzinga.com

This post was originally published here

Bitcoin (CRYPTO: BTC) is decoupling from software stocks as inflation heads above 4%, setting up the negative real yields that historically send the token higher.

The Inflation Setup

Jordi Visser, a veteran macro investor with 30-plus years of experience, told Anthony Pompliano on an episode of Pompliano’s podcast on Saturday that service and manufacturing PMIs hit their highest levels since 2022 last week. 

Manufacturing bottlenecks are spreading from memory to CPUs to chemicals because of AI buildouts and Iran War disruptions.

“There is really no doubt in my mind that inflation is going higher,” Visser said. 

“Headline CPI is the one that I have confidence in will be above 4% as we keep getting this data,” he added.

He clarified that traditional inflation beneficiaries like housing and wages won’t improve. Instead, commodity prices, memory chips, CPUs, and semiconductors are driving the move with …

Full story available on Benzinga.com

This post was originally published here

Former Binance (CRYPTO: BNB) CEO Changpeng Zhao released his memoir “Freedom of Money” globally, revealing he voluntarily faced DOJ charges to protect Binance and the crypto industry.

Why He Came To The U.S.

Zhao was living in the UAE, a non-extradition state, and could have stayed there indefinitely.

However, he chose to face charges because staying away would have severely damaged Binance, hurt BNB holders, and negatively impacted the broader crypto industry.

Zhao said he didn’t expect to go to jail. His lawyers couldn’t find a single case where a single BSA violation landed someone in prison. 

He expected home confinement at worst, similar to what former BitMEX CEO Arthur Hayes received.

The Sentencing Shock

The DOJ asked for 36 months just one week before Zhao’s April 30, 2024 sentencing hearing. 

His lawyer called the request outrageous—even under the most severe sentencing guidelines, his sentence should have been 10 to 16 months.

The judge …

Full story available on Benzinga.com

This post was originally published here

If you’ve been around crypto long enough, you’ve probably been conditioned to think in one way. Buy, hold, or sell.

Most times, it is usually about how high the asset can go or how much returns one can get if a token rallies. But that belief has begun to change, especially in the institutional sense.

Because there are more practical uses for crypto than the simple act of trading in and out of the market. It’s becoming a form of strategic capital.

And not in the retail sense. This is more of an offering that institutions and high-net-worth individuals are exploring. Let’s go more into this new move.

The Clear Shift in How Crypto Is Used

In today’s markets, smart investors understand that the focus should not be purely on generating a return. It should be rather on accessing liquidity and retaining upside while avoiding unnecessary friction such as taxes.

This is the reason why leveraging assets has been an important part of traditional finance.  Whether it’s real estate, equities, or even fine art, wealthy investors rarely sell outright unless they have to. They choose to borrow against them instead and retain ownership while generating capital.

Crypto is adopting this approach as well. Instead of liquidating Bitcoin or stablecoins to fund other investments or purchases, investors are turning to lending using these assets. The appeal is pretty simple.

  • You maintain exposure to the upside.
  • You have immediate access to liquidity.
  • You minimize capital gains tax obligations.

Additionally, the numbers in the market practically tell the same story. According to Research And Markets data, the crypto lending market is expected to reach $25.06 billion by 2030, growing at a compound annual growth rate of 18.5%. Adoption is already widespread, with almost 9.3% of adults owning crypto assets in 2026.

And then there’s stablecoins. In the first seven months of 2025, the transaction value of stablecoins surpassed the $4 trillion mark, with several months exceeding the $1 trillion mark. This sort of scale cannot be attributed to a technology still in its experimental phase. This is a system that’s already being used globally.

Despite all that, most investors are caught between two options: selling the asset to cut their losses or waiting for better times. Crypto lending offers a solution to this dilemma.

The Moment Institutions Made It Real

Every market has a moment when things stop being theoretical and start becoming real. For crypto, that moment came in March 2026.

In …

Full story available on Benzinga.com

This post was originally published here

Procter & Gamble Co (NYSE:PG) reported better-than-expected third-quarter financial results.

Procter & Gamble reported quarterly earnings of $1.59 per share which beat the analyst consensus estimate of $1.56 per share. The company reported quarterly sales of $21.235 billion which beat the analyst consensus estimate of $20.516 billion.

“We delivered a solid acceleration in top-line results in our fiscal third quarter, with broad-based growth across product categories and regions,” said Chief Executive Officer Shailesh Jejurikar.

Procter & Gamble affirmed 2026 adjusted EPS guidance of $6.83 to $7.09, versus the $6.95 analyst estimate. The firm also reiterated its 2026 sales outlook of $85.127 …

Full story available on Benzinga.com

This post was originally published here

Allianz Global Investors (AllianzGI) announced the first close of its Allianz Asia Pacific Infrastructure Credit Fund, with $270 million in commitments.

This new fund complements AllianzGI’s existing Asia Pacific secured lending business and is designed for institutional investors seeking debt exposure to infrastructure borrowers in South and Southeast Asia. The final close is expected next year, according to a press release.

The fund targets financing for projects in renewable energy, energy transition, data centers, telecom networks, transportation, supply chain infrastructure and environmental services such as water and waste management. The strategy focuses on senior and unitranche loans backed by infrastructure assets, prioritizing steady cash flow generation and strong collateral protection.

AllianzGI’s Asia private credit team, led by Sumit Bhandari, will manage the vehicle in collaboration with the firm’s global infrastructure debt experts. Bhandari noted the inaugural fund close was anchored by commitments from the International Finance Corporation (IFC) and the Indonesia Investment Authority (INA), marking the launch of a new infrastructure-focused product for the region.

“South and Southeast Asia continue to present compelling opportunities, supported by strong structural demand for infrastructure and a clear role for private credit in addressing financing gaps. We believe this fund is well-positioned to provide investors with access to resilient, asset‑backed income while supporting the development of essential infrastructure across the region,” Bhandari said.

This post was originally published here

Easterly Government Props (NYSE:DEA) released first-quarter financial results and hosted an earnings call on Monday. Read the complete transcript below.

This transcript is brought to you by Benzinga APIs. For real-time access to our entire catalog, please visit https://www.benzinga.com/apis/ for a consultation.

View the webcast at https://edge.media-server.com/mmc/p/uin54vsf/

Summary

Easterly Government Props reported a 16% year-over-year increase in revenue to $91.5 million for Q1 2026, driven by recent acquisitions and stable lease conditions.

The company’s EBITDA grew by 12% to $57.3 million, with FFO per share increasing by 7% to $0.76, reflecting strong earnings growth.

Strategically, the company completed its first mezzanine investment tied to a VA outpatient clinic, with a 12% yield, highlighting a focus on capital allocation and long-term ownership opportunities.

The company maintained an occupancy rate of 97% and a weighted average lease term of 9.4 years, indicating strong operational performance.

Easterly Government Props raised the low end of its full-year guidance, now ranging from $3.06 to $3.12 per share, citing disciplined capital allocation and ongoing development projects.

Management emphasized the stability of its portfolio, supported by government functions, and the potential for future growth through strategic acquisitions and developments.

Full Transcript

OPERATOR

Welcome welcome to the Easterly Government Properties

Cole Barter

Good morning. Before the call begins, please note that certain statements made during this conference call may include statements that are not historical facts and are considered forward looking statements within the meaning of the Private Securities Litigation Reform act of 1995. Although the company believes that its expectations as reflected in any forward looking statements are reasonable, it can give no assurance that these expectations will be attained or achieved. Furthermore, actual results may differ materially from those described in the forward looking statements and will be affected by a variety of risks and factors that are beyond the Company’s control, including without limitation those contained in the company’s most recent Form 10K filed with the SEC and in its other SEC filings. The company assumes no obligation to update publicly any forward looking statements. Additionally, on this conference call, the Company may refer to certain non GAAP financial measures such as funds from operations, core funds from operations, and cash available for distribution. You can find a tabular reconciliation of these non GAAP financial measures to the most comparable current GAAP numbers in the Company’s earnings release and separate Supplemental Information package on the Investor Relations page of the company’s website@ir.easterlyreit.com I would now like to turn the conference call over to Darrell Crait, President and CEO of Easterly Government Properties.

Darrell Crait (President and CEO)

Thank you, Cole. Good morning everyone. We continue to operate in a market defined by volatility, whether it’s interest rates, geopolitical uncertainty or broader capital market disruption. In these environments, investors tend to focus on businesses with durable cash flows, strong tenant credit, and disciplined capital allocation. We believe Easterly continues to stand out in each of these areas. Our portfolio supports essential government functions that continue regardless of economic cycles or external events. These are facilities tied to critical federal missions, high credit, state and municipal agencies, and select defense related tenants. The durability of those missions and the strength of those credit relationships continues to provide a stable foundation for our business. Importantly, we believe our portfolio is often misclassified alongside traditional office real estate. That comparison misses the specialized nature of what we own from our FBI offices in places like El Paso, New Orleans and Pittsburgh. These facilities include secure classified environments, SCIFs and other controlled spaces where sensitive law enforcement and intelligence work is conducted. These are highly tailored facilities with support agents that support agency specific operations and are difficult to replicate. They serve essential functions, benefit from long duration leases, and are backed by some of the strongest credit tenants in the world. Against that backdrop, we remain focused on a straightforward strategy growing earnings, steadily allocating capital thoughtfully, and continuing to improve overall portfolio quality over time. Over the past several years we’ve taken deliberate steps to strengthen the company and including leadership transitions, resetting the dividend and maintaining additional capital internally. These decisions are not always easy, but they position us to enter 2026 from a position of strength, supporting a robust and sustainable dividend while continuing to deliver consistent earnings growth that outperforms our peers. Turning to the quarter, our portfolio continued to perform at a high level. Occupancy continues to outpace our REIT peers at 97% and weighted average lease terms stood at approximately 9.4 years. These metrics reflect both the quality of our assets and the mission critical nature of the work taking place inside our buildings during the quarter. We also completed our first mezzanine investment tied to the development of a new VA output patient clinic. This transaction reflects how we are thinking about capital allocation in today’s environment. While traditional acquisitions remain central to our long term growth strategy, we are also identifying adjacent opportunities that can generate attractive current returns while preserving future optionality. This investment is expected to deliver a 12% yield, is backed by a committed federal tenant, and allows us to remain connected to an asset that may ultimately fit in our long term term ownership strategy. VA facilities represent one of our largest portfolio exposures and that’s by design. These assets are highly specialized, tend to be very sticky, and are backed by the credit quality of the federal government. We were recently at our VA Jacksonville facility and it was filled with veterans receiving the care and services they need. An important reminder that these aren’t traditional office buildings but essential infrastructure Supporting Critical mission We also believe that the Administration’s increased focus on defense spending represents an additional tailwind for the company, particularly as it relates to external growth opportunities. As we look to the year ahead, we are encouraged by the strength of our first quarter performance and our ability to raise the low end of guidance. While broader market volatility remains, our priorities remain unchanged, disciplined capital allocation, operational execution and consistent earnings growth. We believe our portfolio offers investors a compelling combination of income stability, long term growth and exceptional tenant credit quality with a leased portfolio that generates a double A revenue stream. We look forward to working with the credit agencies on achieving an investment grade rating in 2027. To wrap up, we’re pleased with how the year started. We’re growing earnings, maintaining strong occupancy, allocating capital thoughtfully and continuing to improve portfolio quality. We believe that disciplined execution will continue creating long term value for shareholders. I want to thank our team for their continued focus and execution, as well as our tenants and shareholders for their ongoing trust and partnership. With that, I’ll turn the call over to Alison.

Alison

Thanks Darrell and good morning everyone. I’m pleased to report the financial results for the first quarter of 2026 on this sunny Monday morning. The underlying growth in the business is clear. Total revenue increased to $91.5 million, up from $78.7 million in the first quarter of 2025, a 16% year over year increase. This is driven primarily by acquisitions completed over the last 12 months, contractual rent growth and continued lease stability across the portfolio. EBITDA also grew meaningfully, increasing from $57.3 million from $51 million last year, representing approximately 12% growth, reflecting the expanding earnings power of the platform. Most importantly, that growth continued to translate into higher earnings for shareholders on a per share even as we raised capital to support portfolio expansion on a fully diluted basis. Net income per share was $0.03. FFO per share increased to $0.76, up from $0.71 representing approximately 7% growth, while core FFO per share increased to $0.77 from $0.73 or roughly 5.5% growth year over year. Our cash available for distribution was approximately $32.2 million. In terms of our active development projects, we are on track to meet previously communicated timelines. Our Fort Myers, Florida Lab project is expected to complete and commence its lease in the fourth quarter of 2026. That will be followed by the Flagstaff Courthouse in Arizona which is scheduled to deliver in the first quarter of 2027. Finally, the Medford Courthouse in Oregon is anticipated to complete during the second half of 2027. The delivery of these development projects are natural de-leveraging points towards our medium term cash leverage goals as the NOI comes online and any agreed upon lump sums are received. Turning to leverage, our adjusted net debt to annualized quarterly pro forma EBITDA was 7.3 times edging higher during the quarter due primarily to the timing of equity relating to our Commonwealth of Virginia acquisition. Given the share price volatility, the broader markets experienced in the first quarter, we elected to defer issuing the majority of that equity and we expect to complete the issuance by the end of the year. As Darrell mentioned, during the quarter we completed our first mezzanine loan investment providing $7 million of financing for the development of a new 120,000 square foot VA outpatient clinic in Kennewick, Washington. The loan carries an anticipated 12% yield and supports a 20 year firm term lease commitment from the Department of Veterans affairs with an expected project completion date of October 2028. The transaction is backed by an experienced VA and GSA developer as sponsor who our team has known for decades and Easterly has transacted with multiple times. This allows us the opportunity to acquire the property upon completion as well as and enables us to generate attractive current returns while remaining closely aligned with assets that fit our long term portfolio strategy. With the successful closing of the mezzanine loan during the quarter, we are raising the low end of our full year guidance by one penny from $3.05 to $3.06 resulting in a revised full year range of $3.06 to $3.12. While performance year to date is trending modestly ahead of our initial expectations, we continue to take a disciplined and cautious approach as we evaluate the remainder of the year, particularly given the ongoing volatility in the interest rate and broader equity market environment. At the midpoint, our guidance assumes that we will have 50 to $100 million of gross development related investment during the year and $50 million in wholly owned acquisitions. We continue to maintain a $1.5 billion acquisition and development pipeline and we are beginning to make meaningful progress on potential transactions that meet our investment criteria and can be executed at a spread to our cost of capital, either independently or through a partnership. We’re staying disciplined on capital allocation, focused on retaining our tenants and executing across our development pipeline, all in line with the strategic objectives we’ve communicated. These are the fundamentals behind Easterly’s stable and growing cash flows and we believe this will drive shareholder value. Thank you for your time this morning. We appreciate your partnership and look forward to updating you on our progress. With that, I will now turn the

Shannon (Moderator)

call back to Shannon.

OPERATOR

Thank you. As a reminder to the analysts to ask a question, you will need to press star 11 on your telephone. Please stand by while we compile the Q and A roster. Our first question is from Seth Burgay of Citi. Please proceed with your question.

Seth Burgay (Equity Analyst at Citi)

Hi. Thanks for taking my question. I guess just starting off with the mezzanine Lending piece, you know, is it 7 million kind of a one off transaction or is there something you would look to kind of do more of? And how should we think about kind of the sizing of that if that’s something that you would kind of, know, think about doing more of in the future?

Darrell Crait (President and CEO)

Yeah, I mean, look it’s a terrific way for us to get involved early in a project and I think we could see ourselves allocating about $30 million to this pipeline. The VA pipeline over the next four, five, six years is quite significant. There’s a set of terrific, well respected developers who really have a knack for building these. Well, and as you can see, at $7 million, roughly $30 million allocated to this effort would get us involved …

Full story available on Benzinga.com

This post was originally published here

What the Luddites, the ATM, and the music industry teach long-term investors

The headlines are loud. The record is louder.

The narrative has decided that AI will devastate software companies, their workforces, and by extension, your portfolio. CBS News, CNBC, and Harvard Business Review have all written the obituary.

Nearly 55,000 U.S. layoffs are attributed to AI in 2025 alone, and here’s a twist worth noting: many of those layoffs are being driven not by AI’s actual performance, but by companies anticipating its potential. The tone is equal parts alarm and inevitability, as if the outcome is predestined.

Maybe. But certainty has a habit of making itself look foolish.

The Luddites were right about the pain

In the English textile towns of Nottinghamshire, Yorkshire, and Lancashire, between 1811 and 1816, a group of skilled weavers and textile workers took matters into their own hands. They called themselves Luddites, after Ned Ludd, a young apprentice who was rumored to have wrecked a textile machine in a fit of rage back in 1779. There’s no evidence Ludd actually existed, but just like Robin Hood, he became the mythical leader of the movement.

The protesters claimed to be following orders from “General Ludd,” and they smashed power looms across the countryside to save their wages and their way of life.

They weren’t wrong about the short-term pain. The machines were taking their jobs, their wages, and their dignity. The British government responded by making machine-breaking a capital offense. Seventeen men were executed. The movement was crushed.

And yet. Over the following decades, power looms didn’t shrink the textile workforce. They expanded it. Lower costs drove demand, created factories, and built cities. In the decades that followed, those cities created entirely new categories of work that no one had imagined: railway engineers, telegraph operators, and factory managers running workforces of thousands.

The Luddites lost the argument, but it took a full generation for anyone to notice, and by then, most of the original workers were long gone.

The bank tellers didn’t see it coming

Bank teller employment in the United States once peaked at nearly 600,000 jobs. Today, there are roughly half that number, and the Bureau of Labor Statistics projects a further 13% decline by 2034. When ATMs arrived in the 1970s, conventional wisdom was swift and decisive: bank tellers were finished. Why pay a person to do what a machine could do for less? Insightful and absolutely wrong.

As economist James Bessen of Boston University documented, teller employment actually increased as ATM deployment accelerated. ATMs reduced the cost of operating a branch, and banks responded by opening 43% more branches to compete for greater market share. The machine took the routine cash transactions. …

Full story available on Benzinga.com

This post was originally published here

U.S. stocks traded lower midway through trading, with the Dow Jones index falling around 0.1% on Monday.

The Dow traded down 0.13% to 49,166.76 while the NASDAQ fell 0.16% to 24,796.92. The S&P 500 also fell, dropping, 0.02% to 7,163.54.

Leading and Lagging Sectors

Communication services shares jumped by 1.1% on Monday.

In trading on Monday, consumer discretionary stocks fell by 1%.

Top Headline

Verizon Communications (NYSE:VZ) reported better-than-expected first-quarter earnings and raised its FY26 adjusted EPS guidance above estimates.

Verizon reported quarterly earnings of $1.28 per share which beat the analyst consensus estimate of $1.20 per share. The company reported quarterly sales of $34.400 billion which missed the analyst consensus estimate of $34.836 billion.

Equities Trading UP
           

  • Youxin Technology Ltd (NASDAQ:YAAS) shares shot up 52% to $1.41 after the company agreed to acquire 18% of the equity interests in YATOP in consideration …

Full story available on Benzinga.com

This post was originally published here

FanDuel parent Flutter Entertainment (NYSE:FLUT) has lost more than $30 billion in market value since August as prediction markets pioneered by Kalshi and Polymarket reshape the U.S. wagering landscape.

The drawdown has wiped out more than half of Flutter’s market cap even as the company holds roughly 35% of the $17.5 billion U.S. online sports betting market, per researcher Eilers & Krejcik Gaming.

Investors appear to be pricing in a future where event contracts cannibalize traditional sportsbook volume.

How Kalshi Took 90% Of The Market

Weekly contract volume across U.S. prediction markets has jumped from roughly $100 million a year ago to more than $3 billion currently, per a Bank of America estimate cited by Bloomberg.

Kalshi controls more than 90% of that share.

FanDuel’s response, FanDuel Predicts, launched in all 50 states in January through a joint venture with CME Group (NASDAQ:CME), which holds 51% of …

Full story available on Benzinga.com

This post was originally published here

Norfolk Southern Corporation (NYSE:NSC) reported better-than-expected earnings for the first quarter on Friday.

The company posted quarterly revenue of $3.0 billion, in line with estimates. Diluted EPS declined 27% to $2.43, while adjusted diluted EPS was $2.65, down 1% from the prior year but above the $2.51 estimate.

“In the first quarter, our team stayed focused on what we could control, operating with discipline amid volatile volumes, severe winter weather, and a rapidly shifting macroeconomic environment including the dramatic rise in fuel prices in March,” said Mark George, president and chief executive officer of …

Full story available on Benzinga.com

This post was originally published here

Former White House AI czar David Sacks confirmed the structure of Elon Musk’s Cursor play on the All-In podcast Friday. By the end of 2026, SpaceX will either acquire the AI coding startup for $60 billion or pay it $10 billion to walk away.

Sacks, also a SpaceX investor, framed the $10 billion as the cost of a one-year option on the hottest application in AI.

The Hottest Application In AI

Cursor, built by Anysphere, has become the one of the leading IDE’s for AI-assisted coding. Its run rate hit $2 billion in February and is projected at $6 billion by the end of 2026, which would triple its top line in under a year.

It also defines a category that every foundation model lab now wants to own. Cursor was rumored to be raising at a $50 billion valuation before the SpaceX deal landed at $60 billion.

Cursor Trapped Between Codex And Claude Code

Cursor’s problem was that it ran on top of OpenAI and Anthropic …

Full story available on Benzinga.com

This post was originally published here

Norwood Financial (NASDAQ:NWFL) released first-quarter financial results and hosted an earnings call on Monday. Read the complete transcript below.

This content is powered by Benzinga APIs. For comprehensive financial data and transcripts, visit https://www.benzinga.com/apis/.

View the webcast at https://edge.media-server.com/mmc/p/w8iwwmki/

Summary

Norwood Financial reported a record net interest income of $24.6 million, marking a 38% increase from Q1 2025, with net income and earnings per share both showing significant growth.

The acquisition of Presence Bank was completed, increasing the company’s assets, loan portfolio, and geographic presence; integration activities are on track, with systems and branding efforts underway.

Strategic priorities for 2026 include completing the integration of Presence Bank, boosting operational efficiency using AI, strengthening the talent pool, and enhancing shareholder value.

The company’s margin improved by 8 basis points, and loan and deposit growth was noted, with a solid pipeline of loans expected to contribute positively.

Management is optimistic about 2026, expecting continued accretion to shareholder value faster than initially projected due to favorable interest rate movements and high-quality acquisitions.

Full Transcript

OPERATOR

Good day and thank you for standing by. Welcome to the Norwood Financial Corp. First quarter 2026 earnings call. At this time, all participants are in a listen only mode. After the speaker’s presentation, there will be a question and answer session. To ask a question during the session, you’ll need to press star 11 on your telephone. You will then hear an automated message advising your hand is raised to withdraw your question. Please press star 11 again. Please be advised that today’s conference is being recorded. I’d now like to hand the conference over to Mackenzie Jackson, Corporate Secretary. Please go ahead.

Mackenzie Jackson (Corporate Secretary)

Thank you, Liz. Good morning everyone and welcome to our first quarter 2026 earnings conference call. With me today are Jim Donnelly, our president and CEO, and John McCaffrey, our CFO. The press release we issued earlier this morning, together with the presentation material that accompanies our remarks is available on the Investor Relations section of our webpage. Comments made by by any participant on today’s call may include forward looking statements. These statements are subject to various risks and uncertainties and other factors that are difficult to predict. Actual results may differ materially from those expressed or implied and we assume no obligation to update any forward looking information. Please refer to our Most recent Form 10K and other subsequent reports filed with the SEC for more information about risks related to forward looking statements. During our discussion we may refer to certain non-GAAP financial measures. These measures are useful for analysts, investors and management to evaluate ongoing performance. A reconciliation of these measures to GAAP financial results is provided in our presentation materials. I will now turn the call over to Jim.

Jim Donnelly (President and CEO)

Thank you Mackenzie. Good morning everyone. We began 2026 with strong performance, extending the momentum we began to build last year. This was the first quarter that included results from the Presence bank acquisition, increasing our assets, loan portfolio, geographic presence and earnings power. I am proud of our team’s ability to focus on our mission to make every day better by serving our customers and communities while making significant progress on our integration activities. Net interest income was a record 24,600,000, an increase of 38% compared with the first quarter of 2025. Net interest income margin expanded by 38 basis points to 3.68%. It was a great quarter for the bank as we benefited from our repositioned bond portfolio and favorable interest rate movement. Net income and earnings per share increase improved 35% and 14% respectively on an adjusted basis with higher adjusted returns on average assets and tangible equity. I am pleased with our first quarter performance and remain optimistic that 2026 will be a great year for the Bank. During our fourth quarter earnings call, I introduced our 2026 strategic priorities. I would like to provide you with an update on these. The first priority is to successfully complete the Presence Bank integration. I am pleased to report that we are on plan with these activities. Our plans include driving uniform systems and operating practices across the new combined entity, uniting the acquired businesses and branches under our new brand, and engaging in open conversations across our locations and functions to identify and adopt the best in class policies that will enable us to better serve our communities while improving our results. Among our early accomplishments is the completion of our core integration unifying our IT and HR systems. We have also begun the work of unifying all acquired locations under our brand including signage, logos and other branded materials to drive consistency and unity across our organization. The integration requires a lot of planning, organization and executing across sites and functions to complete. While we have been actively integrating the systems, we have not taken our eye off serving our customers and communities which have resulted in impressive loan and deposit growth during the same period. I am proud of our team for going above and beyond to ensure our integration plans are being accomplished and for taking great care of our customers while doing so. Our second strategic priority is to increase operating efficiency and elevate the customer experience through AI. This is an area where you’re implementing best practices from Presidents bank and deploying their developed systems and processes across the combined organization. One item I am really excited about is the Commercial credit system which we will integrate in July. This uses embedded AI and machine learning to enhance the productivity of our talented credit officers by bringing automation, speed and quality to the process. For example, automatic spreading will allow our credit analysts to save time. Better reporting will provide our credit officers with helpful insights to make informed decisions and the ability to draft credit memos will improve the speed and quality of the documentation process. These benefits will enable our employees to perform higher value functions as well as underwriting deals more quickly to improve deal flow. Our third objective is to strengthen the talent pool and deepen our leadership bench. As I’ve met with our employees across the sites, including the newly added sites in Chester, Lancaster and Dauphin Counties, I am continually reminded of the great team we have and I firmly believe our key to success is our people. They are dedicated to serving the communities and working hard to find the ways to make every day better. The team became bigger and stronger during the quarter as we welcomed the former Presence Bank employees to our organization, including additions to our executive leadership team. I’m confident that together we can continue to deliver financial solutions that improve the lives of our customers and allowing them to achieve their financial goals. Our fourth and final priority is to ensure everything we do increases shareholder value. …

Full story available on Benzinga.com

This post was originally published here

South Korea’s K-Bank signed a strategic partnership with Ripple to test blockchain-based cross-border remittances as XRP (CRYPTO: XRP) fails to break $1.45 for the fourth time in two months.

The K-Bank Partnership

K-Bank CEO Choi Woo-hyung and Ripple Asia Pacific Head Fiona Murray recently signed the deal at K-Bank’s headquarters in Seoul. 

The partnership will test on-chain cross-border remittances to countries including the United Arab Emirates and Thailand using Ripple’s Palisade wallet.

The two companies are now in phase two of testing, which evaluates how blockchain-based transfers can improve speed, cost, and transparency compared to traditional banking rails.

Traditional international bank transfers route through correspondent banking networks like SWIFT, which can take days to settle and charge fees at each intermediary along the way.

By contrast, on-chain remittances move funds directly across a blockchain …

Full story available on Benzinga.com

This post was originally published here