
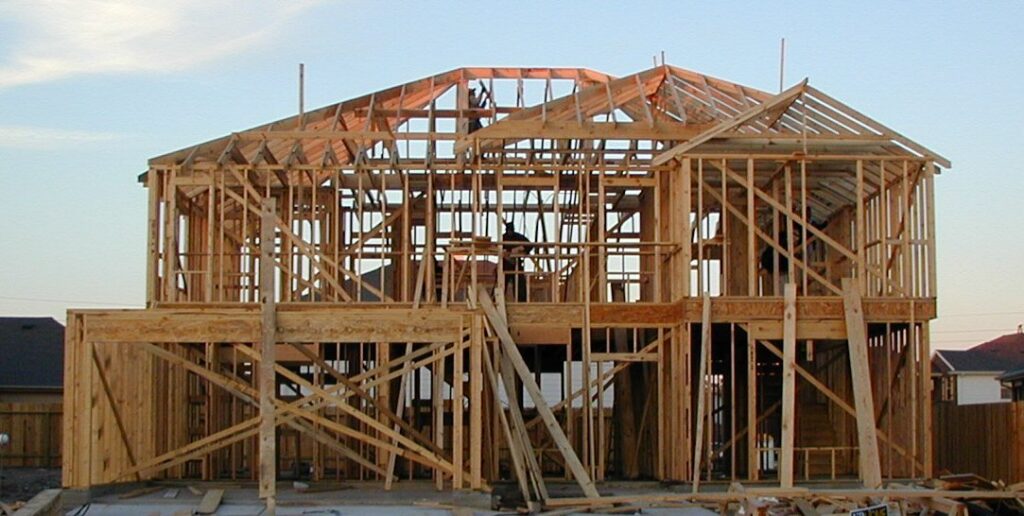
A wood-framed house under construction in Katy, Texas, in an archival photograph. Photo: Jaksmata via Wikimedia Commons, CC BY-SA 3.0. Resized.
Sales of newly built U.S. homes edged lower in September while the number of houses on the market declined, leaving builders with more than eight months of supply, according to federal data released Tuesday.
The Census Bureau and the Department of Housing and Urban Development estimated new single-family home sales at a seasonally adjusted annual rate of 676,000. That was 0.6% below August’s revised rate of 680,000 and 5.3% below the September 2025 rate of 714,000.
Neither decline was statistically significant. The survey’s margins of error were wide enough that sales could have increased rather than fallen, an important limit on reading one month’s estimate as a decisive turn in the housing market.
The official September report revised August’s sales rate down from the previously reported 684,000. These annualized figures describe the pace of sales if a month’s seasonally adjusted rate continued for a year, not the number of homes actually sold during September.
Supply shrinks but remains substantial
An estimated 476,000 new houses were for sale at the end of September, down 1% from a revised 481,000 in August. That monthly inventory decline was statistically significant, unlike the slight decline in sales.
At September’s sales pace, the inventory represented 8.4 months of supply, compared with 8.5 months in August and 8.2 months a year earlier. The reported changes in months’ supply were not statistically significant.
For builders, the report shows a market in which the stock of homes for sale is coming down without a clear pickup in buyers. For people shopping for a new house, the national supply figure gives context, but it does not establish that a particular builder will cut a price or offer a financing incentive.
The median price is not a same-home price index
The median price of a newly sold home was $400,400 in September. That was 3.9% above August’s revised $385,400 and 3.9% below the $416,800 recorded a year earlier. Both median-price comparisons fell within the survey’s margins of error.
The average sales price was $472,800, up 0.4% from August’s revised $470,800 and down 6.7% from $506,800 a year earlier. The monthly change was not statistically significant; the annual decline was, according to the report’s confidence intervals.
These figures measure the homes that sold, so a change in the mix of regions, house sizes or other features can move the national median and average. They do not show that the same house became 3.9% more expensive in a month or that every homeowner’s property lost value over the year.
Contracts, revisions and the next report
The new-home series counts a sale when a deposit is taken or a sales agreement is signed. It therefore measures a different stage of the transaction from a closing and can include a sale made before a building permit is issued.
Census cautions that it takes four months to establish a trend in new-home sales. Preliminary estimates are subject to revision, with the initial seasonally adjusted total revised by about 6.7% on average.
That makes September’s small estimated sales decline less informative on its own than the headline number might suggest. The next report, covering October, is scheduled for November 25.
JBizNews Desk | Washington
© JBizNews.com. All rights reserved. Unauthorized reproduction or redistribution is strictly prohibited.