
Elon Musk borrowed $500 million from SpaceX at interest rates as low as 1%, used the rocket company to bail out a struggling solar venture, and most recently had SpaceX swallow his cash-burning AI lab, according to a New York Times investigation published Friday.

The report lands six weeks before SpaceX is expected to hit the road with the largest IPO in history.

What The NYT Documented

Musk pulled three loans totaling $500 million from SpaceX between 2018 and 2020, at rates that ranged from under 1% to nearly 3%, according to the Times.

The prime rate sat closer to 5% for most of that period. Under the 2002 Sarbanes-Oxley Act, public companies cannot lend to senior executives. SpaceX could because it is private.

SpaceX also lent Tesla Inc. (NASDAQ:TSLA) $20 million during the 2008 crisis, per Musk’s own earlier comments. It injected $255 million …

Full story available on Benzinga.com

This post was originally published here
Keurig Dr Pepper Inc. (NASDAQ:KDP) on Thursday posted better-than-expected earnings for the first quarter.

The company, which owns brands such as Dr Pepper, 7Up, Snapple and Green Mountain Coffee, reported first-quarter adjusted earnings per share of 39 cents, beating the analyst consensus estimate of 37 cents. Quarterly sales of $3.976 billion (+9.4% year over year) outpaced the Street view of $3.838 billion.

The firm affirmed the 2026 sales outlook of $25.900 billion-$26.400 billion, compared with the $26.081 billion estimate.

“With well-constructed plans in place, high-quality execution, and improving cost visibility as the year unfolds, we remain confident in our ability to deliver …

Full story available on Benzinga.com

This post was originally published here
Gentex Corporation (NASDAQ:GNTX) shares moved higher Friday after the company reported first-quarter results that exceeded Wall Street expectations, supported by strong demand for advanced features.

The firm also raised its sales outlook, signaling confidence in its growth trajectory despite ongoing headwinds in global vehicle production.

Quarterly Details

The company reported first-quarter adjusted earnings of 48 cents per share, topping the analyst consensus estimate of 45 cents. Quarterly revenue rose 17% year over year to $675.44 million, beating the Street view of $648.71 million.

VOXX contributed $88.6 million in revenue during the first quarter of 2026. Core Gentex revenue reached $586.8 million, increasing 2% sequentially despite a decline in global light vehicle production.

“Core Gentex revenue growth in …

Full story available on Benzinga.com

This post was originally published here

VeriSign, Inc (NASDAQ:VRSN) reported upbeat earnings for the first quarter on Thursday.

The company posted quarterly earnings of $2.34 per share which beat the analyst consensus estimate of $2.25 per share. The company reported quarterly sales of $428.900 million which beat the analyst consensus estimate of $425.912 million.

VeriSign raised its FY2026 sales guidance from $1.715 billion-$1.735 billion to $1.730 billion-$1.745 billion.

“Through the first quarter of 2026 we continued to execute on our primary mission, extending into its 29th year our unparalleled record of providing 100% availability of our resolution service for the .com/.net domains. For the quarter, we …

Full story available on Benzinga.com

This post was originally published here

Erie Indemnity (NASDAQ:ERIE) reported first-quarter financial results on Friday. The transcript from the company’s first-quarter earnings call has been provided below.

This transcript is brought to you by Benzinga APIs. For real-time access to our entire catalog, please visit https://www.benzinga.com/apis/ for a consultation.

Access the full call at https://edge.media-server.com/mmc/p/e7v7bdm8/

Summary

Tom Hagan stepped down as Chairman of the Board and was succeeded by Jonathan Herd Hagen, maintaining leadership continuity at Erie Indemnity.

The first quarter of 2026 saw a 3.6% growth in direct written premium, a slowdown compared to 13.9% in 2025, influenced by competitive pricing and market conditions.

The combined ratio improved to 99.4% from 108.1% in the previous year, driven by reduced catastrophe losses and improved non-catastrophe underwriting performance.

Net income for Erie Indemnity increased to $151 million, or $2.88 per diluted share, up from $138 million or $2.65 per diluted share in the first quarter of 2025.

Strategic initiatives include the rollout of Erie Secure Auto and Business Auto 2.0, with expansions planned across multiple states, aiming to enhance agent and customer experience.

The company is investing in technology modernization and AI, enhancing operational efficiency and supporting growth, while maintaining a focus on the human element of service.

Future outlook includes continued disciplined growth, profitability restoration, and expansion of new products, with a focus on leveraging AI to improve operational workflows.

Full Transcript

OPERATOR

Good morning and welcome to the Erie Indemnity Company first quarter 2026 earnings conference call. This call was pre recorded and there will be no question and answer session following the recording. Now I’d like to introduce our host for the call, Vice President of Investor Relations Scott Valhartz. Please proceed.

Scott Valhartz (Vice President of Investor Relations)

Thank you and welcome everyone. We appreciate you joining us for this recorded discussion about our first quarter results. This recording will include remarks from Tim Nicastro, President and Chief Executive Officer and Julie Pockowski, Executive Vice President and Chief Financial Officer. Our earning release and financial supplement were issued yesterday afternoon after the market closed and are available within the Investor Relations section of our website erieinsurance.com before we begin, I would like to remind everyone that today’s discussion may contain forward looking remarks that reflect the company’s current views about future events. These remarks are based on assumptions subject to known and unexpected risks and uncertainties. These risks and uncertainties may cause results to differ materially from those described in these remarks. For information on important factors that may cause such differences, please see the Safe harbor statements in our Form 10Q filing with the SEC filed yesterday and in the related press release. This prerecorded call is the property of Erie Indemnity Company. It may not be reproduced or rebroadcast by any other party without the prior written consent of Erie Indemnity Company. With that, we move on to Tim’s remarks. Tim thanks Scott and good morning everyone. Before we get into our first quarter results, I’d like to share some recent changes to the Erie Indemnity Company Board of Directors. First, Tom Hagan recently informed the Board of his decision to step down as Chairman after serving in the role for more than 20 years. Following a special meeting of the Board of directors on April 19, Jonathan Herd Hagen was unanimously elected as Chairman of the Board. Jonathan is the son of Tom Hagan and the late Susan Hert Hagen and the grandson of our co founder Ho Hurd. He has served on our board since 2005 and as vice chairman since 2013. Jonathan brings a thoughtful, steady approach to leadership along with a strong understanding of our business and of our culture. It also carries forward the legacy of those who helped build this company. Grounded in service, integrity and a long term perspective, Tom will continue to serve as a member of the Board as Chairman Emeritus and Chair of the Executive Committee. His …

Full story available on Benzinga.com

This post was originally published here

U.S. stocks were mixed, with the Dow Jones falling over 150 points on Friday.

Shares of Sensient Technologies Corp (NYSE:SXT) rose sharply during Friday’s session following upbeat quarterly earnings.

Sensient Technologies reported quarterly earnings of $1.04 per share which beat the analyst consensus estimate of 84 cents per share. The company reported quarterly sales of $435.834 million which beat the analyst consensus estimate of $411.283 million.

Sensient Technologies shares jumped 15.8% to $114.92 on Friday.

Here are some other big stocks recording gains in today’s session.

  • Maxlinear Inc (NASDAQ:MXL) shares jumped 69.2% to $57.95 after the company reported better-than-expected first-quarter financial results and issued second-quarter sales guidance above estimates.
  • Intel Corp (NASDAQ:INTC) gained 22.7% to $81.95 after the company reported better-than-expected first-quarter financial results and issued second-quarter guidance above estimates.
  • Organon & Co (NYSE:OGN) surged …

Full story available on Benzinga.com

This post was originally published here

Elon Musk is telling investors the Cybercab is finally rolling off the line. Prediction market traders are pricing in a much slower story than the one Tesla is selling.

Tesla Inc. (NASDAQ:TSLA) has started manufacturing the two-seat driverless sedan, Musk said Friday on X, fulfilling a long-promised production timeline as the company’s global sales slump and the stock sits down 17% year-to-date.

The Cybercab was unveiled two years ago without a steering wheel or pedals, a design that will need exemptions from US regulators before it can scale. Musk has said it will be cheaper than anything else in the Tesla lineup.

What Polymarket Is Pricing

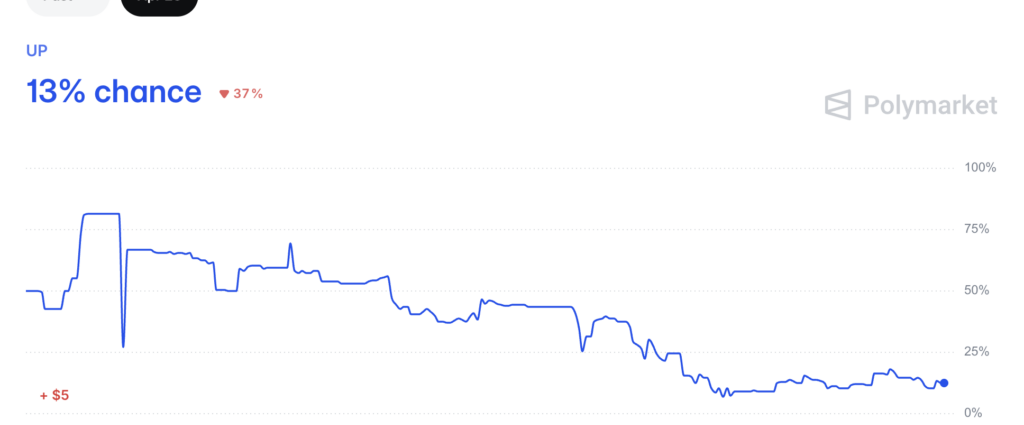
Polymarket traders give Tesla a 9% chance of launching a driverless robotaxi service in California by June 30.

Tesla has not filed for the permit required to run …

Full story available on Benzinga.com

This post was originally published here

On Friday, Primis Finl (NASDAQ:FRST) discussed first-quarter financial results during its earnings call. The full transcript is provided below.

This transcript is brought to you by Benzinga APIs. For real-time access to our entire catalog, please visit https://www.benzinga.com/apis/ for a consultation.

View the webcast at https://events.q4inc.com/attendee/286254303

Summary

Primis Finl reported first-quarter earnings of $7.3 million or $0.30 per share, down from $22.6 million or $0.92 per share in the same quarter last year; however, operating earnings increased to $0.33 per share, up 126% from the previous year.

The company’s net interest margin improved to 3.43% due to securities restructuring and a favorable mix of earning assets. Loan growth was robust, ending at $3.4 billion, reflecting an 11.7% increase, while deposit growth was strong at over 8%.

Primis Finl is focusing on technology and service to drive deposit growth and plans to leverage AI for operational efficiency. The mortgage division had a strong quarter with pre-tax income rising to $2.1 million, and the company expects to be a top 50 mortgage firm by 2026.

Management highlighted their aim to achieve a 1% ROA by the end of the year, with aspirations for 1.25% or higher in the future, driven by growth in mortgage, warehouse, and core banking operations.

The company is keen on using AI to enhance operational leverage, reduce costs, and improve customer satisfaction, positioning itself as a leader among banks under $10 billion.

Full Transcript

OPERATOR

Ladies and gentlemen, thank you for standing by. My name is Colby and I’ll be your conference operator today. At this time I would like to welcome you to the Primis Finl Primis Finl First quarter earnings call. All lines have been placed on mute to prevent any background noise and after the speaker’s remarks we will conduct a question and answer session. If you’d like to ask a question at that time, please press Star then the number one on your telephone keypad to raise your hand and enter the queue. If you’d like to withdraw your question at any time, you can press Star one again. I will now turn the call over to Matthew Switzer. You may begin.

Matthew Switzer

Good morning and thank you for joining us for this financial conference call. Before we begin, please note that many of our comments during this call will be forward looking statements which involve risk and uncertainty. There are many factors that can cause actual results to differ materially from the anticipated results or other expectations expressed in the forward looking statements. Further discussion of the Company’s risk factors and other important information regarding our forward looking statements are part of our recent filings with the Securities and Exchange Commission, including our recently filed earnings release which has also been posted to the Investor Relations section of our corporate site, firm’s bank website. We undertake no obligation to update or revise forward looking statements to reflect changes, assumptions, the occurrence of unanticipated events or changes to future operating results over time. In addition, some of the financial measures that we may discuss this morning are non GAAP financial measures. Our non GAAP measure relates to the most comparable GAAP measure will be discussed when the non GAAP measure is used, if not readily apparently. I will now turn the call over to our President and Chief Executive Officer, Dennis Seppert.

Dennis Seppert (President and Chief Executive Officer)

Dennis thank you Matt. Thank you. For all of you that have joined our first quarter conference call, we’re excited to report that in the first quarter we earned $7.3 million or $0.30 per share which compares to $22.6 million $0.92 per share in the same quarter of 25. I guess I’m reading that excited to report earnings shrinking that much. The fact of the matter is on an operating basis we earned $0.33 per share in the first quarter, which excluded a small tax adjustment related to 2025 results. And when you compare that to second quarter a year ago, it’s up 126% operating earnings where we reported $0.14 in the same quarter of 25. And Matt may mention this but the first quarter 25 included a substantial gain on the deconsolidation of Panacea, which is the. Which is what I’m excluding. Our key operating ratios obviously improved alongside that earnings number I just gave you. On an operating basis, our ROA improved to 84 basis points compared to 40 basis points in same quarter of 25. Driving that were a couple items margin mostly and as well as operating expense control on net interest margin. Our net interest margin, excuse me, benefited from the securities restructure as well as the mix of earning assets and climbed to 3.43% in the first quarter compared to 315 in the same quarter of 25. We continue to put up nice growth numbers that are manageable but really distinguish us amongst our peer group. Loans ended at $3.4 billion 11.7% compared to the same quarter in 26. That excludes about $40 million or so that Matt that we moved into loans held for sale related to a flow agreement with Panacea. So really our growth was probably stronger than this. Deposit growth over the same period is really what you should look at. That came in at just better than 8% with very little of that from the digital platform which is pretty steady state at about a billion dollars. The growth in checking accounts in our company was even more notable with non interest bearing checking accounts growing to 541 million which is almost 19% higher than where we were in 25. Checking accounts continue to be a more meaningful element of our deposit mix and we’re 15.9% of total deposits compared to just 14.2% in 1Q25. And lastly, it’s very important to note that we grew deposits in this strong fashion and never once felt pressured in our core bank or on our digital platform to be more aggressive on rate. We’re doing it with technology, with service, with people getting in front of folks, focusing on commercial deposits and having real success. All of the energy and momentum on our balance sheet really starts at our core bank. There’s never been a time since I came to premise that our core bank has had this opportunity on both sides of the balance sheet. Honestly, we’re winning business that several years ago we just wouldn’t have been in the running for or maybe even had a conversation about. Virtually nothing that we’re doing to win this business has to do with rates or fees. Is we’re leaning hard into our technology, our service, our people, our existing customers who are turning out to be amazing centers of influence for us. For so long it felt like we were that all we were doing here is working on our factory and stuff in the factory. But today stuff is rolling off that assembly line faster and faster and I’m very encouraged by what our people are accomplishing. Mortgage Warehouse is full, fully replaced. Life Premium finance at this point has been so well received in the marketplace. We finished the quarter with about 460 million outstanding for a few days in the quarter. At the end, near the end of March we crested half a billion dollars outstanding. This is before any refi boom. It’s before the busy spring and summer seasons for retail mortgage. Importantly, Warehouse is still producing impressive yields and margins efficiency ratios in the 20s. The amount of scale and impact on our overall operating ratios from this business is not really something that’s been fully baked or recognized in our current numbers as really they’ve been just scaling the business so quickly over the past year. But as we I believe we could probably double this business in the next 12 to 18 months and I believe the incremental impact from that second double is going to be very meaningful. Retail mortgage had an absolute blowout quarter. They’ll tell you that it was impacted by some Middle east activities and an impact on rates and fair value adjustments. And that’s true. We might have reported half a billion dollars looking at map half a billion dollars more had that. But regardless pre tax income in the mortgage group grew to $2.1 million in the first quarter compared to 766,000 same quarter a year ago. In the quarter our earnings crept up to 57 basis points on close volume compared to 46 in the same period a year ago. So on a profitability basis we’re up maybe 20 little better than 20% on closed volume. Our recruiting pipeline has never been this strong and consistently we double each month on apps, close volume, new files, so we have real so we’re very positive about what the second half of the year would look like right now we believe Primis Mortgage is on track to be a top 50 mortgage company nationwide in 2026. And lastly before I turn it over to Matt, I want to emphasize what’s really present mind for us in our desire to build this into a top performing bank in our day to day here we are laser focused on growing checking accounts like I mentioned earlier to about 20% of total deposits. Secondly, we’re determined to drive massive amounts of operating leverage from our consistent reliable balance sheet growth using steady to decreasing opex. And I know I’ve been saying this for several quarters and so as the quarter ended I was pretty delighted to start playing with the numbers and see what I’m about to tell you here. If you look at the last year first quarter 25 to from first quarter of 25 all the way back to 1Q24, we’re reporting growth in core revenue of about 45. Excuse me, we’re reporting core revenue of about $45.6 million, which is higher about 33.7%. Call it 34% over a year ago, reported operating expenses straight off of map income statement, no adjustment came in at 33.8 million which is only 4% higher than the same time a year ago. That’s 34% growth in revenue, only a 4% growth in opex. I had in my comments that I’d like to promise that we could do that for a couple more years, but I was afraid Matt would grimace so I took that out. But this is an extraordinary level of operating leverage and really the driver of our results. Nobody at Primis thinks we’re done in this area and that revenue may not be outpacing OPEX going forward. We have …

Full story available on Benzinga.com

This post was originally published here

Byline Bancorp (NYSE:BY) held its first-quarter earnings conference call on Friday. Below is the complete transcript from the call.

Benzinga APIs provide real-time access to earnings call transcripts and financial data. Visit https://www.benzinga.com/apis/ to learn more.

View the webcast at https://events.q4inc.com/attendee/539835327

Summary

Byline Bancorp reported strong financial performance with a net income of $37.6 million and EPS of $0.83 per share, reflecting growth of 8.9% and 9.2%, respectively.

The company maintained a solid balance sheet with total deposits increasing by 8.2% annualized to $7.8 billion, while loan balances were slightly lower due to planned runoff of acquired loan portfolios.

Operational highlights included being named a U.S. Best in Class Employer and the top SBA 7A lender in Illinois for the 16th consecutive year.

Capital levels remain robust with a CET1 ratio over 12.5% and a share repurchase program in place, returning 40% of net income to shareholders through stock buybacks and dividends.

Management remains optimistic about future prospects, citing stable credit quality, disciplined expense management, and ongoing strategic initiatives to drive growth.

Full Transcript

OPERATOR

Good morning and welcome to Byline Bancorp first quarter 2026 earnings call. My name is Tiffany and I will be your conference operator today. All lines have been placed on mute to prevent any background noise. After the speaker’s remarks, there will be a question and answer period. If you would like to ask a question, simply press the star followed by the number one on your telephone. If you would like to withdraw your question, simply press star one again. If you are listening via speakerphone, please lift your handset prior to asking your question. If you require operator assistance, please press star then zero. Please note the conference call is being recorded at this time. I would like to introduce Brooks Reaney, Head of Investor Relations for Byline Bancorp, to begin the conference call.

Brooks Reaney (Head of Investor Relations)

Thank you, Tiffany. Good morning everyone and thank you for joining us today for the Byline Bancorp First Quarter 2026 Earnings Call. In accordance with Regulation FD, this call is being recorded and is available via webcast on our investor relations website along with our earnings release and the corresponding presentation slides. As part of today’s call, management may make certain statements that constitute projections, beliefs or other forward looking statements regarding future events, the future financial performance of the company. We caution that such statements are subject to certain risks, uncertainties and other factors that could cause actual results to differ materially from those discussed. The Company’s risk factors are disclosed and discussed in its SEC filings. In addition, our remarks and slides may reference and contain certain non GAAP financial measures which are intended to supplement but not substitute for the most directly comparable GAAP measures. Reconciliation of each non GAAP financial measure to the comparable GAAP financial measure can be found within the appendix of the earnings release. For additional information about risks and uncertainties, please see the forward looking statement and non GAAP financial measure disclosures in the earnings release. As a reminder for investors during the quarter, we plan to participate in two upcoming conferences here in Chicago. The Stevens Chicago bank tour on May 14 and the Raymond James Chicago Bank Symposium on May 28. With that, I’ll now turn the call over to Alberto Farcini, President of of Byline Bancorp.

Alberto Farcini (President)

Great. Thank you. Brooks. Good morning and welcome to Byline’s first quarter earnings call. We appreciate all of you taking the time to join the call this morning. With me today are Chairman and CEO Roberto Horencia, our CFO Tom Bell and our Chief Credit Officer Mark Fusinato. Before we get started, I’d like to pass the call over to Roberto for his comments. Roberto.

Roberto Herencia

Thank you, Alberto and good morning to all. As Alberto said. We do appreciate you joining us today and taking the time to engage with Byline. Markets in general continue to offer plenty of distractions and at times entertainment. Shifting interest rate expectations, inconsistent economic signals, policy uncertainty and heightened geopolitical tensions. With the Iran tensions at the center of it and its broader implications, these add another layer of complexity for businesses and investors alike. We have learned over time that durable results do not come from reacting to every headline. They come from being anchored to purpose, discipline, execution and long term thinking. So we remain focused on driving value for our stockholders as we work and make progress, I may add, toward becoming the preeminent commercial bank in Chicago. We started the year with another strong quarter. Roa, ptpp, NIM and Efficiency remain among the best in class. Tangible book value growth of 14% year over year are also knocking on the door of best in class. Our balance sheet remains strong and positioned to support customers through the cycle. I want to recognize what matters deeply to us. Our people by land bank was recently honored as a U.S. best in Class Employer in Gallagher’s 2025 U.S. benefits Strategy and Benchmarking Survey. We were also named to Newsweek’s America’s Greatest Mid Sized Workplaces for Women, highlighting our dedication to practices grounded in transparency, professional development and flexibility, empowering women to build careers that grow with their lives. These awards reflect effective people strategies with measurable outcomes including employee well being and engagement. They reinforce our people first approach and strengthens our ability to attract, retain and develop top talent in a very competitive environment. I would like to point out that our SBA platform continues to perform well. For the 16th consecutive year, our team ranked as the number one SBA 7A lender in Illinois according to the most recently published fiscal year rankings. This kind of consistency does not happen by accident. It reflects decades of experience, disciplined execution and the dedication of an outstanding team. I would also like to recognize two individuals who have been familiar voices to many of us for a long time. This marks the end of an era as Terry McAvoy of Stevens and David Long of Raymond James step into new chapters in their careers. Collectively as sell side analysts, they’ve covered more than 200 earning seasons and more importantly, they brought professionalism, consistency and thoughtful engagement to their work. We are grateful for the time they spent covering Bylane and for the relationships built over many years. On behalf of the Board and the entire management team. We wish both Terry and David continued success in their new roles. To close I remain very optimistic about byline. We are operating with clarity of purpose supported by strong fundamentals an engaged workforce and a resilient business model. We are very focused on compounding returns the right way through prudent growth, disciplined risk management and an unwavering commitment to our people and customers. With that, Alberto, back to you. Great.

Alberto Farcini (President)

Thank you Roberto. As is our normal practice, I’ll start with the highlights for the quarter, followed by Tom who’ll take you through the financials and then I’ll come back to wrap up before we open the call up for questions. As always, you can find the deck we’re using this morning on the IR section of our website and please refer to the disclaimer at the front. Turning to slide four on the deck Overall, I’m pleased to report that we had a solid start to the year and delivered another excellent quarter. Earnings momentum continued along with strong profitability, disciplined expense management and stable credit quality despite an evolving macro and geopolitical backdrop. For the quarter, we reported net income of 37.6 million and EPS of $0.83 per diluted share, representing growth of 8.9% and 9.2% respectively. Profitability was strong with ROA of 156 basis points and ROTCE of 13.77%. Pre tax preparation income totaled 55.2 million, resulting in a pre tax preparation margin of 229 basis points points, which marks the 14th consecutive quarter in which this metric exceeded 2%, reflecting the durability and consistency of our operating results. Total revenues were 1:12.4 million for the quarter. Net interest income remained solid at just under 100 million, while non interest income was lower at 12.5 million, largely due to lower fair value marks. For the quarter, the margin remains stable at 4.33% notwithstanding a lower day count and lower yields. This was offset by a drop in deposit costs driven by a better mix coupled with pricing discipline, which Tom will cover in more detail shortly. From a balance sheet standpoint, total deposits increased 8.2% annualized to 7.8 billion, reflecting growth across both quarters. Core as well as time deposits. Loan balances were modestly lower linked quarter as payoffs more than offset solid origination activity of $241 million. Expenses remain well managed at 57 million, down 5.3% from the prior quarter, with our efficiency ratio improving to 49.8% for the first quarter, one of the lowest levels we’ve reported since becoming a public company. Asset quality remained stable. Credit costs were 5.5 million for the quarter and consisted of 6 million in net charges and a small reserve release of half a million dollars. Both NPLs and criticized loans showed declines and the ACL increased 1 basis point to 1.46% of total loans. Moving on to capital Our capital levels continue to grow and balance sheet strength is excellent evident with a TCE at 11.1% and CET1 over 12.5%. We exercised some of that capital flexibility this quarter and returned 40% of net income back to shareholders by repurchasing approximately 318,000 shares of stock at an average price of $30.84, in addition to our quarterly dividend …

Full story available on Benzinga.com

This post was originally published here

Amkor Technology, Inc. (NASDAQ:AMKR) has what I would consider a very fascinating long-term story, but in the near-term, it’s a bit uncomfortable. That is primarily because of its current share price, not the business itself. The business has a lot going for it, and I’ll drill down into those later. The price, though, is not as cheap as it looks, in my opinion, and that is because the market is already valuing the upside from the company’s Arizona campus. That facility is not going to reach meaningful production levels until 2028, according to what Amkor tells us.

I believe that paying 14x EV/EBITDA for a business that is going to have sharply negative free cash flow, smaller gross margins, and very high capex figures over the next two fiscal years doesn’t sound like the best possible deal. To be clear, I’m confident in Amkor’s growth and expansion over a longer period of 5-10 years, but the next two years are also important when deciding what the stock is worth now.

Amkor’s Business

I think it’s fair to say that most people who own a smartphone, a laptop, or a car have interacted with Amkor’s work on some level, even if they don’t know it. The company runs one of the biggest outsourced semiconductor assembly and test provider (OSAT) businesses in the world, along with ASE Technology Holding Co Ltd (NYSE:ASX). OSAT companies are a critical part of the semiconductor supply chain, and they handle the packaging, testing, and prep work for semiconductor chips before they go into the devices I mentioned above.

There are a fair few tailwinds for the company’s business today because of how complex chip design and packaging have now become. For example, Nvidia Corp (NASDAQ:NVDA)’s AI accelerators depend on high-bandwidth memory connected through exactly this kind of advanced packaging architecture. We can also say the same for Apple Inc. (NASDAQ:AAPL)‘s entire lineup of custom silicon.

Also, Amkor’s product mix is interesting to me because of how much of its revenue comes from just one segment, and that segment has what I’d consider to be some of the strongest possible industrial support in the company’s sector. Advanced Products (the segment that contains its flip-chip chip-scale packages, flip chip ball grid array, and memory and wafer-level packages) brought in around 83% of its revenue in FY25, and it only has a few big customers that are driving sales here. According to the same FY25 annual report, Apple is Amkor’s biggest customer (~30% of total revenue), and it’s not even close. Then there’s Qualcomm Inc (NASDAQ:QCOM), which made up another 11% of the total for the year. Together, those two companies are supporting 40% of Amkor’s sales, and they are two of the biggest chip designers and producers globally. Besides them, there are some other AI-adjacent hyperscalers, so that’s an incredibly solid customer base that’s not going anywhere anytime soon.

I also believe that Amkor’s geographical location is another strategic advantage, especially when you look at the current geopolitical landscape. Generally speaking, most of the advanced packaging industry is in Asia, especially in Taiwan and China. ASE Technology, which is arguably the biggest of them, is in Taiwan, and JCET Group is a Chinese company. Amkor is the only one of them that has its headquarters in the US, and that’s partly why it is able to take advantage of CHIPS Act funding support for its $7 billion Arizona facility and have Apple and Nvidia as anchor customers there.

The Bull Case: Arizona And The AI Packaging Cycle

In my intro, I mentioned that I can see the long-term appeal to owning Amkor stock, and the Arizona campus is the main reason why. The company is spending $7 billion to build what will be the most advanced semiconductor packaging facility in the US, and it is supposed to start production there in early 2028. Roughly 5-8% of that amount could come from the US government’s CHIPS Act purse if Amkor takes the initial $400 million in direct funding and another $200 million in loans from the program, so it will fund the rest of the build by other means. 

All of that is normal, but the main reason why I’m ascribing so much value to the campus is how important it is in terms of a geopolitical advantage. The US has made the semiconductor industry and its domestic advanced packaging capacity a national priority, and that’s not going to change anytime soon, regardless of which administration is in power. Amkor is the only company that can benefit from the policy change on such a huge scale, and that just gives it another moat.

Now, the demand backdrop for what Arizona will produce is as strong as anything I can point …

Full story available on Benzinga.com

This post was originally published here

Westport Fuel Systems (NASDAQ:WPRT) reported fourth-quarter financial results on Friday. The transcript from the company’s fourth-quarter earnings call has been provided below.

This content is powered by Benzinga APIs. For comprehensive financial data and transcripts, visit https://www.benzinga.com/apis/.

Access the full call at https://edge.media-server.com/mmc/p/uxhk9mgz/

Summary

Westport Fuel Systems successfully completed a review following a cybersecurity incident, ensuring IT system integrity and business continuity.

The company divested its light-duty business, receiving a $6.5 million payment, and ended the year with over $27 million in cash and low debt.

Total revenue for Q4 2025 was $29.3 million, a 28% increase from the previous year, driven by strong market adoption of HPDI fuel systems.

Westport Fuel Systems is focusing on expanding its market reach with its proprietary CNG fuel storage and delivery system, particularly in North America.

The company reported a net loss from continuing operations of $29.6 million for 2025, a slight improvement over the previous year’s $31.3 million loss.

Strategic initiatives include relocating manufacturing capacity to Canada and China, aiming for cost reductions and improved competitiveness.

Future outlook emphasizes the growing role of natural gas in transportation, with plans for demonstrations and fleet trials of new technology in 2026.

Full Transcript

OPERATOR

Good day ladies and gentlemen and thank you for standing by. Welcome to the Westport Fuel Systems’ fourth quarter 2025 conference call. At this time, all participants are in a listen only mode. After the speaker’s presentation, there will be a question and answer session. To ask a question during the session, you will need to press Star 11 on your telephone keypad. As a reminder, this conference call is being recorded. At At this time, I would like to turn the conference over to Ms. Ashley Newell. Ma’am, Please begin.

Ashley Newell (Moderator)

Thank you. Good morning everyone. Welcome to Westport Fuel Systems’ conference call regarding its fourth quarter and full year 2025 financial and operating results. This call is being held to coincide with the press release containing Westport’s financial results that were issued yesterday after market close. On today’s call, speaking on behalf of Westport will be Chief Executive Officer and Director Dan Selai and Chief Financial Officer Elizabeth Owen. You are reminded that certain statements made on this conference call and our responses to certain questions may constitute forward looking statements within the meaning of the U.S. and applicable Canadian securities laws. And as such, forward looking statements are made based on our current expectations and involve certain risks and uncertainties. With that, I’ll turn the call over to you, Dan.

Dan Selai (Chief Executive Officer and Director)

Thank you, Ashley. And good morning everyone. I want to begin by addressing recent events. We appreciate the patience and support of our shareholders as we work through our recent cybersecurity incident. Our priority was to ensure the integrity of our IT systems, business continuity and financial reporting and we are pleased to confirm that this review has been successfully completed. With this behind us, we’re looking forward to executing on our strategy and delivering on the next phase of our business objectives. Turning to our financial results, the past year has been a defining one for Westport, marked by the successful divestiture of our light duty business, the recent receipt of a 6.5 million payment and further strengthened by Suspira’s agreement with a leading OEM to manufacture and deliver HPDI components for a truck trial assessing the future commercialization. These accomplishments, combined with ending the year with over $27 million in cash and very low debt, reflect the meaningful progress we have made in sharpening our strategic focus and building a stronger company. The global heavy duty transportation market is increasingly recognizing natural gas as a practical lower emissions solution available today. This is evidenced by Volvo’s recent milestone of delivering more than 10,000 natural gas trucks on the road, underscoring the accelerating adoption of Suspira’s HPDI fuel system technology and validates the strategic direction we have taken from a market perspective. The UK leads the adoption of HPDI powered LNG trucks, followed by Germany, Sweden, the Netherlands, Norway and France. Emerging gas markets such as India and Latin America are also gaining momentum with volume seeing steady growth. When we introduced our proprietary CNG fuel storage and delivery system several months ago, we emphasized its potential to significantly expand our addressable market, particularly in North America. Development has progressed well and our confidence in the commercial opportunity continues to build. We look forward to showcasing this solution at the upcoming Advanced Clean Transportation Expo act where we will have the opportunity to show off our technology to industry partners and customers. By integrating advanced high pressure CNG storage with Suspira’s field proven HPDI fuel system, we match or exceed the performance and efficiency expected from diesel engines with compelling economics. In markets where CNG is the natural choice like North America, we believe this innovation meaningfully enables Westport and Suspira to capture new opportunities as we move into field testing our GFI brand through our high pressure controls, business has also delivered important operational milestones. The opening of one of the world’s fastest growing hydrogen markets and in Canada represents a step in localizing manufacturing, reducing costs and improving competitiveness. As the transportation industry continues to balance economic realities with sustainability objectives, we are confident that alternative fuel systems, including Suspira’s HPDI technology and our high pressure components provide real world solutions that deliver both performance and affordability. With the completion of our strategic transition and only a few milestones remaining, a growing market, validation of Suspira’s expansion, a path to address the North American market and a clear strategic focus Westport is excited to drive into this next phase. Now I’ll have Elizabeth run through some financial details and then come back afterwards. Over to you Elizabeth.

Elizabeth Owen (Chief Financial Officer)

Thank you Dan. Before I dive into the details, I’ll just touch on a few key milestones that we achieved, the first of which is our strong cash position reflective of a successful divestiture of the light duty segment. As of December 31, 2025, our cash and cash equivalents position increased by 12.4 million to 27.2 million compared to 14.8 million at December 31, 2024. The increase in cash was primarily driven by the sale of our light duty segment, as I mentioned, partially offset by cash used in our operating activities and debt repayments exiting 2025 with the proceeds from the disposition of Westport’s light duty segment debt, including the current portion reflected a 57% reduction to 2.9 million as at December 31, 2025. This was compared to 6.8 million in the prior year period, including the long term debt from discontinued operations. The reduction was more than 90%. This improved financial position provides Westport with greater flexibility to concentrate on markets that are best suited to our current strategy. Suspira continues to drive meaningful improvement in our Results. In the fourth quarter of 2025, total revenue was $29.3 million compared to 22.9 million in the same period last year, representing an increase of 28%. This progress is supported by strong market adoption, including Volvo reaching the milestone of more than 10,000 natural gas trucks on the road equipped with Saspira’s HPDI fuel systems. We are also encouraged by the continued progress of a second OEM that is …

Full story available on Benzinga.com

This post was originally published here

On Friday, Westport Fuel Systems (TSX:WPRT) discussed fourth-quarter financial results during its earnings call. The full transcript is provided below.

This content is powered by Benzinga APIs. For comprehensive financial data and transcripts, visit https://www.benzinga.com/apis/.

The full earnings call is available at https://edge.media-server.com/mmc/p/uxhk9mgz/

Summary

Westport Fuel Systems successfully completed a cybersecurity review, ensuring business continuity and financial reporting integrity.

The company divested its light-duty business, received a $6.5 million payment, and ended the year with $27 million in cash, reflecting improved financial health with low debt.

Total revenue in Q4 2025 was $29.3 million, a 28% increase from the previous year, driven by strong market adoption and OEM trials, despite a yearly revenue drop due to the end of a transitional service agreement.

Adjusted EBITDA for 2025 was negative $17.3 million, and the net loss from continuing operations was $29.6 million, slightly improved from the prior year.

Strategic focus includes expanding the market for its CNG fuel storage and delivery system, with progress in North America and growing opportunities in India and Latin America.

The company plans to showcase its technology at the upcoming Advanced Clean Transportation Expo, with a focus on high-pressure CNG systems and HPDI technology.

Operational highlights include transitioning manufacturing from Italy to Canada and China, leading to temporary margin pressures but expected improvements in 2026.

Management is optimistic about 2026, focusing on disciplined execution, advancing OEM programs, and addressing new market opportunities, especially in North America and China.

Full Transcript

OPERATOR

Good day ladies and gentlemen and thank you for standing by. Welcome to the Westport Fuel Systems’ fourth quarter 2025 conference call. At this time, all participants are in a listen only mode. After the speaker’s presentation, there will be a question and answer session. To ask a question during the session, you will need to press Star 11 on your telephone keypad. As a reminder, this conference call is being recorded. At At this time, I would like to turn the conference over to Ms. Ashley Newell. Ma’am. Please begin.

Ashley Newell

Thank you. Good morning everyone. Welcome to Westport Fuel Systems conference call regarding its fourth quarter and full year 2025 financial and operating results. This call is being held to coincide with the press release containing Westport Fuel Systems’ financial results that were issued yesterday after market close. On today’s call, speaking on behalf of Westport will be Chief Executive Officer and Director Dan Selai and Chief Financial Officer Elizabeth Owen. You are reminded that certain statements made on this conference call and our responses to certain questions may constitute forward looking statements within the meaning of the U.S. and applicable Canadian securities laws. And as such, forward looking statements are made based on our current expectations and involve certain risks and uncertainties. With that, I’ll turn the call over to you, Dan.

Dan Selai (Chief Executive Officer and Director)

Thank you, Ashley. And good morning everyone. I want to begin by addressing recent events. We appreciate the patience and support of our shareholders as we work through our recent cybersecurity incident. Our priority was to ensure the integrity of our IT systems, business continuity and financial reporting and we are pleased to confirm that this review has been successfully completed. With this behind us, we’re looking forward to executing on our strategy and delivering on the next phase of our business objectives. Turning to our financial results, the past year has been a defining one for Westport, marked by the successful divestiture of our light duty business, the recent receipt of a 6.5 million payment and further strengthened by Cispira’s agreement with a leading OEM to manufacture and deliver HPDI components for a truck trial assessing the future commercialization. These accomplishments, combined with ending the year with over $27 million in cash and very low debt, reflect the meaningful progress we have made in sharpening our strategic focus and building a stronger company. The global heavy duty transportation market is increasingly recognizing natural gas as a practical lower emissions solution available today. This is evidenced by Volvo’s recent milestone of delivering more than 10,000 natural gas trucks on the road, underscoring the accelerating adoption of Cispira’s HPDI fuel system technology and validates the strategic direction we have taken from a market perspective. The UK leads the adoption of HPDI powered LNG trucks, followed by Germany, Sweden, the Netherlands, Norway and France. Emerging gas markets such as India and Latin America are also gaining momentum with volume seeing steady growth. When we introduced our proprietary CNG fuel storage and delivery system several months ago, we emphasized its potential to significantly expand our addressable market, particularly in North America. Development has progressed well and our confidence in the commercial opportunity continues to build. We look forward to showcasing this solution at the upcoming Advanced Clean Transportation Expo act where we will have the opportunity to show off our technology to industry partners and customers. By integrating advanced high pressure CNG storage with Cispira’s field-proven HPDI fuel system, we match or exceed the performance and efficiency expected from diesel engines with compelling economics. In markets where CNG is the natural choice like North America, we believe this innovation meaningfully enables Westport and Suspira to capture new opportunities as we move into field testing our GFI brand through our high pressure controls, business has also delivered important operational milestones. The opening of one of the world’s fastest growing hydrogen markets and in Canada represents a step in localizing manufacturing, reducing costs and improving competitiveness. As the transportation industry continues to balance economic realities with sustainability objectives, we are confident that alternative fuel systems, including Cispira’s HPDI technology and our high pressure components provide real world solutions that deliver both performance and affordability. With the completion of our strategic transition and only a few milestones remaining, a growing market, validation of Cispira’s expansion, a path to address the North American market and a clear strategic focus Westport is excited to drive into this next phase. Now I’ll have Elizabeth run through some financial details and then come back afterwards. Over to you Elizabeth.

Elizabeth Owen (Chief Financial Officer)

Thank you Dan. Before I dive into the details, I’ll just touch on a few key milestones that we achieved, the first of which is our strong cash position reflective of a successful divestiture of the light duty segment. As of December 31, 2025, our cash and cash equivalents position increased by 12.4 million to 27.2 million compared to 14.8 million at December 31, 2024. The increase in cash was primarily driven by the sale of our light duty segment, as I mentioned, partially offset by cash used in our operating activities and debt repayments exiting 2025 with the proceeds from the disposition of Westport’s late duty segment debt, including the current portion reflected a 57% reduction to 2.9 million as at December 31, 2025. This was compared to 6.8 million in the prior year period, including the long term debt from discontinued operations. The reduction was more than 90%. This improved financial position provides Westport with greater flexibility to concentrate on markets that are best suited to our current strategy. Cispira continues to drive meaningful improvement in our Results. In the fourth quarter of 2025, total revenue was $29.3 million compared to 22.9 million in the same period last year, representing an increase of 28%. This progress is supported by strong market adoption, including Volvo reaching the milestone of more than 10,000 natural gas …

Full story available on Benzinga.com

This post was originally published here

President Donald Trump on Thursday said he is “not happy” with prediction markets, after federal prosecutors charged an Army special forces soldier with turning $33,000 into more than $409,000 on Polymarket by betting on the raid that captured Venezuelan leader Nicolás Maduro.

Master Sgt. Gannon Van Dyke allegedly placed the wagers using classified information about the operation in the days before it became public.

Asked about the case in the Oval Office, Trump reached for a sympathetic comparison. “That’s like Pete Rose betting on his own team,” he said. “Now, if he bet against his team, that would be no good, but he bet on his own team.”

Rose, the all-time MLB hits leader, was banned from baseball in 1989 for betting on games involving his own team.

Pressed on separate insider trading concerns around Iran war contracts, Trump’s tone shifted. “You know the whole world, …

Full story available on Benzinga.com

This post was originally published here

Orchid Island Cap (NYSE:ORC) released first-quarter financial results and hosted an earnings call on Friday. Read the complete transcript below.

This content is powered by Benzinga APIs. For comprehensive financial data and transcripts, visit https://www.benzinga.com/apis/.

View the webcast at https://edge.media-server.com/mmc/p/pp74w7ci/

Summary

Orchid Island Cap reported a net loss of $0.11 per share for Q1 2026, a significant drop from the net income of $0.62 per share in Q4 2025.

The company’s average portfolio balance grew to approximately $11 billion compared to $9.5 billion in the previous quarter, with a leverage ratio increase to 7.9.

Management highlighted the impact of geopolitical events on market variables, noting stability in interest rates and a modest recovery in mortgage spreads.

The company maintained a focus on a highly liquid 100% agency portfolio, raising $108 million in Q1 and an additional $28 million in early April.

Orchid Island Cap’s outlook remains bullish due to stable market conditions and attractive returns, despite uncertainties related to geopolitical tensions.

Full Transcript

OPERATOR

Good day and thank you for standing by. Welcome to the Orchid Island Capital First Quarter 2026 Earnings Call. At this time, all participants are in listen only mode. After the speaker’s presentation there will be a question and answer session. To ask a question during the session you will need to press star 11 on your telephone. You will then hear an automated message advising your hand is raised to withdraw your question. Please press star 11 again. Please be advised that today’s conference is being recorded. I would now like to hand the conference over to Melissa Alfonso, Office Manager. Please go ahead. Good morning and welcome to the first quarter 2026 earnings conference call for Orchid Island Capital. This call is being recorded today, April 24, 2026. At this time the Company would like to remind the listeners that statements made during today’s conference call relating to matters not historical facts are forward looking statements subject to the safe harbor provisions of the Private Securities Litigation Reform act of 1995. Listeners are cautioned that such forward looking statements are based on information currently available on the management’s good faith belief with respect to future events and are subject to risks and uncertainties that could cause actual performance or results to differ materially from those expressed in such forward looking statements. Important factors that could cause such differences are described in the Company’s filings with the securities and Securities and Exchange Commission, including the Company’s most recent annual report on Form 10-K. The company assumes no obligation to update such forward looking statements to reflect actual results, changes in assumptions or changes in other factors affecting forward looking statements. Now I’d like to turn the conference over to the Company’s Chairman and Chief Executive Officer, Mr. Robert Cawley. Please go ahead sir.

Robert Cawley (Chairman and Chief Executive Officer)

Thank you Melissa. Good morning everyone. I hope everybody’s had a chance to download our deck as usual. That will be kind of the basis of our call today. First off, I’d just like to walk you through the agenda as usual. Jerry Cintez, our controller will walk you through the financial results. I’ll then go through the market developments. Basically discuss briefly the market variables that impact our decision making and our performance and have a few comments on those. Then we’ll talk about the portfolio and our hedging positions and then we will open the call up for questions. With that I’ll turn it over to Jerry. Thank you Bob. If we start on page 5, we’ll look at the financial highlights of the first quarter. For the first quarter we had a net loss of $0.11 per share compared to net income of $0.62 in Q4. Our book value at March 31 was 708 per share compared to 754 at December 31st. Total return for the quarter was a negative 1.3% compared to 7.8% in Q4, and we declared dividends of $0.36 during both quarters on page 6. Portfolio highlights Our portfolio continued to grow during Q1. We had an average balance of approximately 11 billion compared to 9.5 billion in Q4. Our leverage ratio increased to 7.9 compared to 7.4 at December 31. Three month CPR during the quarter was 14.7% compared to 15.7% and our liquidity at March 31 was 54.5% compared to 57.7%. On page 7 is our financial statements, which are also presented in our earnings release last night and will also be available in our 10-Q later. And with that I’ll turn it back over to Bob for a discussion of the market development. Thanks Jerry. Alrighty, I will start on slide number nine. As I mentioned, we’re just going to go through the market variables that impact our decision making and our performance. So on page or slide 9 we have the interest rate curves on the top of the page. On the top left is the nominal or cash market curve. On the right is a swap curve. On the bottom it’s just the spread between 3 month treasury bills and 10 year treasuries. Just a few general comments. Obviously in this environment, the war headlines with respect to the war are driving performance of not just interest rates but basically all risk assets. We kind of have competing forces at play. On the one hand you have forces that are inflationary in nature. Others are kind of impact growth or slow growth. The ultimate outcome that’s yet to be seen. We could end up with both. We could end up with stagflation. With respect to the economic data we’ve been seeing, it’s actually been fairly resilient, although I would characterize it as mixed. We’ve had some strong, some weak. But that being said, most of the data that we’ve seen so far is really for the pre war period, so we haven’t seen a lot to gauge the impact of the war. I’d also like to point out that while the war kind of represents a headwind to economic activity and maybe supportive of inflation, there are also tailwinds impacting the economy. The one big beautiful bill was passed last year. The government is running a very significant fiscal deficit. But both of those factors should be kind of supportive of the economy and I think they go a long way in explaining why the data has been so resilient and kind of finally, as we’re Fairly far into Q1 earnings, the earnings have been very strong. So at least so far the impact of the war seems to be modest. With respect to rates, as I mentioned, rates have been very stable. If you look on the left you can see that the curve has flattened. The market is pricing out most Fed cuts that were in the market three months ago or pre war. Now there’s virtually nothing priced in in terms of cuts for the balance of 26 a few basis points, but the curve has been very stable. The impact of inflation is driving Fed cuts out of the market and the impact on growth is keeping longer term rates stable. On the right hand side you can see the swap curve even more stable, same kind of flattening. I would say that the difference between these two is simply just swap spreads. And if you look at where swap spreads are for some comp context, most spreads across the curve are at or slightly above their 12 month averages. They have been moving in Q1. I’ll say a little bit about that in a moment. Moving on to the next kind of variable for us, obviously mortgage spreads and the performance of To Be Announced (TBAs). We do not own typically a lot of To Be Announced (TBAs), we do own spec polls, but they trade at a spread to To Be Announced (TBAs). So obviously the performance of this matters. If you look on the top, you can see the spread of a current coupon mortgage to the 10 year Treasury. This data goes back 16 years. So it gives you a lot of perspective. As you can see on the right hand side, for quite a while mortgages have been tightening. I think it’s noteworthy to note that’s pretty solid performance and also without the participation of one of the largest, typically one of the largest holders of mortgages, which are the large banks, they have not been active in the market and yet this market has performed well. If you look at the extreme right, you can see the tightening. As we all know, early in January President Trump put out a post on Truth Social media indicating that the GSC, Fannie and Freddie would be buying up to $200 billion in mortgages this year. Mortgages gapped tighter. That was in early January. As we moved into February, the performance of the sector was still very solid. At the end of the month, the war hit, we gapped wider, but as you can see, we’ve been tightening since. And so the way I look at that is that the tightening that we’ve seen in place for two years appears to be resuming in terms of the extent of the tightening, our book was down about 6.1%. We’ve gotten back a little under half this week. We’ve given back a little bit, but we’ve basically recouped about half. With respect to the prices of To Be Announced (TBAs) on the bottom left, as we always show, these prices are normalized. So for each coupon we start at 100. I just basically want to show the change over the quarter. Obviously, the announcement by President Trump early in the month caused most mortgages to do very, very well. The exception being the orange line there. Those are higher coupon mortgages, representative of higher coupons, and they would be impacted by speeds. The rationale for the buying of the GSEs is to try to drive spreads tighter, which would presumably impact refinancing, driving …

Full story available on Benzinga.com

This post was originally published here

ASGN Inc. (NYSE:ASGN) shares jumped on Friday as traders reassessed the fallout from a recent earnings miss and soft guidance amid improving tech-led risk appetite.

ASGN will change its name to Everforth, Inc. on April 24, 2026, and begin trading under the ticker “EFOR.”

The move reflects its rebranding strategy, with no action required from shareholders and no change to its NYSE listing or CUSIP.

Post-Earnings Selloff And Miss

The stock had previously dropped more than 25% after reporting first-quarter EPS of 69 cents, missing the 98-cent consensus estimate, and revenue of $968.3 million, slightly below expectations.

ASGN expects second-quarter revenue of $970 million to $1 billion, with net income of $8.0 million to $13.7 million and adjusted EBITDA of $85 million to $95 million, assuming stable end markets.

Full story available on Benzinga.com

This post was originally published here
Mobileye Global Inc (NASDAQ:MBLY) reported better-than-expected first-quarter financial results and raised FY26 revenue outlook on Thursday.

Revenue rose 27% year over year to $558 million, topping the $515.501 million estimate, while adjusted diluted EPS of 12 cents beat the 9 cents estimate.

“First quarter results reflected a stronger than expected start to 2026, and continued favorable demand trends enable us to modestly increase our 2026 outlook. We also secured an important design win with Mahindra which adds a third Surround ADAS customer and a second customer for our next-generation SuperVision product,” said CEO Professor Amnon Shashua.

Mobileye raised its full-year 2026 revenue guidance to $1.935 billion–$2.015 billion. …

Full story available on Benzinga.com

This post was originally published here

Ripple Chief Technology Officer David Schwartz pushed back against speculation that Ripple is coordinating a large-scale XRP (CRYPTO: XRP) adoption strategy with central banks, warning that investors who believe conspiracy theories are “fooling” themselves.

The NDAs Don’t Mean What You Think

Schwartz addressed rumors on X that Ripple is quietly working on major undisclosed announcements involving central banks and XRP adoption.

“I’m saying the conspiracy theories that constantly claim something big is about to happen or that the government is going to do something massive are almost always going to be completely false,” Schwartz wrote. 

“And if you’re investing time, money, or emotion based on them, you’re fooling yourself,” he added.

Moreover, Schwartz acknowledged that many of Ripple’s partners insist on NDAs to keep their business confidential, but he stressed that non-disclosure agreements don’t …

Full story available on Benzinga.com

This post was originally published here

HCA Healthcare (NYSE:HCA) reported first-quarter financial results on Friday. The transcript from the company’s first-quarter earnings call has been provided below.

Benzinga APIs provide real-time access to earnings call transcripts and financial data. Visit https://www.benzinga.com/apis/ to learn more.

View the webcast at https://events.q4inc.com/attendee/339022795

Summary

HCA Healthcare reported a 4.3% increase in revenue and a nearly 2% increase in adjusted EBITDA for Q1 2026, with diluted earnings per share rising by approximately 11%.

The company experienced a reduction in respiratory-related volumes due to a milder season and winter storms, which affected admissions by 70 basis points and ER visits by 140 basis points.

State supplemental programs provided a net benefit of $200 million to adjusted EBITDA, offsetting some of the volume shortfalls.

Strategic initiatives included a focus on digital transformation and AI, with new key initiatives rolled out to more facilities, and continued investments in network development, expanding sites of care by 4%.

The company reaffirmed its full-year guidance, expecting volume growth of 2-3% for the rest of the year and maintaining its outlook for the impact of health insurance exchanges on adjusted EBITDA.

Full Transcript

Operator

Ladies and gentlemen, welcome to HCA Healthcare’s first quarter 2026 earnings conference call. Today’s call is being recorded at this time for opening remarks and introductions. I would like to turn the call over to Vice President of Investor Relations, Mr. Frank Morgan. Please go ahead, sir.

Frank Morgan (Vice President of Investor Relations)

Good morning and welcome to everyone on today’s call. With me this morning is our CEO Sam Hazen and CFO Mike Marks. Sam and Mike will provide some prepared remarks and then we’ll take questions. Before I turn the call over to Sam, let me remind everyone that should today’s call contain any forward looking statements, they’re based on management’s current expectations. Numerous risks, uncertainties and other factors may cause actual results to differ materially from those that might be expressed today. More information on forward looking statements and these factors are listed in today’s press release and in our various SEC filings. On this morning’s call, we may reference measures such as adjusted EBITDA, which is a non GAAP financial measure. A table providing supplemental information on adjusted EBITDA and reconciling net income attributable to HCA Healthcare Inc. Is included in today’s release. This morning’s call is being recorded and a replay of the call will be available later today.

Sam Hazen

With that, I’ll now turn the call over to Sam. Good morning and thank you for joining the call. First, I want to recognize our colleagues for continuing to demonstrate a remarkable ability to adapt to changing conditions and deliver positive results for our patients, communities and stakeholders. The start of the year presented a dynamic environment for HCA Healthcare. From a volume perspective, we did not experience the typical lift related to seasonal respiratory conditions compared to the first quarter of last year. Our respiratory related admissions were down 42% and our respiratory related emergency room visits were down 32%. Additionally, the storm that hit a few of our markets adversely impacted our volumes in the quarter. On the positive side, however, we experienced a greater net benefit than anticipated from state supplemental programs. As a reminder, these programs are complex, they’re variable and difficult to predict. This benefit mostly offset impact from the shortfall in volumes. Regarding payer mix for the quarter, the underlying shifts resulting from the changes in the health insurance exchanges were generally in line with our expectations. This area remains fluid. As we stated in our fourth quarter call, we have considered a range of potential scenarios as the effects continue to evolve. As mentioned, over the last several quarters, our teams have been focused on a broad resiliency plan designed to generate cost savings where appropriate, enhance network execution and strengthen organizational capabilities. I’m pleased with our resiliency efforts to date and we expect they will continue to help offset some of the expected impact from the payer mix shift. Additionally, we were pleased with the volume results exiting the quarter. The respiratory related and winter storm impacts were mostly contained to January with February and March volumes rebounding nicely. For the first quarter. Revenue increased 4.3% compared to the first quarter last year. Adjusted EBITDA increased almost 2% and diluted earnings per share as adjusted increased approximately 11% versus the prior year period. We continue to deliver for our patients in important metrics including improved quality measures, increased patient satisfaction and reductions in average length of stay. I remain excited about our digital transformation program and AI agenda. They progressed during the quarter with rollout of some key initiatives to more facilities. Our clinical teams continue to advance efforts to enhance quality, safety and services to our patients with progress on broad initiatives across nursing care, hospital based physician services and support functions. We continue to invest significantly in network development with our capital spending and with selective outpatient facility acquisitions as compared to the first quarter. Last year, our networks expanded their overall sites of care by more than 4%, increased hospital beds through capital spending by almost 1% and added 4% to emergency room capacity. To summarize, we view the respiratory related volume shortfall and the increase in supplemental payment net benefits as first quarter events. As such, we believe our assumptions for the remainder of the year related to volumes, payer mix and costs continue to remain in line with our original guidance. HCA Healthcare has an impressive capability to remain disciplined in dynamic environments. This is a resounding strength of our teams and what they have built over time. It is rooted in our culture and it helps us to execute on our mission to provide high quality care to our patients while delivering strong financial results. With that, I will turn over the call to Mike for more details on the quarter.

Mike Marks (Chief Financial Officer)

Thank you Sam and good morning everyone. Let me start by providing same facility volume comparisons for the first quarter of 2026 versus the first quarter of 2025. Admissions increased 0.9%, equivalent admissions increased 1.3%, inpatient surgeries were down 0.3% and outpatient surgeries declined 1.7%. ER visits increased 0.3%. As Sam mentioned, we had a much milder respiratory season in the quarter. This produced a drag on our quarterly volume growth in admissions and ER visits of 70 basis points and 140 basis points respectively. In addition, the winter storm in January impacted a wide swath of our markets including Texas, Tennessee, North Carolina and Virginia, reducing admissions and ER visits by an estimated 30 basis points and 50 basis points, respectively. The impact of these two factors was consistent across all payer categories and in total adversely impacted adjusted EBITDA by an estimated $180 million. Regarding payer mix, commercial equivalent admissions excluding exchanges increased 0.6%, Medicare increased 1.9%, and Medicaid increased 0.3%. We believe the variance in volume relative to our expectations was almost entirely driven by the respiratory season and winter storm. We view these factors as being temporal and not structural. Overall, taking all of this into consideration, our volume growth in the quarter was generally in line with our 2 to 3% volume growth assumption for the year, albeit at the lower end of the range. Adjusted EBITDA margin decreased 50 basis points versus prior year. Quarter salaries and benefits as a percentage of revenue improved 30 basis points and supplies improved 20 basis points. Other operating expenses as a Percentage of revenue increased 90 basis points, primarily due to an increase in costs related to the Medicaid state supplemental payments, professional fees, and technological investments. As Sam noted in his comments, volumes continued to improve throughout the quarter and we noted a similar progression of operating leverage and cost trends regarding Medicaid supplemental payment programs. While we expected an increase in net benefit of $80 million, we realized an increase in net benefits of approximately $200 million to adjusted EBITDA versus the prior quarter. This was primarily due to the grandfathered approval of Georgia, the reinstatement of the ATLAS program in Texas, and the year over year benefit of the Tennessee program that was Approved in the third quarter of 2025. We are adjusting our full year range to reflect a decline in supplemental payment program net benefit between $50 million to $250 million versus prior year. This updated guidance does not include any potential impacts from additional approvals of grandfathered applications. We continue to monitor the ongoing developments related to these programs and particularly Florida. We continue to feel positive about the prospects for the approval of the Florida program which covers the period of October 1, 2024 to September 30, 2025. If approved, we believe it should result in additional revenues which may be significant. Now let me provide additional information regarding the exchange environment. As we stated in our fourth quarter call, the complexity of the exchanges is significant and we’re tracking several areas within the company for the quarter. We estimate our same facility exchange equivalent adjusted emissions declined approximately 15% versus prior year quarter. This represents our comprehensive evaluation of patients that presented with exchange coverage but ultimately will not be covered for their episodes of care. Using the same analysis, we estimate same facility uninsured equivalent missions increased approximately 16% versus versus prior year quarter. Over half of this implied increase relates to the movement from exchanges and normal uninsured growth. The remaining portion reflects a slowdown of conversions to Medicaid from patients who were not willing to fill out applications. We estimate the adjusted EBITDA impact from the exchanges to be approximately $150 million in the first quarter of 2026 versus the prior year quarter. Given our experiences today, we still believe our full year range of $600 million to $900 million expected impact on adjusted EBITDA is appropriate. However, the exchange environment remains dynamic and has not fully settled. We will continue to track the fluid nature of this reform and will provide further commentary on our second quarter call moving to capital allocation capital expenditures total $1.1 billion in the quarter. Additionally, we purchased 1.57 billion of our outstanding shares and we paid 183 million in dividends for the quarter. Cash flow from operations was $2 billion in the quarter, representing a 22% increase in the first quarter of 2026 versus the prior year quarter. Our debt to adjusted EBITDA leverage remains in the lower half of our stated target range and we believe our balance sheet is strong and well positioned for the future. As noted in our release, we are reaffirming our estimated guidance races for 2026. I will now hand the call back to Frank Morgan for questions.

Abby

Thank you. Mike. As a reminder, please limit yourself to one question so that we might give as many as possible in the queue an opportunity to ask a question. Abby, you may now give instructions to those who would like to ask a question. Thank you. If you have dialed in and would like to ask a question, please press Star one on your telephone keypad to raise your hand and join the queue. If you would like to withdraw your question, simply press Star one again. If you’re called upon to ask your question and are listening via speakerphone on your device, please pick up your handset and ensure that your phone is not on mute when asking your question. Again, it is Star one to join the queue and our first question comes from the line of Ben Hendricks with RBC Capital Markets. Your line is open.

Ben Hendricks (Equity Analyst)

Thank you very much. I appreciate the color on the Respiratory STP and other components. Maybe you could just give us a rundown broadly of how your results compared to your internal expectations for the quarter.

Mike Marks (Chief Financial Officer)

Thanks, Ben, this is Mike. I mean, our results were a bit short in terms of adjusted EBITDA to our internal expectations. You know, I would size our internal expectations as being pretty consistent with the midpoint of Our guidance in terms of growth, pretty consistent actually with consensus coming into the call. Really two main drivers in terms of the shortfall to internal expectations. The first one is this kind of shortfall in the seasonal volume uplift from respiratory and the winter storms, which was mostly offset by the net benefit from the supplemental payment programs. A little detail here on the on seasonal volumes that fall. You know, I’ve already kind of quantified the volume side of that, so let me talk about the expense side. As we were, as we were coming into January, our respiratory season was actually strong at the beginning of the year. However, later in January, it became apparent that the respiratory season was was actually ending abruptly and we were then hit with a significant January winter storm across several of our states. Both the quick ramp down of the respiratory volume as well as the winter storm delayed our ability to flex down our seasonal cost in the quarter. We were ultimately able to do so as we move through the quarter, but there was a delay. So let me switch now to the supplemental payment program activity. The as noted, you know, Medicaid supplemental payments net benefits was better than expected as we came into the quarter. We did anticipate an increase in the supplemental payment net benefit in Q1 of $80 million, largely due to the increase in the Tennessee program that was approved in Q3 of 2025. So the $200 million in net benefit in the first quarter was about $120 million higher than our internal expectations in the quarter and again resulted from the approval of the Grandfather Georgia program as well as the reinstatement of the Atlas program in Texas. So in summary, Ben, when I think about first quarter, you know, largely we were just a bit short in total. But when you take the temporal factors of the lack of the seasonal volume uplift and the pickup in net benefit supplemental payments, those are really the main drivers in the quarter.

AJ Rice (Equity Analyst)

Thanks. Appreciate that color. And then kind of as a quick follow up, can you just give us an update on the moving pieces that kind of get you back to the initial guide? You know, maybe walk us through the components of the EBITDA bridge as you see them today after such a dynamic first quarter. Thanks. Sure. You know, if you go back to the release, you know, the really only change to our key assumptions for the 2026 guidance relates to the supplemental payment programs. We estimate that the Georgia approval and the reinstate Atlas program previously discussed will provide approximately $200 million of incremental net benefit for the full year that was not originally included in our guidance. I would note that, you know, the $120 million Georgia and Texas that we talked about for first quarter had a prior period impact in it. And so, you know, the component that applied the first quarter and for the full year of 26 really make up that $200 million. And so, you know, that’s why we’re adjusting our assumption for full year net benefit to now be a decline of 50 million to $250 million. And just to note, that assumption does not include any additional approvals of grandfathered applications. When I think about the rest of our assumptions, Ben, if you think about the impact of the exchanges, we still believe that that 600 to $900 million range is appropriate based on what we’ve learned in first quarter, our resiliency assumptions that we’re in guidance also we believe are still reasonable and appropriate. And so, you know, at the end of the day, we just felt like that it was, it was appropriate not to change our total guidance ranges even with the $200 million improvement in first quarter. You know, a chunk of that really goes back to this, this temporal nature of the headwinds that we saw in first quarter being related to the seasonal volume impacts in the winter storm and the related cost impacts. And so as we think about how we progress through the quarter, you know, Sam mentioned that, you know, as we exited the calling, exited the quarter in March, there are volumes. We’re improving largely back to our original plan. We also saw the same thing in our cost structure as we got through March. Our cost trends really reflected good performance in March and were largely on plan. And so that’s the walkthrough on guidance. Thank you very much. And our next question comes from the line of AJ Rice with ubs. Your line is open.

Mike Marks (Chief Financial Officer)

Hi everybody. Just to put a fine point on what we’re just going, all the numbers flying back and forth is the right way. Am I hearing you say you basically had 180 million of negative impact from flu and weather in the first quarter. …

Full story available on Benzinga.com

This post was originally published here

On Friday, NBT Bancorp (NASDAQ:NBTB) discussed first-quarter financial results during its earnings call. The full transcript is provided below.

Benzinga APIs provide real-time access to earnings call transcripts and financial data. Visit https://www.benzinga.com/apis/ to learn more.

The full earnings call is available at https://edge.media-server.com/mmc/p/jw5n3uqu/

Summary

NBT Bancorp reported solid first-quarter 2026 financial results, with a 27% increase in net income compared to the same period in 2025, driven by disciplined balance sheet management and diversified revenue streams.

The company’s operating return on assets was 1.29%, and return on tangible equity was 15.50%, reflecting significant improvements over the prior year.

Net interest margin improved by 28 basis points year-over-year, although commercial real estate payoffs and challenging winter conditions impacted early 2026 performance.

Non-interest income reached a new high with growth in retirement plan administration services, and the company continues to focus on organic growth and dividend increases.

The integration of Evans Bancorp is progressing well, and NBT Bancorp is actively exploring M&A opportunities while maintaining strong capital levels.

Loan portfolio diversification is maintained, despite a slight decline in total loans, with a strategic focus on deposit growth and optimizing funding costs.

Management noted continued economic activity in their markets, particularly in advanced manufacturing and infrastructure, with confidence in future growth opportunities.

The company repurchased 250,000 shares in the first quarter and plans to continue opportunistic share repurchases.

Key asset quality metrics showed an increase in provision for loan losses due to a higher level of net charge-offs and non-performing loans, though reserves are well-positioned.

Full Transcript

OPERATOR

Good day everyone. Welcome to the conference call covering NBT Bancorp’s first quarter 2026 financial results. This call is being recorded and has been made accessible to the public in accordance with the SEC Regulation FD. Corresponding presentation slides can be found on the company’s website at nbtbancorp.com before the call begins, NBT’s management would like to remind listeners that as noted in slide 2, today’s presentation may contain forward looking statements as defined by the Securities and Exchange Commission. Actual results may differ from those projected. In addition, certain non-GAAP measures will be discussed. Reconciliations for these numbers are contained within the appendix of today’s presentation. At this time, all participants are in listen only mode. Later we’ll conduct a question and answer session. Instructions will follow at that time. As a reminder, this call is being recorded. I will now turn the conference over to NBT Bancorp President and CEO Scott Kingsley for his opening remarks. Mr. Kingsley, please begin.

Scott Kingsley (President and CEO)

Thank you. Good morning and thank you for joining us for this earnings call covering NBT Bancorp’s first quarter 2026 results. With me today are Annette Burns, NBT’s Chief Financial Officer, Joe Stagliano, President of MBT bank and Joe Ondesco, our Treasurer. Our solid operating performance for the first quarter was driven by disciplined balance sheet management, the growth of our diversified revenue streams and the continued benefits of integrating Evans Bancorp into our franchise following the merger in May 2025. These factors have contributed to productive gains in operating leverage. Operating return on assets was 1.29% for the first quarter with a return on tangible equity of 15.50%. These metrics represent meaningful improvement over the first quarter of last year and have provided incremental capital flexibility. Our tangible book value per share of $27.05 at quarter end was more than 9% higher than a year ago. The continued remix of earning assets, diligent management of funding costs and the addition of the Evans balance sheet resulted in a 28 basis point improvement in net interest margin year over year. We got off to a slow start in January and February with the very difficult winter weather conditions and we experienced a higher than expected level of commercial real estate payoffs. With that said, activity since then has been quite good and we are very pleased with the types of customer opportunities we are seeing across our footprint as well as our current pipeline levels. Growth in non interest income continue to be positive, highlighted by a new all time high in quarterly revenue generation from our retirement plan administration business. Our capital utilization priorities remain focused on supporting organic growth while continuing our long standing commitment to annual dividend growth. In addition, our strong capital levels continue to allow us to evaluate a variety of M and A opportunities. Another component of our capital planning is to return capital to shareholders through opportunistic share repurchases. Consistent with that approach, we repurchased 250,000 of our own shares again in the first quarter of 2026. One year in the integration of our Evans bank colleagues has gone smoothly and validated the strong cultural alignment we saw from the outset. Their customer and community focused approach continues to enhance our franchise and we remain excited about the opportunities ahead in the western region of New York. Momentum across upstate New York’s semiconductor corridor continues to build. Since Micron’s groundbreaking late last year and the completion of its site acquisition from Onondaga county in the first quarter, development activity has accelerated. Site development and infrastructure buildout for the first fabrication facility are now underway and we are already seeing tangible benefits with more than a dozen of our customers and securing contracts tied to the project. Stepping back more broadly across our seven state footprint, we continue to see encouraging activity tied to advanced manufacturing, infrastructure investment, housing development and workforce driven economic initiatives. These dynamics are evident across our core markets including manufacturing and defense activity in New England as well as construction and community revitalization efforts throughout our legacy regions. While activity levels can vary quarter to quarter, the depth and diversity of these initiatives reinforce our confidence in the markets we serve. We believe NBT is well positioned to support this activity through our relationship driven model, significant balance sheet capacity and a diversified set of financial solutions. I will now turn over the meeting to Annette to review our first quarter results with you in detail.

Annette Burns (Chief Financial Officer)

Annette thank you Scott and good morning. Turning to the Results Overview page of our earnings presentation for the first quarter we reported net income of $51.1 million or $0.98 per diluted common share. We have improved earnings 27% from the first quarter of 2025 with growth in our balance sheet, net interest margin improvement and a 4.5% year over year growth in our fee based income as well. Earnings were modestly lower than the prior quarter, consistent with seasonal expectations, two fewer days in the quarter and a normalized effective tax rate. The next page shows trends in outstanding loans. Total loans at $11.5 billion were down $50.9 million from December 31, 2025, with other consumer and residential solar portfolios in a planned runoff status representing half of that decline. In addition, we continue to experience an elevated level of commercial payoffs similar to the prior 2/4. Our total loan portfolio remains purposely diversified and is comprised of 56% commercial relationships and 44% consumer loans. On page six total deposits were up $244 million from December 2025, primarily due to the inflow of seasonal municipal deposits during the quarter along with increases in consumer and commercial customer account balances. Generally, in most of our markets, municipal tax collections are concentrated in the first and third quarters of each year. We experienced a favorable change in our mix of deposits out of higher cost time deposits and into checking, savings and money market products. 59% or $8 billion of our deposit portfolio consists of no and low cost checking and savings account at a cost of 38 basis points. The next slide highlights the detailed changes in our net interest income and margin. Our net interest margin in the first quarter increased 7 basis points to 3.72% compared with the prior quarter as the 9 basis point decrease in the cost of funds more than offset the 2 basis point decline in earning asset yields. Loan yields decreased 4 basis points from the prior quarter to 5.66% primarily due to the repricing of variable rate loans following the prior quarter’s federal funds rate decreases. We were able to actively manage our funding costs downward to more than offset that impact as evidenced by the 10 basis point decline in our total cost of deposits to 1.34% for the quarter. Net interest income for the first quarter was $134.3 million, a decrease of $1 million compared to the prior quarter, but more than 25% above the first quarter of 2025. The decrease in net interest income from the prior quarter was driven by two fewer days in the first quarter of 2026. The opportunity for further upward movement in earning asset yields and net interest margin will depend largely on the shape of the yield curve and how we reinvest loan and investment portfolio cash flows. The trends in non interest income are outlined on Page 8. Excluding securities gains, our fee income was $49.7 million consistent with the prior quarter and increased 4.5% from the first quarter of 2025. Our combined revenues from retirement plan services, wealth management and insurance services exceeded $32 million in quarterly revenues. Noninterest income represented 27% of total revenues in the first quarter and reflects the strength of our diversified revenue base. Total operating expenses were $112 million for the quarter, a 0.5% increase from the prior quarter. Salaries and employee benefit costs were $68.8 million, an increase of $2.8 million from the prior quarter. This increase was primarily driven by seasonally higher payroll taxes and stock based compensation partially offset by lower medical expenses. In addition, annual merit increases occurred in mid March at an average rate of 3.3%. The quarter over quarter increase in occupancy expenses was expected driven by increases in seasonal costs including utilities and higher maintenance costs. The effective tax rate for the first quarter was higher than the prior quarter at 23.3% primarily due to the finalization of the deductibility of last year’s merger related expenses and the associated impact on the full year effective tax rate in 2025. Slide 10 provides an overview of key asset quality metrics. Provision expense for the three months ended March 31, 2026 was $5.6 million compared to $3.8 million for the fourth quarter of 2025. The increase in provision for loan losses was primarily due to a slightly higher level of net charge offs and non performing loans resulting in a higher level of allowance for loan losses. Reserves were 1.2% of total loans and covered more than two times the level of non performing loans. In closing, we believe the strength of our franchise positions us well for growth opportunities as they arise. We continue to see productive engagement across our markets reflecting our ongoing investment in our people and communities. Thank you for your interest in our results. At this time we welcome any questions you may have.

OPERATOR

Thank you. To ask a question, please press star 11 on your telephone and wait for your name to be announced. To withdraw your question, please press star 11 again. One moment please. Our first question comes from the line of Mark Shutley with kbw.

Mark Shutley (Equity Analyst)

Hey, good morning. Good morning. So expenses came in a little bit better than, you know, we were expecting despite sort of the seasonal factors there. So I was wondering if you could maybe update us on your outlook there and sort of maybe what’s an appropriate run rate for the year?

Annette Burns (Chief Financial Officer)

Sure, I’ll take that. Mark. So yes, there were some seasonality in our first quarter expenses, primarily higher levels of salaries and benefit costs related to payroll taxes and stock based compensation as well as some higher level of occupancy costs. As we look into the next quarter and we think about salaries and benefit costs, we’ll probably see some increased costs related to our merit increases as well as an additional payroll day as well as our occupancy expense. Seasonal increase will probably be offset in the second quarter by just increase in productivity across our markets like higher travel training as well as technology initiatives. So with all that being said, our run rate in the first quarter was right around 112 million that will probably be a good place to be in the second quarter. And we still think our run rate or overall increase in occupancy or overall operating expenses typically runs between 3% and 4% annually. We still think that that is, you know, kind of where we’re landing for 2026.

Scott Kingsley (President and CEO)

And Mark, we had some costs in the third and the fourth quarter of last year on the operating expense side that were a little bit higher than sort of standard run rate, you know, some specific initiatives or some specific costs that we incurred in those quarters. So not unusual for sort of the other, the other expense line to be a little bit lower in the first quarter with that, as Annette mentioned, with the costs associated with stock based compensation and payroll taxes to kind of be the higher one.

Mark Shutley (Equity Analyst)

Great, that’s helpful. Thank you. And then maybe …

Full story available on Benzinga.com

This post was originally published here

Top Wall Street analysts changed their outlook on these top names. For a complete view of all analyst rating changes, including upgrades, downgrades and initiations, please see our analyst ratings page.

  • Morgan Stanley analyst Erin Wright upgraded Phillips 66 (NYSE:PSX) from Equal-Weight to Overweight and raised the price target from $147 to $174. Phillips 66 shares closed at $159.53 on Thursday. See how other analysts view this stock.
  • Needham analyst N. Quinn Bolton upgraded Maxlinear Inc (NASDAQ:MXL) …

Full story available on Benzinga.com

This post was originally published here

Kinsale Cap Gr (NYSE:KNSL) released first-quarter financial results and hosted an earnings call on Friday. Read the complete transcript below.

This content is powered by Benzinga APIs. For comprehensive financial data and transcripts, visit https://www.benzinga.com/apis/.

Access the full call at https://events.q4inc.com/attendee/540154483

Summary

Kinsale Cap Gr reported a 37.7% increase in diluted operating earnings per share for Q1 2026, with an annualized operating return on equity of 24%.

Net written premium grew by 5.6%, despite a 0.5% decrease in gross written premium, reflecting growth in business lines with less reinsurance participation.

The company highlighted its commitment to disciplined underwriting and a low-cost business model, supported by a strong focus on technology and analytics.

Operationally, new business submissions, quotes, and bind orders increased, with significant growth seen in smaller accounts amid increased competition in larger commercial property divisions.

The company continues to leverage AI and technology innovations to enhance efficiency and maintain an expense ratio advantage.

Management expressed confidence in maintaining strong ROE, targeting a low 20s return, and adapting to competitive market conditions.

The overall sentiment from management was optimistic about future growth opportunities, particularly in small to medium-sized accounts, despite some market challenges.

Full Transcript

OPERATOR

Before we get started, let me remind everyone that through the course of the teleconference, Kinsale Capital Group’s management may make comments that reflect their intentions, beliefs and expectations for the future. As always, these forward looking statements are subject to certain risk factors which could cause actual results to differ materially. These risk factors are listed in the company’s various SEC filings, including the 2025 Annual Report on Form 10K, which should be reviewed carefully. The Company has furnished a Form 8K with the securities and Exchange Commission that contains the press release announcing its first quarter results. Kinsale Capital Group’s management may also reference certain non GAAP financial measures in the call today. A reconciliation of GAAP to these measures can be found in the press release which is available at the company’s website at www.kinsalecapitalgroup.com. I will now turn the conference over to Kinsale Capital Group’s Chairman, President and CEO, Mr. Michael Keogh. Please go ahead sir.

Michael Keogh (Chairman, President and CEO)

Thank you Operator and good morning everyone. Today I’m joined by Brian Petrocelli, our Chief Financial Officer, Stuart Winston, our Chief Underwriting Officer and Salman Alabay, our Chief Actuary and head of our data and analytics team. In the first quarter 2026 Kinsale Capital Group’s diluted operating earnings per share increased by 37.7% over the first quarter of 2025, generating an annualized operating return on equity of 24%. Gross written premium was down half of 1% but net written premium grew by 5.6% for the quarter as our business lines with the least reinsurance participation continue to show positive top line growth. Sales combined ratio was 77.4%. E&S market conditions in the first quarter continued to be competitive with the level of competition and our growth rate varying from one market segment to another. We added additional disclosure to our 10Q this quarter with gross written premium detailed by Underwriting Division first quarter of 2026 and 2025. This quarterly disclosure complements the annual disclosure of premium by Underwriting division in our 10k and provides some insight into market conditions and growth prospects at a more granular level and continuing the trend from the last few quarters. Much of the headwind to our growth emanates from our large commercial property division where we write larger layered property accounts and where there is an abundance of competition and falling rates. Excluding the commercial property division, Kinsale’s growth in Gross written premium was 6% for the first quarter. The investment thesis in Kinsale has always started with our disciplined underwriting and low cost business model. By maintaining control over our underwriting operation and never outsourcing it to third parties. We drive a more accurate and more profitable underwriting process while offering our brokers the best customer service and the broadest risk Appetite in the E&S market. Likewise, our 17 year commitment to making technology and analytics a core competency allows us to operate a smarter business with a tremendous cost advantage over every competitor in the market. No exceptions. And in this competitive period of the insurance cycle, the model continues to succeed. In the first quarter, new business submissions were up 6%, new business quotes were up 8% and new business bind orders were up 9%. We are seeing the largest headwind to growth among larger accounts, particularly within our commercial property division. It’s on the larger premium accounts where the competition is most intense, hence our continued focus on smaller transactions where margins continue to be robust. You can see this smaller account trend in our average policy premium for the quarter. It was $12,200 per policy, down from 14,200 in the first quarter of 2025. Finally, we continue to work on technology innovation, including extensive use of AI models to drive automation in our business process, especially underwriting and claim handling, and throughout our software development and analytics teams. This innovation is improving efficiency, customer service, accuracy and data collection across our business and we have begun incorporating various AI agents into our enterprise system. With the talent of our technology professionals and our bespoke enterprise system and the lack of any legacy software, we are well positioned to expand our tech lead to the benefit of both profitability and growth. And with that, I’ll turn the call over to Brian Petrucelli.

Brian Petrocelli (Chief Financial Officer)

Thanks Mike. As Mike just noted, the profitability of the business continues to be strong with net income and net operating earnings increasing by 26.1% and 36.3% respectively. Quarter over quarter 77.4% combined ratio for the quarter included 4.5 points from net favorable prior year loss reserve development compared to 3.9 points last year, with less than a point in cat losses this year compared to six points in Q1 last year. Gross written premium decreased by a half point for the quarter while net written Premium grew by 5.6%. And as Mike mentioned, the growth in net written premium was higher than gross as the lesser reinsured lines continue to grow at a nice clip. We produced a 21.1% expense ratio for the quarter compared to 20% last year. The other underwriting expense portion of the ratio, which is the best measure of the operational efficiency of the business, was 10.3% for the quarter compared to 10.5% in Q1 2025. The overall expense ratio increase is attributable to a higher net commission ratio resulting from higher reinsurance retentions. The larger retention provides a positive economic trade for the company with a higher net commission ratio being more than offset by greater underwriting and investment income. On the investment side, net investment income increased by 26.5% for the first quarter over last year as a result of continued growth in the investment portfolio generated from strong operating cash flows. Kinsale Capital Group’s float mostly unpaid losses and unearned Premium grew to 3.3 billion at March 31 from 3.1 billion at the end of 2025. Annual gross return was 4.5% for the quarter compared to 4.3% last year. New money yields are averaging around 5% with an average duration slightly above four years on the company’s fixed maturity investment portfolio. And lastly, diluted earnings per share continues to improve and was $5.11 per share for the quarter compared to $3.71 per share for the first quarter 2025. And with that I’ll pass it over to Stuart.

Stuart Winston (Chief Underwriting Officer)

Thanks Brian. There’s plenty of competition in the E&S market, but there’s also opportunity and it’s also a market in constant transition areas like large shared and layered placements in commercial property, certain professional lines, management, liability and public entity all continue to experience strong competition and headwinds to growth. Recently we have noticed more aggressive competition in some long tail lines like construction over the last quarter as well. There are also strong areas of opportunity with favorable growth prospects within the E&S market. Within the overall property market, our small business property, inland marine, agribusiness, property and personal insurance divisions all experienced favorable underwriting conditions and strong growth in the quarter. Within casualty, our agribusiness, casualty, Allied Health, General casualty, Health care, Entertainment and Product Liability division saw favorable markets and growth in the quarter as well. We also continue to drive growth through new product offerings and product expansions, robust marketing efforts, new broker appointments and continually improving service standards combined with the broadest risk appetite in the business. As Mike mentioned, overall new Business submission growth increased 6% in the first quarter, a similar rate to the fourth quarter of 2020. We continue to see a decline in new business submissions in the commercial property division that handles large shared and layered deals and excluding the commercial property division, new business submissions were up 9% for the quarter. While our lines of business are experiencing varying levels of competition and pricing pressure, the combined pricing trend for Kinsale is in line with the AmWINS pricing index which showed a rate decrease of 3 and a third percent compared to a 2.7% decrease in the fourth quarter of 2025. Although large …

Full story available on Benzinga.com

This post was originally published here

Amid the ongoing Iran war, Chevron (NYSE:CVX) CEO Mike Wirth has cautioned that air travel costs could surge, and flight availability may dwindle.

Wirth, on Thursday, expressed that the conflict over the Strait of Hormuz is causing instability in global markets, leading to a rise in fuel prices. “We’ve seen some upward pressure on gasoline prices now. I think aviation is clearly an area where it’s going to probably get worse over the next few weeks,” he said on CBS’s Face the Nation with Margaret Brennan.

He also pointed out that the jet fuel market in Europe and Asia is tightening rapidly, compelling airlines to modify their flight schedules and hike fares.  “We’re seeing it flow through into fares. I think that’s one of the first places it will be felt most broadly,” Wirth noted.

“And yes, fares — fares could be higher,” he said. 

Wirth highlighted that a jet fuel shortage was already in effect in certain regions before the Iran war commenced on Feb. 28. In response, airlines have increased bag check …

Full story available on Benzinga.com

This post was originally published here

Top Wall Street analysts changed their outlook on these top names. For a complete view of all analyst rating changes, including upgrades, downgrades and initiations, please see our analyst ratings page.

  • BTIG analyst Thomas Shrader initiated coverage on Neonc Technologies Holdings Inc (NASDAQ:NTHI) with a Buy rating and announced a price target of $15. NeOnc Technologies shares closed at $4.79 on Thursday. See how other analysts view this stock.
  • Jefferies analyst Stephanie Moore initiated coverage on Navios Maritime Partners L.P. (NYSE:NMM) with a Buy rating and announced a price target of $85. Navios Maritime Partners shares closed …

Full story available on Benzinga.com

This post was originally published here

Procter & Gamble (NYSE:PG) reported third-quarter financial results on Friday. The transcript from the company’s third-quarter earnings call has been provided below.

This content is powered by Benzinga APIs. For comprehensive financial data and transcripts, visit https://www.benzinga.com/apis/.

Access the full call at https://events.q4inc.com/attendee/506630038

Summary

Procter & Gamble reported a solid acceleration in top-line results for Q3, with organic sales up more than 3% year-over-year, driven by a 2% volume increase and 1% pricing increase.

The company achieved broad-based growth across all product categories and regions, with notable sales growth in skin and personal care, and strong performance in North America and Greater China.

Core earnings per share (EPS) grew 3% to $1.59, though margins were pressured by incremental investments and energy cost impacts related to geopolitical conflicts.

Procter & Gamble announced a 3% increase in its dividend, marking the 70th consecutive annual increase, and returned $3.2 billion to shareholders this quarter.

The company is focusing on strategic initiatives such as innovation, consumer communication, and supply chain enhancements to drive future growth and mitigate cost headwinds.

Management expressed confidence in maintaining momentum despite geopolitical uncertainties and affirmed its commitment to its Integrated Growth Strategy.

Fiscal 26 guidance remains unchanged, with organic sales growth expected to be in the range of 0-4%, but results are likely to be at the lower end due to cost headwinds.

Management highlighted ongoing investments in innovation and productivity to support business growth and expressed optimism about long-term opportunities.

Full Transcript

OPERATOR

Good morning and welcome to Procter & Gamble’s quarter end conference call. Today’s event is being recorded for replay. This discussion will include a number of forward looking statements. If you will refer To P&G’s most recent 10K, 10Q and 8K reports, you will see a discussion of factors that could cause the Company’s actual results to differ materially from these projections as required by Regulation G. Procter & Gamble needs to make you aware that during the discussion the Company will make a number of references to non GAAP and and other financial measures. Procter and Gamble believes these measures provide investors with useful perspective on underlying business trends and has posted on its Investor Relations website www.pginvestor.com A full reconciliation of non GAAP financial measures. Now I will turn the call over to P&G’s Chief Financial Officer Andre Schulten.

Andre Schulten

Good morning everyone. Joining me on the call today are John Chevalier and Kerry Cohen, our Senior Vice Presidents of Investor Relations. I will start with an overview of results for the third quarter of fiscal ’26 and then discuss our progress on near term business interventions and longer term transformation efforts. I’ll close with guidance for fiscal ’26 and then we’ll take your questions. As we expected, we saw solid acceleration in top line results in our fiscal third quarter. Bottom line results reflect the strength of the top line progress with partial offsets from incremental investments in the business and energy cost impacts from the conflict in the Middle East. Taken together, we remain on track to deliver within our guidance ranges. For the fiscal year, organic sales increased more than 3% versus the prior year. Volume increased 2 points, pricing was up a point and mix was flat. For the quarter we delivered broad based growth across the business with each of our 10 product categories growing organic sales. Skin and personal care grew organic sales high single digits. Hair care, family care and home care grew mid singles personal health care, oral care, fabric care, baby care, feminine care and grooming each grew low single digits. Growth was also broad based geographically. While with each of our seven regions growing organic sales focus markets were up 3%. Organic sales in North America grew 4%. Volume was up 3 points driven by improved consumption and trade inventory dynamics. We saw a benefit from base period trade inventory destocking and a modest help from a current period trade inventory increase late in the quarter driven by Easter timing. Price mix added a point of growth. The Europe region was up 2% led by enterprise markets being up 6% and modest growth in focus markets led by the UK, Italy and Spain. Greater China organic sales grew 3% continued growth in what remains a challenging consumer environment. Campus and SK2 led the growth, each up double digits. Enterprise markets in aggregate grew 5% for the quarter. Latin America organic sales were up 5% with Mexico and Brazil each up high single digits. Organic sales in Asia Pacific, Middle East, Africa enterprise region was up 4%. Global aggregate market share improved to in line with prior year with positive Trends through the quarter. 26 of our 50 top 50 category country combinations held or group share for the quarter. On the bottom line, co earnings per share came in at $1.59 up 3% versus prior year. On the currency neutral basis, Core EPS was in line with prior year core growth margin was down 100 basis points and core operating margin was down 80 basis points versus prior year. Strong productivity improvement of 330 basis points was offset by healthy reinvestment in innovation and demand creation. Currency neutral core operating margin was down 70 basis points. Adjusted free cash flow productivity was 82% and we returned $3.2 billion of cash to share owners this quarter, $2.5 billion in dividends and over $600 million in share repurchases. Earlier this month we announced a 3% increase in our dividend, continuing our commitment to return cash to share owners and this marks the 70th consecutive annual dividend increase and the 136th consecutive year P&G has paid a dividend. In summary, this was a solid quarter of progress, positive sales and share trends and earnings growth in a difficult environment. Geopolitical dynamics have thrown new challenges in front of us, but we will continue to fully support the business to maintain the momentum that we are creating as we move forward. We remain committed to the Integrated Growth Strategy, a portfolio of daily use products in categories where performance matters. In these performance driven categories, we must deliver irresistibly superior products across the product itself, the package, the brand, communication, retail execution and value. We continue to drive productivity with multi year visibility, to fund innovation and demand creation and to mitigate cost headwinds. Constructive disruption is key to staying ahead of and to creating emerging trends and opportunities in our fast changing industry. Finally, an organization that is fully engaged, enabled and excited to serve consumers and to win in the marketplace. Now P&G’s point of difference Our competitive advantage comes from outstanding integrated execution of these strategies across all activity systems in the company and from anticipating what capabilities are needed next. While the core strategy remains constant. On last quarter’s call and at the CAGNY conference, we outlined three major changes in the landscape around us. Media fragmentation and changing consumer media preferences preferences are affecting how consumers are collecting information about our categories, including platforms like social media, retail media and AI portals. The retail landscape is changing. More concentration, but also brand proliferation. Retailers are becoming media platforms and media platforms are becoming retailers. Third is Inflation across food, energy, health care and many other areas of spending has taken a toll on consumers and how they assess value. Recent geopolitical events have elevated this to a new level of concern. In short, the consumer path to purchase is changing every day and we expect an even more intense pace of change in the next three to five years. The interventions and investments we’re making in P&G capabilities to adapt to these changes are beginning to bear fruit. Strong innovation supported by sharper consumer communication and retail execution. A few examples Building on the success of Dawn Powerwash in the US Ferries Skip the Soak in the UK is a great example of deep consumer insight that’s driving innovation. Consumer research showed us that more than 70% of UK consumers soap dishes before washing. With this insight in mind, we created the Ferry Skip the soap idea which instantly and intuitively helps consumers understand what the product is and what it’s for. Integrated superiority across all vectors where the product name inspires the packaging in store. Execution and communication all supported by superior performance that delivers on the promise. Skip the Soak drove Fairy brand wholesale penetration to 61%, up 5 points in its first year. Mister Clean continues to innovate on its core proposition and solving more cleaning jobs with new additions to the portfolio core and more. The brand has launched new innovations on the Magic Eraser platform that improved the longevity with a denser foam and a wider micro scrubbing structure that now lasts two times longer. We restaged the packaging to use room and mass focused names that clearly signal where to use the eraser. At the same time, we launched Mister Clean Shower and Tub Scrubber to address consumers number one most hated cleaning chore Shower and tub Mistr. Clean Shower and Tub Scrubber delivers a quicker, easier and deeper clean with the power of the Magic Eraser, a sturdy grip handle built in squeegee and a pivoting head for hard to reach areas. The results Mister Clean is winning consumers and driving category growth, delivering 18 times its fair share of the bath cleaning category growth since launch. Germany Pantene identified an opportunity to improve brand and product superiority awareness by capitalizing on media landscape shifts. The increased investments in social media and influencer partnerships including top German beauty opinion leaders, hair experts and brand events including talk worthy local events like the Oktoberfest and Berlin Fashion Week. The impact earned influencer posts grew four times and total reach tripled despite a 20% reduction in media spend. Content value share in Germany is up 60 basis points versus a year ago and accelerating. The other examples we’ve discussed recently also continue to deliver strong results including Greater China baby Care, Mexico fabric enhancers, Brazil hair care and US Personal care. Finally, tight boosted liquid detergent in the US continues to deliver strong results. Initial weeks in the tight EVO launch are on track with our high expectations. While we work to improve our near term results, we’re also making progress on a longer term reinvention of PNG capabilities, the next phase of constructive disruption that will create and extend our competitive advantages in each element of our strategy. The way to break through consistently is to build the strongest brands in the industry. P&G has the unique strengths and capabilities to redefine brand building to deliver consumer relevant superiority. First, we are leveraging our large iconic brands with huge consumer bases and all the data we gather. We are now scaling the integrated data platforms and the technologies that will enhance our team’s ability to mine this data for insights that lead to new product innovations, brand ideas, performance claims and marketing campaigns across all relevant consumer platforms. Next, we are driving our unique set of innovation capabilities, substrate technology, thermoleic chemistry devices and biology to deliver breakthrough solutions in every part of the business. Third, we have tremendous supply chain capability. Supply chain 3.0 is driving a more complete system connection from purchase signal to our production planning and material ordering to ensure consumers find the product they want each time they shop. We know how to automate, digitize and autonomize our operations and more importantly, we have qualified a financial framework to generate strong returns on these investments. Our innovation and supply capabilities are key enablers to win in the volatile market we operate in today. Connecting R and D supply chain and procurement allows us to adjust, sourcing, optimize formulations and qualify alternative suppliers faster and more effectively than ever done before. It took years to build these underlying platforms and capabilities and we are now in full scaling mode across the company. The next step is to connect the dots to integrate the pieces. We will close the loop and we believe this will create a new S curve for growth and value creation centered around our consumers. We are confident in the short term progress we’re making and we’re excited about the mid to long term as we leverage our strength and unique capabilities to set us apart from the industry. Moving on to Guidance as we saw in our press release this morning, we are maintaining our fiscal ’26 guidance ranges across organic sales, growth, core, EPS and adjusted free cash flow productivity. However, where we will land within those ranges has become more uncertain. Given the geopolitical dynamics in the Middle east, we continue to expect organic sales growth of in line to 4%. We’re seeing progress in most categories and regions as you can see in this quarter’s results. Underlying global market growth for our portfolio footprint is around 2% on a value basis with a positive trend over the last two months. However, it’s unclear how much higher gasoline and energy costs will impact near term consumer spending in our categories. Also, as I mentioned earlier, the trade inventory increase we saw in March was driven by Easter timing and likely some protection against potential price increases or supply chain disruptions resulting from the conflict in the Middle East. We expect this to result in fourth quarter organic sales somewhat lower than third quarter. As a reminder, our top line guidance includes a roughly 30 to 50 basis point headwind from product and market exits as part of our restructuring work. Our bottom line guidance is for core EPS growth in line to 4% versus prior year. This equates to a range of 683 to 709 per share. This guidance includes a foreign exchange tailwind of approximately $200 million after tax, unchanged from our prior outlook. We now expect a headwind of approximately $150 million after tax for the fiscal from a combination of commodity linked cost inflation, feedstock exposures and logistics disruptions resulting from the conflict in the Middle East. Almost all of these increased cost excuse me, will be in the fiscal fourth quarter. Our teams are doing a tremendous job to protect supply continuity and to minimize cost impacts. Much of this work, such as rapid product reformulation and supplier diversification is enabled by the advanced data, tools and capabilities we discussed earlier. With the timing of these cost impacts, there is little opportunity to create short term offsets within cost of goods sold. Likewise, we will protect our demand creation investments in the business to support our new innovation and maintain positive momentum. In fact, we’ve approved incremental investments in several businesses in the last month. Given all the above, we now expect full year EPS results to be toward the lower end of the guidance range. Our fiscal ’26 outlook continues to call for approximately $500 million before tax and higher costs from tariffs below the operating line. We continue to expect modestly higher interest expense versus last fiscal year and a core effective tax rate in the range of 20 to 21% for fiscal ’26 combined, a $250 million after tax headwind to earnings growth. We continue to forecast adjusted free cash flow productivity in the range of 85 to 90% for the year. This includes an increase in capital spending as we add capacity in several categories and as we incur the cash costs from the restructuring work. We expect to pay around $10 billion in dividends and to repurchase approximately $5 billion of common stock combined, a plan to return roughly $15 billion of cash to shareholders at fiscal ’26. This outlook is based on current market growth rates, commodity prices and foreign exchange rates. Significant additional currency weakness, commodity or other cost increases further geopolitical disruptions, major supply chain disruptions or store closures are not anticipated within the guidance range. We won’t provide guidance for fiscal 27 until our next call in July. However, we understand investor concern about potential cost and supply impacts from the Middle east conflicts. For perspective, the annual cost impact of Brent crude at around $100 per barrel is roughly $1.3 billion before tax or $1 billion after tax versus a pre conflict oil price in the mid-60s. Again, this goes beyond direct commodity cost to include other upstream and downstream cost impacts that would hit our pnl. Regarding supply impacts, we are hopeful the full flow of materials will resume in the coming weeks. We continue to work closely with our suppliers and contract manufacturers to identify potential short term risks. So far our business continuity plans continue to perform well and despite some force majeure declarations by our direct suppliers or by their upstream suppliers, no company will be immune to these effects. But this is an example of where our capabilities help us buffer the impacts on our business. Our business teams have been developing multiple contingency plans to mitigate potential cost and supply disruptions. Underpinning each of these options is a commitment to maintain support for our brands and superior value for our consumers. We remain willing to manage some short term pressure on the bottom line to come out of this period with stronger brands and business momentum on the other side. This has proven to be the right path in the past and we are confident that it is now. In summary, we continue to believe the best path to sustainable balanced growth is to double down on the strategy. Stronger integrated execution to delight consumers with superior products at superior value. Challenging markets like the ones we compete in today are an opportunity for P&G to step out from the pack and to lead. We have the brands, the tools, the capabilities and most importantly the people required to win. We’re confident in the short term progress we’re making. It won’t be a straight line, but we are moving in the right direction. We are building momentum and we are excited about the long term opportunities ahead and with that we are happy to Take your questions.

Steve Powers (Equity Analyst)

Thank you very much. Good morning everybody. Andre, you covered a lot of ground in your prepared remarks, but I guess as you as you look through the puts and takes and timing nuances in the third quarter, how do you assess underlying progress on organic …

Full story available on Benzinga.com

This post was originally published here

On Friday, Amerant Bancorp (NYSE:AMTB) discussed first-quarter financial results during its earnings call. The full transcript is provided below.

Benzinga APIs provide real-time access to earnings call transcripts and financial data. Visit https://www.benzinga.com/apis/ to learn more.

The full earnings call is available at https://event.choruscall.com/mediaframe/webcast.html?webcastid=0cascMmg

Summary

Amerant Bancorp focused on credit quality, improving loan portfolio, and cost-saving initiatives, achieving approximately $30 million in cost savings for 2026.

The company reported a Q1 net income in line with guidance and strong international deposit growth, particularly from Venezuela, contributing $188 million in total deposit growth.

Amerant Bancorp’s strategic initiatives include optimizing risk management, exiting non-core loans, and emphasizing sustainable growth with disciplined expense management.

The company’s net interest margin faced pressure due to lower loan yields and a shift in asset mix, with expectations to stabilize around 3.4% by year-end.

Management highlighted enhancements in credit evaluation processes and proactive portfolio management, aiming for long-term sustainable financial results.

Full Transcript

OPERATOR

Greetings and welcome to the Amerant Bancorp First Quarter 2026 Earnings Conference Call and webcast. At this time, all participants are in listen only mode. A question and answer session will follow the formal presentation. You may be placed into question queue at any time by pressing Star1 on your telephone keypad. As a reminder, this conference is being recorded. If anyone should require operator assistance, please press Star zero. It’s now my pleasure to turn the call over to Laura Rossi, Executive Vice President, Head of Investor Relations. Laura, please go ahead.

Laura Rossi (Executive Vice President, Head of Investor Relations)

Thank you operators. Good morning everyone and thank you for joining us to review Amerant Bancorp’s first quarter 2026 results. On today’s call are Carlos Yafigliola, our interim CEO, and Cherima Calderon, our CFO. Additionally, we’re pleased to welcome as a guest speaker this quarter Leanne Craig, Chief Credit Officer who will share further insight into our credit risk management initiatives as we begin. Please note that discussions on today’s call contain forward looking statements within the meaning of the securities Exchange Act. In addition, references will also be made to non GAAP financial measures. Please refer to the Company’s earnings release for a statement regarding forward looking statements as well as for information and reconciliation of non GAAP financial measures to GAAP measures. I will now turn it over to our interim CEO, Carlos Yafigliola.

Carlos Yafigliola (Interim CEO)

Thank you Laura Good morning everyone and thank you for joining us today to discuss Amerant Bancorp first quarter 2026 results. As we begin, I want to acknowledge where we are in the execution of our strategic plan. I’m proud of the continued progress we have made on the three priorities we outlined last stabilizing the business, optimizing our credit portfolio, and growing sustainably. I also want to thank the Ameren team for the hard work and dedication throughout the quarter. Our people are the key enablers of this plan and that continues to guide our execution. So let’s begin with our primary focus, which has been credit quality and improving our loan portfolio. As a reminder, in Q4 last year we completed a comprehensive reassessment of our portfolio in terms of risk identification and classification and subsequently exited a segment of loans from classified categories. This process continued into the first quarter where we demonstrated proactive credit management and further refined declassifications of certain loans based on current macroeconomic data and new information received. We identified both necessary downgrades as well as merited upgrades. Additionally, we exited and transferred to held-for-sale another group of loans that we no longer consider core to our business. The new process and people we have put in place have significantly improved our credit evaluation capabilities and the team is executing well. The composition of our loan portfolio now reflects a healthier mix with a risk profile that is more consistent with our long term goals. Leanne will share additional details shortly going forward as we prioritize business development and we will pursue growth within credit parameters that allow for sustainable financial results. To this end, we have enhanced risk based limits to adjust concentration risk and prevent single borrower overexposure. We have also refined our market approach by moving away from out of market collateral projects except selectively for existing clients in core markets where we have deeper borrower insight. We have also fundamentally shifted underwriting, prioritizing borrowers with proven stable operating history over projection based lending and tightening our policy exception framework by lowering allowable exception thresholds to better align with our risk appetite. Lastly, we have continued to invest in experienced, talented and we’re taking a more intentional approach to growth focusing on what we believe are the right fundamentals to drive stability, consistency and sustainable top line performance. Our top priority is continuing to improve our efficiency which the team executed well against. This quarter Our net income for Q1 was in line with our guidance and we have significantly reduced non interest expenses quarter over quarter supported by better than expected cost savings. To put this in perspective, our expense management efforts represents approximately 30 million in cost savings for 2026. Additionally, we saw strong growth in favorable low cost international deposits as a result of the reactivation of the Venezuelan economy and our deep knowledge and experience in the market as well as the extensive work that for many years we have done to preserve and expand our relationships in the country. In line with this, I would like to take a moment to provide some additional context on our international deposit growth. Last quarter we highlighted Venezuela as an area of opportunity and this quarter we delivered recording $188 million of total deposit growth in Q1 from which 95 million came from Venezuela and 66 million of this growth was in March alone. These deposits are quite attractive due to their stability, overall cost of funds and beta in rates up cycle such as the one we recently experienced, allowing for improved profitability as we continue to grow our international presence. Furthermore, these customers are well aligned with our relationship first approach as they can be cross sold via our wealth management offering. Moving forward, Venezuela represents a key opportunity to continue generating net interest income from a source of funds and to capture increased market share. We believe Amerent is uniquely positioned to take advantage of this opportunity and support both individual entities as the country reopens. In summary, we believe we executed well against our strategic plan, we took a focused, deliberate action to further optimize our credit portfolio while reinforcing risk management. We implemented cost savings initiatives that have reduced our expenses and improved our efficiency. We generated long growth that is aligned with our risk appetite despite exits of certain criticized loans and significant loan repayments, which provides a clear line of sight to sustained credit performance. And we executed well on our international strategy, particularly in Venezuela, which we view as a meaningful opportunity to further scale our international deposit franchise and drive incremental earnings. With that, I will turn it over to Sherry to review our quarterly financial results in more detail.

Charima Calderon (CFO)

Thank you, Carlos and good morning everyone. I want to begin by saying that going forward we will be discussing results without breaking down core versus non core metrics in our financials. We would like to be more selective with adjustments with the goal of providing a clearer and more straightforward view of our quarterly performance. All comparisons made to last quarter’s results are to our GAAP reported figures. Let’s turn to slide 4 where you will see our balance sheet highlights. Note that in the next three slides I will focus on those items that are most relevant to the quarter and will not be covered in subsequent slides. Total assets were $9.9 billion as of the end of the first quarter, an increase from $9.8 billion as of the end of the fourth quarter. The increase was primarily driven by higher deposit balances. Additionally, we reallocated our assets to fund net loan growth, including selected residential loan purchases, and deployed available cash into higher yielding assets. Cash and cash equivalents were 188.7 million, down by 281.5 million, compared to 470.2 million in the fourth quarter due to the purchases of investment securities at attractive yields as well as to fund loan growth. Total Investment securities were $2.4 billion, up by $346.3 million compared to $2.1 billion in the previous quarter. Total gross loans were $6.8 billion, up by $56.5 million compared to $6.7 billion in the fourth quarter. While we experienced increases in certain portfolios, overall loan balances were only slightly higher than in the fourth quarter due to a high level of prepayments and some loans that we exited in line with our focus on credit quality. This was anticipated and guided to in our call last quarter. On the deposit side, total deposits were $7.9 billion, up by 152.2 million compared to 7.8 billion in the fourth quarter, primarily driven, as Carlos mentioned, by strong growth and international deposits. Our assets under management increased $148.6 million to $3.4 billion driven by higher market valuations. As we’ve shared previously, we continue to see this business as an area of opportunity for us to grow fee income going forward. Increasingly, in light of the opportunity in Venezuela, let’s turn to slide 5 looking at the income statement, Diluted income per share for the first quarter was $0.44 compared to $0.07 in the fourth quarter. Net interest income was 80.3 million, down 9.9 million from 90.2 million in the fourth quarter. This was primarily driven by lower average balances and yields on interest earning assets, largely attributable to the anticipated cuts of 50 basis points in market rates impacting the portfolio for the entire quarter. The decrease in net interest income was also driven by the asset mix reallocation that translated into a contraction of our financial margin to 3.55% from 3.78% in the fourth quarter. Provision for credit losses was $7.8 million compared to $3.5 million in the fourth quarter. Non interest income was $17.4 million, down $4.6 million from $22 million, primarily driven by the absence of the gain that we had in the fourth quarter from the sale and leaseback of two banking centers as well as lower securities gains this quarter compared to the fourth quarter. Non interest income this quarter includes securities gains of $516,000. Non interest expense was $66.9 million down by $39.9 million or 37.3% from $106.8 million in the fourth quarter. The significant reduction in …

Full story available on Benzinga.com

This post was originally published here
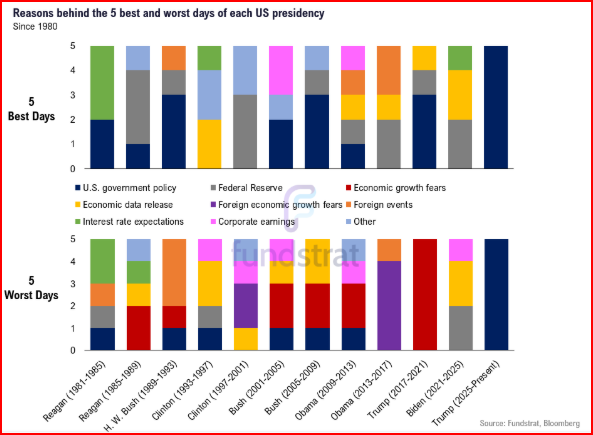
On Friday, Ameris (NYSE:ABCB) discussed first-quarter financial results during its earnings call. The full transcript is provided below.

This transcript is brought to you by Benzinga APIs. For real-time access to our entire catalog, please visit https://www.benzinga.com/apis/ for a consultation.

The full earnings call is available at https://event.choruscall.com/mediaframe/webcast.html?webcastid=wlhfkm1n

Summary

Ameris reported a strong financial performance with a return on assets (ROA) of 1.62% and a return on tangible common equity of nearly 15%.

The company achieved a 10% increase in quarterly revenue compared to the first quarter of 2025, while expenses only rose by 4%, maintaining an efficiency ratio just under 50%.

Ameris repurchased 1.4% of its shares during the quarter, demonstrating active capital management.

Loan production saw a significant increase with a 45% rise over the previous year, while deposits grew by 5% annualized.

The company anticipates mid-single-digit loan and deposit growth for the rest of the year, with some expected slight margin compression.

Non-interest income increased due to better mortgage fees and equipment finance fees, while non-interest expenses rose due to higher compensation costs.

Management expressed confidence in their competitive positioning and focus on growing core deposits and organic growth.

Full Transcript

OPERATOR

Good day and welcome to the Ameris Bancorp first quarter conference call. All participants will be in a listen only mode. Should you need assistance, please signal a conference specialist by pressing the star key followed by zero. After today’s presentation, there will be an opportunity to ask questions. To ask a question, you may press star then one on the touchtone phone. To withdraw your question, please press Star then two. Please note this event is being recorded. I would now like to turn the conference over to Nicole Stokes, Chief Financial Officer. Please go ahead.

Nicole Stokes (Chief Financial Officer)

Thank you. And thank you to all who have joined our call today. During the call we will be referencing the press release and the financial highlights that are available on the investor Relations section of our website at amerisbank.com I’m joined today by Palmer Proctor, our CEO, and Doug Strange, our Chief Credit Officer. Palmer will begin with some opening comments and then I will discuss the details of our financial results before we open up for Q and A. But before we begin, I’ll remind you that our comments may include forward looking statements. These statements are subject to risks and uncertainties. The actual results could vary materially. We list some of the factors that might cause results to differ in our press release and in our SEC filings which are available on our website. We do not assume any obligation to update any forward looking statements as a result of new information, early developments or otherwise, except as required by law. Also during the call we will discuss certain non GAAP financial measures in reference to our performance. You can see our reconciliation of these measures and GAAP financial measures in the appendix to our presentation. And with that, I’ll turn it over to Palmer for his comments.

Palmer Proctor (Chief Executive Officer)

Thank you, Nicole. Good morning everyone. We appreciate you taking the time to join our first quarter call. I’m proud of our performance to start the year primarily due to three factors. First, we operated at a high level of core profitability with an ROA above 160ppnr, ROA at 2.30, and a return on tangible common equity of almost 15%. Second, we experienced good growth in loans, deposits earning assets and revenue. And third, we actively managed our capital by repurchasing 1.4% of the company in the quarter at about a 7.5% discount to yesterday’s closing price. In addition to those 3 positives, I want to revisit something I said on our first quarter call last year. I said we were focused on enhancing revenue generation and positive operating leverage, and once again we executed on our plan. Compared to the first quarter of 2022, our quarterly revenue is up 10% with expenses up only 4%. That’s about a 21% growth efficiency on our growth due to our focus on efficient, organic profitable growth. More specifically, on an annualized basis, we grew loans and deposits by 5 to 6% along with earning assets at nearly 10%. Revenue increased 9.5% driven by an uptick in fee income which represented a strong 22% of total revenue for the quarter. Our continued focus on expense discipline across the company results in an efficiency ratio of just under 50%. Despite some seasonal revenue and expense headwinds in the first quarter, our net interest margin expanded 3 basis points to 388 in the quarter and remains well above peer level. Loan production was 2.2 billion in the first quarter of a 45% increase over first quarter last year. Our loan pipeline remained robust at 2.8 billion. On the deposit front, we continue to focus on core granular deposits and relationship banking with total deposits up 5% annualized in the quarter. Our non interest bearing deposits grew 323 million in the quarter, recapturing some of the seasonal decline of last quarter. Our non interest bearing deposits returned to 30% of total deposits and we have minimal reliance on brokered funds. We increased our capital return in the quarter by repurchasing 75 million or 1.4% of shares outstanding, which is the highest level of buybacks we have had in any one quarter. Capital levels remain robust with CET1 finishing at roughly 13% and our TCE ratio slightly above 11%. These capital levels position us well for any type of environment. Credit quality was stable, our 1.62% reserve was unchanged and both net charge offs and nonperforming assets excluding government guaranteed mortgages improved modestly in the quarter. CRE and construction concentrations were relatively stable at 265 and 46% respectively. Overall, we remain well positioned for future growth and this growth should be positively impacted by the continued disruption in our southeastern footprint. I’ll stop there and turn it over to Nicole to discuss our financial results in more detail.

Nicole Stokes (Chief Financial Officer)

Great. Thank you Palmer. So we reported net income of 110.5 million or $1.63 per diluted share in the first quarter. Our return on assets was 1.62%, our PPNR ROA was 2.3% and our return on tangible common equity was 14.75%. For the quarter our tangible book value increased to 44.79 and that’s about 12.5% than a year ago. As Palmer said, capital levels remain robust and we were notably active in our share buybacks during the quarter, repurchasing 74.9 million of common stock or 950,400 shares at an average price of $78.76. Combined with our full year 2025 share buybacks, we’ve repurchased just over 3% of the company over the last five quarters. Our remaining share repurchase authorization was 84.3 million. At the end of the first quarter, our net interest margin expanded 3 basis points to a strong 388. The expansion came from 6 basis point positive impact on the funding side, more than offset the three basis point decline from the lower asset yields. Our margin level is well above peer and is at 100% core without any purchase accounting accretion from M and A. Our asset liability sensitive is effectively neutral and has really served us well through this macroeconomic environment. That said, we do anticipate we could have some slight margin compression over the next few quarters and that’s really due to pressure on the deposit costs as we fund our balance sheet growth. We believe the margin could decline a few basis points per quarter, probably 5 to 10 total basis points lower over the next few quarters but but we will continue to focus on growth in net interest income both through earning asset growth and margin management. Non interest income increased 8.1 million this quarter, mostly from better mortgage fees as well as an increase in our equipment finance fees. Total non interest expense increased about 14 million in the quarter, partially driven by seasonally higher compensation costs, specifically higher payroll taxes, 401 matching expenses and incentive accruals. Comparing cyclical first quarters, our efficiency ratio this year was 49.97, an improvement from 52.83 first quarter of last year. This improvement was driven by the positive operating leverage as year over year quarterly revenue growth was 28.5 million and our expense growth was only 6 million for that same period. Going forward, I anticipate the efficiency ratio to be slightly above 50% for the rest of the year. During the quarter we recorded $16.6 million of provision expense. Annualized net charge offs this quarter decreased to 21 basis points. We continue to anticipate net charge offs in the 20 to 25 basis point range. For 2026, our reserve remains strong at 1.62% of loans, the same as last quarter and overall asset quality trends remain strong with nonperforming assets excluding government guaranteed mortgages and net charge offs down in the quarter and both classifies and criticize remain well below peer. Looking at our balance sheet, we ended the quarter at 28.1 billion of total assets compared to $27.5 billion at year end. Earning assets grew 607.8 million or 9.7% annualized. As we grew, both the loan book and the bond portfolio loans grew 314.5 million or about 5.9% annualized. And as Palmer mentioned, our loan production and our pipelines rem strong. The real big win for the quarter was our core deposit growth. Deposits grew 261 million or 4.7% annualized. And that was really strong growth in both our consumer and commercial customers of 547 million. As expected, we had the seasonal outflows of about 430 million of public funds and our non interest bearing to total deposit ratio improved back up to 29.8% from 28.7 at year end. We project our loan and deposit growth to be in the mid single digit range for the rest of the year. And as I previously mentioned, we expect longer term deposit growth will be the governor on loan growth. With that, I’m going to wrap it up and turn the call back over to Bailey for any questions from the group.

OPERATOR

We will now begin the question and answer session. To ask a question, you may press star then one on your touchtone phone. If you are using a speakerphone, please pick up your handset before pressing the keys. If at any time your question has been addressed and you would like to withdraw the question, please press star then two. At this time we will pause momentarily to assemble our roster. Our first question comes from Will Jones with kbw. Please go ahead.

Will Jones (Equity Analyst)

Yeah. Hey, thanks. Good morning guys. Good morning. Good morning, Will. Hey. So Nicole, I just wanted to start just with the margin. You know, you guys have just perpetually continued to outperform your guidance and kind of outperform your expectations there. Although you know, the forward outlook, the messaging has really been the same that you kind of see, you know, a couple basis point headwind just as, it becomes more competitive to fund some of your growth. Although it feels like that messaging hasn’t particularly changed much either. So maybe just a backward looking question. What has kind of differed from your expectations with that dynamic and maybe more forward looking, where are you seeing new loan yields today? Coming on just relative to new deposits?

Nicole Stokes (Chief Financial Officer)

Yep, great question. So I’ll start with kind of the look back and you know, we’ve said all of our guidance when we talk about our Asset Liability Management (ALM) modeling and where our margin guidance is going, we’ve said all along that that had to do with some of our guidance we added was deposit pressure and also the funding and the mix of the deposits as we fund the growth. So where is the growth coming from? So certainly in the first quarter something that really helped the margin was the deposit growth, you know, of the non interest bearing. So $323 million of non interest bearing growth …

Full story available on Benzinga.com

This post was originally published here

Apogee Enterprises (NASDAQ:APOG) reported fourth-quarter financial results on Friday. The transcript from the company’s fourth-quarter earnings call has been provided below.

This transcript is brought to you by Benzinga APIs. For real-time access to our entire catalog, please visit https://www.benzinga.com/apis/ for a consultation.

Access the full call at https://edge.media-server.com/mmc/p/nep9ptwn/

Summary

Apogee Enterprises reported better-than-expected fourth-quarter results, with a 1.6% increase in net sales to $351.4 million, driven by favorable pricing in the metals segment.

The company successfully integrated UW Solutions into its Performance Services segment, achieving first-year financial targets of $100 million in revenue and an adjusted EBITDA margin of at least 20%.

Strategic initiatives include leveraging the Apogee management system to drive manufacturing improvements, actively managing the cost structure, and enhancing strategic pillars to position the company for growth.

Future guidance for fiscal 2027 anticipates net sales between $1.38 billion to $1.43 billion and adjusted diluted EPS of $2.70 to $3.25, reflecting a challenging macroeconomic environment.

Management highlighted the impact of aluminum cost increases and tariffs, with efforts to offset these through pricing actions and strategic cost management.

Full Transcript

OPERATOR

Good day and thank you for standing by. Welcome to Apogee Enterprises’ fourth quarter earnings Conference call. At this time, all participants are in a listen only mode. After the speaker’s presentation, there will be a question and answer session. To ask a question during the session, you press star 11 on your telephone. You will then hear an automated message advising your hand is raised to withdraw your question. Please press star 11 again. As a reminder, this conference is being recorded for replay purposes. I will now turn the conference over to Jeremy Stephan, Vice President, Investor Relations and Communications to begin. Jeremy, please go ahead.

Jeremy Stephan (Vice President, Investor Relations and Communications)

Thank you. Good morning and welcome to Apogee Enterprises fiscal 2026 fourth quarter earnings call. On call today are Don Nolan, Apogee’s Chief Executive Officer, and Mark Abdall, our Chief Financial Officer. During this call, the team will reference certain non-GAAP financial measures. Definitions of these measures and a reconciliation to the nearest GAAP measures are provided in the Earnings Release and Slide deck which are available in the Investor Relations section of our website. As a reminder, today’s call will contain forward looking statements. These reflect management’s expectations based on currently available information. Actual results may differ materially from those expressed today. More information about factors that could affect Apogee’s business and financial results can be found in our press release and in the company’s SEC filings. With that, I’ll turn the call over to Don.

Don Nolan (Chief Executive Officer)

Thanks Jeremy and good morning everyone. We’re glad you could join us for our fourth quarter earnings call. As I spent more time with the business over the past several months engaging with our teams, visiting our operations and working closely with our leadership group, I’ve gained a deeper appreciation for both the strengths of our portfolio and the discipline embedded in how we operate. While the market environment continues to evolve, we are focused on executing what is within our control, managing through near term pressures, and continuing to build a strong foundation for long term sustainable performance. I’m confident in the organization we have in place and the enhanced strategic direction we are taking as we move forward. With that said, I’m pleased to share that our results for the quarter were ahead of our expectations on both the top and bottom line, despite what continued to be a dynamic and challenging environment. I’d like to thank our team of dedicated and resilient employees for their focus on delivering exceptional products and services to all of our valuable customers. Fiscal 2026 was a year of disciplined execution for Apogee and as we navigated a difficult environment while continuing to strengthen our operating foundation, our teams delivered meaningful gains in safety, service and productivity and generated solid cash flow. I’d like to emphasize three areas that position us particularly well for the future. First, Performance Services successfully integrated UW Solutions into the segment. They delivered upon the first year financial targets for the acquisition of $100 million in revenue and adjusted EBITDA margin of at least 20%. The total segment delivered revenue of almost $200 million and an accretive margin for the company and we’re excited for the future given the expanded market, greater geographical reach along with the added substrate capability and coating technology. Second, the Apogee management system continues to drive meaningful improvements across our manufacturing footprint utilizing technology with embedded AI. Last fiscal year our Architectural Metals segment made significant progress improving outcomes for our Tube Light brand, completing a value stream redesign which resulted in improved service levels and lead times. We also reconfigured our linetech finishing facility in Wausau, Wisconsin, creating a tighter, more connected footprint that streamlined anodizing paint and packaging operations. This drove significant reductions in material movement, ultimately creating a leaner and safer environment. AMS has truly become a cornerstone of Apogee’s operating success, creating a safer work environment for our teams, delivering better quality service and reliability for our customers, and building a culture of continuous improvement that will drive even stronger outcomes in the years ahead. And third, we actively managed our cost structure and manufacturing footprint to mitigate portions of direct and indirect tariffs while driving efficiencies across the organization. These decisions were difficult and we certainly don’t take them lightly, but we are confident that the actions further position Apogee to successfully navigate the market headwinds we see today and expect in the near future. What we delivered in fiscal 2026 reflects more than just execution. It reflects the strength of a strategy that has guided Apogee through change and positioned us to lead. The strategy we put in place in 2021 continues to serve us well with a clear focus on becoming the economic leader in our target markets, actively managing our portfolio and strengthening our core capabilities and platforms. That focus has driven meaningful improvement across the business, including a more competitive cost structure through facility consolidation and organizational alignment, tighter supply chain integration and greater leverage of enterprise back office functions. At the same time, the Apogee management system delivered substantial gains in productivity and safety. We elevated pricing discipline and sharpened our portfolio, resulting in higher margins and increased profit dollars over the past five years. Moving forward, we are enhancing these strategic pillars to position Apogee as a more growth oriented, customer obsessed organization. Pillar number one is focused on accelerating leadership in target markets by differentiating through deep customer focus and insight, shaping what we offer and how we deliver it to be the economic leader in the markets we serve. The second pillar involves growing and strengthening the portfolio through organic and inorganic advancements and differentiated solutions that address evolving customer challenges and deliver lasting value. And the third pillar is all about advancing core capabilities by driving a culture of continuous improvement through operational excellence, talent development and technology that truly elevates a customer experience. Building on the progress we’ve made, we continue to identify areas for growth in non residential construction markets. We see opportunities to further …

Full story available on Benzinga.com

This post was originally published here

SouthState (NASDAQ:SSB) held its first-quarter earnings conference call on Friday. Below is the complete transcript from the call.

This transcript is brought to you by Benzinga APIs. For real-time access to our entire catalog, please visit https://www.benzinga.com/apis/ for a consultation.

The full earnings call is available at https://events.q4inc.com/attendee/361570488

Summary

SouthState reported a return on assets of 1.37% and a return on tangible common equity of 17.6% for Q1 2026.

The company is focusing on expanding its commercial banking sales force, achieving organic growth, systematic share repurchases, and leveraging artificial intelligence.

Loan pipelines have increased by 50% since last summer, leading to solid annualized loan growth, with a significant boost in Texas and Colorado.

SouthState repurchased nearly 4% of its shares since Q3 2025 at an average price of $95.28, viewing this as an attractive use of excess capital.

Net interest margin guidance was slightly missed due to higher-than-expected deposit costs, but the company remains optimistic about continued loan growth with strong loan pipelines.

Non-interest income reached $100 million, slightly above expectations, with strong performance in capital markets and wealth.

The company is embracing AI to improve efficiency and customer service, with plans to integrate AI tools at various levels.

SouthState maintains strong credit quality with non-performing assets stable and a focus on long-term growth through strategic hiring, particularly in the Texas and Colorado markets.

Overall capital levels remain healthy, with a payout ratio higher than long-term expectations due to strategic share repurchases.

Full Transcript

Audra (Conference Operator)

Good morning, My name is Audra and I will be your conference operator today. At this time I would like to welcome everyone to the SouthState Bank Corporation first quarter 2026 earnings conference call. Today’s conference is being recorded. All lines have been placed on mute to prevent any background noise. After the speaker’s remarks, there will be a question and answer session. If you would like to ask a question during this time, simply press the star key followed by the number one on your telephone keypad. If you would like to withdraw your question, press star one again. At this time I would like to turn the conference over to William Matthews, Chief Financial Officer. Please go ahead.

William Matthews (Chief Financial Officer)

Good Morning. Welcome to SouthState’s first quarter 2026 earnings call. This is Will Matthews and I’m here with John Corbett, Steve Young and Jeremy Lucas. We’ll follow our pattern of brief remarks followed by Q&A. I’ll refer you to the earnings release and investor presentation under the Investor Relations tab of our website. Before we begin our remarks, I want to remind you that comments we make may include forward looking statements within the meaning of the federal securities laws and regulations. Any such forward looking statements we may make are subject to the Safe Harbor rules. Please review the forward looking disclaimer and safe harbor language in the press release and presentation for more information about our forward looking statements and risks and uncertainties which may affect us now. I’ll turn the call over to you. John.

John Corbett (Chief Executive Officer)

Thank you Will. Good morning everybody. Thanks for joining us. For the quarter, SouthState delivered a return on assets of 1.37% and a return on tangible common equity of 17.6%. As we progress through 2026, our four main priorities are first, to expand our commercial banking sales force, second, to deliver meaningful organic growth, third, to systematically retire shares at an attractive valuation, and fourth, to learn how to leverage the benefits of artificial intelligence implement it throughout the company. We’re making good progress on all four fronts as far as recruiting. We’re now in a yield curve environment that is more favorable to balance sheet growth, and with the consolidation disruption occurring throughout our markets, we see an opportunity to expand our commercial banking team by 10 to 15% in the next couple years. In the last six months alone, our division presidents were successful in attracting and growing our commercial banking team by about 7%. We’re going to continue to be opportunistic, but based upon the rapid success, we may slow the pace of hiring in the next few months. Second, for organic loan growth, loan pipelines have grown 50% since last summer and that’s resulted in solid annualized loan growth of 8% in the fourth quarter and then another 7.5% loan growth in the first quarter. Pipelines grew significantly again in the first quarter, which gives us confidence moving forward. Our previous loan growth guidance for 2026 called for mid to upper single digit growth this year. There’s a decent chance that we could end up on the higher end of our guidance. The biggest highlight by far has been the success in Texas and Colorado on a year over year comparison. Loan production in those two states have more than doubled from 500 million in 1Q25 to 1.1 billion in 1Q26. And Houston, specifically experienced the highest loan growth of any market in the entire company this quarter. Third on stock buybacks, we’ve repurchased nearly 4% of our shares outstanding since the beginning of the third quarter at an average price of $95.28. We continue to see this as an attractive use of excess capital at a time when bank valuations seem, at least to us, disconnected from fundamental performance and intrinsic value. And then fourth, we’re enthusiastically embracing the potential for artificial intelligence. We’re deploying more and more copilot licenses and training our bankers at the individual user level. We’re researching and beginning to deploy AI tools from our major software providers at the department level, and we’re looking for ways to re engineer processes between departments at the enterprise level. More to come, but we’re pleased with the way the entire organization is embracing these new tools with the goal of improving our speed and scalability. Speed for improved customer service and then scalability for efficiency and shareholder returns. Before I turn it over to Will, I’ll point out that we’ve refreshed some of the slides in our deck to highlight the value proposition of being a SouthState shareholder. Our story hasn’t changed and it isn’t complicated. We’re building a premier deposit franchise and we’re doing it in the fastest growing markets in the United States. We adhere to a geographic and local market leadership business model. It’s a model that empowers our division presidents to tailor their team products and pricing to deliver remarkable service to their unique local community and at the same time, an incentive system built on geographic profitability that instills a CEO and shareholder mindset. This is a model that produces durable results that have outperformed our peers on deposit cost, asset quality and overall returns. And the outperformance is consistent and durable over the last year, over the last five years and over the last 20 years. Ultimately leading to a top quartile shareholder return over multiple cycles. Will, I’ll turn it back over to you to walk through the details on the quarter.

William Matthews (Chief Financial Officer)

Thanks John. Our net interest margin of 379 was just below our guidance of 380 to 390. The slight miss was primarily a result of deposit costs being a few basis points above our expectation. In spite of the 6 basis point improvement from the prior quarter, loan yields of 596 were slightly below our new loan production coupons of 609 for the quarter. An accretion of 38.8 million was in line with expectations and $11.5 million below Q4 levels. Excluding accretion, our net interest margin (NIM) was up a basis point. Net interest income of 562 million was down 19 million from Q4 with the day count impact being 12.6 million of that difference. As John noted, we had another good loan growth quarter with loans growing 896 million 7.5% annualized growth rate. Average loans grew at a 6.5% annualized rate. Our Texas and Colorado team led the company in loan growth and every banking group within the company grew loans in the first quarter. We have some optimism about continuing loan growth as our pipeline at quarter end was up 33% compared with year end. Non interest income of 100 million was at the high end of our range of 55 to 60 basis points guidance. We had a solid quarter in capital markets and wealth with seasonally lighter deposit fees offset by stronger mortgage revenue which was aided by an increase in the MSR asset value net of the hedge. NIE of 359.5 million was in line with expectations. Looking ahead, we have no changes to our NIE guidance for the remainder of the year, but if we have greater success in our recruiting efforts and we’ve been pleased with our success thus far, NIE could of course move up somewhat. Net charge offs of $10 million represented a 9 basis point annualized rate for the quarter and this amount was matched by our provision for credit losses. Non accrual and substandard loans were down slightly. Payment performance remains very good and we continue to feel good about our credit quality. Turning to capital, we repurchased one and a half million shares in the quarter at a weighted average price of $100.84. This makes a total of three and a half million shares repurchased in the last two quarters and our share count was 97.9 million shares at quarter end, down from 101.5 million shares a year prior. Like last year’s fourth quarter, the first quarter payout ratio was higher than we expect to maintain over the long term, but we thought it an opportune time to be more active. Our strong loan pipeline and recruiting success give us some optimism. We’ll need to retain capital to support healthy growth. Even with a higher capital return posture and a 7.5% annualized loan, growth in the quarter capital levels remained very healthy. CET1 ended at 11.3%, our TCE was 8.64% and our tangible book value per share ended at $56.90. I’ll point out that our TBV per share is up almost $7 or 14% above the year ago levels and our TCE ratio is up 39 basis points from March 2025, even with our higher capital return activity of the last couple of quarters. Operator, we’ll now take questions.

Audra (Conference Operator)

Thank you. We will now begin the question and answer session. If you have dialed in and would like to ask a question, please press Star one on your telephone keypad to raise your hand and join the queue. If you would like to withdraw your question, simply press Star one again. We’ll go first to Kathryn Mueller at kbw. Thanks. Good morning.

Kathryn Mueller (Equity Analyst)

Hey Kathryn, I wanted to see if we could start on the margin. Will you talked about how the margin fell a little bit below the range just on deposit costs. Curious if you still think that 380 to 390 range is fair for the year or if deposit pressures are bringing that a little bit lower than the range. Thanks.

Steve Young

Sure. Thanks. Kathryn,, this is Steve. Let me kind of, walk through our various assumptions and kind of, update them versus last quarter. So to your point, yes, we were, you know we thought that the margin would start out in the low 380s for the first quarter and trend higher during the year. It looks like we missed that by a couple of basis points to start the year. If you look at, you know the four things that really make up that guidance in our forecast or the level of interest earning assets, the rate forecast, what our loan accretion forecast is, and deposit costs. So those four things and if you look at the interest earning assets I think we forecasted for the first quarter we’d be between 60 and 60 and a half. I think we ended up at 60.2. So right, right in the middle of that we said for the year that our interest earning assets would average somewhere in the 61 to 62 billion dollars range. And I think where we are with that, we think that it’s potential. We’re kind of reiterating that, but we do think that the loan growth might drive that slightly higher. A little bit too early to tell, but that, you know it could, it could, interest earning assets could end the year in the 63, 64 million dollar range, billion dollar range relative to the fourth quarter. But the average is probably going to be more on the high end of what we were thinking as it relates to rate forecast. Last quarter we thought that there would be three rate cuts coming into 2026 and it looks like right now the market’s at zero relative to the conflict and so on. I think the two year and the five year treasury rates are up 40 basis points from the lows earlier this quarter. So we’ve now taken out the rate cuts in our forecast on loan accretion, which is our third one is we forecasted 125 million for the full year of 26 and there’s really no change. So that’s coming in line with what we’d expected. And then the last one was on deposit costs and our original deposit beta forecast was 27%. And then, you know, it looks like we came in around 20% for the quarter. So you know, if you kind of go back and look at the movie, I think for the first hundred basis points of cuts we got 24 had a 38% beta and then the last 75 basis points we had a 20% beta. So you combine it all together, we’ve had a 30% beta on 175 basis points. But as we look forward and think about the deposit environment that we’re at, in the flat environment with our growth trajectory, we think that the deposit cost will be in the mid-170s versus our early forecast to be in the low mid-170s. So based on all these assumptions, we’d expect NIM to be in the 375 to 380 range. If the mid, if growth is in the mid single digit, we would expect them to be on the high end of the range. And if growth is as we expect, a little bit …

Full story available on Benzinga.com

This post was originally published here
(Editor’s note: The futures and ETFs data and headline were updated.)

U.S. stock futures were mixed on Friday following Thursday’s decline, after President Donald Trump announced the extension of the ceasefire between Israel and Lebanon by three weeks.

Meanwhile, peace talks between Iran and the United States could resume soon in Pakistan, with Iranian Foreign ​Minister Abbas Araqchi expected to arrive on Friday night, Reuters reported, citing three Pakistani sources.

On Thursday, the Dow Jones index closed 179 points lower as investors gauged the evolving Middle East conflict and a downturn in the software sector.

The 10-year Treasury bond yields stood at 4.316%, and the two-year bond was at 3.831% at the time of writing. The CME Group’s FedWatch tool‘s projections show markets pricing a 99.5% likelihood of the Federal Reserve leaving the current interest rates unchanged in April.

Index Performance (+/-)
Dow Jones -0.07%
S&P 500 0.42%
Nasdaq 100 1.30%
Russell 2000 -0.16%

The SPDR S&P 500 ETF Trust (NYSE:SPY) and Invesco QQQ Trust ETF (NASDAQ:QQQ), which track the S&P 500 index and Nasdaq 100 index, respectively, were higher in pre-market on Friday. The SPY was up 0.36% at $711.01, while the QQQ surged 1.2% to $659.21.

data-variant=”card”
data-news-mode=”manual”

>


Read Also:

Can Trump’s ‘Maritime Golden Age’ Catch Up With China? Navy Secretary Firing In Focus As Shipbuilding Tensions Deepen

This post was originally published here

As of April 24, 2026, two stocks in the utilities sector could be flashing a real warning to investors who value momentum as a key criteria in their trading decisions.

The RSI is a momentum indicator, which compares a stock’s strength on days when prices go up to its strength on days when prices go down. When compared to a stock’s price action, it can give traders a better sense of how a stock may perform in the short term. An asset is typically considered overbought when the RSI is above 70, according to Benzinga Pro.

Here’s the latest list of major overbought players in this sector.

Oklo Inc (NYSE:OKLO)

  • On April 23, Oklo announced an agreement with NVIDIA and Los Alamos National …

Full story available on Benzinga.com

This post was originally published here

On Friday, AtlasClear Holdings, Inc. (NYSE:ATCH) announced it has signed a letter of intent to acquire Ark Financial Services, Inc. and its subsidiary Dawson James Securities, Inc., expanding into investment banking and capital markets origination.

AtlasClear Signs LOI to Acquire Ark Financial, Dawson James

The transaction will be completed in two stages, with an initial 24.9% stake followed by full ownership after FINRA approval. The deal is expected to be accretive in the first year.

AtlasClear said the combined business, including its pending acquisition of Commercial Bancorp of Wyoming, could generate about $45 million in annualized revenue and roughly $5 million in net income, as …

Full story available on Benzinga.com

This post was originally published here

President Donald Trump on Thursday ordered the US Navy to “shoot and kill any boat” laying mines in the Strait of Hormuz, boasting that Iran’s naval ships were “ALL, 159 of them, at the bottom of the sea.”

Traders on prediction market Kalshi are pricing in a 52% chance that US gasoline prices top $5 per gallon at some point in 2026.

Oil Prices Climb As Hormuz Stays Shut

Brent crude popped above $105 after Iran’s Mehr news agency reported on Thursday that air defense systems were activated in parts of Tehran to counter unspecified hostile targets.

Trump added that US minesweepers are clearing the Strait, and ordered them to continue, but “at a tripled up level.”

The Pentagon said it intercepted two oil supertankers attempting to evade its blockade on Iranian ports. Tehran has said it will not return to negotiations while the blockade remains in …

Full story available on Benzinga.com

This post was originally published here

POET Technologies Inc. (NASDAQ:POET) shares jumped in Friday’s premarket session. Traders are leaning into the week’s fast-moving rebound narrative.

The move follows the company pushing back on short-seller claims and a sharp prior pullback.

Risk appetite is also supportive with tech leadership, and the tape is still reacting to profit-taking on Thursday after an earlier surge.

What Is Driving POET Technologies Stock Today?

The latest move follows a volatile stretch in which POET ripped about 75% earlier in the week, then retreated on Thursday as traders took profits after the company’s CFO, Thomas Mika, dismissed a Wolfpack Research report as a “big nothing burger.”

Mika also confirmed a business relationship with Marvell Technology, Inc. (NASDAQ:

Full story available on Benzinga.com

This post was originally published here

First Financial Bancorp (NASDAQ:FFBC) released first-quarter financial results and hosted an earnings call on Friday. Read the complete transcript below.

Benzinga APIs provide real-time access to earnings call transcripts and financial data. Visit https://www.benzinga.com/apis/ to learn more.

Access the full call at https://events.q4inc.com/attendee/208945676

Summary

First Financial Bancorp reported adjusted earnings per share of $0.77, a 22% increase from the previous year, driven by a robust net interest margin and strong fee income.

The company’s strategic moves included completing the acquisition of Bank Financial and the conversion of Westfield Bank, leading to slight increases in loan balances.

Future outlook remains positive with expectations for mid-single digit loan growth, stable net interest margin, and strong fee income in the upcoming quarters.

Operationally, the company maintained a strong capital position with tangible book value per share increasing by 2.6% over the linked quarter.

Management highlighted successful cost management, achieving acquisition-related cost savings and maintaining strong asset quality despite economic uncertainties.

Full Transcript

Kate (Conference Operator)

Thank you for standing by. My name is Kate and I will be your conference operator today. At this time I would like to welcome everyone to the first financial banker first quarter 2026 earnings conference call and webcast. All lights have been placed on mute to prevent any background noise. After the speaker’s remarks, there will be a question and answer session. If you would like to ask a question during this time, simply press STAR followed by the number one on your telephone keypad. If you would like to withdraw your question, press Star one again. Thank you. I would now like to turn the call over to Scott Crowley, Corporate Controller. Please go ahead.

Scott Crowley (Corporate Controller)

Thanks, Kate. Good morning everyone. Thank you for joining us on today’s conference call to discuss First Financial Bancorp’s first quarter financial results. Participating on today’s call will be Archie Brown, President and Chief Executive Officer, Jamie Anderson, Chief Financial Officer and Bill Harrod, Chief Credit Officer. Both the press release we issued yesterday and the accompanying slide presentation are available on our website at www.bankatfirst.com under the Investor Relations section will make reference to the slides contained in the accompanying presentation during today’s call. Additionally, please refer to the forward looking statement disclosure contained in the first quarter 2026 earnings release as well as our SEC filings for a full discussion of the Company’s risk factors. The information we will provide today is accurate as of March 31, 2026 and we will not be updating any forward looking statements to reflect facts or circumstances after this call. I’ll now turn the call over to Archie Brown. Thanks, Scott. Good morning everyone and thank you for joining us on today’s call. Yesterday afternoon we announced our first quarter results and I’m very pleased with our overall performance. The first quarter was a busy one as we closed the Bank Financial Acquisition, completed the conversion of Westfield bank and wrapped up the sale of the Bank Financial Multifamily Loan Portfolio. Adjusted earnings per share were $0.77 with an adjusted return on assets of 1.45% and an adjusted return on tangible common equity of 19.2%. Adjusted earnings per share increased 22% compared to the first quarter of last year, driven by robust net interest margin and strong fee income. Our net interest margin was resilient despite the Fed Funds rate cut in December as the expected decline in loan yields was offset by a similar decline in deposit costs. Assuming no short term rate reductions by the Fed, we expect the margin to remain stable in the near term. Loan balances increased slightly for the quarter due to the Bank Financial acquisition. Excluding the Bank Financial Portfolio loans declined for the quarter as seasonally strong loan production was offset by extended payoff pressure in the ICRE portfolio. Compared to the first quarter of 2025, originations increased approximately 45% and excluding Westfield and bank financial originations were up by over 25%. Our expectation for loan growth for 2026 has not materially changed. Loan pipelines are very healthy and we expect strong production in the second quarter. We also expect payoff activity in ICRE to approach more normal levels leading to solid loan growth in the second quarter. Adjusted fee income was strong for the quarter. Historically, fee income significantly dips early in the year. However, we successfully combated this Trend in the first quarter. Adjusted non interest income was 75.6 million, which was 24% higher than in the first quarter of 2025 and only a slight decline from the linked quarter. These results were driven by record wealth management income, strong client derivative income and record leasing business income. Additionally, expenses were well controlled during the quarter with total non interest expenses coming in well below our expectations and acquisition related cost savings exceeding our initial estimates. Net charge offs were 35 basis points of total loans and were impacted by one large commercial relationship. Other asset quality indicators were stable with non performing assets slightly declining from the linked quarter to 44 basis points. While there is certainly more uncertainty in the economy due to the impact of the war in Iran, our current expectations are for asset quality to gradually improve throughout the year, similar to our performance in 2025. Capital ratios are strong and continue to climb. In the first quarter, all regulatory ratios were well in excess of regulatory minimums and the tangible common equity increased 7.9%. Tangible book value per share was $16.15 which was a 2.6% increase over the linked quarter and a 9% increase compared to the first quarter. 2025 tangible value was at approximately the same level as the third quarter of 2025. Just prior to the Westfield bank acquisition this month, the Board of Directors authorized a $5 million share repurchase plan replacing the plan we had in place through 2025 and we’re evaluating opportunities to employ buybacks as part of our overall capital planning. I’d like to take a minute and discuss our recent acquisitions. During the quarter we successfully completed the conversion of Westfield bank and then for the quarter Westfield deposit and loan balances were stable. We maintained high associate retention and we have achieved the financial results that we expected from the transaction to date. We’re happy with the quality of the bank we acquired and with the talented team that has joined us. We also completed the purchase of Bank Financial on January 1st and plan to convert systems in early June. Remain excited about the opportunities in the Chicago market and continue to see growth potential from this transaction. Now I’ll turn the call over to Jamie to discuss these results in greater detail. And after Jamie, I’ll wrap up with some additional forward looking commentary and closing remarks.

Jamie Anderson (Chief Financial Officer)

Thank you Archie and good morning everyone. Slides 4, 5 and 6 provide a summary of our most recent financial performance. The first quarter results were excellent and included strong earnings record revenues driven by a robust net interest margin and higher than expected fee income. Our net interest margin remains very strong at 3.99%, increasing 1 basis point during the quarter. Cost of funds declined 13 basis points while asset yields declined 12 basis points points. End of period loan balances increased $71 million, which included $228 million acquired in the Bank Financial transaction. This was partially offset by a $152 million decrease in ICRE balances, reflecting the payoff pressure that Archie mentioned earlier. Total average deposit balances increased $1.7 billion, including $1.2 billion acquired in the Bank Financial transaction and the full quarter impact from Westfield. We maintained 20% of our total deposit balances and non interest bearing accounts and remain focused on growing lower cost deposit balances. Turning to the income statement, first quarter fee income overcame seasonal headwinds with strong performance across all income types. Additionally, we had an $8.9 million gain on bargain purchase related to the Bank Financial acquisition. Non interest expenses increased from the linked quarter due primarily to the impact of our most recent acquisitions. Our ACL coverage decreased slightly during the quarter to 1.36% of total loans and we recorded $8.5 million of provision expense during the period, which was driven primarily by net charge offs on asset quality. Net charge offs were 35 basis points on an annualized basis, an increase of 8 basis points from the fourth quarter, while NPAs as a percentage of assets were 44 basis points, declining 4 basis points from the fourth quarter. Classified assets as a percentage of total assets also declined slightly during the period. From a capital standpoint, our ratios are in excess of both internal and regulatory targets. Tangible book value increased $0.41 to $16.15 while our tangible common equity ratio increased to 7.88%. Slide 8 reconciles our GAAP earnings to adjusted earnings, highlighting items that we believe are important to understanding our quarterly performance. Adjusted net income was $80.5 million or $0.77 per share for the quarter. Non interest income was adjusted for $1.3 million of losses on the sales of investment securities, the $8.9 million gain on bargain purchase related to the bank financial acquisition and a $1.4 million loss on the surrender of a bank owned life insurance policy. Non interest expense adjustments exclude the impact of acquisition costs, tax credit, investment write downs and other expenses not expected to recur. As depicted on Slide 9, these adjusted earnings equate to a return on average assets of 1.45%, a return on average tangible common equity of 19% and a pre tax pre provision ROA of 1.99%. Turning to slides 10 and 11, net interest margin increased 1 basis point from the linked quarter to 3.99%. Total deposit costs declined 13 basis points from the linked quarter, offsetting the impact of lower asset yields. Slide 13 illustrates our current loan mix and balance changes. Compared to the linked quarter, loan balances increased $71 million during the period. As you can see on the right, we acquired $228 million of loans in the bank financial transaction. This was offset by a $152 million decrease in ICRE balances absent the acquisition. We loan balances decreased 4.7% on an annualized basis driven by elevated payoffs in ICRE. Slide 15 depicts our NDFI exposure. As you can see, our total NDFI balances are approximately 3% of our total loan book and all NDFI loans were pass rated at the end of the first quarter. The majority of our NDFI lending is concentrated in loans to REITs which we believe further mitigates our risk. Slide 16 shows our deposit mix as well as a progression of average deposits from the linked quarter. In total, average deposit balances increased $1.7 billion, including a $1.2 billion impact from the bank financial transaction as well as a full quarter impact from Westfield. Slide 18 highlights our non interest income. Total adjusted fee income was $76 million with leasing and Wealth Management both posting record results. Foreign exchange delivered strong results and client derivative fees increased during the period as well. Non interest expense for the quarter is outlined on slide 19. Core expenses increased $12.9 million as expected during the period. This was driven primarily by recent acquisitions. Turning now to slides 20 and 21, our ACL model resulted in a total allowance which includes both funded and unfunded reserves of $207 million, which includes $3.1 million of initial allowance on the bank financial portfolio. This resulted in an acl that was 1.36% of total loans which was a 3 basis point decline from the fourth quarter. We recorded $8.5 million of provision expense during the period. Provision expense was primarily driven by net charge offs which were 35 basis points. Additionally, our NPAs to total assets decreased slightly to 44 basis points, while classified asset balances as a percentage of total assets decreased to 1.02%. Finally, as shown on slides 22 and 23, capital ratios remain in excess of regulatory minimums and internal targets. During the first quarter, tangible book value increased to $16.15 while the TCE ratio increased to 7.88% at the end of the period. Our total shareholder return remains strong with 35% of our first quarter earnings returned to our shareholders during the during the period through the common dividend, the Board also approved a 5 million share repurchase program. …

Full story available on Benzinga.com

This post was originally published here

Flagstar Financial (NYSE:FLG) released first-quarter financial results and hosted an earnings call on Friday. Read the complete transcript below.

Benzinga APIs provide real-time access to earnings call transcripts and financial data. Visit https://www.benzinga.com/apis/ to learn more.

View the webcast at https://events.q4inc.com/attendee/310889277

Summary

Flagstar Financial reported strong first-quarter 2026 results, with significant progress in core banking operations, including net interest margin expansion and increased core deposits.

The company highlighted a strategic focus on diversifying its loan portfolio, specifically through CNI loan growth, and reduced its CRE exposure by $1.6 billion.

Management noted continued improvement in credit quality, with a 11% decrease in non-accrual loans and a 3% reduction in criticized and classified loans.

Flagstar Financial achieved a CET1 capital ratio of 13.2%, with plans for potential capital distributions in the second half of the year following sustained profitability.

The company completed the consolidation of six legacy data centers into two, setting the stage for a core conversion in 2027, and received upgrades from Fitch and Moody’s to investment grade.

Future guidance suggests a slight downgrade in interest income expectations due to increased CRE payoffs, but the company remains optimistic about continued CNI growth.

Full Transcript

Regina (Operator)

Hello and thank you for standing by. My name is Regina and I will be your conference operator today. At this time I would like to welcome everyone to Flagstar Financial first quarter 2026 earnings conference call. All lines have been placed on mute to prevent any background noise. After the speaker’s remarks, there will be a question and answer session. If you’d like to ask a question during this time, simply press Star then the number one on your telephone keypad. To withdraw your question, press star one again. I would now like to turn the conference over to Sal DiMartino, Director of Investor Relations, director of investor Relations. Please go ahead.

Sal DiMartino (Director of Investor Relations)

Thank you, Regina and good morning everyone. Welcome to Flagstar Financial’s first quarter 2026 earnings call. This morning our Chairman, President and CEO Joseph Otting along with the company’s Senior Executive Vice President and Chief Financial Officer Lee Smith will discuss our results for the quarter. During the call we will be referring to a presentation which provides additional detail on our quarterly results and operating performance. Both the earnings presentation and the press release can be found on the Investor Relations section of our company website, ir.flagstarfinancial.com Also, before we begin, I’d like to remind everyone that certain comments made today by the management team of Flagstar Financial may include forward looking statements within the meanings of the Private Securities Litigation Reform act of 1995. Such forward looking statements we make are subject to the safe harbor rules. Please review the forward looking disclaimer and safe harbor language in today’s press release and presentation for more information about risks and uncertainties which may affect us. Additionally, when discussing our results, we will reference certain non GAAP measures which exclude certain items from reported results. Please refer to today’s earnings release for reconciliation of these non GAAP measures and with that I would now like to turn the call over to Mr. Otting. Joseph

Joseph Otting (Chairman, President and CEO)

thank you Sal. Good morning everyone and welcome to our first quarter 2026 earnings conference call. We are pleased to report another quarter of solid progress and continued momentum across our core banking franchise. Our first quarter performance reflects continued improving fundamentals, strong C&I growth, a high level in growth of core deposits, further progress in reducing the level of non accrual and criticized classified loans, continued margin expansion and industry leading capital levels. Just as importantly, our first quarter results demonstrate we are exceeding and executing on the strategy we laid out two years ago. In delivering against our priorities, we are doing exactly what we set out to do. Strengthening our earnings profile, improving the quality of our balance sheet and building a top performing regional bank. The progress we are making is intentional and driven by a clear focus on disciplined execution. Now turning to the slides, slide number 3 of the investor presentation, I’d like to highlight some of the key performance factors and drivers during the quarter. First, disciplined expense management has been a hallmark of our return to profitability over the past two years and in the first quarter operating expenses continued to decrease and we expect them to decrease in 2026 and 2027. We also had another quarter of net interest margin expansion driven primarily by lower funding costs. Second, one of our key growth strategy is to diversify our loan portfolio by increasing our CNI lending platform. This quarter marked the third consecutive quarter of CNI loan growth after us reducing our exposure to certain industries, lowering our single transactions exposure exposures and exiting certain relationships that did not meet our return hurdles and we’ve done this throughout 2024 and part of 20. Third, we experience a further reduction in our overall Commercial Real Estate (CRE) exposure mostly through PAR payoffs, resulting in the multifamily and Commercial Real Estate (CRE) portfolios declining by 1.6 billion or 4% relative to the fourth quarter and further improvement in our Commercial Real Estate (CRE) concentration. Fourth, we continue to see positive credit migration as non accrual loans declined by 11% and criticized and classified loans decreased by 3%. Additionally, we ended the quarter with a robust Common Equity Tier 1 (CET1) capital ratio of 13.2%. In terms of future capital distributions, our focus first is on demonstrating several quarters of sustainable profitability and continued improvement in our non accrual loans and flexibility to support our anticipated loan growth. We expect the board taking action on capital distributions in the second half of the year. Finally, I would like to highlight 2 other milestones during the first quarter. We were very pleased with Fitch and Moody, upgraded the bank’s long term and short term deposit ratings to investment grade with a positive outlook and when we filed our 10k in late February we disclosed that the previously material weakness in internal controls have been remediated. Both of these milestones reflect the tremendous effort, dedication and hard work of our entire team. On the next couple of slides we spotlight the significant progress we continue to make in our C&I lending businesses during the quarter. C&I loans grew by 1.4 billion or 9% on a linked quarter basis, significantly higher than in prior quarters. On slide four we go into detail on the trends in our CNI portfolio. While the first quarter is typically a seasonally slow quarter for originations, you can see on the left side of the slide that our originations were essentially flat compared to the fourth quarter. We also will note that the pipeline remains strong and we expect second quarter funding from CNI to be similar to Q1. On the right side is the five quarter trend in the CNI portfolio. After bottoming in the second quarter of last year, we’ve had steady growth in the first quarter. CNI loans grew by the 1.4 billion, up 9% compared to the fourth quarter and year over year 12%. The next slide provides quarter over quarter growth by loan category. While the majority of the growth was driven by our two main strategic focus areas, specialized industries lending and corporate and regional commercial banking, this quarter gross was broad based with gross also occurring in the mortgage finance and asset based lending verticals. Now turning to Slide 6, you can see the trend in our adjusted diluted EPS whereby we have now reported two consecutive quarters of EPS growth By executing on all our strategic initiatives on an adjusted basis, we went from $0.03 in the fourth quarter to $0.04 during Q1. One other positive note I’d like to make is that during the first quarter we completed the consolidation of our six legacy data centers into two colocation centers with no disruptions neither to the organization or any of our customers. And this positions us well in 2027 to have the baseline and platform for our core conversion with Ultimately the goal in 2027 is to get onto one core. So with that I’ll now turn it over to Lee to review our financials and credit quality.

Lee Smith (Senior Executive Vice President and Chief Financial Officer)

Thank you Joseph and good morning everyone. We’re very pleased with another quarter where we continue to execute our strategic vision to make Flagstar one of the best performing regional banks in the country. We were profitable for the second consecutive quarter following the bank’s return to profitability in the fourth quarter. More importantly, we made real progress against key initiatives that drive our financial forecast. We achieved net C&I loan growth during the quarter of 1.4 billion, significantly higher than previous quarters following the origination of 2.6 billion in new CNI loans of which 2 billion was funded. As we’ve discussed, net CNI growth in previous quarters was muted as we right sized legacy CNI positions within the portfolio. Most of this is behind us and you’re now seeing the growth from new originations materialise into net loan growth. Net Interest Margin (NIM) expanded 10 basis points after adjusting for the one time hedge gain of approximately 21 million in Q4. Furthermore, much of the new CNI growth occurred towards the end of Q1, meaning the full benefit of these newly originated loans will be felt in Q2 and beyond. Core deposits excluding brokered grew 1.1 billion and we reduced deposit costs by 21 basis points. We paid off another 1 billion of flub advances and 300 million of brokered deposits as we further reduced our reliance on high cost wholesale funding. Despite this deleveraging of 1.3 billion, our balance sheet only decreased 400 million quarter over quarter. Commercial Real Estate (CRE) and multifamily payoffs were again elevated at 1.6 billion, 1.1 billion of which were par payoffs and 42% of these par payoffs were rated as substandard loans. We resolved the situation with the one borrower that was in bankruptcy and reduced our non accrual loans by 323 million while substandard loans decreased almost 700 million, meaning we reduced non accrual and substandard loans over 1 billion quarter over quarter. Our ACL reserve decreased 78 million, primarily driven by lower Commercial Real Estate (CRE) and multi family loan balances. Operating expenses were again well contained at 441 million, a decrease of 5% quarter over quarter and we ended the quarter with 13.24% Common Equity Tier 1 (CET1) capital at or near the top of our regional bank peers. We were also thrilled to be upgraded by both Moody’s and Fitch, particularly given that both agencies returned our long and short term deposit ratings to investment grade. We continue to execute on our strategic plan exactly as we said we would. Now turning to Slide 7. We reported net income attributable to common stockholders of $0.03 per diluted share. On an adjusted basis, we reported net income attributable to common stockholders of $0.04 per diluted share. First quarter was a relatively clean quarter with only one adjustment, our investment in figure technologies which decreased in value during the first quarter by 9 million based on its closing stock price as of March 31. Subsequent to the end of the quarter we have sold out of approximately 75% of our figure position at a gain of 1.8 million compared to our March 31 mark on Slide 8. We provide our updated forecast for 2026 and 2027. We have adjusted our interest income guidance downward for both years as a result of increased Commercial Real Estate (CRE) and multifamily payoffs, pay downs and amortization. This is both good news and bad news as it accelerates our diversification strategy and reduces our Commercial Real Estate (CRE) exposure but also reduces interest income and Net Interest Margin (NIM) in the short term. Also, we are seeing fewer resetting loans staying on our balance sheet. We’re currently retaining 35 to 40% of resetting loans versus 50% previously. Again, while this accelerates our overall diversification strategy, it reduces short term net interest income and Net Interest Margin (NIM) temporarily and until we replace it with new CNI Commercial Real Estate (CRE) or consumer growth in order to retain some of the higher quality relationship Commercial Real Estate (CRE) runoff in the future. We have assumed spreads off of sofa in the 175 to 225 basis point range versus our contractual option of 275 to 300 basis points off a 5 year flub lower non interest bearing DDA growth in Q1 deposit growth in Q1 was all interest bearing which was positive particularly as we also reduced interest bearing deposit costs. 21 basis points quarter over quarter. We believe the current rate in agency upgrades will help us garner more non interest bearing DDAs going forward, but as it’s been pushed out it impacts net interest income and nimble. We expect total assets to be approximately 94 billion at the end of 26 and 102 billion at the end of 27 as a result of net loan growth. The reduction in interest income has been partially offset by reducing provision and operating expense guidance. Adjusted EPS is now forecast to be in the 60 to 65 cent range in 26 and in the $1.80 to $1.90 range in 2017. Slide 9 depicts the trends in our net interest margin over the past five quarters. We continue to post steady quarterly improvements in Net Interest Margin (NIM) driven largely by lower funding costs. First quarter Net Interest Margin (NIM) increased 10 basis points quarter over quarter to 2.15% after adjusting for the recognition of a one time hedge gain of 21 million in the fourth quarter. Turning to slide 10, our operating expenses continue to decline reflecting our focus on cost containment. Quarter over quarter operating expenses declined 21 million or 5%. Slide 11 shows the growth in our capital over the last few quarters at 13.24%. Our CT1 ratio ranks among the top relative to other regional banks and we have about 1.6 billion in excess capital after tax relative to the low end of our target Common Equity Tier 1 (CET1) operating range of 10.5%. The next slide provides an overview of our deposits. Core deposits excluding brokered increased 1.1 billion on a linked quarter basis or about 2%. This growth was primarily driven by growth in commercial and private bank deposits of 461 million and retail deposits which were up 142 million. As in past quarters, during the current quarter we paid down 300 million of broker deposits with a weighted average cost of 4.76%. In addition, approximately 5.3 billion of retail CDs matured during the quarter with a weighted average cost of 4.13% and we retained 86% of these CDs as they moved into other CD products with rates approximately 35 to 40 basis points lower than the maturing products. In the second quarter we have 4.8 billion of retail CDs maturing with an average cost of 3.98%. Also during the quarter we further deleveraged the balance sheet by paying down 1 billion of flub advances with a weighted average cost of 3.85%. The deleveraging CD maturities and other deposit management actions led to a 21 basis point reduction in the cost of interest bearing deposits quarter over quarter. Slide 13 shows our multifamily and Commercial Real Estate (CRE)PA payoffs which were again elevated this quarter at 1.1 billion of which 42% were rated substandard. These payoffs are resulting in a significant reduction in in overall Commercial Real Estate (CRE) balances and in our Commercial Real Estate (CRE) concentration ratio. Total Commercial Real Estate (CRE) balances have decreased 13.4 billion or 28% since year end 2023 to approximately 34 billion, aiding in our strategy to diversify the loan portfolio to a mix of 1/3 Commercial Real Estate (CRE), 1/3 CNI and 1/3 consumer. Additionally, the PAR payoffs have helped lower our Cre concentration ratio by 134% basis points to 3.67%. The next slide provides an overview of the multifamily portfolio which declined 5.5 billion or 17% on a year over year basis and 1.1 billion or 4% on a linked quarter basis. The reserve coverage on the total multi family portfolio was 1.83% and remains the highest relative to other multifamily focused lenders in the Northeast. Additionally, the reserve coverage on these multi family loans where 50% or more of the units are rent regulated is 3.20%. Currently there are $11.9 billion of multi family loans that are either resetting or maturing through year end 2027 with a weighted average coupon of approximately 3.75%. Moving to slides 15 and 16, we have again provided detailed additional information on the New York City multifamily portfolio where 50% or more of the units are rent regulated. At March 31st this tranche of the portfolio totaled 8.8 billion down 4% compared to the previous quarter and has an occupancy rate of 97% and a current LTV of 70%. Approximately 52% or 4.6 billion of the 8.8 billion are pass rated loans and the remaining 48% or 4.3 billion are criticised for classified meaning they are either special mention substandard or non accrual. Of the 4.3 billion, 1.9 billion are non accrual and have already been charged off to at least 90% of appraised value, meaning 287 million or 15% has been charged off against these non accrual loans. Furthermore, we also have an additional 73 million or 5% of ACL reserves against this non accrual population, meaning we have taken 20% of either charge offs or reserves against this population. Of the remaining 2.7 billion that are special mention substandard loans between reserves and charge offs we have 5.8% or 154 million pounds of loan loss coverage. We believe we’re adequately reserved or have charged these loans off to the appropriate levels and with excess capital of 2.2 billion before tax we think we’re more than covered were there to be any further degradation in this portion of the portfolio. Slide 17 details our ACL coverage by category. The 78 million reduction in the ACL was largely driven by lower CERE and multifamily health reinvestment balances. Our coverage ratio included unfunded commitments was at 1.67% at quarter end. On slide 18 we provide additional details around credit quality which trended positively during the quarter. Non accrual loans totaled $2.7 billion down $323 million or 11% compared to the prior quarter. Criticised and classified loans also declined decreasing $385 million or 3% compared to the prior quarter. During the quarter we did see an increase in special mention loans as a result of our comprehensive and prudent process that analyses in detail all loans with a reset or maturity date 18 months out 18 months from March 31, 2026 is September 27 and 27 is our largest reset year where nearly 9 billion Commercial Real Estate (CRE) loans either reset or mature. This amount includes approximately 2.9 billion of multifamily where 50% or more of these units are rent regulated. As part of this internal forward looking process we’ve applied the relevant pro forma contractual interest rate calculations and adjusted risk ratings accordingly. Three items I would note we are now 75% through analysing the entire 2027 cohort. The results of this analysis is reflected in our ACL and we continue to see significant substandard PAR payoffs each quarter. At the end of the quarter 30 to 89 day delinquencies were approximately 967 million, a decrease of 19 million from the previous quarter. As mentioned last quarter, the biggest driver of this delinquency Number is the additional day or 31st day of March when calculating delinquencies. At precisely 30 days as of April 21, approximately 493 million of these delinquent loans had been brought current. We continue to deliver on our strategic plan and are excited about the journey we’re on and the value we will create for our shareholders over the next two years. With that, I will now turn the call back to Joseph.

Joseph Otting (Chairman, President and CEO)

Thank you very much Lee. Before moving to Q and A, I wanted to add that we are encouraged by our continued progress made in the first quarter and remain focused on driving sustainable profitability, improving returns and delivering long term value for our shareholders. With continued improvement in credit trends, …

Full story available on Benzinga.com

This post was originally published here

Toro Corp (NASDAQ:TORO) shares are up during Friday’s premarket session following the announcement of a special dividend of 90 cents per share.

This news has contributed to the stock’s positive momentum as investors react favorably to the company’s decision to reward shareholders.

What Happened?

Toro Corp. declared a one-time special dividend of 90 cents per common share, payable to shareholders of record by May 4, 2026, with a payment date set for June 5, 2026.

The company declared a one-time special dividend of $1.75 per share on Dec. 5, 2025, paid to shareholders of record as of Dec. 16. The dividend was paid Jan. 16, 2026, totaling about $9.3 million in cash and 7.38 million shares of common stock.

Technical Analysis

Toro is currently trading significantly above its 20-day simple moving average (SMA) by 64.2%, suggesting strong short-term bullish momentum. The stock is also 75% above its 50-day SMA, indicating a robust intermediate trend, while it is 56.2% above its 100-day SMA, reinforcing the overall positive sentiment.

The relative strength index (RSI) is at 87.29, which is considered overbought, suggesting that …

Full story available on Benzinga.com

This post was originally published here
President Donald Trump‘s policy decisions and commentary drove the five best and worst days of the U.S. stock market during his second term, according to an analysis by Tom Lee‘s asset management firm Fundstrat.

Since his election in 2025, Trump’s decisions on key issues such as tariffs, Iran war, and Federal Reserve chair appointments have been erratic, reflecting his “Art of the Deal” negotiation style. This unpredictability has made his policy agenda and commentary the primary drivers of the market’s performance, as per the report released on Thursday.

Trump’s influence is a departure from the norm, where the S&P 500’s performance is typically driven by macroeconomic factors like corporate earnings, geopolitical events, and monetary policy. While U.S. government policy can be a factor, it’s unusual for it to be the sole driver.

The President’s impact has been so pronounced that without the five strongest market days tied to his decisions, the S&P 500 would be down 2.7% since he took office in 2025, rather than up 19%, the report stated.

Source: Fundstrat Direct

This is a stark contrast to other presidencies, where the stock market remained in the green even when the five best days were removed, except during former President George W. Bush‘s 2001 and 2005 terms, when it remained negative regardless, according to Fundstrat. With about 2.5 years still left in Trump’s term, markets still have time to change direction.


The five biggest up days in Trump’s second term (by magnitude) are:

(1) A 9.5% surge on April 9, 2025, after …

Full story available on Benzinga.com

This post was originally published here

On CNBC’s “Halftime Report Final Trades,” Joshua Brown, co-founder and CEO of Ritholtz Wealth Management, picked Starbucks Corporation (NASDAQ:SBUX), ahead of quarterly earnings.

Starbucks is expected to report earnings for the second quarter on Tuesday, April 28, after the closing bell. Analysts expect the company to report quarterly earnings at 44 cents per share on revenue of $9.21 billion.

Malcolm Ethridge, managing partner at Capital Area Planning Group, named Digital Realty Trust, Inc. (NYSE:DLR).

After the closing bell on Thursday, Digital Realty Trust reported …

Full story available on Benzinga.com

This post was originally published here

RPT Realty (NYSE:RPT) reported first-quarter financial results on Friday. The transcript from the company’s first-quarter earnings call has been provided below.

This transcript is brought to you by Benzinga APIs. For real-time access to our entire catalog, please visit https://www.benzinga.com/apis/ for a consultation.

View the webcast at https://events.q4inc.com/attendee/827134728

Summary

RPT Realty reported a relatively uneventful quarter, focusing on opportunities to transform the company and create shareholder value amid market pressures.

The company maintained a clean balance sheet with around $100 million in cash and liquidity, and no problematic loans, while continuing to pay dividends.

Strategic moves include repositioning from residential to commercial real estate, exploring M&A opportunities, and potential stock buybacks.

Financial performance saw negative GAAP income of $3.2 million and earnings available for distribution at negative $300,000, with a dividend yield of 10.8%.

Management highlighted an opportunistic approach to deploying capital in higher-yielding assets and potential growth through future large-scale investments and capital raises.

Full Transcript

OPERATOR

Thank you and good morning everyone. I would like to thank you for joining us today for RPT Realty first quarter 2026 earnings call. Joining me today are Michael Nirenberg, Chief Executive Officer of Rhythm Capital and Rhythm Property Trust, and Nick Santoro, Chief Financial Officer of Rhythm Capital and Rhythm Property Trust. Throughout the call we are going to reference the earnings supplement that was posted this morning to the Rhythm Property Trust website www.rptrealty.com. if you’ve not already done so, I’d encourage you to download the presentation now. I would like to point out that certain statements made today will be forward looking statements. These statements by their nature are uncertain and may differ materially from actual results. I encourage you to review the disclaimers in our press release and earnings supplement regarding forward looking statements and to review the risk factors contained in our annual and quarterly reports filed with the SEC. In addition, we will be discussing some non GAAP financial measures during today’s call. Reconciliations of these measures to the most directly comparable GAAP measures can be found in our earnings supplement and with that I will turn the call over to Michael.

Michael Nirenberg (Chief Executive Officer)

Thanks Emma Good morning everyone and thanks for joining us for the quarter. The company had a pretty uneventful quarter as we continue to look for opportunities that could be a game changer for our capital vehicle. With asset manager valuations under pressure, downward pressure on equity valuations in the public markets, we’re going to continue to remain patient and work towards creating value for shareholders. While the geopolitical events affecting the world credit spreads have remained actually in a relatively tight range and markets in general are performing well away from the headline risk we’ve seen in some of the retail private credit. Even there, if you take out the retail component, private credit is still performing well. The software headlines you’ve been reading about will take a while to play out in the earlier vintages. In the private credit world, where companies borrowed money at large multiples of revenue will likely be the ones affected negatively in the future. And a lot of those deals were originated back in the 20, 21 and 21ish kind of vintage. For RPT. We positioned the company for success by doing the following when we took over this vehicle in 24, we made a decision to clean up the balance sheet, liquidate a lot of the residential stuff, and reposition the company in the commercial space, using this as an opportunistic vehicle to deploy capital in the commercial world. Today the company has just a little under $100 million of cash and liquidity. The balance sheet is extremely clean there’s no problem loans and again is in great shape. While we continue to wait for the opportunity to transform the company, we’ll continue to pay the dividend. From an optionality standpoint, at some point it’s likely, if we can, we need to grow the vehicle quite frankly from an overall capital standpoint, if we can, we’ll be looking at different opportunities in the M and A world. And at some point we may consider even buying back a little bit of stock here. With that I’ll refer to the supplement that we posted online. I’m going to start on page three. And again, this is just really the summary of what rhythm is than RPT Realty. Today the pipeline is give or take about $2 billion. It’s always fairly robust. Looking at large opportunities in the multifamily space. We also evaluate things that we could potentially do around our genesis business where we continue to grow our multifamily lending. There the equity is a little bit under 300 million. It’s about 287 million. The commercial real estate portfolio, this is all post 24 vintage things that we’ve done is $236 million and we have give or take a little bit under $100 million of cash and liquidity. When you look at the financial highlights for the quarter, quite frankly, not a lot of activity. We sold down a little bit of we sold a few commercial real estate (CRE) floaters in the quarter to create a little liquidity. Looking for better opportunities, quite frankly to increase earnings. You know, as I pointed out in my opening remarks, the, you know, the credit markets continue to perform well. The CMBS markets perform well. But while saying that, well, you know, we’ll continue to monitor opportunities to turn over the portfolio and deploy capital in higher yielding assets. Gap income negative 3.2 million or 42 cents per diluted share. Keep in mind we did a reverse split. I think it was in Q4 earnings available for distribution at negative $300,000 or $0.04 per diluted share. Again, not a lot of activity. A lot of this relates to either the general and administrative (G&A) or the dividend paid. Dividend paid in the quarter, $0.36 per diluted share which correlates to about a 10.8% dividend yield based on where the equity is trading today. Book value 236.2 million or $30.83. And then as I pointed out, cash and liquidity a little under 100 million bucks. When you look at RPT, you know, I mentioned again earlier the strategic transformation, you know, again going back to when we took over this vehicle, we cut general and administrative (G&A) dramatically. We cleaned up the balance sheet. We sold down a lot of the residential portfolio where we could. And I’ll talk a little bit about the equity that’s remaining in the book. We’ve made some new commercial real estate (CRE) investments and that was mostly done in floating rate AAA cmbs. We made a few loans. On the debt side. We deployed 50 million in equity alongside Rhythm in the Paramount transaction, which we closed in December of 25. We continue to renegotiate our repo agreements and we continue to improve liquidity. So overall, the company’s in what I would say as much as there’s very little activity, in great shape and we look for an opportunity to deploy capital or create more capital, quite frankly, on something that’s going to be a game changer. I like to go back and refer to what Blackstone did with BXMT many years ago or what we did with Rhythm, which was going back to 2013, where we started that with a billion dollars of capital. And today, you know, the company has about $8 billion of capital. So we need to be patient here. As I pointed out, we’ll continue to pay the dividend. At some point, we need to make a move and either clean up the vehicle or figure out a way to grow it. And we can. We’re, and obviously we’re actively trying to grow the vehicle. When you look at page six, the repositioning of the portfolio, you know where we can go here. I pointed out on the Genesis side, we’re doing more, more lending in the multifamily space. There could be some opportunities to work together with that company. We continue to look for opportunities to put out capital in the debt markets on the commercial real estate (CRE) side. And then we’ll continue to evaluate opportunistic investments and figure out different ways that we can increase shareholder value. And then on page seven, it really just talks about how Rhythm Property Trust benefits from the overall Rhythm ecosystem. And that includes, you know, the Paramount transaction that we closed in December and then our asset management businesses, Sculptor and Crestline. So with that, I’ll turn it back to the operator. We could open up for Q and A and then get on with our beautiful Friday.

OPERATOR

At this time, I would like to tell everyone, in order to ask a question, press Star, then the number one on your telephone keypad. If you would like to withdraw your question, please press Star one again. Thank you. We’ll pause for a moment to compile a Q and A …

Full story available on Benzinga.com

This post was originally published here

On Thursday, the Donald Trump administration accused China-linked entities of carrying out large-scale theft of U.S. artificial intelligence technology, warning of stronger enforcement measures against what it describes as unauthorized “distillation” of frontier AI models.

US Alleges Coordinated AI Model Copying Effort

In a memo, Michael Kratsios, director of the White House Office of Science and Technology Policy, said the administration has intelligence indicating that foreign actors, primarily based in China, are running “industrial-scale campaigns” aimed at replicating advanced U.S. AI systems.

Kratsios said these efforts involve extracting knowledge from leading American AI models and using it to build competing systems at lower cost, calling the activity an “unacceptable” threat when conducted without authorization.

“The United States government has information indicating that foreign entities principally based in China, are engaged in deliberate, industrial-scale campaigns to distil US frontier AI systems,” he wrote.

data-variant=”card”
data-news-mode=”manual”

>


Read Also:

OpenAI …

This post was originally published here
The most oversold stocks in the materials sector presents an opportunity to buy into undervalued companies.

The RSI is a momentum indicator, which compares a stock’s strength on days when prices go up to its strength on days when prices go down. When compared to a stock’s price action, it can give traders a better sense of how a stock may perform in the short term. An asset is typically considered oversold when the RSI is below 30, according to Benzinga Pro.

Here’s the latest list of major oversold players in this sector, having an RSI near or below 30.

Scully Royalty Ltd (NYSE:SRL)

  • On Jan. 12, Scully Royalty’s board terminated CEO and commenced search for new CEO. The company’s stock fell around 11% over the past month and has a 52-week low of $5.13.
  • RSI Value: 29.5
  • SRL Price Action: Shares of Scully Royalty fell 2% to close at $6.87 on Thursday.
  • Benzinga Pro’s newsfeed tool helped identify the developments in SRL stock.

Bon …

Full story available on Benzinga.com

This post was originally published here

While investors remain fixated on oil, gold, and the Federal Reserve, aluminum – the metal behind automotive, aerospace, packaging, and power infrastructure – is experiencing the biggest disruption of the century, so far.

“The scale of the supply shock we’re seeing in the aluminum market is probably the largest single supply shock a base metals market has suffered in the post-2000 era. We are already in a black swan event. No one could have foreseen something on this scale,” Mercuria’s analyst Nick Snowdon said, according to Reuters. His firm estimates a 2 million ton deficit by the end of the year.

The Gulf region is a large source for the global market. Its producers account for about 9% of global primary aluminum supply – 6.45 million tons a year. With the Strait of Hormuz disrupted, force majeure declarations mounting, and damage reported at key facilities, the problem isn’t just what metal can’t get out. It is also what raw materials, especially alumina, can’t get in.

The situation leaves the two most exposed markets, Europe and the U.S., scrambling for replacement supply simultaneously.

The Energy Bottleneck

Europe is particularly vulnerable since it has spent years hollowing out its smelting base. Structurally high power costs, carbon pricing, and increasingly tight environmental rules have all squeezed primary …

Full story available on Benzinga.com

This post was originally published here

The technology trade is back with chip stocks witnessing an astounding rally, driving gains in semiconductor ETFs. iShares Semiconductor ETF (NASDAQ:SOXX), VanEck Vectors Semiconductor ETF (NASDAQ:SMH), SPDR S&P Semiconductor ETF (NYSE:XSD) and First Trust Nasdaq Semiconductor ETF (NASDAQ:FTXL) are all rising.

Historic Semiconductor Stocks Rally

According to a Thursday post on X by The Kobeissi Letter, the Philadelphia Semiconductor Index has gained for 16 consecutive trading sessions, surging 38.7% and putting the index on pace for its biggest monthly gain since February 2000. The winning streak has officially surpassed the previous record stretch of 15 days posted in 2014.

As per the post, SOXX and SMH have collectively pulled in $5.5 billion so far in April, “already surpassing any other full month of inflows on record.”

SOXX has absorbed $2.05 billion in April inflows, more than double its previous monthly record, while SMH has pulled in $3.4 billion, also an all-time high for the fund.

data-variant=”card”

This post was originally published here

General Motors Co.‘s (NYSE:GM) bonuses for CEO Mary Barra and other top executives from the company remained unaffected by the losses GM incurred due to President Donald Trump‘s tariffs, which were around $3 billion in 2025.

Mary Barra’s Bonus Unaffected By Tariffs

According to filings with the Securities and Exchange Commission (SEC) accessed by The Detroit News on Thursday, the bonuses were unaffected due to the company’s Board discounting the losses tied to the tariffs when calculating the company’s profitability. The package was awarded to Barra for her role in offsetting additional losses due to tariffs.

data-variant=”card”
data-news-mode=”manual”

>


Read Also:

Massive Ford Recall: About 1.4 Million F-150 Trucks Hit By Gearshift Glitch

This post was originally published here

The world is facing its worst-ever energy security crisis, according to Fatih Birol, the head of the International Energy Agency (IEA), who warned on Friday that disruptions linked to the closure of the Strait of Hormuz now exceed the scale of the 1970s oil shocks.

“We are indeed facing the biggest energy security threat in history,” Birol told CNBC at the CONVERGE LIVE event in Singapore, saying the world has lost 13 million barrels per day of oil supply — above the 10 million barrels per day disrupted across the 1973 and 1979 oil crises combined.

Getting Worse Every Day, Birol Warns

“The crisis is getting worse every day,” Birol added.

The comments underscore growing fears that the Hormuz disruption is evolving from a geopolitical flashpoint into a broader macroeconomic risk, with implications for inflation, growth and supply chains.

Meanwhile, President Donald Trump on Thursday ordered the U.S. military to “shoot and kill” any Iranian boats laying mines in the …

Full story available on Benzinga.com

This post was originally published here

President Donald Trump commended insurance companies for their response to the January 2025 Los Angeles wildfires, while criticizing banks, particularly Wells Fargo & Co. (NYSE:WFC), for their lack of support.

Trump took to Truth Social on Thursday to praise insurance companies for “stepping up to the plate” and making “big progress” in treating homeowners affected by the disaster. However, he criticized banks for their inadequate response. He pledged to investigate their actions and urged them to treat the victims fairly.

“Wells Fargo, in particular, has been very difficult to deal with,” wrote Trump.

The President also mentioned his plans to work with local authorities to ensure a smooth resolution to the situation. He thanked the EPA Administrator, Lee Zeldin, for his swift and effective environmental work.

Trump’s post came on the heels of his Oval office meeting with Los Angeles Mayor Karen Bass, Fifth District Supervisor Kathryn Barger (Los Angeles County Board of Supervisors), and the Supervisor’s Chief of Staff, Anna Mouradian, to review progress on recovery efforts following the devastating fires, on Thursday.

Bass and Barger, in a joint statement on X, said …

Full story available on Benzinga.com

This post was originally published here

During times of turbulence and uncertainty in the markets, many investors turn to dividend-yielding stocks. These are often companies that have high free cash flows and reward shareholders with a high dividend payout.

Benzinga readers can review the latest analyst takes on their favorite stocks by visiting Analyst Stock Ratings page. Traders can sort through Benzinga’s extensive database of analyst ratings, including by analyst accuracy.

Below are the ratings of the most accurate analysts for three high-yielding stocks in the consumer discretionary sector.

Wendy’s Co (NASDAQ:WEN)

  • Dividend Yield: 8.08%
  • UBS analyst Dennis Geiger maintained a Neutral rating and cut the price target from $8.5 to $7.5 on Feb. 17, 2026. This analyst has an accuracy rate of 56%
  • Goldman Sachs analyst Christine Cho maintained a Sell rating and slashed the price target from $8 to $7 on Feb. 17, 2026. This analyst has an accuracy rate of 63%.
  • Recent News: The Wendy’s Company said it will report first quarter results on May 8.
  • Benzinga …

Full story available on Benzinga.com

This post was originally published here

Top Wall Street analysts changed their outlook on these top names. For a complete view of all analyst rating changes, including upgrades, downgrades and initiations, please see our analyst ratings page.

  • Morgan Stanley analyst Carlos De Alba downgraded Freeport-McMoRan Inc (NYSE:FCX) from Overweight to Equal-Weight and lowered the price target from $70 to $66. Freeport-McMoRan shares closed at $61.48 on Thursday. See how other analysts view this stock.
  • Raymond James analyst Ric Prentiss downgraded Iridium Communications Inc (NASDAQ:

Full story available on Benzinga.com

This post was originally published here

Lockheed Martin Corp. (NYSE:LMT) shares are up during Friday’s premarket session as the company celebrates the Government of Peru’s decision to purchase 12 new F-16 Block 70 aircraft, enhancing its national defense capabilities.

Separately, Lockheed Martin also filed a mixed shelf prospectus, allowing it to potentially offer a range of securities at a later date. The company did not disclose the size, timing, or specific terms of any future offering.

Strategic Defense Partnership

This move is seen as a significant step in strengthening U.S.-Peru relations, while the stock’s rise coincides with broader market gains, with the Nasdaq rising 1.34% on Thursday.

The acquisition of the F-16 Block 70 aircraft marks a pivotal moment for the Peruvian Air Force, reinforcing its fighter fleet transformation and solidifying a strategic partnership with the United States.

Lockheed Martin’s Vice President highlighted that this collaboration fosters economic growth for all involved, as Peru joins a global fleet of over 2,800 F-16s.

Lockheed Martin Quarterly Results

The firm also reported first-quarter 2026 results on Thursday. Sales were $18.021 billion, below the $18.244 billion estimate, and diluted EPS of $6.44 missed the 

Full story available on Benzinga.com

This post was originally published here

Verizon Communications Inc. (NYSE:VZ) will release earnings for its first quarter before the opening bell on Monday, April 27.

Analysts expect the company to report quarterly earnings of $1.21 per share. That’s up from $1.19 per share in the year-ago period. The consensus estimate for Verizon’s quarterly revenue is $34.86 billion (it reported $33.48 billion last year), according to Benzinga Pro.

Ahead of quarterly earnings, Barclays analyst Kannan Venkateshwar, on March 31, maintained Verizon with an Equal-Weight rating and raised the price target from $43 to $47.

With the recent buzz around Verizon, some investors may be eyeing potential gains from the company’s dividends too. As of now, Verizon has an annual dividend yield of 5.99%, which is a quarterly dividend amount of 70.75 cents per share ($2.83 a year).

To figure out how to earn $500 monthly from Verizon, we start with the yearly …

Full story available on Benzinga.com

This post was originally published here

U.S. stock futures were mixed this morning, with the Dow futures falling around 100 points on Friday.

Shares of Boyd Gaming Corp (NYSE:BYD) fell sharply in pre-market trading after the company reported worse-than-expected first-quarter financial results and announced a $500 million buyback plan.

Boyd Gaming reported quarterly earnings of $1.60 per share which missed the analyst consensus estimate of $1.73 per share. The company reported quarterly sales of $997.355 million which missed the analyst consensus estimate of $1.000 billion.

Boyd Gaming shares dipped 6.1% to $83.75 in pre-market trading.

Here are some other stocks moving lower in pre-market trading.

  • StoneCo Ltd (NASDAQ:STNE) fell 15.2% to $12.34 in pre-market trading. …

Full story available on Benzinga.com

This post was originally published here

On CNBC’s “Mad Money Lightning Round,” Jim Cramer said Critical Metals Corp. (NASDAQ:CRML) is a spec. “If you really want to be in that industry, you need to buy MP Materials (NYSE:MP),” he added.

According to recent news, the company announced on Tuesday a private placement of ordinary shares for gross proceeds of $60 million.

“We cannot be in SoundHound (NASDAQ:SOUN),” Cramer said.

On the earnings front, SoundHound AI is expected to report first-quarter financial results on May 7.

Cramer said he was surprised as …

Full story available on Benzinga.com

This post was originally published here

Amidst today’s fast-paced and highly competitive business environment, it is crucial for investors and industry enthusiasts to conduct comprehensive company evaluations. In this article, we will delve into an extensive industry comparison, evaluating Advanced Micro Devices (NASDAQ:AMD) in comparison to its major competitors within the Semiconductors & Semiconductor Equipment industry. By analyzing critical financial metrics, market position, and growth potential, our objective is to provide valuable insights for investors and offer a deeper understanding of company’s performance in the industry.

Advanced Micro Devices Background

Advanced Micro Devices designs a variety of digital semiconductors for markets such as PCs, gaming consoles, data centers (including artificial intelligence), industrial, and automotive applications. AMD’s traditional strength was in central processing units and graphics processing units used in PCs and data centers. However, AMD is emerging as a prominent player in AI GPUs and related hardware. Additionally, the firm supplies the chips found in prominent game consoles such as the Sony PlayStation and Microsoft Xbox.

Company P/E P/B P/S ROE EBITDA (in billions) Gross Profit (in billions) Revenue Growth
Advanced Micro Devices Inc 116.98 7.90 14.42 2.44% $2.86 $5.58 34.11%
NVIDIA Corp 40.74 30.84 22.66 31.11% $51.28 $51.09 73.21%
Broadcom Inc 81.86 24.89 29.93 9.12% $11.15 $13.16 29.47%
Micron Technology Inc 22.73 7.50 9.40 21.0% $18.48 $17.75 196.29%
Texas Instruments Inc 48.24 15.31 13.97 9.35% $2.07 $2.47 9.09%
Analog Devices Inc 73.84 5.84 17 2.46% $1.52 $2.04 30.42%
Marvell Technology Inc 53.93 10.12 17.57 2.79% $0.75 $1.15 22.08%
Qualcomm Inc 27.01 6.19 3.27 13.57% $4.11 $6.68 5.0%
Monolithic Power Systems Inc 123.81 22.14 27.56 4.95% $0.21 $0.41 20.83%
NXP Semiconductors NV 30.33 6.06 5 4.53% $0.98 $1.81 7.2%
ON Semiconductor Corp 337.17 5.01 6.72 2.33% $0.45 $0.55 -11.17%
GLOBALFOUNDRIES Inc 38.70 2.83 5.06 1.68% $0.73 $0.51 0.0%
Astera Labs Inc 161.92 24.66 41.60 3.41% $0.07 $0.2 91.77%
Credo Technology Group Holding Ltd 101.95 18.51 32.26 10.03% $0.16 $0.28 201.49%
Tower Semiconductor Ltd 103.75 7.78 14.60 2.78% $0.2 $0.12 13.69%
MACOM Technology Solutions Holdings Inc 128.69 15.77 20.89 3.64% $0.07 $0.15 24.52%
First Solar Inc 13.81 2.21 4.04 5.62% $0.7 $0.67 11.15%
Lattice Semiconductor Corp 5904.50 22.64 31.20 -1.08% $0.01 $0.1 24.16%
Rambus Inc 65.64 10.98 21.38 4.81% $0.09 $0.15 18.09%
Average 408.81 13.29 18.01 7.34% $5.17 $5.52 42.63%

Full story available on Benzinga.com

This post was originally published here

Veteran trader and chartist Peter Brandt predicted on Thursday an “investable low” for Bitcoin (CRYPTO: BTC) later in the year, followed by a major cyclical high in 2029.

The Story Of Tops And Bottoms

Brandt, a technical analyst with nearly 50 years of experience, based his prediction on the historical accuracy of its 15-year cyclical patterns.

They projected an “investable low” in September or October 2026, which may or may not “penetrate” February 2026 lows around $60,000.

Moreover, if the patterns persist, Brandt expected the next major high between $300,000 and $500,000 in late 2029.

Full story available on Benzinga.com

This post was originally published here

Companies planning to embrace the biannual reporting instead of quarterly, a proposal revived by President Donald Trump, may encounter investor backlash, an expert has warned.

Sam Rines, macro strategist at WisdomTree Asset Management, told Reuters that companies dropping quarterly reporting could face selling pressure and valuation cuts from active investment managers.

“We want, we need, more information, not less,” Rines said.

Rines added that this shift would be “a tough sell” to corporate boards, as they weigh cost savings against the potential perception of increased risk by investors.

The U.S. Securities and Exchange Commission (SEC) did not immediately respond to Benzinga‘s request for comment.

data-variant=”card”
data-news-mode=”manual”

>


Read Also:

SEC Is ‘Closely Monitoring’ Private Credit Pressures: Chairman Atkins

This post was originally published here

Tivic Health Systems Inc. (NASDAQ:TIVC) shares jumped 24.10% to $1.39 in after-hours trading after the San Antonio-based company announced a full corporate rebrand to Valion Bio, Inc., with its ticker shifting to VBIO at market open on April 28.

Strategic Transformation Behind The Rebrand

The rebrand caps a fundamental strategic pivot, exiting consumer medical devices and repositioning around Entolimod™, a TLR5 agonist developed as a medical countermeasure for acute radiation syndrome, with Food and Drug Administration Fast Track and Orphan Drug designations. The asset is advancing under the FDA’s Animal Rule pathway, which permits approval based on animal efficacy data when human trials are not feasible or ethical.

Valion Bio is actively engaging the Biomedical Advanced Research and Development Authority (BARDA), the Defense Threat Reduction Agency (DTRA), and the National Institute of Allergy and …

Full story available on Benzinga.com

This post was originally published here

Nvidia Corp. (NASDAQ:NVDA) has rolled out OpenAI’s Codex coding agent across its global workforce, with CEO Jensen Huang hailing the move as a milestone in “the age of AI,” while OpenAI CEO Sam Altman said early company-wide testing “was awesome.”

Nvidia Expands Codex To 10,000 Employees

Nvidia said more than 10,000 employees across engineering, product, legal, finance, marketing and other teams now have access to Codex, OpenAI’s agentic coding tool powered by GPT-5.5.

The rollout followed an internal pilot where employees reported faster debugging cycles and accelerated software development.

On Thursday, Altman shared Huang’s internal email on X, highlighting early success.

“We tried a new thing with NVIDIA to roll out Codex across a whole company and it was awesome to see it work,” Altman wrote, adding, “Let us know if you’d like to do it at your company!”

Full story available on Benzinga.com

This post was originally published here

Sen. Adam Schiff (D-Calif.) on Thursday called for stricter rules on prediction markets, warning that access to insider information could fuel unethical profits and criminal activity tied to sensitive global events.

In a post on X, Schiff said Congress must ensure that “no public official or other person with insider information” can use that knowledge to place bets in prediction markets. He pushed legislation that would prohibit contracts tied to events such as war, assassination, terrorism and death.

“These kinds of bets should be precluded altogether,” Schiff said, adding that failure to act could lead to “a lot more crimes like this one.”

Full story available on Benzinga.com

This post was originally published here

With U.S. stock futures trading mixed this morning on Friday, some of the stocks that may grab investor focus today are as follows:

  • Wall Street expects Charter Communications Inc. (NASDAQ:CHTR) to report quarterly earnings at $10.12 per share on revenue of $13.55 billion before the opening bell, according to data from Benzinga Pro. Charter Communications shares fell 0.93% to $239.52 in overnight trading.
  • Intel Corp. (NASDAQ:INTC) reported better-than-expected first-quarter financial results and issued second-quarter guidance above estimates. Intel reported quarterly earnings of 29 cents per share, which blew past the analyst consensus estimate …

Full story available on Benzinga.com

This post was originally published here

Charter Communications, Inc. (NASDAQ:CHTR) will release earnings for its first quarter before the opening bell on Friday, April 24.

Analysts expect the Stamford, Connecticut-based company to report quarterly earnings of $10.08 cents per share. That’s up from $8.42 per share in the year-ago period. The consensus estimate for Charter Communications’ quarterly revenue is $13.54 billion (it reported $13.73 billion last year), according to Benzinga Pro.

On Jan. 30, Charter Communications reported better-than-expected fourth-quarter earnings.

Shares of Charter Communications fell 0.3% to close at $241.78 on Thursday.

Benzinga readers can access the latest analyst ratings on the Analyst Stock Ratings page. Readers can sort by stock ticker, company name, analyst firm, rating change or other variables.

Let’s have a look at how Benzinga’s most-accurate analysts have rated the company in the recent period.

This post was originally published here

Norfolk Southern Corporation (NYSE:NSC) will release earnings for its first quarter before the opening bell on Friday, April 24.

Analysts expect the Atlanta, Georgia-based company to report quarterly earnings of $2.49 cents per share. That’s down from $2.69 per share in the year-ago period. The consensus estimate for Norfolk Southern’s quarterly revenue is $3.00 billion (it reported $2.99 billion last year), according to Benzinga Pro.

On April 23, Norfolk Southern announced a quarterly dividend of $1.35 per share.

Shares of Norfolk Southern jumped 7.8% to close at $321.44 on Friday.

Benzinga readers can access the latest analyst ratings on the Analyst Stock Ratings page. Readers can sort by stock ticker, company name, analyst firm, rating change or other variables.

Let’s have a look at how Benzinga’s most-accurate analysts have rated the company in …

Full story available on Benzinga.com

This post was originally published here

Infosys (NYSE:INFY) held its fourth-quarter earnings conference call on Thursday. Below is the complete transcript from the call.

Benzinga APIs provide real-time access to earnings call transcripts and financial data. Visit https://www.benzinga.com/apis/ to learn more.

The full earnings call is available at https://event.choruscall.com/mediaframe/webcast.html?webcastid=NEVleMBS

Summary

Infosys Ltd reported a full-year revenue growth of 3.1% in constant currency terms, with Q4 showing a year-on-year growth of 4.1%.

The company secured $14.9 billion in large deals for the year, marking a 24% increase from the previous year, with $3.2 billion in Q4 alone.

Infosys Ltd highlighted its AI strategy, showcasing projects with companies like Ralph Lauren, Hertz, and BP, which have led to substantial business improvements.

The company formed strategic collaborations with AI and tech giants such as Anthropic, OpenAI, Google, Nvidia, and Microsoft to enhance its AI capabilities.

Guidance for FY27 projects a revenue growth of 1.5% to 3.5% and an operating margin of 20% to 22%, with expected growth in financial services and energy utilities.

FY26 revenues surpassed $20 billion, with communication and manufacturing verticals and the Europe region driving growth.

The company plans to onboard 20,000 freshers in FY27, with a strategic focus on AI-driven initiatives and cost optimization.

Infosys Ltd maintained a strong cash flow, with a free cash flow of $33.5 billion for FY26 and a dividend increase of 11.6% over the previous year.

The company signed 96 large deals in FY26, with a total contract value of $15 billion, of which 55% were net new.

Full Transcript

OPERATOR

Ladies and gentlemen, greetings and welcome to Infosys Ltd Q4 FY26 earnings conference call. As a reminder, all participant lines will be in the listen only mode and there will be an opportunity for you to ask questions after the presentation concludes. Should you need assistance during this conference call, please signal an operator by pressing Star then zero on your touchtone phone. Please note that this conference is being recorded. I now hand the conference over to Mr. Sandeep Mahindra. Thank you. And over to Mr. Mahindra. Thanks everyone.

Sandeep Mahindra

Welcome to this earnings call to discuss Infosys Q4FY26 financial results. Joining us on this call is CEO and MD Mr. Sahil Parikh, CFO Mr. Jayar Sangra, along with other members of the leadership team. We’ll start the call with some remarks on the performance of the company, subsequent to which we’ll open up the call for questions. Please note that anything we say that refers to our future outlook is a forward looking statement that must be read in conjunction with the risk that the company faces. A complete statement explanation of these risks is available in our filings with the SEC, which can be found on www.sec.gov. I now like to pass on the call to Salal.

Salil Parikh

Thanks Sandeep. Good afternoon, good evening, good morning to everyone. Thank you for joining in. We delivered a strong performance in the financial year 2026. We had a growth of 3.1% for the full year. In constant currency terms, our Q4 revenue growth was 4.1% year on year. In constant currency terms, we had strong growth in financial services, in the communications industry and manufacturing industry and for the Europe geography For the full year last deals were strong. For the full year we had $14.9 billion of large deals. This is a growth of 24% over the prior year and for Q4 we were at $3.2 billion, a strong showing for the quarter. We shared our AI strategy during our AI Investor Day a few weeks ago. We see a large addressable market for AI services across six areas. AI strategy and engineering, Data process, Legacy modernization, physical AI and trust. With a Topaz fabric platform for AI, a COBOL platform for cloud, we have differentiated capabilities to serve our clients across the six areas of AI. Some examples of the work we are doing For a consumer products retail company, Ralph Lauren, we helped build a conversational and personalized AI tool that led to converting customer interest into a shopping experience. This resulted in an increase in their revenue by 12% and customer engagement by 50%. For a large transport company, Hertz, we helped with a legacy migration to bring 3 million lines of Cobol code to a modern microservices environment using AI foundation models. The cost was 60% lower, the timeline was 60% quicker than how they would have done it without AI for a large energy company. BP, we deployed 50 AI agent initiatives across trading, supply chain sustainability and core operations to transform the software development, knowledge automation, legacy modernization and digital decision support. This resulted in 95% payment accuracy, 50% faster contract validation and 18% improvement in it operations efficiency. We have strategic collaborations with emerging foundation model companies such as Anthropic and OpenAI which help us support our clients transformation for software development, legacy modernization and agent building. We also have established strategic AI collaborations with Google, Gemini, Nvidia, Microsoft AWS, Google Cloud, Google Cloud and Intel among others. We’ve deployed over 30,000 developers on GitHub Copilot as we look ahead to financial year 2027, we see large opportunities in AI services, continued competitive intensity and AI productivity impact. With a clear AI strategic roadmap and real world toolkit of Topaz fabric, we are well positioned to support our clients transformation technology and operations objectives Our revenue growth guidance of financial year 27 is 1.5% to 3.5% year on year in constant currency terms. We expect acceleration in growth in financial services and the energy utilities resources services vertical. From financial year 26 to 27 we expect H1 to be stronger than H2 consistent with our normal seasonality. Our operating margin guidance for financial year 27 is 20% to 22%. With that, let me hand it over to Jayesh for his update.

Jayesh Sangra

Thank you Sandeep Good morning, Good evening everyone and thank you for joining the call today. Financial year 26 performance demonstrates our ability to maintain financial discipline and operational excellence in a challenging and evolving business environment. Client spending is guided with greater focus on cost optimization engagement as against growth led transformation programs. We are seeing increasing momentum in AI driven initiatives particularly around productivity, automation and platform led modernization initiatives. Let me start with the key highlights for the year and the quarter. FY26 revenues crossed 20 billion and grew 3.1% in constant currency terms within the upgraded guidance band given in January. This was after lower third party cost which was down by 1% as percentage of revenue and 0.7% reduction in on site mix. Acquisitions contributed about 70 bids on full year growth for FY26. Communication, manufacturing vertical and Europe geography grew more than double the company average led by ramp up of the large deal wins. Additionally, FS and EURs grew above the company average in constant currency terms. Volumes for the year were flattish. Growth was led by increase in realization thanks to Project Maximus. Adjusted operating margin was stable at 21%. Gains from currency and maximus were reinvested in talent, AI investment and sales and marketing. Q4 revenues grew by 4.1% year on year. Sequentially revenues declined 1.3% in constant currency due to seasonality and slower decision making. In the month of March growth in Q4 was broad based across major geographies. Communication, EURs and LS verticals grew well above the company average on a year on year basis. In Constant currency terms Q4 operating margin stood at 20.9% down 0.3% sequentially adjusted for the labor code impact in Q3. On site mix further reduced to 22.8% from 23.1% in Q3. Utilization excluding trainings was 83% in Q4 and 84.4% in FY26. Utilization including trainees was at 81.1% for FY26 reflecting the investment made towards creating future capacity. Strong focus on collections aided by technology interventions helped us reduce DSO including an unbilled net of unearned to 78 which is the slowest in seven years which is the lowest in seven years. Reported EPS in INR terms grew 23.8% YoY in Q4 and 11% in FY26. EPS adjusted for income tax orders and the labor code grew double digit for the year at 13.9% in Q4 and 12.1% for the full year in INR terms. Free cash flow adjusted for the labor codes and income tax refund stood at $33.5 billion for FY and 882 million for Q4 adjusted. Free cash as a percentage of net profit continue to be well above 100% at …

Full story available on Benzinga.com

This post was originally published here

HCA Healthcare, Inc. (NYSE:HCA) will release earnings for its first quarter before the opening bell on Friday, April 24.

Analysts expect the Nashville, Tennessee-based company to report quarterly earnings of $7.15 per share, up from $6.45 per share in the year-ago period. The consensus estimate for HCA Healthcare’s quarterly revenue is $19.07 billion (it reported $18.32 billion last year), according to Benzinga Pro.

On Jan. 27, HCA Healthcare released mixed fourth-quarter 2025 financial results.

HCA Healthcare shares gained 0.6% to close at $474.03 on Thursday.

Benzinga readers can access the latest analyst ratings on the Analyst Stock Ratings page. Readers can sort by stock ticker, company name, analyst firm, rating …

Full story available on Benzinga.com

This post was originally published here

The Western Union Company (NYSE:WU) will release earnings for its first quarter before the opening bell on Friday, April 24.

Analysts expect the Denver, Colorado-based company to report quarterly earnings of 39 cents per share, down from 41 cents per share in the year-ago period. The consensus estimate for Western Union’s quarterly revenue is $962.88 million (it reported $983.6 million last year), according to Benzinga Pro.

On March 13, Western Union named global business leader Milind Pant to its board of directors.

Western Union shares fell 1.8% to close at $9.33 on Thursday.

Benzinga readers can access the latest analyst ratings on the Analyst Stock Ratings page. Readers can sort by stock ticker, company name, analyst firm, rating change or other variables.

Let’s have a look at how Benzinga’s most-accurate analysts have rated …

Full story available on Benzinga.com

This post was originally published here

Sen. Elizabeth Warren (D-Mass) has slammed United Airlines Holdings Inc. (NASDAQ:UAL) CEO Scott Kirby‘s comments about a possible merger with American Airlines Group Inc. (NASDAQ:AAL).

Consolidation Not Competition

In a post on X on Thursday, Warren shared her criticism of United’s proposed merger with American Airlines. “United Airlines’ CEO is pitching a mega-merger to swallow up American Airlines and create an airline twice the size of its nearest competitor,” she said in the post.

data-variant=”card”
data-news-mode=”manual”

>


Read Also:

United Airlines Beats Q4 Estimates, Shares Rise After Hours

This post was originally published here

The CNN Money Fear and Greed index showed a decline in the overall market sentiment, while the index remained in the “Greed” zone on Thursday.

U.S. stocks settled lower on Thursday, with the Nasdaq Composite falling more than 200 points during the session amid higher oil prices.

A lack of progress in the U.S.-Iran standoff rekindled risk-off flows, pushing oil prices higher and igniting a defensive rotation that hammered tech. President Donald Trump on Thursday ordered the U.S. Navy to target any vessels laying mines in the Strait of Hormuz, adding that minesweepers were clearing the waterway.

In earnings, shares of IBM (NYSE:IBM) and ServiceNow Inc. (NYSE:NOW) tumbled around 8% and almost 18%, respectively, after the companies reported results for the latest quarter. United Rentals Inc. (NYSE:URI) shares …

Full story available on Benzinga.com

This post was originally published here

Former Rep. Marjorie Taylor Greene (R-Ga.) highlighted a shifting political narrative around the economy, saying that Americans favor Democrats over Republicans on economic issues despite the surge in inflation during Joe Biden‘s tenure.

Greene Puts 9% Inflation Against Fox News Poll

Greene, on Thursday X post, pointed to 9% inflation under Biden while arguing Republicans are “failing so badly on cost of living and domestic issues” that a Fox News poll shows Americans prefer Democrats on the economy. Greene wrote, “Take into consideration that under Biden/Kamala and full Democrat control, we hit 9% inflation.”

U.S. inflation surged to a four-year high in March, driven by rising energy prices tied to the U.S.-Iran war. The annual inflation rate soared from 2.4% in February to 3.3% in March, the highest since May 2024.

This post was originally published here

Investor Ross Gerber of Gerber Kawasaki slammed Tesla Inc. (NASDAQ:TSLA) on Thursday for winding down production of the premium Model S and Model X vehicles as the EV giant shifts towards robots.

Best EV Ever

In a post on the social media platform X, Gerber quoted a post by influencer Sawyer Merritt that shared details about the Model S ‘Signature’ edition. “They are spending money to take this production line down,” he said. Gerber hailed the Model S as the “best EV ever made.”

data-variant=”card”
data-news-mode=”manual”

>


Read Also:

Tesla Rival Xpeng Targets 2027 Flying Car Deliveries, Year-End Volume Production Timeline For Optimus Rival

This post was originally published here

iTonic Holdings Ltd (NASDAQ:ITOC) shares surged 66.42% to $0.50 in after-hours trading on Thursday after the company disclosed that Nasdaq had granted an additional 180-calendar-day extension to comply with its minimum bid price requirement.

According to Benzinga Pro data, ITOC closed the regular session at $0.30, down 1.64%.

Delisting Clock Still Ticking

Nasdaq notified ITOC on Tuesday that it approved the extension following the expiration of the initial 180-day compliance period on April 20. The new deadline is Oct. 19. Under Nasdaq Listing Rule 5550(a)(2), if the company fails to regain compliance, Nasdaq will issue a formal delisting notice. iTonic has stated that in that situation, it may appeal before a Nasdaq Hearings Panel.

data-variant=”banner”

This post was originally published here

President Donald Trump floated the idea of the White House purchasing struggling flight operator Spirit Aviation Holdings Inc. (OTC:FLYYQ) on Thursday, suggesting that it can be sold for a profit later.

‘I Think We Just Buy It,’ Says Trump

During a press briefing, Trump was asked about a possible bailout for Spirit. “I think we just buy it,” Trump said, sharing that the administration wanted to help the 18,000 employees who worked at Spirit and “save” those jobs. “We’d be getting it virtually debt-free,” he added. Trump also hailed the airline’s aircraft fleet and other assets. “When the price of oil goes down, we’ll sell it for a profit,” he said.

data-variant=”card”
data-news-mode=”manual”

>


Read Also:

Sean Duffy Touts Revamped Air Traffic Control—Floppy Disks, Flight Strips To Be Retired

This post was originally published here

Intel Corp.‘s (NASDAQ:INTC) incredible run in extended trading on Thursday has driven gains in ETFs like Direxion Daily INTC Bull 2X ETF (NASDAQ:LINT), First Trust Nasdaq Semiconductor ETF (NASDAQ:FTXL), and Invesco PHLX Semiconductor ETF (SOXQ), which have the largest exposure to this chipmaker.

Direxion Daily INTC Bull 2X ETF

LINT seeks two times (200%) the performance of the share price of INTC. It has $19.5 million in assets under management (AUM) and trades an average volume of 135,000 shares. The ETF charges a steep 0.97% annual fee.

Benzinga Edge Stock Rankings indicate LINT maintains a strong price trend in the short, medium and long term.

Price Action: LINT skyrocketed 39% in extended trading on Thursday

First Trust Nasdaq Semiconductor ETF

FTXL offers exposure to U.S. semiconductor companies by tracking the Nasdaq US Smart Semiconductor Index. It holds 34 stocks in its basket, with Intel taking the top spot at 9.1% share. The ETF has $1.9 billion in AUM and trades in an average volume of 157,000 shares. It has an expense ratio of 0.60%.

Benzinga Edge Stock Rankings indicate FTXL has a Momentum score in the 95th percentile and …

Full story available on Benzinga.com

This post was originally published here

IREN Ltd. (NASDAQ:IREN) shares are trending on Friday.

IREN shares climbed 1.67% to $52.89 after the bell Thursday after the Sydney-based vertically integrated AI cloud provider announced it will release financial results for the third quarter, covering the three months ended Mar. 31, on May 7.

The company will host a conference call at 5:00 p.m. ET following the release.

What Investors Should Know

IREN has transitioned from primarily Bitcoin (CRYPTO: BTC) mining to a major AI infrastructure provider, with key partnerships with Microsoft (NASDAQ:MSFT), Dell Technologies (NYSE:DELL) and Nvidia (NASDAQ:NVDA).

In February, IREN reported second-quarter earnings per share of -$0.52, missing the analyst estimate of -$0.18 by 188.89%. Revenue came in at …

Full story available on Benzinga.com

This post was originally published here

The Justice Department charged an Army soldier on Thursday with allegedly using classified details about a mission to capture Venezuela’s ousted leader, Nicolás Maduro, to profit on Polymarket.

How A Solder Exploited Classified Intel

Authorities said that Gannon Ken Van Dyke had a role in planning and carrying out the military operation, giving him access to “sensitive” information.

The indictment says he staked about $33,034, consistently taking the “YES” side of contracts tied to Venezuela, including the U.S. invasion of Venezuela and Maduro’s ouster. All of this occurred ahead of Trump’s public statement on Jan. 3 confirming Maduro’s capture.

Van Dyke won all his wagers, allegedly making $409,81 in profits on the Polygon (CRYPTO: POL)-based prediction market.

“Gannon Ken Van Dyke allegedly betrayed his fellow soldiers by utilizing classified …

Full story available on Benzinga.com

This post was originally published here

Major U.S. indices closed Thursday lower, with the Dow Jones Industrial Average falling 0.36% to 49,310.32, the S&P 500 slipping 0.41% to 7,108.40 and the Nasdaq dropping 0.89% to 24,438.50.

These are the top stocks that gained the attention of retail traders and investors through the day:

Intel Corporation (NASDAQ:INTC)

Intel’s stock climbed 2.31% to close at $66.78, with an intraday high of $68.28 and a low of $65.42. The stock remains below its 52-week high of $70.33 but significantly above its low of $18.97. In the after-hours trading, the stock shot up nearly 20% to $80.10.

Intel reported a remarkable first quarter, with earnings of 29 cents per share, surpassing expectations. Revenue reached $13.58 billion, exceeding estimates by 9.28%. CEO Lip-Bu Tan highlighted the growing demand for Intel’s CPUs and advanced packaging offerings.

Intel guided for second-quarter adjusted EPS of 20 cents on revenue of $13.8 billion to $14.8 billion, beating estimates of 9 cents and $13.07 billion.

data-variant=”card”
data-news-mode=”manual”

>


Read Also:

Mark Cuban Says …

This post was originally published here
Betterware de Mexico SAPI (NYSE:BWMX) held its first-quarter earnings conference call on Thursday. Below is the complete transcript from the call.

This content is powered by Benzinga APIs. For comprehensive financial data and transcripts, visit https://www.benzinga.com/apis/.

Access the full call at https://viavid.webcasts.com/starthere.jsp?ei=1756571&tp_key=3835ed2404

Summary

Betterware de Mexico SAPI reported a slight revenue growth of 0.3% year over year, with EBITDA growing by 14%, and an expansion in EBITDA margin from 15.3% to 17.4%.

The company is focused on diversifying its revenue mix and expanding into new markets, with a significant acquisition of Tupperware expected to close in Q2, anticipated to contribute 40% to earnings per share.

Future growth is expected from geographic expansion, particularly in Ecuador and Guatemala, and the company continues to prioritize financial discipline, with a reduction in net debt to EBITDA from 3.1 to 1.5 times.

Operational highlights include the launch of Betterware Colombia and enhancements in digital capabilities, such as the Betterware Plus app and Salesforce CRM.

Management remains optimistic about market conditions, particularly with a recovering Mexican consumer market, and anticipates stronger performance in the latter half of the year.

Full Transcript

OPERATOR

Forward looking statements which are subject to various risks and uncertainties that could cause actual results to differ materially from expectations. Please consider these statements alongside the cautionary language and safe harbor statement in today’s earnings release as well as the risk factors outlined in BEFRA’s SEC filing. BEFRA undertakes no obligation to update any forward looking statements. A reconciliation of and other information regarding non GAAP financial measures discussed on this call can be found in the earnings release published earlier today as well as the Investor section of the Company’s website. Present on today’s call are BEFRA President and Chief Executive Officer Andres Campos and Chief Financial Officer Raul Salvijar. Now I would like to turn the call over to Mr. Campos. Please go ahead sir.

Andres Campos (President and Chief Executive Officer)

Thank you operator and good afternoon everyone. Thank you for joining our call today. First, I’d like to introduce Raul Del Villar, our new CFO. Raul brings more than 30 years of experience in senior finance roles within multinational consumer companies, playing strategic roles in expanding their brand portfolios and entering new geographic markets, both of which are integral to BEFRA’s own growth strategy. His experience and leadership will be instrumental in supporting our growth objectives. Turning to key Highlights on Slide 4, we delivered slight revenue growth of 0.3% year over year and EBITDA growth of 14% year over year, expanding our EBITDA margin from 15.3% to 17.4%, supported by improving profitability across all of our business units. Net income and free cash flow remain strong and reflect a more normalized quarter without the extraordinary effects seen last year. Turning to Slide 5, we continue to diversify our revenue mix in terms of brands and geographies. We expect this trend to accelerate once we receive regulatory approval of the Tupperware transaction, which we expect to happen in Q2. In addition to significantly diversifying our revenue and giving us entry into the Brazilian market, this new brand will be immediately earnings accretive, contributing an estimated 40% to earnings per share. Looking at revenue on a quarter on quarter basis, I’d like to highlight the early success of Betterware expansion into Ecuador and its improving performance in Guatemala, the contributions of which increased from 0.1% to 0.7% of total revenue over the past year. We expect this share to continue growing as the business scales in the region. Now I will hand the call over to Raul so He can explain BEFRA’s key financials in detail.

Raul Del Villar (Chief Financial Officer)

Thank you Andres. Very excited to be part of the team. Let’s turn to slide 6. Contributing to the 0.3% year over year increase in revenue was Betterware which grew 2.6% despite one less week in the quarter and which benefited from its geographic expansion. Improving Trends at Jafra U.S. also contributed to BEFRA’s top line growth which was partially offset by lower sales at Jafra México. Looking at the associate base, we are beginning to see the impact of targeted initiatives with Betterware base returning to growth Although Jafra México’s associate base declined as a result of our focus on productivity, we are now shifting towards initiatives aimed at attraction and retention which we expect to begin showing results in Q2. Overall, these trends demonstrate improving momentum across both businesses and position us well for sustained growth on slide 7, EBITDA performance reflects a clear improvement in profitability across our business units, with margin expanding 211 basis points to 17.4%. It is important to note that extraordinary expenses related to Tupperware transaction impacted the margin. Without these expenses, margin would have been approximately 18.4%. On the right-hand side of the slide, net income accelerated nearly doubling year over year, reflecting a return to more normalized profitability levels following the extraordinary expenses recorded in the prior year as well as lower interest expenses. Overall, BEFRA’s improving profitability embodies our fifth strategic pillar of maintaining financial discipline. Turning to the next slide, free cash flow normalized during the quarter, converting 58% of EBITDA into cash, supported by stronger underlying profitability and continued discipline in working capital management, particularly with respect to inventory. This will enable us to pay our 25th consecutive quarterly dividend since going public, which the Board has proposed at 200 million pesos. Subject to shareholder approval. Dividend payments remained aligned with our disciplined capital allocation framework, maintaining a 33% trailing 12 month dividend to EBITDA ratio while also using the cash we generate to further reduce debt leverage and continue investing in geographic expansion. Slide 9 summarizes BEFRA’s financial strength. Total debt continued falling with net debt to ebitda improving to 1.5 times following the completion of the Tupperware transaction, we expect our leverage ratio to increase to approximately 1.9 times with the aim of maintaining healthy leverage levels. As you can see in the chart

Andres Campos (President and Chief Executive Officer)

at the left of the slide, we successfully reduced leverage from 2.4 times at the end of 2022 and 3.1 times at the time of the Jafra acquisition to current levels. Our asset light model remains a key source of resilience with rota improving to 22.7%, demonstrating greater capital efficiency and stronger profitability. On the right hand side you can see that returns have also strengthened versus last year’s quarter with ROIC increasing to 27% and EPS reaching 31.9 Mexican pesos on a trailing basis, reflecting a stronger earnings profile. Overall, we are not only improving profitability but also translating these gains into stronger results, a healthier balance sheet and high returns on capital while enabling us to continue funding initiatives across our five strategic pillars. I will now pass the call back to Andres who will talk more about each brand’s performance as well as provide an update on the strategic pillars. Thank you Raul Turning to Slide 10 as in previous quarters, we continue advancing across our five strategic pillars which define the next stage of BFRA’s evolution. First, strengthen our leadership in Mexico with our Betterware and Jafra brands. Second, continue our regional expansion, driving Jafra’s growth in the US and selectively expanding across latam. Third, develop or acquire new brands and or product categories. Fourth, further advance our digital transformation and finally, maintain strict financial discipline, prioritizing profitability, cash generation and a strong balance sheet as the foundation of sustainable long term growth. These pillars remain the framework guiding our strategic decisions and capital allocation going forward. On slide 11 is the first pillar strengthening our leadership in the Mexican market, starting with Betterware. On the next slide, the business delivered a solid start to the year with improving commercial momentum, we are seeing a clear inflection point in the Associate base which has returned to growth and is beginning to rebuild scale. This represents an important milestone as it supports the recovery in revenue and reinforces the strength of our commercial model going forward. It is important to note that the quarter had one fewer week compared to last year which affected reported growth. On a comparable basis, revenue growth would have been approximately 3.3%. Additionally, although Latin America currently represents only 1.7% of Betterware total revenue, it is expected to continue expanding as we further scale our regional operations. On the right hand side of the slide, EBITDA margin improved significantly by 190 basis points to 20.5% with EBITDA increasing 12.9% year over year driven by disciplined cost management and solid execution. …

Full story available on Benzinga.com

This post was originally published here

On Thursday, Columbia Banking System (NASDAQ:COLB) discussed first-quarter financial results during its earnings call. The full transcript is provided below.

This content is powered by Benzinga APIs. For comprehensive financial data and transcripts, visit https://www.benzinga.com/apis/.

The full earnings call is available at https://edge.media-server.com/mmc/p/y2c5ea4c/

Summary

Columbia Banking System reported first-quarter earnings per share of $0.66 and operating earnings per share of $0.72, with substantial increases in pre-provision net revenue and operating net income due to the Pacific Premier acquisition and balance sheet optimization.

The company successfully completed the PAC Premier Systems conversion and consolidated nine branches, achieving significant cost savings and positioning itself for continued financial stability and growth.

Management highlighted strong commercial loan origination and deposit growth, with plans to continue share repurchases, supported by a robust capital position and a focus on optimizing performance and enhancing shareholder returns.

Full Transcript

OPERATOR

Hello and welcome to Columbia Banking Systems First Quarter 2026 Earnings Conference. At this time all participants are in a listen-only mode. After the speaker’s presentation, there will be a question and answer session. To ask a question during the session, you will need to press star 11 on your telephone. You will then hear an automated message advising your hand is raised to withdraw your question. Please press star 11 again. Please be advised that today’s conference is being recorded. I would now like to turn the conference over to Jackie Bolan, Investor Relations Director to begin the call. You may begin. Thank you. Good afternoon everyone. Thank you for joining us as we review our first quarter results. The earnings release and corresponding presentation are available on our website columbiabankingsystem.com. During today’s call we will make forward-looking statements which are subject to risks and uncertainties and are intended to be covered by the safe harbor provisions of the Federal Securities Law. For a list of factors that may cause actual results to differ materially from expectations, please refer to the disclosures contained within our SEC filings. We will also reference non-GAAP financial measures and I encourage you to review the non-GAAP reconciliations provided in our earnings materials. We’ll now hand the call over to Columbia’s Chair, Chief Executive Officer and President Clint Stein.

Clint Stein (Chair, Chief Executive Officer and President)

Thank you Jackie. Good afternoon everyone. Our first quarter results reflected continued execution against the same core priorities we have previously outlined, delivering consistent, repeatable results, optimizing our balance sheet and returning excess capital to shareholders. We also completed the PAC Premier Systems conversion and consolidated nine branches during the quarter, putting us on track for full realization of all acquisition related cost savings by the end of this quarter. I want to thank our highly experienced team of associates for their months of meticulous planning and the seamless execution of this key integration milestone. Our operating results for the first quarter reflect the continuation of momentum established late last year as solid CNI production offset a decline in below market rate transactional loan balances. We also reduced our reliance on wholesale funding as customer deposit balances expanded despite seasonal pressure typical during the first quarter. The resulting mix shift in both assets and liabilities fortifies and positions our balance sheet for sustained attractive returns over time. Our banker’s proven ability to generate balanced relationship centric growth in deposits, loans and quality fee income is driving sustainable earnings growth. We do not need to produce net balance sheet growth to achieve our epsilon and rotce objectives. Columbia’s cost conscious culture further enhances our top quartile profitability profile. Beyond savings associated with the PAC Premier acquisition. Our expense base reflects continuous fine tuning. We remain disciplined in identifying offsets that create reinvestment dollars for initiatives that drive revenue and enhance efficiency. AI is becoming an important tool for driving efficiency across Columbia. During our Pacific Premier Core Systems Conversion, we used AI to automate work that traditionally would be completed manually. Historically, time consuming conversion tasks such as reviewing and validating thousands of data fields were automated and completed in a fraction of the time historically required. Instead of relying on manual checks and custom coding, AI helped us move faster and reduce complexity, which shortened review timelines and improved execution. More broadly, AI is helping our technology teams work more efficiently. It allows our developers to move faster, test changes more quickly, and write software that is more secure. The result is higher productivity and better outcomes without adding incremental resources. We also enhanced our customer support experience with an AI powered virtual assistant. Our ratio of human calls to AI powered agent chats moved from 2 to 1 in favor of humans to 3 to 1 in favor of AI agents as many routine administrative questions are now handled by the virtual assistant. Macroeconomic headlines continue to dominate the industry narrative, often driving outsized stock price reactions and unilaterally treating all banks as the same. We are not all the same and Columbia’s fundamentals warrant differentiation. Over my tenure at Columbia bank, we have repeatedly demonstrated the ability to withstand industry stress as we consistently turn disruption into opportunity. During the global financial crisis, Columbia delivered strong credit performance while leveraging FDIC assisted transactions to grow and strengthen our franchise. Since then, we have continued to expand our customer base through both organic growth and strategic acquisitions. Our best in class low cost core deposit franchise consistently ranks in the top quartile when measured on both cost and mix of non interest bearing balances. More recently, we successfully navigated the banking sector volatility of March 2023, again another point in time where many regional banks were treated as one. The Columbia team navigated this volatility without a discernible adverse impact to our business while simultaneously executing a successful systems conversion. Just three weeks after closing the UMPQUA acquisition, our credit fundamentals remain sound. Our office portfolio continues to perform modest uptick in Our CRE exposure, which is attributable to acquired portfolios, continues to decline. Turning to another closely watched area, our NDFI exposure is minimal, well below peer averages and underwritten with the same conservative and consistent rigor we apply across our broader loan portfolio. Our first quarter results marked the beginning of our third consecutive year of stable operational performance and strong organic capital creation. Given our current capital position and strong forward outlook, we increased our pace of buybacks during the first quarter returning $200 million to our shareholders, underscoring our belief that the best investment we can make at this time is in the stock of our own company. Looking forward, we will continue to execute on our established priorities, optimizing performance, driving new business growth, supporting the evolving needs of existing customers, and consistently delivering superior returns to our shareholders. I’ll now turn the call over to Ivan.

Ivan

Thank you, Clint and good afternoon everyone. As Clint highlighted, our first quarter results reflect continued execution of our strategic priorities. Turning to Slide 10, we reported earnings per share of $0.66 and operating earnings per share of $0.72 for the first quarter on an operating basis, which excludes merger, expense and other items detailed in our non GAAP disclosure. First quarter pre provision net revenue and operating net income increased 45% and 50% respectively compared to the first quarter of 2025 due to the addition of Pacific Premier, continued progress on our balance sheet optimization targets and disciplined expense management. Turning to Slide 11, average earning assets were $60.8 billion during the first quarter, coming in at the midpoint of the range that I outlined in January. As continued, balance sheet optimization contributed to modest contraction relative to the prior quarter. We modestly reduced cash as planned during the first quarter and utilizing excess balances to reduce wholesale funding sources, which declined by 560 million from December 31. Although wholesale funding declined as of March 31, balances were higher on an average basis during the first quarter due to typical seasonal customer deposit flows. Overall, the results were as anticipated, reflecting a balance sheet, a stable balance sheet outlook and a remix in our loan portfolio out of transactional and into relationship based lending. Following the modest earning asset contraction during the first quarter, we expect the balance sheet size to remain relatively stable with commercial loan growth offset by contraction in the transactional portfolio. Slide 12 outlines contributors to the sequential quarter change in net interest margin. Net interest margin was 3.96 for the first quarter, right at the top end of the range that I outlined in our last call. While the headline net interest margin is down from 4.06 last quarter, recall that our net interest margin in Q4 benefited from an 11 basis point impact of the amortization of a premium on acquired time deposits and an accelerated loan repayment pro forma. For those factors, we were roughly flat quarter over quarter and relative to the first quarter of 2025, net interest margin has expanded by 36 basis points, reflecting the impact of our balance sheet optimization strategy. We exited the first quarter with an improved funding mix relative to the fourth quarter and expect ongoing balance sheet optimization to drive net interest income growth and net interest margin expansion with the first quarter setting the low water mark for 2026. As I outlined in our Last Call, we anticipate our net interest margin to grow modestly in Q2, crossing over 4% at some point in the quarter. Our latest interest rate modeling continues to show that our balance sheet remains neutrally positioned to interest rates on Slide 13, and you’ll note that we have over $6 billion in fixed and adjustable loans set to reprice over the next 12 months. Not interest income in the first quarter was $83 million on a GAAP basis and $81 million on an operating basis as detailed on Slide 14. Within our guided 80 to $85 million range, the sequential quarter decrease was driven by lower swap, syndication and and international banking revenues following the strong performance in the prior quarter. Despite that, operating non interest income is up 25 million or 44% relative to the first quarter of 2025 from the impact of Pacific Premier alongside strong growth in fee income streams. As Tori will highlight later, we continue to expect non interest revenues in the low to mid $80 million range for Q2. Slide 15 outlines non interest expense which was 369 million on an operating basis excluding intangible amortization of $41 million. The first quarter’s $328 million run rate was below our guided range due to the earlier realization of cost savings following January system conversion as well as some planned investments which fell back into Q2 as of March 31, we achieved 102 million of the targeted $127 million in synergies. Although these savings were not fully run rated in the first quarter’s results. Excluding CDI amortization, we expect non interest expense in the 335 to 345 million range for the second quarter before declining in the third quarter as we realize all cost savings related to the transaction. By June 30, CDI amortization will average around $40 million per quarter. Moving on to Slide 16, provision expense was $28 million for the first quarter, reflecting loan portfolio runoff, credit migration trends and changes in the economic forecast used in the credit models. Relationship in the agricultural industry drove a modest increase in net charge offs and non performing assets relative to the fourth quarter, with our overall credit metrics remaining stable and healthy. Slide 17 details our allowance for credit losses by portfolio with coverage of total loans at 1% at quarter end and 1.28% when credit discount on acquired loans is included. Turning TO Capital Slide 18 highlights our regulatory ratios at quarter end, our CET1 and total risk based capital ratios declined modestly to 11.5% and 13.3% respectively, down approximately 30 basis points from the prior quarter end as our regular dividend and increased buyback activity outpaced capital generation during the quarter. During the first quarter we repurchased 6.5 million common shares, returning 200 million to our shareholders as of March 31. Our capital ratios remain comfortably above well capitalized regulatory minimums and our long term target ratios. We have excess capital of approximately 500 million and 400 million remains in our current repurchase authorization. Tangible book value declined slightly to $19.03 from $19.11 as of December 31, reflecting a higher accumulated other comprehensive loss on our securities portfolio. Given interest rate changes between periods, we expect share repurchases to remain in the 150 to $200 million range per quarter through our current authorization. Overall, we are very pleased with the financial results for the first quarter driving a 1.3% ROAA and over 15% ROTCE. We feel well positioned to drive strong profitability through the remainder of 2026 as our balance sheet optimization activity and continued share repurchases enhance long term value creation. With that, I will hand the call over to Tory.

Tori

Thank you Ivan Our teams had another strong quarter of business generation as new loan origination volume of 1.2 billion was up 38% from the year ago quarter. As a result, Columbia’s commercial loan portfolio inclusive of owner occupied commercial real estate increased 6% on an annualized basis, contributing to the continued remix of our loan portfolio toward higher return relationship based lending as transactional loan balances continue to decline. Although payoff and prepayment activity in the first quarter slowed relative to the fourth quarter’s elevated level, first quarter slowed relative to the fourth quarter’s elevated level, declining balances in the transactional portfolio contributed to slight overall loan portfolio contraction to 47.7 billion from 47.8 billion as of December 31. We continue to expect relatively stable net loan portfolio balances in 2026 as we optimize our balance sheet for sustainable profitability improvement. Turning to Customer Deposits Our team’s ability to generate new business and strong quarter end inflows offset seasonal deposit pressure during the first quarter resulting in $110 million of increase in customer balances as of March 31st. Our small business and retail deposit campaigns continue to bolster our deposit generation and our current campaign has generated nearly 450 million in new balances to Columbia through mid April. Further, the HOA business we acquired from Pacific Premier provided a countercyclical benefit during the first quarter as balances seasonally expanded, increasing nearly 160 million since year end. Customer balance growth and the cash deployment Ivan discussed contributed to a $760 million reduction in broker deposit balances as of quarter end, accounting for the decline in total deposits to 53.5 billion from 54.2 billion as of December 31st. Although customer fee income decreased following our strong fourth quarter performance, our results highlight the notable progress we have made over the past year driven by the addition of Pacific Premier and our continued efforts to expand the contribution of core fee income to total revenue. As Ivan discussed, operating non interest income increased significantly between the first quarters of 2025 and 2026 with an exceptional growth in financial services and trust revenue, treasury management, commercial card, merchant income and other recurring customer fee business. Our core fee income pipeline remains healthy, as do our loan and deposit pipelines, and we remain outwardly focused on generating business in a disciplined manner. I will now hand the call back over to Clint.

Clint Stein (Chair, Chief Executive Officer and President)

Thanks, Tori. I want to take a moment to thank our team of talented associates for their hard work and and contribution to our ninth consecutive quarter of solid financial performance and consistent results. Relationship driven loan and deposit growth and our balance sheet optimization efforts are creating tangible earnings results as evidenced by our net interest margin expansion over the past year. This concludes our prepared remarks. Chris, Tori, Ivan and Frank are with me. We’re happy to take your questions now. Dede, please open the call for Q and A.

OPERATOR

Thank you. As a reminder to ask a question, please press star 11 on your telephone and wait for your name to be announced. To withdraw your question, please press star 11 again. Please stand by while we compile the Q and A roster. And our first question comes from Jon Arfstrom of RBC Capital Markets. Your line is open.

Jon Arfstrom (Equity Analyst at RBC Capital Markets)

Thanks. Good afternoon everyone. Hi John. This all looks good, but maybe loans and margin, I guess. Can you guys talk a little bit about the billion two plus in originations? Kind of where that’s coming from in general trends? It seems maybe a little better than a typical first quarter. But just give us an …

Full story available on Benzinga.com

This post was originally published here
Five Point Holdings (NYSE:FPH) reported first-quarter financial results on Thursday. The transcript from the company’s first-quarter earnings call has been provided below.

Benzinga APIs provide real-time access to earnings call transcripts and financial data. Visit https://www.benzinga.com/apis/ to learn more.

The full earnings call is available at https://event.choruscall.com/mediaframe/webcast.html?webcastid=gpQnhiUn

Summary

Five Point Holdings LLC reported a consolidated net loss of $5 million for the first quarter of 2026, primarily due to the timing of land sales.

The company has announced a $40 million share repurchase program, with the intention to maintain substantial liquidity even after execution.

Despite geopolitical uncertainties and rising mortgage rates, Five Point Holdings LLC remains confident in long-term demand for its California-based home sites, due to a chronic undersupply in those markets.

The company reaffirmed its full-year 2026 guidance, expecting approximately $100 million in earnings, with earnings weighted towards the latter half of the year.

Five Point Holdings LLC ended the quarter with $550.1 million in liquidity, including $332 million in cash and cash equivalents, and maintains a debt to total capitalization ratio of 16.3%.

Strategically, the company is focused on optimizing home site value, maintaining a lean operating structure, matching development expenditures with revenue generation, and expanding through capital-light growth initiatives.

The Hearthstone Platform secured $600 million in new equity commitments, enabling approximately $1 billion in capital deployment, and currently manages approximately $3.4 billion in assets.

The company is progressing with its master-planned communities, with developments in Valencia and San Francisco, and anticipates significant land sales and development activities in upcoming quarters.

Full Transcript

OPERATOR

Greetings and welcome to the Five Point Holdings LLC first quarter 2026 conference call. As a reminder, this call is being recorded. Today’s call may include forward looking statements regarding Five Point Holdings LLC’s financial condition, Operations, Cash Flow, Strategy, acquisitions and prospects. Forward-looking statements represent Five Point Holdings LLC’s estimates on the date of this conference call and are not intended to give any assurance as to actual future results. Because forward looking statements relate to matters that have not yet occurred, these statements are inherently subject to risks and uncertainties. Many factors could affect future results and may cause Five Points actual activities or results to differ materially from the activities and results anticipated in forward looking statements. These factors include those described in today’s Press release and FivePoint’s SEC filings, including those in the Risk Factors section of Five Point Holdings LLC’s most recent annual report on Form 10K filed with the SEC. Please note that Five Point assumes no obligation to update any forward looking statements. Now I would like to turn the call over to Dan Heddegan, President and Chief Executive Officer.

Dan Heddegan (President and Chief Executive Officer)

Thank you. Good afternoon and thank you for joining our call. I have with me today Mike Alvarado, our Chief Operating Officer and Chief Legal Officer Kim Tobler, our Chief Financial Officer and Leo Key, our Senior Vice President of Finance and Reporting. Stuart Miller, our Executive Chairman, is joining us remotely on today’s call. I’ll update you on our first quarter results and provide an overview of the current state of our business, including our operating strategy and expectations for the remainder of 2026. Mike will then discuss our Hearthstone Venture and other growth initiatives in more detail, after which Kim will review our financial results and outlook. We’ll then open the line for questions. Turning to the first quarter as expected, we began 2026 with a relatively quiet quarter from a land sales perspective and reported a consolidated net loss of $5 million. This result was driven primarily by the timing of land sales, as we did not have any significant residential land closings during the quarter. As we discussed in prior periods, our earnings are inherently tied to the timing of land transactions and we expect variability from quarter to quarter depending on when these sales occur. From a revenue standpoint, we generated $13.6 million during the quarter, primarily from management services associated with our Great Park and Hearthstone segments. From a balance sheet perspective, we ended the quarter with total liquidity of $550.1 million, including 332 million of cash and cash equivalents. This level of liquidity continues to provide us with substantial flexibility to operate the business, manage through market cycles and pursue strategic opportunities, including the $40 million share repurchase that we announced today, which I’ll discuss in more detail later in my remarks. Operationally, activity across our communities remain steady. At the Great Park, builders sold 82 homes during the quarter while Valencia saw 90 home sales. While these volumes reflect a more measured pace than we saw at certain points in 2025, they demonstrate continued engagement from home buyers even in a more challenging environment. As we look ahead, we continue to expect our earnings in 2026 to be weighted toward the third and fourth quarters as land sales close and fee based income grows. Let me now turn to the market. The current market environment is unsettled and consumer confidence has been impacted by a number of factors including geopolitical uncertainty stemming from the conflict in the Middle East, increased volatility in financial markets and mortgage rates that have risen again recently after trending down. Briefly, we’re seeing the impact of these dynamics across the home building sector as consumers have been hesitant to make large purchase decisions in uncertain environments. Prior to starting the conflict in the Middle East, we saw green shoots of improvement in consumer confidence driven in part by a reduction in mortgage rates and believe that markets and demand will recover following a resolution of the conflict. These recent trends have translated into slower absorption rates and a more cautious approach by builders in committing to new land purchases in the near term. That said, since our communities are located in California markets that remain chronically undersupplied, we continue to see demand for our home sites. With our liquidity and balance sheet, we have the flexibility to adjust the pace and structure of our land sales in order to protect long term value. I’ll share more about our land sales during my community updates. Let me now turn to the $40 million share repurchase that our board has approved. We believe the share repurchase gives us the ability to opportunistically deploy capital at an attractive return given that our shares are currently trading at a significant discount to book value. Importantly, the repurchase has been structured to preserve financial flexibility. Even after execution, we expect to maintain substantial liquidity to support our operations, development activities and strategic growth initiatives. Let me now turn to our operating strategy. As a reminder, our strategy is built around four key elements. First, we are focused on optimizing home site value within our master plan communities by aligning land sales with home builder demand. In the current environment, this means being disciplined and patient, in some cases moderating the pace of land sales or using different land sales structures to maintain long term value. Second, we are maintaining a lean operating structure …

Full story available on Benzinga.com

This post was originally published here

Newmont (TSX:NGT) held its first-quarter earnings conference call on Thursday. Below is the complete transcript from the call.

Benzinga APIs provide real-time access to earnings call transcripts and financial data. Visit https://www.benzinga.com/apis/ to learn more.

The full earnings call is available at https://events.q4inc.com/attendee/351410623

Summary

Newmont reported strong Q1 2026 results with significant free cash flow generation of $3.1 billion and $3.8 billion in cash flow from operations.

The company faced operational challenges like a magnitude 4.5 earthquake near Cadia but managed to ensure safety and expects to return to full capacity by end of Q2.

A new $6 billion share repurchase authorization was announced, reinforcing Newmont’s capital allocation framework to return value to shareholders.

Despite geopolitical and energy cost pressures, Newmont maintains its cost guidance, leveraging productivity improvements and supply chain management.

Key operational highlights include strong gold, copper, and silver production, with record free cash flow driven by favorable metal prices and cost management.

Full Transcript

OPERATOR

Ask questions. Please note that this event is being recorded. I would now like to turn the conference over to Newmont’s group Head of treasury and Investor Relations, Neil Backhouse. Neil, please go ahead.

Neil Backhouse (Group Head of Treasury and Investor Relations)

Thank you, Christine. Hello everyone, and thank you for joining Newmont’s first quarter 2026 results conference call. Joining me today are Natasha Foljoun, our President and Chief Executive Officer, Peter Wexler, our Interim Chief Financial Officer and Chief Legal Officer, and other members of our management team who will be available to answer questions at the end of the call. Before we begin, please take a moment to review our cautionary statement shown here and refer to our SEC filings, which can be found on our website. With that, I’ll turn the call over to Natasha.

Natasha Foljoun

Thank you, Neil, and hello everyone. Newmont’s focus on operational excellence continues to deliver consistent and predictable performance, with our first quarter results demonstrating that we are on track to achieve our 2026 guidance. And importantly, this consistency is reflected in our compelling financial results. Our unrivalled portfolio of high quality operations and projects, combined with our focus on cost discipline and productivity, positions us to capture the benefits of higher commodity prices even amid the operational headwinds we experienced in the first quarter, delivering margin expansion and robust free cash flow generation. The benefits of record free cash flow generation are flowing through our enhanced capital allocation framework, resulting in continuous reinvestment in our business, a predictable quarterly dividend and ongoing share repurchases, supplemented by a new $6 billion share repurchase authorisation. But before we review our quarterly results in more detail, I want to begin with an update on Cadia following the magnitude 4.5 earthquake that occurred near the operation on April 14. As mentioned in our released statements, our immediate priority was the safety of our people. Our safety protocols operated as designed and within minutes of the event, all personnel working underground were moved to safe locations before being brought to surface in the subsequent hours following the event. And I’m really pleased to share that there were no injuries. Based on our initial findings, the damage appears limited, reflecting the strength of our ground control systems. I’m pleased to report that the underground power and dewatering systems have been restored and we received approval from the regulator earlier this week to begin repairs. Importantly, all surface infrastructure was inspected immediately following the event and sustained no damage. This includes our tailings facilities. From an operational standpoint, we are currently processing surface stockpiles and expect underground rehabilitation to be completed in the next five weeks, enabling return to 80% operating capacity, with full recovery expected by the end of the second quarter. As a result, second quarter production is expected to be lower due to this short gap in milk feed, with operations returning to normal levels beginning the third quarter. I want to recognise and personally thank the team at Cadia. We responded quickly and effectively, implementing established emergency procedures to ensure the safety of all personnel and positioning the operation for the best possible recovery. Turning now to our operational performance, in the first quarter we produced 1.3 million ounces of gold, 30,000 tonnes of copper and 9 million ounces of silver, with both copper and silver volumes supporting a favorable by product cost profile for the quarter. As the third largest silver producer in the world. We also benefited from a favorable silver price environment, further supporting our free cash flow generation and unit cost management. The performance translated into strong financial results including $3.8 billion in cash flow from operations after working capital and $3.1 billion in free cash flow, marking another all time quarterly record which is especially notable given the seasonal working capital headwinds typically experienced in the first quarter of each year. During the quarter we also received approximately $321 million in after tax proceeds from the sale of equity investments in Solgold and Greatland Resources along with contingent payments related to the divestments of Musselwhite and Cripple Creek Invicta last year, bringing total after tax proceeds received from our non core divestiture program to over $4.6 billion, touching briefly on cost performance which Peter will cover in a little bit more detail shortly. Over the last few weeks the world has experienced a notable increase in energy prices and impacts to global supply chain dynamics as a result of the ongoing conflict in the Middle East. We continue to monitor the geopolitical environment and its potential impact on cost closely but remain encouraged by our demonstrated ability to effectively manage cost and improve productivity and are therefore maintaining our full year cost guidance at this time. Taking our strong first quarter operational and financial performance into account, we expect to remain well positioned to continue executing on the enhanced capital allocation allocation framework that we have announced in February. Since our last earnings call, we have reduced debt by an additional $42 million and are pleased to share that we have returned $2.7 billion to shareholders through both regular dividends and ongoing share repurchases, fully exhausting our previous repurchase authorisation. In line with our established approach, our Board has approved another $6 billion shared repurchase program, reinforcing our enhanced capital allocation framework and disciplined approach to returning excess cash to shareholders. This framework is designed to systematically reduce Newmont’s share count and in doing so driving sustainable per share dividend growth and improved across other key per share metrics. Building on our strong first quarter performance and looking ahead to the rest of the year, we remain on track to achieve our 2026 guidance, continue generating robust free cash flow from our world class portfolio and return capital to shareholders in a consistent manner. Operationally we delivered a stronger than expected quarter, especially considering challenging conditions faced by several of our sites including the bushfires at Boddington where we have since made a full recovery with full throughput capacity back to normal levels for the second quarter we’ve had extreme snowfall at Brucejack and record levels of rainfall at Tanami. This performance underscores the strength and resilience of our world class portfolio. Build around high quality long life assets that are intentionally diversified both operationally and jurisdictionally to deliver consistent performance across a range of operating conditions, not only withstanding volatility as it arises but also capturing value from it. Giving this strong start to the year, we believe it is appropriate to maintain our existing production whiting. Our first quarter outperformance provides prudent flexibility to absorb any impact from temporary interruptions to mole feed at CADI in the second quarter as we progress recovery efforts following the earthquake first quarter production was driven by several key factors. At Cadia we saw a step up in gold and copper production compared to the fourth quarter supported by improved throughput and favourable grades from the current panel cave At Marian production also increased compared to the fourth quarter as we begin to access higher grades from Marion to Pit as planned. At a half zero south production increased due to higher mining rise and improved underground draw point availability. At Yanacocha we delivered stronger leach production performance from high grades out of Catcher Main and as we discussed last quarter we have begun executing on a highly capital efficient plan to continue mining operations through 2026 and into 2027, adding low cost ounces that are expected to benefit our production profile in 2027. With further potential upside, Minasquito delivered strong co product production in the quarter, particularly silver and zinc as we continue to process stockpiles during the transition phase between phase seven and phase eight and finally the ramp up at Ahafone north continues to progress very well and in line with plan in its first full year of commercial production. We also achieved several notable milestones in our projects in execution during the quarter. At our Tanami Expansion 2 project work has now fully resumed following the temporary pause earlier in the quarter. With the underground primary crusher now commissioned and the materials handling system on track for completion by the end of the second quarter, we have also completed the investigation into the fatality that occurred at Tanami earlier this year and are committed to ensuring the learnings are shared across our organisation and with a broader industry. At Cadia, both PC23 and PC12 are progressing well and is tracking to plan as they move through key phases of development. Newmont’s first quarter performance continues to highlight the strength and resilience of our portfolio as well as the progress we have made to stabilise and improve our operations, positioning us to deliver consistent performance and achieve our full year commitments. I will now turn the call over to Peter to walk through our financial results for the quarter.

Peter Wexler (Interim Chief Financial Officer and Chief Legal Officer)

Thank you Natasha and hello everyone. Newmont delivered outstanding financial results in the first quarter driven by strong operational performance that Natasha just outlined and the supportive metal price environment. Our continued focus on disciplined execution resulted in adjusted EBITDA of $5.2 billion in adjusted net income of $2.90 per diluted share for the quarter. But most notably, Newmont generated $3.8 billion in cash flow from operations after working capital and a record $3.1 billion of free cash flow even after making approximately $1.3 billion in cash tax payments during the quarter. Gold all in sustaining costs were below our full year guidance at 1,029 dollars for the first quarter. On a byproduct basis, our cost profile benefited meaningfully from stronger than expected co product pricing and sales volumes, lower cost applicable to sales as a result of disciplined capital spending and the timing of sustaining capital. As Natasha noted earlier, we are maintaining our cost guidance and while higher oil prices may create incremental pressure, we view this as manageable at this time and are actively working to mitigate the impact rather than viewing it as a risk to our operating plan. And as a reminder, the guidance we provided in February was based on a $70 per barrel Brent assumption with diesel making up approximately 6% of our direct operating cost for every $10 per barrel change in oil prices we we expect approximate $60 million impact on cost which equates to roughly a $12 per ounce impact on all in sustaining costs. We are not currently experiencing any disruption to fuel availability and continue to maintain business continuity by leveraging our scale and strong supply chain team which is working closely with suppliers to proactively identify and manage risks. While higher fuel prices began to materialize in March, we remain focused on offsetting these pressures through continued cost and productivity improvements across our operations. In addition, in February we quantified the potential annual impact of the newly introduced Ghana Sliding Scale Royalty on our cost profile. While this will represent an incremental cost headwind of approximately $25 per ounce in 2026, our goal is to mitigate the impact through disciplined cost management and productivity initiatives. Looking ahead to the second quarter, we expect production to be slightly below the first quarter, …

Full story available on Benzinga.com

This post was originally published here

On Thursday, Digital Realty Trust (NYSE:DLR) discussed first-quarter financial results during its earnings call. The full transcript is provided below.

Benzinga APIs provide real-time access to earnings call transcripts and financial data. Visit https://www.benzinga.com/apis/ to learn more.

View the webcast at https://edge.media-server.com/mmc/p/dw3hofjx/

Summary

Digital Realty Trust delivered its second-highest bookings quarter, highlighting strong demand and signed its largest megawatt leasing deal in company history.

The company’s development pipeline increased by over 50% to 1.2 gigawatts under construction, with a significant portion pre-leased.

Core FFO exceeded expectations at $2.04 per share, leading to a raised 2026 core FFO per share guidance range, implying 9% growth.

The company is expanding its global connectivity footprint with strategic acquisitions in Europe and APAC, and is focused on AI-driven workloads.

Digital Realty Trust’s balance sheet is strong, with leverage reduced to a multi-year low, supporting its growth initiatives across hyperscale and enterprise segments.

Full Transcript

OPERATOR

Good afternoon and welcome to the Digital Realty first quarter 2026 earnings call. Please note this event is being recorded during today’s presentation. All parties will be in a listen only mode. After the following the presentation we’ll conduct a question and answer session. Callers will be limited to one question and we will aim to conclude at the top of the hour. I will now turn the call over to Jordan Sadler, Digital Realty Senior VI President of Public and Private Investor Relations Jordan. Please go ahead.

Jordan Sadler (Senior Vice President of Public and Private Investor Relations)

Thank you Operator and welcome everyone to Digital Realty Trust’s first quarter 2026 earnings conference call. Joining me on today’s call are President and CEO Andy Power and CFO Matt Mercier. Chief Investment Officer Greg Wright, Chief Technology Officer Chris Sharp and Chief revenue officer Colin McLean are also on the call and will be available for Q and A. Management will be making forward looking statements including guidance and underlying assumptions on today’s call. Forward looking statements are based on expectations that involve risks and uncertainties that could cause actual results to differ materially. For further discussion of risks related to our business our Form 10-K subsequent filings with the SEC. This call will contain certain non GAAP financial information. Reconciliations to the most directly comparable GAAP measure are included in the supplemental package furnished to the SEC and available on our website. Before I turn the call over to Andy, let me offer a few key takeaways from our first quarter results. First, we delivered the second highest bookings quarter ever for Digital Realty, underscoring the diversity and durability of demand across our platform. We signed the largest megawatt leasing company history while simultaneously setting another quarterly record in the 0 to 1 megawatt plus interconnection category. Second, 0 to 1 megawatt signings boosted our 2026 outlook while the greater than a megawatt leasing increased our total backlog to a total $1.8 billion or $1 billion at Digital Realty share, providing strong visibility for our growth into 2027 and 2028. Third, our development pipeline increased by over 50% sequentially to 1.2 gigawatts under construction and is now 61% pre leased at an 11.4% average expected yield, mainly driven by successful leasing and our continued efforts to position capacity to support our customers growing requirements. And finally, we exceeded our earnings expectations, posting core FFO of $2.04 per share for the first quarter, delivering strong double digit year over year growth. Given strong execution across our product offering visibility from our backlog and confidence in our operating outlook, we are raising our 2026 core FFO per share guidance range, implying 9% growth at the midpoint. With that, I’d like to turn the call over to our President and CEO Andy Power.

Andy Power (President and CEO)

Thanks Jordan, and thanks to everyone for joining our call Digital Realty Trust got off to a record start in the first quarter of 2026, a clear continuation of the momentum we built throughout 2025. Demand for digital infrastructure remains robust, execution across platform digital remains crisp and our strategy continued to resonate with customers who are navigating increasingly complex power, performance and connectivity requirements as well as mission critical on time delivery challenges. We continue to gain market share in our zero to one plus interconnection product category while providing needed hyperscale capacity in our greater than a megawatt category on an expanding playing field. As the global economy continues to digitize, data center infrastructure has moved from being a supporting layer to to being foundational, AI adoption is accelerating compute intensity, cloud demand remains resilient and enterprises are continuing to embrace technology to improve productivity and efficiency across their core operations. At the same time, power availability, labor and supply chain risks and community concerns have become meaningful constraints on our industry, creating a widening gap between theoretical demand and deployable capacity. Against that backdrop, only a limited number of providers can deliver fit for purpose capacity, future scalability and deep connectivity across multiple metros and regions with the certainty that customers require. Customers are coming to Digital Realty seeking capacity close to users and clouds to interconnect within and across markets and the ability to scale as requirements evolve, particularly as AI driven workloads move from experimentation to production. This demand environment translated into strong leasing activity during the first quarter, reflecting both the breadth of customer needs and the value of our global platform. We signed over 700 million of new leases in the quarter, or 400.3 million at our share, representing Digital’s second highest leasing quarter and nearly 70% above our next highest quarter. Strength was broad based in the quarter with another record of 98 million of leasing within our zero to one megawatt plus interconnection product where proximity, connectivity and access to relevant enterprises and service providers matter most. Notably, a record 21% of 0 to 1 megawatt bookings were AI oriented requirements. We continue to increase our market share in this category while growing our customer base with 116 new logos added in the quarter during the first quarter, we continue to see both enterprises and hyperscalers continue to spread across platform Digital. A few examples include A global biotech company is optimizing its AI infrastructure on platform Digital to enable AI modeling, factory design and diagnostics for safety and reliability. A global social and AI platform is expanding on Digital Realty Trust with a new AI inference node to serve a regional customer base and also expanding edge capabilities across global metros while deploying a new subsea cable interconnection node. A multinational pharmaceutical company is deploying its AI infrastructure on Digital Realty Trust to meet growing R and D infrastructure and computing needs. A leading technology services company is leveraging Digital Realty Trust to create a distributed inference AI ready ecosystem to support advanced AI workloads for growing enterprise demand. A global cloud computing and content distribution provider is expanding their footprint on Digital Realty Trust by leveraging the market leading connectivity available to support edge POP expansions and a technology services company chose Digital Realty Trust to enable cloud based platforms by leveraging their available connectivity, security and architecture to support their future growth. These deployments highlight the strength of Digital Realty Trust in supporting increasingly distributed connectivity intensive workloads, enabling customers to deploy, connect and scale critical infrastructure across a global interconnected platform. The momentum in our interconnection led product set is being reinforced by the continued expansion of our global connectivity footprint in Europe. We expanded our footprint in the quarter by entering Sofia, Bulgaria through the acquisition of telepoint, one of Southeast Europe’s most important emerging interconnection products. This addition deepens our presence along the Eastern Mediterranean connectivity corridor and complements our existing markets in Southern Europe. At the same time, recent land acquisitions in Portugal and Milan position us to extend this connectivity rich capacity along critical subsea and terrestrial routes, complementing existing assets in Marseille, Athens, Crete and our soon to be open facility in Barcelona, reinforcing our ability to serve customers that require low latency access, geographic diversity and scalable interconnection across the region. In apac, we are taking a similar approach to expanding connectivity in strategically important markets. Our entry into Malaysia will add a highly network dense facility in cyberjaya that complements our established presence in Singapore, Jakarta and other key regional hubs. This expands our customers ability to deploy infrastructure close to end users while maintaining seamless connectivity across markets and provides a clear path for future scalability as requirements continue to evolve. Taken together, these investments reflect a consistent strategy globally building interconnected campuses in the right locations to support customers as their IT architectures are infused with AI oriented workloads become more distributed, more latency sensitive and increasingly connectivity driven. Switching gears to the greater than a megawatt category, we signed the largest single lease in digital realty history this quarter, a 200 megawatt AI inference oriented lease with a AA rated hyperscaler in Charlotte. This was a milestone transaction for digital realty, representing the largest lease in our history and our first hyperscale deployment in this market, validating our hub and spoke expansion strategy in Charlotte and complementing the connectivity hub we have long operated and are currently expanding in Uptown. The breadth of our greater than 1 megawatt activity in the quarter was also notable as signings in this category exceeded the level achieved in the prior 3 quarters. Even when excluding the record lease, we signed 10 plus megawatt leases in each of Dallas, Sao Paulo and Tokyo during the quarter, highlighting the accelerating pace at which large AI workloads are moving into scaled production environments and the continued global appetite for compute. Given record low vacancies in most of our existing data center markets, we continue to target land and power opportunities adjacent to our connected campuses, allowing us to support large scale deployments while remaining connected to core cloud and connectivity networks. To meet those needs, we are expanding our ability to deliver hyperscale capacity where land, power and certainty of execution matter most. In the first quarter we demonstrated the ability and expertise necessary to source position and then lease hyperscale IT capacity for development in less than 18 months. Building on this success in Charlotte, we have a second 200 megawatt building that will follow building one and we launched construction on another 200 megawatt development site in Atlanta. We also have in position today or are preparing substantial capacity for development in Dallas, Northern Virginia, Hillsborough, Sao Paulo, Frankfurt, Paris, Tokyo, Osaka and Seoul. Given the significant development starts in the first quarter, our development pipeline scaled by more than 60% to $16.5 billion at 100% share at strong double digit unlevered returns. While this marks a historic ramp in our ongoing activity, we remain disciplined and well positioned to continue to meet this opportunity. As we think about our ability to support our customers long term growth needs. The combination of land holdings, power availability, supply chain, execution and capital all matter and each must be sourced in a deliberate and scalable manner. Over the last several years, we have been strengthening each of these disciplines so that we can continue to deliver capacity reliably, particularly as projects become larger, more capital intensive and thereby more complex to execute. That same discipline has guided the evolution of our capital Strategy. In early 2023, we announced a plan to diversify our capital sources by utilizing more private capital, including joint ventures in our plans. We then evolved that approach with our first US Hyperscale Closed End Fund, significantly expanding the pool of capital available to support hyperscale development while preserving alignment through our retained ownership and management role. During the first quarter, we continue to scale our strategic private capital platform shifting to broaden our foundation to support the capitalization of stabilized hyperscale data centers. The objective is straightforward to align long duration institutional capital with the long live nature of our assets and our customers digital infrastructure needs. By continuing to diversify, evolve and expand our capital sources, we are enhancing our ability to secure land, power and equipment, to scale development responsibly and to deliver capacity when and where our customers need it while continuing to drive attractive risk adjusted returns for our shareholders. And with that, I’ll now turn the call over to our cfo Matt Mercier.

Matt Mercier (Chief Financial Officer)

Thank you Andy. As Andy outlined, the first quarter reflected strong demand across our platform combined with disciplined execution resulting in record quarterly financial results. In the first quarter, Digital Realty again posted strong double digit growth in revenue and adjusted EBITDA, reflecting continued momentum in our 0 to 1 megawatt interconnection business commencements from our growing backlog, healthy releasing spreads, modest churn and a favorable FX environment. We achieved these strong results while maintaining significant dry powder to expand and invest in our now 6 gigawatt development pipeline and simultaneously reducing our leverage to a multi year low of 4.7 times at quarter end. Overall, the strong environment and our favorable positioning are translating into better than anticipated execution and results and we are continuing to lean into the opportunity we are seeing with discipline. During the first quarter we signed leases representing 707 million of annualized rent at 100% share or 423 million at Digital Realty share. This represented the strongest leasing start to the year in Digital Realty history and as Andy noted, demand remains robust across our product categories. New leasing was particularly strong in the Americas which represented over 75% DLR share of bookings in the quarter, while we also posted a new quarterly leasing record in the AAPAC region, our 0 to 1 megawatt plus interconnection products that continued its strong momentum posting 98 million of new signings marking a third quarterly record in the past year and reflecting a 40 plus percent increase in 01 bookings versus first quarter 2025. The 0 to 1 megawatt plus Interconnection category was driven by a record pace in the Americas region and a meaningful step up in the largest capacity band within the product category reflecting an acceleration of larger enterprise deployments. Further highlighting this strength, we also saw a new record level of activity in the 1 to 3 megawatt leasing band in the quarter. Interconnection bookings remained strong at 18.6 million, 24% higher than a year ago. The APAC and North America regions led this growth driven by demand for our bulk fiber and service fabric products. The record lease signing in Charlotte was the biggest contributor to the 280 million of America’s leasing performance in our greater than a megawatt category. Pricing in this product segment remained healthy, averaging $181 per kilowatt in the quarter, validating the expansion of our hyperscale product in this market. The total backlog at the end of the first quarter reached a new record of of 1.8 billion, reflecting the robust data center fundamentals we are experiencing and our ability to capitalize on this demand. At Digital Realty Share, the backlog reached a new record of 1 billion at quarter end as 423 million of new bookings exceeded the strong 204 million of commencements in the quarter. Looking ahead, we have 544 million of leases scheduled to commence somewhat radically throughout this year, with 247 million of leases to commence in 2027 and another 242 million commencing in 2028 and beyond. While the successful execution of our 0 to 1 megawatt/interconnection segment is helping to accelerate near term growth, our scaling backlog is improving our visibility over the long term, helping to support strong sustainable growth. During the first quarter we signed 193 million of renewal leases at a blended 5% increase on a cash basis. Renewals were heavily weighted toward our shorter term 0 to 1 megawatt leases which represented over 80% of our total renewal activity with 157 million of colocation renewals at 4.3% uplift greater than the megawatt renewals dipped to just $32 million in the quarter at a 7.4% cash re leasing spread driven by deals in Vienna, London and Silicon Valley. As per earnings, we reported core FFO of $2.04 per share for the first quarter, up 15% year over year, reflecting the ongoing benefit of strong data center leasing and development related lease commencements along with increased fee income associated with our growth in our strategic private capital platform. Same Capital Cash NOI growth continued to be strong in the first quarter, increasing by 7.9% year over year as strong data center rental revenue growth was balanced by elevated operating expense growth on a constant currency basis. Same Capital cash NOI rose 2.5% in the quarter, largely reflecting the above trend operating expense growth versus the prior year period. Given the conflict in the Middle east, energy costs and supply …

Full story available on Benzinga.com

This post was originally published here

Intel (NASDAQ:INTC) released first-quarter financial results and hosted an earnings call on Thursday. Read the complete transcript below.

Benzinga APIs provide real-time access to earnings call transcripts and financial data. Visit https://www.benzinga.com/apis/ to learn more.

View the webcast at https://edge.media-server.com/mmc/p/ndwfxieh/

Summary

Intel reported Q1 2026 revenue of $13.6 billion, exceeding expectations with strong demand across all business units.

The company continues to see robust demand for its Xeon server CPUs, with new products in full volume production driving momentum.

Intel’s strategic focus includes expanding its foundry business and partnerships, evidenced by collaborations with SpaceX, XAI, and Tesla.

The company plans to increase its wafer and packaging capacities, with expectations of a strong second half of the year despite some supply constraints.

Management highlighted significant growth in AI-driven businesses, which now account for 60% of revenue, and the strategic importance of its x86 CPU franchise.

Full Transcript

OPERATOR

Thank you for standing by and welcome to the Intel Corporation Earnings First Quarter Earnings 2026 Earnings Conference Call. At this time, all participants are in listen only mode. After the speaker’s presentation, there will be a question and answer session. To ask a question during the session, you’ll need to press star 11 on your telephone. If your question has been answered and you’d like to remove yourself from the queue, simply press star 11 again. As a reminder, today’s program is being recorded. And now I’d like to introduce your host for today’s program, Mr. John Pitzer, Corporate Vice President of Investor Relations. Please go ahead, sir. Thank you Jonathan. And good afternoon to everyone joining us today.

John Pitzer (Corporate Vice President of Investor Relations)

By now you should have received a copy of the Q1 earnings release and earnings presentation, both of which are available on our Investor relations website, intc.com for those joining us online today, the earnings presentation is also available in our webcast window. I am joined today by our CEO Lip Bhutan and by our CFO David Zinsner. LipU will open with comments on first quarter results as well as provide an update on the progress we’re making on our strategic priorities. Dave will then discuss our overall financial results including second quarter guidance before we transition to answer your questions. Before we begin, please note that today’s discussion does contain forward looking statements based on the environment as we currently see it and as such are subject to various risks and uncertainties. It also contains references to non GAAP financial measures that we believe provide useful information to our investors. Our earnings release, most recent annual report on Form 10K and other filings with the SEC provide more information on specific risk factors that could cause actual results to differ materially from our expectations. They also provide additional information on our non GAAP financial measures, including reconciliations where appropriate to our corresponding GAAP financial measures. With that, let me turn things over to Lipu.

Lipu

Thank you John and good afternoon everyone. Q1 results demonstrate continued and steady progress across the business reflecting strong demand for our products and disciplined execution to expand available supply. Revenue, gross margin and earning per share were all above the high end of guidance marking our sixth consecutive quarter of exceeding financial expectations. Even as we improve factory output, demand continues to run ahead of supply for all our businesses, especially for Xeon server CPUss where we expect sustained momentum this year and next. Intel 3 based Xeon 6 and Intel 18A base core Series 3 products are now in full volume production RAM and each represents the fastest new product RAM in five years. We are maximizing and optimizing our factory output to meet customer needs. It is Our top priority, intel is now a very different company than when I first joined over a year ago. We have taken and continue to take deliberate steps to rebuild intel into more competitive and more profitable company. Our cultural transformation is well underway and we are embracing our roots as data driven, paranoid and engineering centric company. We are also listening closely to our customers and putting them at the center of everything we do. Intel processes some of the most vital assets necessary to be successful and to flourish in this era of extraordinary opportunity for the semiconductor industry. With a stronger balance sheet, a new leadership team, a rejuvenated and motivated workforce and a renewed focus on engineering execution, we are turning our attention squarely towards innovation to capture opportunities in the near term and to position the company for robust growth in the long term. Driven by tremendous demand for AI, the semiconductor industry TAM is now approaching $1 trillion. Intel is well positioned to benefit from this demand with three strategically important assets. Our x86 CPUs franchise, our advanced packaging technology and our vast manufacturing network. Artificial intelligence is now moving into the real world towards a more distributed inference and reinforced learning workloads like agentic physical AI and robots and edge AI. This shift is now beginning to show up in in our results as I want to spend some time on this today. For the last few years the story around high performance computing was almost exclusively about GPU and other accelerators. In recent months we have seen clear sign that the CPUs is reinserting itself as the indispensable foundation of the AI era. CPUs now serves as the orchestration layer and critical control plane for the entire AI stack. This is not just our wishful thinking, it is what we hear from our customers and it is evident in the demand profile for our products. Xeon server demand is seeing strong and sustained momentum. Customers are deploying server CPUss along accelerators in the ratio that is moving back towards cpu. The accelerator remains central to frontier AI and we will continue to participate, innovate and partner in that category. Our recent announcement with Sampanova Systems is an example of such partnership on hectogeneous compute architectures. But the backbone of AI computing in production remains a CPUs and anchor architecture. That is good news for the x86 ecosystem, it is great news for intel and it is a structural reason. I’m confident that CPUs franchise will continue to be a meaningful growth engine for the company in the years ahead, not just a quarters ahead. Turning to Intel Foundry the accelerating deployment of AI infrastructures creates a meaningful opportunity for us as we continue to build our external foundry business. I’m pleased with the progress we have made in foundry technology development over the last year, even though I will continue to remind you this will be a long journey for us. We have made steady progress with Intel 4 and Intel 3 and 18A years are now running ahead of the internal projections representing a meaningful infection in our execution and our factory finished good output. We also continue to make steady progress on our advanced packaging technologies, including additional growth in customer backlog in the quarter on Intel 18AP and Intel 14A. We continue to be encouraged by our external engagements. Intel 14Amaturity, yield and performance are outpacing Intel 18A at a similar point in time and we continue to develop PDKs with multiple customers actively evaluating the technology. Their partnership has been critical and their feedback is continuing to help us define the the technology so that we can cater to their needs. We expect to see earlier design commitments emerge beginning in the second half of 2026 and expanding into the first half of 2027. I’m particularly pleased that our progress today has driven us to lend more of our own future product types on Intel 14a as well. a time when advanced wafer capacity is in the short supply, this enables us to have better control over our supply chain. Intel has pioneered nearly every major innovation that has enabled dimensional scaling and high volume manufacturing of silicon transistors over the last six decades. We have always been willing to take measured risks that have eventually passed away for step function improvements in transistor density, cost, power and performance. As we look to continue challenging the status quo. I can think of no better partners than Elon Musk. We recently announced our partnership with SpaceX, XAI and Tesla to support Terrafab. Elon and I share a strong conviction that global semiconductor supply is not keeping pace with a rapid acceleration and in demand. We are excited to explore innovative ways to refactor silicon process technology, looking for unconventional ways to improve manufacturing efficiency that will eventually lead to dynamic improvements in the economics of semiconductor manufacturing. A year ago the conversation about intel was about whether we could survive. Today it’s about how quickly we can add manufacturing capacity and scale our supply to meet enormous demand for our products. This is a fundamentally different company today and we still have a lot of work ahead. I would like to take this opportunity to thank our many customers, partners and our hard working employees across the world for their contributions towards building a new Intel. I remain firmly convinced of and focused on the opportunity ahead for Intel. With that I will pass it to Dave.

Dave

Thank you Lipu. We delivered robust Q1 results, reflecting strong demand and better than expected available supply. We also benefited from improved product mix and pricing actions in part to offset higher costs. First quarter revenue was $13.6 billion, $1.4 billion above the midpoint of our guide. Q1 revenue would have been meaningfully higher, but demand continues to outpace our growing supply. Our collective AI driven businesses now represent 60% of revenue and grew 40% year over year. These results reflect real and deliberate changes we have made to be more responsive and accountable this quarter. Our teams worked directly and diligently with customers to reach mutually beneficial outcomes in weeks, not months. We value the partnership and support shown by our customers, partners and suppliers as we work to navigate this environment together. Non GAAP gross margin came in at 41%, approximately 650 basis points ahead of guidance due to the combination of higher volume which included previously reserved inventory, mix and pricing. In addition, better yields on Intel 18a offset some of the higher costs we we always incur in the early part of ramping a new node. We delivered first quarter non GAAP earnings per share of $0.29 versus our guidance of break-even on higher revenue, stronger gross margins and continued spending discipline. Q1 EPS included a roughly $0.06 one time gain in interest and other Q1 operating cash flow was $1.1 billion with gross CapEx of $5 billion in the quarter and adjusted free cash flow of -2 billion. Moving to segment results, CCG revenue was $7.7 billion, down 6% sequentially and better than our expectations. Even with improved factory output, demand outstripped supply against a client TAM that remains resilient to despite industry wide component shortages and inflationary pressures. Our AI PC revenue grew 8% sequentially and now represents greater than 60% of our client CPU mix. Operating profit for CCG was $2.5 billion, 33% of revenue and up approximately $300 million quarter over quarter on improved mix and product margins, sales of previously reserved inventory better 18A yields and lower operating expenses. Within the quarter, CCG launched Core Ultra Series 3 and expanded our offerings across consumer, commercial and edge. This has proven to be our strongest product launch in five years, delivering better performance per watt, stronger integrated graphics and more capable on device AI features, all while maintaining our broad ecosystem of compatibility with that partners and customers value in Q1. CCG also expanded the reach of our Core family by launching the intel Core Series 3 processor which brings the latest IP, modern features and all day battery life to the mainstream for the first time. We’re enabling a new class of mainstream systems that once again set the standard for everyday computing DCAI revenue was $5.1 billion, an increase of 7% sequentially and 22% year over year, well above expectations and reinforcing the strong year of growth for DCAI. We signaled 90 days ago. Strength continued across all segments and customers as investments in CPUs are accelerating to support the evolution of AI from foundational training to inference and from inference to agentic. We also saw strong ASIC growth with revenue up more than 30% sequentially and nearly doubling year over year. Operating profit for DCAI was $1.5 billion, 31% of revenue and up approximately $292 million quarter over quarter on improved product margins, better cycle times and yields, especially on Intel 3 and lower operating expenses within the quarter. DCAI signed multiple long term agreements including Google supporting our view that the current business momentum is Sustainable. In addition, Xeon 6 was selected as the host CPU for Nvidia’s DGX Rubicon NVL8 systems and Xeon remains the most deployed host CPU due to its industry leading memory security and networking orchestration. Lastly, DCAI also established a multi year collaboration with SAMOVA to design a next generation heterogeneous AI inference architecture combining Sammon Nova’s RDUS and Intel Xeon 6 processors. Intel foundry delivered revenue of $5.4 billion, up 20% sequentially on increased EUV wafer mix driven by Intel 3 and significant growth in 18A external foundry revenue was $174 million in the quarter. Intel foundry operating loss in Q1 was $2.4 billion and improved $72 million quarter over quarter as better yields across Intel 4.3 and 18A drove higher gross margins. This was mostly offset by increased operating expenses associated with an intentional step up in in Intel 14A investments to support both internal and external customer evaluations. As a reminder, Intel Foundry carries the bulk of the costs associated with the early ramp of Intel 18A and we expect Intel Foundry’s operating loss to improve through the year as 18A continues to ramp into volume and yields improve further within the quarter. Intel Foundry delivered output above our expectations, drove steady improvements in yields and met key 14Amilestones. Intel Foundry also added to its backlog of advanced packaging services and announced a multi year expansion of our back end facilities in Malaysia. This expansion will help support the committed demand that will begin to convert to revenue in 2027. Turning to all other revenue came in at $628 million and was up 9% sequentially due to a strong quarter for Mobileye. Collectively, the category delivered an operating profit of $102 million. Now turning to guidance as we look ahead, we remain mindful that the macroeconomic and geopolitical environments are dynamic. Views on global growth policy and trade continue to shape customer behavior and investment decisions. In addition, constraints and rising prices around key components like memory wafers and substrates are driving higher costs that could impact demand for our product at some point in the year. We’re prudently planning for PC demand to weaken in the second half of the year and expect the full year PC unit TAM to be down low double digit percent in line with industry peers and experts. Offsetting this near term customer order patterns remain very robust across all of our businesses. In addition, our confidence in the sustained growth of CPUs driven by the AI infrastructure buildout is growing. Our outlook for server CPU demand has improved over the last 90 days and we expect a strong year of double digit unit growth for the industry and for us with momentum extending into 2027. Combining all of these factors, we’re guiding Q2 revenue to a range of 13.8 to $14.8 billion, up 2 to 9% sequentially as we work hard to support the needs of all of our customers. We expect sequential revenue growth in both CCG and DCAI on improved supply and a full quarter of pricing actions, with DCAI up double digits at the midpoint of $14.3 billion. We forecast a gross margin of 39%, a tax rate of 11% and EPS of $0.20, all on a non GAAP basis. Our Q2 gross margin guide declines modestly from Q1 due to a meaningfully larger contribution from Intel 18A, still early in its ramp, and some inventory benefits in Q1 that aren’t expected to repeat in Q2. Before I close, I’ll share some additional insights on the full year. We expect our factory network to continue increasing available supply in the third and fourth quarters and though at a more measured pace than we anticipated 90 days ago, reflecting the base effect of much stronger than expected first half output. We also expect 2026 revenue on a half on half basis to follow the seasonal trends experienced over the last 10 years with servers above and PCs below. We were very pleased with Q1 gross margins and we will continue to push for gross margin expansion. It’s my top priority. Our foundry …

Full story available on Benzinga.com

This post was originally published here

Nexus NeroTech Ventures, a brain-health venture capital fund with $200 million in assets, has shut its doors as of March 31.

“Through a recent acquisition, Nexus NeuroTech Ventures has concluded its operations. The firm was founded with a deep commitment to supporting solutions that hold the greatest promise to help people with neurodegenerative, neuropsychiatric and neurodevelopmental conditions,” CEO Jordi Parramon wrote in a post on LinkedIn.

The VC firm, which was backed by Google co-founder Sergey Brin, is in the process of being merged into Brin’s family office, Bayshore Global Management, Bloomberg reported.

data-variant=”card”
data-news-mode=”manual”

>


Read Also:

Blockchain Capital Targets $700 Million For New Funds Despite Broader …

This post was originally published here
Strategic Education (NASDAQ:STRA) released first-quarter financial results and hosted an earnings call on Thursday. Read the complete transcript below.

This content is powered by Benzinga APIs. For comprehensive financial data and transcripts, visit https://www.benzinga.com/apis/.

The full earnings call is available at https://edge.media-server.com/mmc/p/ufu6dq7y/

Summary

Strategic Education Inc reported a 1% YoY decline in revenue for Q1 2026, attributed to a slight decrease in consolidated enrollment, but achieved a 3% growth in operating income due to a 2% reduction in adjusted operating expenses.

The Education Technology Services (ETS) division saw a 21% revenue increase, with Sofia Learning subscriptions and Workforce Edge partnerships driving growth. ETS now accounts for 46% of the company’s consolidated operating income.

U.S. higher education employer-affiliated enrollment grew 10%, with healthcare enrollment representing over half of total U.S. higher education enrollment. However, U.S. higher education revenue declined 4% due to unaffiliated enrollment decreases and increased discounts.

In Australia and New Zealand, total enrollment declined 3% due to regulatory constraints on international enrollment, while domestic new student growth continued. The region reported a $2.4 million operating loss, reflecting normal business seasonality.

Management expressed high confidence in achieving EBIT and EPS targets for the year, driven by technological productivity enhancements and cost management. Despite challenges, they anticipate improved enrollment trends and potential revenue growth in the coming quarters.

Full Transcript

OPERATOR

Welcome to Strategic Education’s first quarter 2026 results conference call. I will now turn the call over to Therese Wilkie, Senior Director of Investor Relations for strategic education. Ms. Wilkie, please go ahead.

Therese Wilkie (Senior Director of Investor Relations)

Thank you. Hello everyone and welcome to Strategic Education’s conference call in which we will discuss first quarter 2026 results. With us today are Carl McDonnell, President and Chief Executive Officer and Daniel Jackson, Executive Vice President and Chief Financial Officer. Following today’s remarks, we will open the call for questions. Please note that this call may include forward looking statements made pursuant to the safe harbor provisions of the Private Securities Litigation Reform act of 1995. The statements are based on current expectations and are subject to a number of assumptions, uncertainties and risks that Strategic Education has identified in today’s press release that could cause actual results to differ materially. Further information about these and other relevant uncertainties may be found in Strategic Education’s most recent annual report on Form 10K, the 10Q to be filed, and other filings with the securities and Exchange Commission, as well as Strategic Education’s Future 8Ks, 10Qs and 10Ks. Copies of these filings and the full press release are available for viewing on our website@stragiceducation.com and now I’d like to turn the call over to Carl. Carl, please go ahead.

Carl McDonnell (President and Chief Executive Officer)

Thank you, Therese and good morning everyone. Our first quarter results reflect meaningful progress across three of our primary strategic objectives, the continued investment and growth of our Education Technology Services division, growing our Employer Focus strategy and further implementing our AI and other productivity enabling Systems. For the first quarter, SEI revenue declined 1% year over year driven by a slight decrease in consolidated enrollment. Based on our current enrollment trends, we expect that the first quarter will be the low point of the year in both absolute revenue and revenue growth. Our productivity initiatives drove a 2% reduction in adjusted operating expenses, resulting in 3% operating income growth and slight margin expansion to 14.3%. Adjusted earnings per share came in at $1.41. Turning now to our segments, Education Technology services grew revenue 21% to $42 million driven by Sofia Learning subscriptions, higher employer affiliated enrollment and new Workforce Edge partnerships. Even with a 7% increase in expenses. As we continue to invest in the ETS business, ETS operating income grew 42% to $20 million and a 47% margin. ETS now represents 46% of consolidated operating income. Within ETS, Sophia Learning grew average total subscribers by 40% and revenue by 32%, with strong growth in both consumer and employer affiliated subscribers. Workforce Edge ended the quarter with 82 corporate agreements covering 4 million employees and enrollments from Workforce Edge into either Strayer or Capella University grew 70%, reaching nearly 4,000 students. As you know, expanding this network of corporate partners continues to be among our most important strategic focus areas. Moving to US higher education, employer affiliated enrollment grew 10% and reached a new all time high of 34.5% of total US higher education enrollment, an increase of more than 300 basis points from the prior year. Health care, which is a key component of our employer Strategy, also grew 10%. And healthcare enrollment now represents more than half of all U.S. higher education enrollment. U.S. higher education revenue declined 4% in the quarter, reflecting a slight decline in unaffiliated enrollment, along with somewhat higher discounts and scholarships, which together lowered revenue per student. Our productivity initiatives continue to enable effective cost control. With operating expenses down 2%, the segment delivered $26 million of operating income and a 12% margin. U.S. higher education also set a new record for average student retention at 89%. Turning now to Australia and New Zealand, total enrollment declined 3% in the quarter. Regulatory constraints on international enrollment continue to be a headwind and only partially offset by continued domestic new student growth. We remain focused on maximizing international enrollment within the current CAHPs and on our continued investment in the domestic market on a constant currency basis. ANZ revenue was down 4%, reflecting the enrollment decline and a slight decrease in revenue per student. Here too, our productivity initiatives drove a 3% reduction in operating expenses. We reported an operating loss of $2.4 million for the quarter, which, as we’ve noted before, reflects the normal seasonality of that business. On capital allocation. In addition to our regular quarterly dividend, we repurchased approximately 493,000 shares during the quarter for a total of $40 million. As of the end of the first quarter, we have approximately $200 million remaining on our share repurchase authorization through the end of the year. And finally, as always, I’d like to thank all of my colleagues here at SCI for their ongoing commitment to our students and our employer partners. And with that, Kevin, we’d be happy to take questions. Thank you.

OPERATOR

Ladies and gentlemen, if you have a question or a comment at this time, please press Star one one on …

Full story available on Benzinga.com

This post was originally published here

EastGroup Props (NYSE:EGP) reported first-quarter financial results on Thursday. The transcript from the company’s first-quarter earnings call has been provided below.

Benzinga APIs provide real-time access to earnings call transcripts and financial data. Visit https://www.benzinga.com/apis/ to learn more.

The full earnings call is available at https://app.webinar.net/OQA2zMD6eEa

Summary

Eastgroup Properties Inc reported strong financial performance for Q1 2026, with funds from operations (FFO) of $2.30 per share, an 8.5% increase year-over-year, and a quarterly leasing rate of 96.5%.

The company highlighted strategic development initiatives, increasing its guidance for 2026 development starts to $265 million, driven by strong demand in its development pipeline and new projects across various markets.

Management expressed optimism for the future, with an increased midpoint for 2026 FFO guidance to $9.52 per share and a projection of continued strong cash same-store net operating income growth.

Operational highlights include a focus on geographic and tenant diversity, with a decrease in the rent concentration of top tenants and significant development leasing, particularly related to data center suppliers.

Management commented on the positive outlook for market demand, driven by factors such as population migration and nearshoring trends, and noted the company’s strong balance sheet with no current debt drawn on its unsecured bank credit facility.

Full Transcript

OPERATOR

Good morning ladies and gentlemen and welcome to the Eastgroup Properties Inc First Quarter 2026 Earnings Conference Call and webcast. At this time all lines are in listen only mode. Following the presentation, we will conduct a question and answer session. If at any time during this call you require immediate assistance, please press STAR zero for the operator. This call is being recorded on Thursday, April 23, 2026. I would now like to turn the conference over to Marshall Loeb, CEO. Please go ahead.

Marshall Loeb (CEO)

Good morning and thanks for calling in for our first quarter 2026 conference call. As always, we appreciate your interest. I’m happy to say that joining me on this morning’s call are Reed Dunbar, our President, Stacy Tyler, our CFO and Brent Wood, our COO. Since we’ll make forward looking statements, we ask that you listen to the following Please note that our conference call today will contain financial measures such as PNOI (Property Net Operating Income) and FFO that are non GAAP measures as defined in Regulation G. Please refer to our most recent financial Supplement and our Earnings Press release, both available on the Investor page of our website and to our periodic reports furnished or filed with the SEC for definitions and further information regarding our use of these non GAAP financial measures, including and a reconciliation of them to our GAAP results. Please also note that some statements during this call are forward looking statements as defined in and within the safe harbors under the SECurities act of 1933, the SECurities Exchange act of 1934 and the Private Securities Litigation Reform act of 1995. Forward looking statements in the Earnings Press release along with our remarks are made as of today and reflect our current views of the Company’s plans, intentions, expectations, strategies and prospects. Based on the information currently available to the Company and on assumptions it has made. We undertake no duty to update such statements or remarks, whether as a result of new information, future or actual results or otherwise. Such statements involve known and unknown risks, uncertainties and other factors that may cause actual results to differ materially. Please see our SEC filings, including our most recent annual report on Form 10K, for more detail about these risks. Good morning. I’ll start by thanking our team. They started the year well and I’m proud of the results achieved. Our first quarter results demonstrate our portfolio quality and resiliency within the industrial market. Some of the stats produced include funds from operations omitting voluntary conversions of 230 per share up 8.5% quarter over quarter. For over a decade now, our quarterly FFO per share has exceeded the FFO per share reported in the same quarter prior year. Truly a Long term growth trend Quarter end leasing was 96.5% with occupancy at 95.9. Average quarterly occupancy was 96.1 which was up 30 basis points from first quarter 2025. And also notable was quarter end same store occupancy at 97.4%. This strength demonstrates the trend we’ve mentioned where the portfolio is well leased while development leasing has been taking a little longer. Quarterly re leasing spreads were 37% GAAP and 20% cash for leases signed during the quarter. Quarterly cash same store NOI rose a strong 9.2% reflecting this high same store occupancy. Finally, we have the most diversified rent roll in our sector with our top 10 tenants falling to 6.7% of rents down 40 basis points from prior year. We target geographic and tenant diversity as strategic paths to stabilize earnings regardless of the economic environment. In summary, we’re pleased with our results and excited about the quantity of development leasing signed during the quarter along prospect activity Reid will now walk you through more of our quarterly details.

Reed Dunbar (President)

Thank you Marshall and good morning. In the first quarter, development leasing continued to follow the same trend we saw in our fourth quarter results. Year to date, development leasing has already reached 54% of last year’s total. While we are encouraged by the continued demand in our development properties, businesses continue to operate amid headline volatility and decision cycles continue to remain extended. But as the markets continue to experience positive absorption and as new development starts remain limited, we anticipate users will be increasingly required to accelerate decision making. In the meantime, our development pipeline continues to lease at a more measured pace while maintaining our projected yields. The E3 platform and the depth of our team continue to drive strong returns in our development business. As our development starts are pulled by market demand, we are increasing our guidance for the year to 265 million. This quarter we commenced construction on four projects totaling 586,000 square feet, of which 27% is pre leased. New development sites in our targeted infill locations remain challenging to source and entitlements and zoning continue to be difficult and time consuming. As the supply of competing product continues to tighten and as demand stabilizes, it will place upward pressure on rents. And as demand improves, we believe the company is well positioned to capitalize on continued development opportunities in creating value from our land bank. Regarding new investments, we continue to modernize our portfolio with the acquisition of two Class A buildings in the Jacksonville market totaling 177,000 square feet and then subsequent to quarter close, we sold the 46,000 square foot building also in Jacksonville, along with our previously announced exit from the fresno market of 398,000 square feet. Stacey will now speak to several topics including assumptions within our updated 2026 guidance.

Stacy Tyler (Chief Financial Officer)

Thanks Reid and good morning. We are proud of our first quarter results. They reflect the outstanding performance of our team and the strength of our portfolio. We are pleased to report that FFO exceeded the midpoint of our guidance range at $2.30 per share excluding gains on involuntary conversion. This represents an 8.5% increase over first quarter last year. The outperformance in first quarter was primarily driven by lower than anticipated G&A expense and higher than projected property net operating income reflecting the continued strong performance of our 62 million square operating portfolio. Our balance sheet remains strong and flexible. We were pleased to announce during first quarter that Moody’s ratings upgraded our issuer rating to Baa1 (Baa1 rating) with a stable outlook. We ended the quarter with no balance drawn on our unsecured bank credit facility leaving available capacity of 675 million. Our sector leading balance sheet metrics include debt to total market capitalization of 14% at quarter end, first quarter annualized debt to EBITDA ratio of 3x and interest and fixed charge coverage of 14.8 times. We remain well positioned to pursue growth opportunities that align with our time tested Strategy. FFO for second quarter is estimated to be in the range of 230 to 238 per share. Looking ahead to the remainder of the year, we increased the midpoint of our 2026 FFO guidance to $9.52 per share excluding gains on involuntary con. The updated Midpoint represents a 6.4% increase over 2025 actual results and is 30 basis points ahead of our initial guidance. We are projecting strong cash same property net operating income results to continue and we raised the midpoint of our guidance assumption by 10 basis points to 6.2%. These strong projections are driven by rental rate increases on in place and budgeted leases and expected same property occupancy of 96.4% which is also 10 basis points ahead of our initial guidance. We increased our projected 2026 development starts by $15 million to 265 million primarily driven by the 100,000 square foot pre leased building expansion that was not contemplated in our prior guidance figure. We began construction on four projects during first quarter and one project in April totaling $105 million and the remaining starts are projected for the second half of the year. While our guidance assumption for 2026 gross capital proceeds remains unchanged at $300 million. The nature of those proceeds has changed from 100% debt to a mix of debt and equity as we were opportunistic in accessing the equity market. During first quarter we issued $70 million in common stock through our common equity offering program at over $191 per share. We currently have an additional $50 million in forward equity sale agreements available for issuance at over 196 per share. We will continue to evaluate capital sources and remain flexible as the year progresses. Our rent collections currently remain healthy and our tenant watch list is steady. We are pleased with our strong performance in first quarter and as we look ahead through the remainder of the year 2026. We are confident in our experienced team and well located high quality portfolio to position us for long term success. Now Marshall will make some final comments.

Marshall Loeb (CEO)

Thanks Stacy. In closing, we’re pleased with how the year has begun. Market demand has momentum and we’re hopeful it’s sustainable regardless of the environment. Our goals are to drive FFO per share growth while retaining portfolio quality. If we do those, we’ll continue creating Net Asset Value (NAV) growth for our shareholders. Our executive team restructuring is nicely falling into place. I’m excited to welcome Jim Trainor to the team. I also want to express my and the company’s appreciation to John Coleman who is entering a well earned retirement on June 30th. And John, we still have your mobile number. Stepping back from the near term, I like our positioning as our portfolio is benefiting from several long term positive secular trends such as population migration, near shoring and onshoring trends to now include data center suppliers, evolving logistics chains and historically lower shallow bay market vacancies. We also have a proven management team with a long term public track record. Our portfolio quality in terms of buildings and markets improves each quarter, our balance sheet is stronger than ever and we’re upgrading our diversity in both our tenant base as well as our geography. We’d now like to take your questions.

OPERATOR

Thank you ladies and gentlemen. We will now begin the question and answer session. Should you have a question, please press Star followed by the one on your touch tone phone. You will hear a prompt that your hand has been raised. Should you wish to decline from the polling process, please press Star followed by the two. If you are using a speakerphone, please lift the handset before pressing any keys. We kindly ask that callers limit themselves to one question at a time. If you have a follow up question, please rejoin the queue. One moment please for your first question. Your first question comes from Craig Mailman with Citigroup. Your line is now open.

Craig Mailman (Equity Analyst)

Good morning. I guess Marshall and Reed, you both kind of pointed to development leasing taking a little bit longer still, but you guys had a significant ramp in kind of the activity since early February. Can you just talk a little bit about the gestation period on the deals that got done? And are you seeing some tenants start to move a little bit quicker now that the supply pipeline is emptying out here?

Reed Dunbar (President)

Yeah. Morning, Craig. This is Reed. Thanks for the question. And we are actually seeing some tenants move a little bit quicker than we have in the past. We had a good example of that in our Atlanta. One of one of our Atlanta projects where we had a vacancy in our second gen or first gentleman development portfolio. And we had two users that came and both wanted the space. And we were able to create some competition. The team did locally and ended up signing 107,000 square feet in that project. And that happened quicker than we anticipated, which was a good sign. And so as we look out in the market, as the demand continues to pick up and supply continues to get a little tighter, we anticipate that, that, that decision cycle will start to shorten some.

Craig Mailman (Equity Analyst)

Just if I could sneak a second quick one in, how much availability do you still have left of the projects that you delivered last year that came in a little bit under leased?

Reed Dunbar (President)

Yeah, so what we’re calling, you know, first gen space, we’ve got about 775,000 square feet.

Craig Mailman (Equity Analyst)

Great, thank you.

OPERATOR

Your next question comes from Blaine Heck with Wells Fargo. Your line is now open.

Blaine Heck (Equity Analyst)

Great, thanks. And good morning. Just with respect to guidance, can you talk about how much speculative development leasing is assumed in guidance for the rest of the year and whether at this point you think that could be a risk or a source of upside?

Stacy Tyler (Chief Financial Officer)

Hey, Blaine, good morning. Yes, we have about 4 cents of NOI for speculative development leasing in the second half of the year. We’re not assuming anything in second quarter at this point for spec development leasing, and it ramps up the third and fourth quarter for a total of 4 cents for the year. We see that more as an opportunity. Certainly we have work to do and we need to sign some more leases to achieve that 4 cents. But we believe that that’s an opportunity between the projects that we have currently in the development pipeline and the 775,000 that Reid referred to in first generation. So definitely see that as an opportunity, particularly if the pace of development leasing can remain strong and steady as it has been over the last couple months.

OPERATOR

Your next question comes from Samir Kanal. With bank of America. Your line is now open.

Samir Kanal (Equity Analyst)

Good morning, everybody. I guess, Marshall, it’s certainly good to see the development leasing picking up here, but maybe expand on your comments on kind of what you’re seeing from the customer as it relates to kind of overall decision making given kind of inflation, given macro volatility, I guess what are you seeing on the ground? Thanks.

Marshall Loeb (CEO)

You’re welcome. Good morning, Samir. I agree with Reid and that maybe going back a year ago after Liberation Day, it felt like later into second quarter and certainly through third quarter, things were slow. You know, we were getting small development leases signed. We weren’t seeing many expansions. Fourth quarter it picked up. That was our by far our biggest development leasing quarter. And then again then we beat that number this quarter. So a couple of strong quarters in a row where some of that development leasing, we picked up a couple of expansions. You saw the building expansion in Arizona. There’s one in Texas where it’s an expansion. So it feels like in spite of and I got the question, you know, the unrest in the Middle East, is it slowing down decision making? And I could give you two answers. The current one is no, it really we have not seen people say I’m not ready to make a decision because of that or not yet. We do worry about gasoline prices and what impact, how that will affect the consumer over time could affect us. But today I feel better, for what it’s worth, I feel better about this year today than when we had our fourth quarter call, in spite of all the headlines and things like that. And maybe I’m overanalyzing our customers. People are more, they need to run their businesses and they’re getting more used to the volatile headlines that the Strait of Hormuz is open, it’s closed, it’s this and that. And that business is generally good. And we’re seeing new leasing and develop and expansions again, a little more than we did a year ago. I just hope it lasts.

OPERATOR

Thank you, Marshall. Sure. You’re welcome. Your next question comes from Todd Thomas with KeyBanc. Your line is now open.

Todd Thomas (Equity Analyst)

Yeah, thanks. Marshall. You mentioned seeing some tailwinds around demand due to data center suppliers. And, you know, I was just curious if you could talk about that a little bit, perhaps quantify or characterize that demand a bit in the context of what was, you know, what’s been signed, you know, sort of year to date, whether it’s data center suppliers or advanced manufacturing. Any thoughts there?

Marshall Loeb (CEO)

Good morning, Todd. I think it started with us with maybe the advanced manufacturing or the chip plants. We’ve got suppliers in Phoenix and in Dallas for the chip plants that kind of picked up maybe two years ago. Call it. I’m trying to think the exact time frame has been. And those are still tenancies we have today. And then with data centers we’re seeing mostly on the supply side, but a couple that you saw and our kind of on our development program it’s more H Vac or racking equipment and things like that where a couple of full building users that were related to data center basically that have been built and they’re supplying them. We’ve got another prospect or two that are related to data center construction. So we’re look, I’m thrilled to have a new source of demand and we what we love about our buildings is how flexible the use can be that our long standing tenants are still there. Look, I’d love home building to pick up again one of these days, but I’m glad that we picked up more and more advanced manufacturing and now we seem to be picking up ancillary demand which has been really helpful last quarter to relate it to all the data centers that are being built around our markets.

Reed Dunbar (President)

Yeah, maybe just to add a stat to help quantify some of the numbers of our 685,000 square feet of development leasing that we’ve …

Full story available on Benzinga.com

This post was originally published here

Knowles (NYSE:KN) reported first-quarter financial results on Thursday. The transcript from the company’s first-quarter earnings call has been provided below.

This transcript is brought to you by Benzinga APIs. For real-time access to our entire catalog, please visit https://www.benzinga.com/apis/ for a consultation.

Access the full call at https://events.q4inc.com/attendee/904835360

Summary

Knowles reported strong Q1 2026 results with revenue of $153 million, up 16% year-over-year, and EPS of $0.27, up 50% year-over-year, both exceeding guidance.

MedTech and Specialty Audio (MSA) revenue grew by 14% year-over-year to $68 million, driven by new product introductions, with full-year 2026 growth expected in the 2-4% range.

Precision Devices segment saw a 17% year-over-year revenue increase to $85 million, with strong demand across MedTech, defense, industrial, and electrification markets.

The company anticipates continued strong organic growth and margin expansion throughout 2026, with revenues projected to exceed the high end of their 4-6% organic growth target.

Q2 2026 guidance includes revenues between $152 and $162 million, EPS between $0.28 and $0.32, and cash from operating activities of $20 to $30 million.

Management highlighted robust demand in defense markets, particularly driven by ongoing OEM investments and replenishment needs related to geopolitical conflicts.

The company is executing on a strategy to leverage unique technologies for custom solutions, enabling it to command premium margins across high-growth markets.

Full Transcript

OPERATOR

Thank you for standing by. My name is Prayla and I will be your conference operator today. At this time I would like to welcome everyone to The Knowles Corporation Q1 2026 earnings conference call. All lines have been placed on mute to prevent any background noise. After this speaker’s remarks, there will be a question and answer session. If you would like to ask a question during this time, simply press STAR followed by the number one on your telephone keypad. If you would like to withdraw your question, please press STAR followed by the number one again. Thank you. I would now like to turn the conference over to Sarah Cook. You may begin.

Sarah Cook (Vice President of Investor Relations)

Thank you and welcome to our first quarter 2026 earnings call. I’m Sarah Cook, Vice President of Investor Relations and presenting with me today are Jeffrey New, our President and CEO, and John Anderson, our Senior Vice President and cfo. Our call today will include remarks about future expectations, plans and prospects for Knowles, which constitute forward looking statements for purposes of the safe harbor provisions under applicable federal security laws. Forward looking statements in this call will include comments about demand for company products, anticipated trends in company sales, expenses and profits, and involve a number of risks and uncertainties that could cause actual results to differ materially from current expectations. The Company urges investors to review the risks and uncertainties in the Company’s SEC filings, including but not limited to the annual report on Form 10K for the fiscal year ended December 31, 2025, periodic reports filed from time to time with the SEC, and the risks and uncertainties identified in today’s earnings release. All forward looking statements are made as of the date of this call and NOLS disclaims any duty to update such statements except as required by law. In addition, pursuant to Regulation G, any non GAAP financial measures referenced during today’s conference call can be found in our press release posted on our website@knowles.com and in our current report on Form 8K filed today with the SEC. This will include a reconciliation to the most directly comparable GAAP measure. All financial references on this call will be on a non GAAP continuing operations basis with the exception of cash from operations or unless otherwise indicated. We’ve made select financial information available in webcast slides which can be found in the Investor Relations section of our website. With that, let me turn the call over to Jeff who will provide details on our results.

Jeffrey New (President and CEO)

Jeff thanks Sarah. Thanks to all of you for joining us today. We started 2026 with solid financial results in Q1 and great momentum entering the rest of the year. Our strategy of leveraging our unique technologies to design custom engineered solutions and then delivering them at scale for blue chip customers and in high growth markets. That value our solutions is proving to be a powerful combination. We had strong organic growth in the first quarter as we delivered revenue of 153 million up 16% year over year at the high end of our guided range. EPS of $0.27, up 50% year over year exceeded the high end of our guided range and cash utilized in operations of 1 million was within our guided range. Now on to our Segment results in Q1, MedTech and Specialty Audio revenue was 68 million up 14% year over year. Our customers new product introductions coupled with our position on these platforms have led to stronger than expected growth in the first quarter. Knowles continues to demonstrate our ability to deliver unique solutions with superior technology and reliability. Our customers have come to depend on MSA’s first quarter revenue grew well above our annual organic growth target of 2 to 4%. However, the hearing health end market is expected to continue to grow at normal historical rates in 2026. Therefore, we are projecting Medtech and Specialty Audio will grow within the 2 to 4% range for the full year 2026. Beyond 2026 we are positioned well to win next generation designs for MEMS microphones and balanced armature speakers. As I said during our year end call we also see the prospect to increase our content for device in next generation hearing health products and expand our reach with our microsolutions group which provides the opportunity in the future to increase growth rates above the historical rates. In the precision device segment, Q1 revenues was 85 million up 17% year over year. With all our end markets we serve MedTech, Defense, Industrial and electrification growing on a year over year basis. Let me share a couple highlights driving growth in our end markets this quarter we saw strength in the defense market across our product families. Our capacitors were in demand supporting ongoing OEM investments in defense programs, new products, starting production and share gains. We also saw broad based orders our RF microwave products as we continue to be a sole supplier on a number of key defense programs. Additionally, we do expect increasing demand in 2027 and beyond driven by the replenishment of stocks in connection with the Iran conflict. In the industrial market, demand continued to grow with strong order activity across a wide range of our capacitor products supporting a multitude of applications and industries at both our distribution partners and OEMs. As an example, our ceramic capacitors were in high demand in the semiconductor equipment market and also for use in downhole applications. Additionally, with inventory challenges we saw behind saw last year behind us, we believe our distributor partners orders are aligned with end market demand. In addition to the strong shipments we saw in the first quarter, our book to build in precision devices was very strong at 1.19. This ordering pattern was broad based and this marked the sixth consecutive quarter where the book to build was greater than one. We see ordering strength across all our end markets both at OEMs and with our distribution partners. A robust pipeline of new design wins coupled with favorable secular trends gives me confidence in our ability to continue to grow revenue and above the high end of the organic growth target of 6 to 8% for Precision Devices in 2026. I continue to be excited by the strength of our business and the momentum we exited the first quarter with. We are well positioned for continued strong organic revenue growth and margin expansion through 2026. We believe this momentum is sustainable for two key reasons. First, our portfolio of businesses are well positioned to in markets with strong secular growth trends. Whether it be defense, medical, industrial or electrification. The secular drivers of growth in these markets is forecasted to be positive for the foreseeable future. Second, we design high performance customized solutions for our customers that have demanding applications and we have the manufacturing capabilities that allow us to ramp up these solutions quickly and efficiently. This combination differentiates us, allowing us to garner premium margins for the products we produce. This is proving to be a winning combination. Before I turn the call over to John to cover our financial results and provide our Q2 guidance, I would like to reiterate what I’ve said on previous calls. I believe Knowles has entered a period of accelerated organic growth with a very healthy backlog of existing orders. We now expect our revenue growth in 2026 to to be above the high end of our target organic revenue target of 4 to 6% that we provided at our Investor Day in May of last year. Our strategy of leveraging our unique technologies to design custom engineered solutions and then deliver them at scale for blue chip customers in high growth markets. That value our solutions is proving to be a powerful combination driving revenue growth, expanding margins and strong cash flow to drive shareholder value. Now let me turn the call over to John for our financial results and our Q2 guidance.

John Anderson (Senior Vice President and CFO)

Thanks Jeff. We reported first quarter revenues of 153 million 16% from the year ago period and at the high end of our guidance range. EPS was $0.27, in the quarter, up $0.09 or 50% from the year ago period and above the midpoint of our guidance range. Cash utilized by operating activities was 1 million within our guidance range in the MedTech and Specialty Audio segment Q1 revenue was 68 million, up 14% compared with a year ago period driven by increased hearing health shipments associated with our customers successful new product introductions. Q1 gross margins were 53.5%, up 480 basis points from the year ago period driven by both increased federal factory capacity utilization and favorable mix. For full year 2026, we expect MSA gross margins to be in line with 2025 margins of …

Full story available on Benzinga.com

This post was originally published here

On Thursday, SkyWest (NASDAQ:SKYW) discussed first-quarter financial results during its earnings call. The full transcript is provided below.

Benzinga APIs provide real-time access to earnings call transcripts and financial data. Visit https://www.benzinga.com/apis/ to learn more.

Access the full call at https://events.q4inc.com/attendee/179256265

Summary

SkyWest reported a net income of $102 million or $2.50 per diluted share for Q1 2026, slightly better than the previous year, driven by increased production and fleet utilization.

The company continues its strategic fleet initiatives, including the introduction of the CRJ450 for United and the conversion of CRJ700s to CRJ550s, with plans to expand the E175 fleet to nearly 300 by 2028.

SkyWest reduced its debt by $1 billion since 2022 and continues to focus on fleet growth, debt reduction, and share repurchase, with $138 million remaining under its current buyback authorization.

Operational highlights include high on-time performance despite challenging winter weather and strong demand for prorate services, with plans to expand service to underserved communities.

Management provided a cautious future outlook, anticipating slightly lower block hour production this summer and a GAAP EPS of around $11 for 2026, affected by elevated fuel costs.

Full Transcript

Abby (Operator)

Thank you for standing by. My name is Abby and I will be your conference operator today. At this time I would like to welcome everyone to the SkyWest Incorporated first quarter 2026 results call. All lines have been placed on mute to prevent any background noise. After the speaker’s remarks, there will be a question and answer session. If you would like to ask a question during this time, simply press star followed by the number one on your telephone keypad. If you would like to withdraw your question, press star one again. Thank you. And I would now like to turn the conference over to Rob Simmons, Chief Financial Officer. You may begin.

Rob Simmons (Chief Financial Officer)

Thanks Abby. And thanks everyone for joining us on the call today. As Abby indicated, this is Rob Simmons, SkyWest Chief Financial Officer. On the call with me today are Chip Childs, President and Chief Executive Officer, Wade Steele, Chief Commercial Officer and Eric Woodward, Chief Accounting Officer. I’d like to start today by asking Eric to read the Safe Harbor. Then I will turn the time over to Chip for some comments. Following Chip, I will take us through the financial results. Then Wade will discuss the fleet and related flying arrangements. Following Wade, we will have the customary Q and A session with our sell side analysts.

Eric Woodward (Chief Accounting Officer)

Eric, today’s discussion contains forward looking statements that represent our current beliefs, expectations and assumptions regarding future events and are subject to risks and uncertainties. We assume no obligation to update any forward looking statement whether as a result of new information, future events or otherwise. Actual results will likely vary and may vary materially from those anticipated, estimated or projected for a number of reasons. Some of the factors that may cause such differences are included in our Most recent Form 10K and other reports and filings with the Securities and Exchange Commission. And now I’ll turn the call over to Chip. Thank you Rob and Eric. Good afternoon everyone. Thank you for joining us on the call today. Today Skywest reported net income of 102 million or $2.50 per diluted share for the first quarter of 2026. This is slightly better than the same quarter last year and reflects increased production and fleet utilization. During the quarter we received delivery of 1E175 with 8 more expected this year. We are also excited to share a prototype of the new CRJ450 product, a reimagined premium 41 seat CRJ200. This aircraft will include first class overhead bins large enough for all rollaboard luggage and Starlink Wi Fi. SkyWest is very excited to launch this new product for United this fall and we look forward to ultimately operating an all dual class fleet. The first quarter is Always difficult with winter weather, our people rose to the challenge despite two back to back storms in March affecting several of our hubs during the first quarter, the Department of Transportation shared their full year 2025 on time performance statistics with SkyWest Airlines placing third in on time performance. That’s outstanding and I want to thank our people for working together to deliver such an exceptional product. The industry is extremely dynamic and and our model is built for durability. With uncertainty impacting fuel costs and production, we still anticipate 2026 will be more profitable than 2025. SkyWest strategic business decisions have kept us strong and agile to the industry’s volatility and the steps we’ve taken in the past several years have only enhanced the strength and stability of our model. Our ongoing investments and and in the diversity of our fleet ensure we’re well positioned to adapt to market demands. We continue executing our fleet initiatives and advancing our unparalleled fleet flexibility. That flexibility has never been more important and while our E17 flying agreements are further solidified, we continue to leverage our extensive CRJ assets. The contract extensions we announced with United and Delta last quarter deliver ongoing revenue stability and with our dual class fleet, Both CRJ and ERJ now under contract, we have no major E175 contract expirations until late 2028. We continue accepting delivery of new E175s, converting CRJ 700s to CRJ 550s for United and are proud to be launching the CRJ 450 with United this fall. Additionally, we’ve continued to reduce our debt and we now have $1 billion less debt than we did at the end of 2022. The free cash flow that we continue to generate is still being directed toward fleet growth initiatives, debt reduction and share repurchase. Our steadfast commitment to maintaining a strong balance sheet and liquidity benefits our employees, our partners and our shareholders. All of this work sets us up well for 2027 and places us in a solid position of long term strength. SkyWest continues to lead our industry in service and in the value of our diverse assets. We remain disciplined and steady as we execute on our growth opportunities by delivering on significant prorate demand, investing in and fully utilizing our existing fleet and preparing to receive our deliveries in the coming years for a total of nearly 300 E175s by the end of 2028. SkyWest is built to perform through the industry’s cycles. Disciplined strategic choices and continued execution in recent years have strengthened our model and we remain well positioned to adapt quickly and to respond to market demands better than anyone else in the industry. Rob will now take us through the financial information.

Rob Simmons (Chief Financial Officer)

Today we reported a first quarter GAAP (Generally Accepted Accounting Principles) net income of $102 million or $2.50 earnings per share. Q1 pre-tax income was $108 million. Our weighted average share count for Q1 was 40.7 million and our effective tax rate was 6%. This GAAP (Generally Accepted Accounting Principles) EPS included a 29 cent impact from this unusually low effective tax rate from a discrete benefit in the quarter compared to the Q1 rate last year. Let’s start today with revenue. Total Q1 revenue of 1.01 billion is down slightly from 1.02 billion in Q4 2025 and up 7% from 948 million in Q1 2025. Q1 revenue includes contract revenue of 810 million, up from 803 million in Q4 2025 and up from 785 million in Q1 2025. PRORATE and charter revenue was $168 million in Q1, up $1 million from Q4 2025 and up 37 million from Q1 2025. Leasing and other revenue was $35 million in Q1, down from 54 million in Q4 and up from 32 million in Q1 2025. The sequential decrease in leasing and other revenue from Q4 related to discrete maintenance services provided to third parties in Q4 that was not expected to repeat in Q1. Additionally, these Q1 GAAP (Generally Accepted Accounting Principles) results include the effect of recognizing $24 million of previously deferred revenue this quarter, up from the $5 million recognized in Q4 2025 and $13 million recognized in Q1 2025. As of the end of Q1 we we have $241 million of cumulative deferred revenue that will be recognized in future periods. Now let’s discuss the balance sheet. We ended the quarter with cash of 627 million, down from 707 million last quarter and down from 751 million at Q1 2025. The ending cash balance for the quarter included the effects from repaying $116 million in debt, issuing $118 million of new debt, investing $102 million in capex, including the purchase of 1E1755 and buying back 783,000 shares of SkyWest stock in Q1 for $75 million as of March 31, we had $138 million remaining under our current share repurchase authorization. Cash flow is obviously an important driver of our capital deployment strategy. Over the last two years we generated nearly $1 billion in free cash flow and deployed it primarily to delever and de risk the balance sheet to the benefit of our partners, our employees and our shareholders. We expect to continue to deploy our ongoing generation of free cash flow by investing in our fleet, including financing the addition of 28 new E1755s by the end of 2028, reducing our debt and executing opportunistically on our share repurchase program as you saw us do in Q1. As we remain focused on improving our return on invested capital, we’d like to highlight the following Both our debt net of cash and leverage ratios continue at favorable levels and are at their lowest point in over a decade. Our total debt level is $1 billion lower today than it was at the end of 2022, in spite of acquiring and debt financing 15 E1755s during that time, the total 2025 capital expenditures of funding our growth initiatives was approximately $580 million, including the purchase of seven new E1755s, CRJ900 airframes and aircraft and engines supporting our CRJ550 opportunity. We expect to take nine new E1755s during 2026 and anticipate our total CapEx in 2026 will be about flat with 2025 including two incremental 175 deliveries consistent with our practice. Let me update you on some commentary on 2026 that we gave last quarter. For 2026, we now expect to see block hour production slightly lower this summer than we modeled last quarter. We continue to work with our partners on production schedules over the rest of 2026. Wade will talk more about this in a minute. We also anticipate our GAAP (Generally Accepted Accounting Principles) EPS for 2026 will be in the $11 area, slightly down from the color we gave last quarter, reflecting our expectation of ongoing elevated fuel costs. Although the future cost of fuel is obviously uncertain, we are exposed to fuel costs only on roughly 10% of our flying or 40 million gallons needed in our prorate business over the remainder of the year. We also believe, however, that higher fuel costs will come with some favorable prorate pricing offsets in that business along with ongoing strength in our core model. In terms of how to think of quarterly EPS modeling for the rest of 2027, there are several potential puts and takes over the remaining quarters, including seasonality, fuel cost, production, and so on that have various levels of uncertainty. But to keep it simple on a GAAP (Generally Accepted Accounting Principles) EPS basis. We anticipate directionally that Q2 could be up slightly from Q1 gap results of $2.50 Q3 seasonally, the strongest quarter of the year could be up over Q2 and Q4 could be down modestly from Q3. For other modeling purposes, we anticipate our maintenance activity in 2026 will continue approximately at 2025 levels as we invest in bringing more aircraft back into service. We also anticipate our effective tax rate will be approximately 23 to 24% for the full year 2026, flat to slightly down from 2025, including the unusually low rate of 6% in Q1. This is expected to translate to an effective tax rate of approximately 27 to 28% for the remaining quarters of 2026. We are optimistic about our ongoing growth possibilities in 26 and 27, including the following three focus areas. First, growth in our ability to increase service to underserved communities, driven partially by the redeployment of approximately 20 dual class CRJ aircraft expected for scheduled service later this year and strong utilization of the existing fleet second, good demand for our prorate product and third, placing nine new E1755s into service for United and Alaska by the end of 2026 and 16 new E1755s for Delta in 2027 and 2028. We are also very pleased with the success of our CRJ550 and CRJ450 initiatives and I will hand the mic to Wade who will talk more about that next. We believe that we are positioned to drive long term shareholder returns by deploying our strong balance sheet and free cash flow generation against a variety of accretive opportunities.

Wade Steele (Chief Commercial Officer)

Wade thank you Rob. During the quarter United announced the launch of the CRJ450, a reimagined CRJ200 featuring 41 seats. This aircraft will offer seven first class seats and 34 economy seats including economy plus. With a large luggage closet and no overhead bends in the first class cabin, passengers will enjoy a premium experience. We’re also excited to introduce Starlink connectivity on board the CRJ450. Operations with United will begin this fall. Last year we announced an extension covering 40 CRJ200, hundreds with United and we are committed to retrofitting these aircraft into CRJ450s. We also plan to retrofit our Pro rate fleet and anticipate that our total CRJ450 fleet will reach approximately 100 aircraft. Turning to our E175 fleet last quarter we secured multi year extensions for 40 E175s with United and 13 with Delta, further solidifying our partnerships through the end of the decade. We now have no contract expirations on E175s until the second half of 2028. During the quarter we took delivery of a new E175 for Alaska and currently have 68 E175s on firm order with Embraer including 16 for Delta and 8 for United. We expect to receive 8 additional E175s this year. Of the 68 aircraft on order, 24 are allocated to major partners with 44 remain …

Full story available on Benzinga.com

This post was originally published here
Blackstone (NYSE:BX) executives expressed confidence in the private credit market during their Q1 2026 earnings call, aiming to reassure investors and ease concerns.

The private credit sector has been under fire in recent weeks as investors are concerned about default risks, high interest rates, and the disruption AI may have on the software sector. This has led to increased redemption requests in various private credit companies’ portfolios.

Blackstone’s private credit fund, BCRED, saw unusually high redemptions of $3.7 billion in the first quarter, driven primarily by larger investors.

“The great mass by number of smaller investors tends to stick with the product over a long period of time. It’s sort of the bigger boulders as opposed to the pebbles, where you get ‌more movement ⁠in terms of redemptions,” Blackstone Chief Operating Officer (COO) Jonathan Gray said during the call.

Gray also addressed concerns about software and artificial intelligence. When asked whether AI is weighing on software spreads—particularly amid the widening in private credit—and how to manage the associated risk, …

Full story available on Benzinga.com

This post was originally published here
CVC Credit closed its Collateralized Loan Obligation (CLO) fund with $1 billion in commitments. 

The capital raised from CLO Equity IV is designed to back roughly $15 billion of global CLO issuance tied to CVC Credit’s Liquid Credit platform, the company stated.

The firm said the strategy will take equity stakes in CLOs it manages across both the U.S. and European markets. This is the firm’s fourth fund dedicated to CLO equity vehicles. It’s 25% larger than its last fund, CVC CLO Equity III. 

“This successful fundraising, ahead of target and above the previous fund, is indicative of our continued fundraising momentum across the group. CVC Credit has experienced strong growth, underpinned by our CLO business, which over the past twenty years has developed into one of the world’s …

Full story available on Benzinga.com

This post was originally published here
AppFolio (NASDAQ:APPF) held its first-quarter earnings conference call on Thursday. Below is the complete transcript from the call.

This transcript is brought to you by Benzinga APIs. For real-time access to our entire catalog, please visit https://www.benzinga.com/apis/ for a consultation.

View the webcast at https://edge.media-server.com/mmc/p/hja3su4g

Summary

AppFolio reported a strong start to 2026 with first quarter revenue of $262 million, marking a 20% year-over-year increase.

The company achieved a 50% year-over-year growth in GAAP operating income, reaching $51 million, and a 36% increase in non-GAAP operating income.

Strategic initiatives include the implementation of AI across the business, particularly in the Real Estate Performance Management (RPM) platform, which has driven significant customer engagement and operational efficiency.

Customer base increased to 22,520 with 9.5 million units under management, reflecting a 7% and 8% year-over-year growth respectively.

The company raised its annual revenue guidance to $1.110-$1.125 billion, with expectations for continued growth driven by premium tier offerings and AI-powered services.

Operational highlights include the introduction of new AI capabilities such as Maintenance Performer and Resident Onboarding Lift, enhancing customer service and satisfaction.

Management emphasized the role of AppFolio’s AI architecture in improving internal efficiencies and reducing R&D spending as a percentage of revenue.

The company announced a share repurchase program, deploying $125 million to repurchase 702.5 thousand shares, indicating a focus on long-term shareholder value.

Full Transcript

OPERATOR

Good afternoon. Thank you for standing by and welcome to AppFolio Inc.’s First Quarter 2026 Financial Results Conference call. Please be advised today’s conference is being recorded and a replay will be available on Appfolio’s investor relations website. I would now like to hand the conference over to Lori Barker, Investor Relations. Thank you Operator. Good afternoon everyone. I’m Lori Barker, Investor Relations for Appfolio and I’d like to thank you for joining us today as we report AppFolio’s first quarter 2026 financial results. With me on the call today are Shane Trigg, AppFolio’s president and CEO, and Tim Eaton, AppFolio’s CFO. This call is simultaneously being webcast on the investor Relations section of our website@appfolioinc.com Additionally, an audio replay of the call and a transcript of the prepared comments will be posted to the website. Before we get started, I would like to remind everyone of Appfolio’s Safe harbor policy. Comments made during this conference call and webcast contain forward looking statements within the meaning of the Private Securities Litigation Reform act of 1995 and are subject to risks and uncertainties. Any statement that refers to expectations, projections or other characterizations of future events, including financial projections, future market conditions, business performance or future product enhancements or development is a forward looking statement. Appfolio’s actual future results could differ materially from those expressed in such forward looking statements. For any reason, including those listed on our SEC filings. Appfolio assumes no obligation to update any such forward looking statements except as required by law. For greater detail about risks and uncertainties, please see our SEC filings including our Form 10K for the fiscal year ended December 31, 2025 which was filed with the SEC on February 5, 2026. In addition, this call includes non GAAP financial measures. Reconciliation of these non GAAP financial measures and the most directly comparable GAAP measures are included in our first quarter earnings release posted on the Investor Relations section of our website. With that, I’ll turn the call over to Shane Trigg. Shane, please go ahead.

Shane Trigg (President and CEO)

Thanks Lori and welcome to everyone joining us today. Appfolio is off to a strong start in 2026. First quarter revenue reached $262 million, a 20% year over year increase and up from the 16% year over year increase we delivered in Q1 2025. Non GAAP operating income grew 36% and was 27.3% of revenue and GAAP operating income increased 50% and was 19.4% of revenue. We had the best first quarter in company history for residential new business unit acquisition and units on platform grew to 9.5 million in line with our expectations and typical seasonality. This is an exciting time for our business and our industry. AI is powerful and we’re putting it to work across every dimension of our business. Accelerating performance for our customers while driving greater efficiency across our own operations. At our annual Future conference last year, we introduced Real estate performance Management, what we call rpm, a new way of thinking about value creation in real estate. RPM represents a fundamental shift from reactive task oriented property management to a holistic practice of delivering value across the entire real estate ecosystem. Residents that love where they live, investors that see consistent strong returns. Property management businesses that grow, serving communities that thrive. Achieving that requires a performance platform that provides the harness for for intelligent AI orchestration and real estate. With an AI native architecture of three interconnected systems. A system of record, a system of action and a system of growth. All accessible through one unified experience. There’s a unique advantage in operating a mission critical platform in a vertical market. Sitting at the center of how our customers operate their business. Compliance is embedded in how our platform works, not layered on after the fact. And the domain knowledge we’ve encoded across residential real estate is sharpened by tens of thousands of customers. Our RealmX performers are fully operational AI agents built directly into the platform, taking ownership of entire workflows and and doing the work with and for our customers. And by reimagining the resident experience with the services renters Demand, we turn AppFolio from a cost center into a growth driver. One whose value deepens with every customer we serve. The RPM discipline we’ve introduced and the performance platform we’ve built are redefining what it means to win in real estate. It’s gratifying to see the market embracing RPM and our customers, turning it into daily practice. Dan Rubenstein puts it well. He’s the CEO of Hampton Management Associates, a 3,000 unit Bay Area property management company that this quarter signed a three year renewal on our max plan. I quote, AppFolio is attacking the friction in our business by consolidating our tech stack and into a single platform. By integrating RealmX performers to automate core workflows, we’ve transitioned our team from manual administrative tasks …

Full story available on Benzinga.com

This post was originally published here

World Kinect (NYSE:WKC) reported first-quarter financial results on Thursday. The transcript from the company’s first-quarter earnings call has been provided below.

Benzinga APIs provide real-time access to earnings call transcripts and financial data. Visit https://www.benzinga.com/apis/ to learn more.

View the webcast at https://edge.media-server.com/mmc/p/9md2tztn

Summary

World Kinect reported a strong start to 2026, driven by effective execution and benefits from their portfolio optimization strategy, despite volatile market conditions due to the Middle East conflict.

The company announced a rebranding initiative, using World Fuel as the unified brand for corporate and commercial purposes, reflecting strategic clarity and simplifying business operations.

Financially, the first quarter saw a 10% increase in gross profit year-over-year, with significant contributions from the Marine segment, which posted an 86% increase due to price volatility.

Aviation exceeded expectations with a 20% increase in gross profit, partially attributed to the Universal Trip Support acquisition, while Land saw expected declines due to ongoing portfolio exits.

World Kinect provided an updated EPS guidance range of $2.65 to $2.85 for 2026, reflecting strong Q1 performance but maintaining conservative estimates for the rest of the year amid market unpredictability.

Management highlighted their focus on disciplined risk management, capital allocation, and maintaining strong customer relationships, with a continued emphasis on core business growth and profitability.

Full Transcript

OPERATOR

Thank you for standing by and welcome to World Kinect Corporation’s first quarter 2026 earnings conference call. At this time, all participants are in a listen only mode. After the speaker presentation, there will be a question and answer session. To ask a question during the session, you will need to press star 11 on your telephone. To remove yourself from the queue, you may press star 11 again. I would now like to hand the call over to Braulio Medrano, Senior Director of FP&A and Investor Relations.

Braulio Medrano (Senior Director of FP&A and Investor Relations)

Good afternoon everyone and welcome to WorldConnect’s first quarter 2026 earnings conference call which will be presented alongside our live slide presentation. Today’s presentation is also available via webcast on our investor relations website. I’m Braulio Medrano, Senior Director of FP&A and Investor Relations. With me on the call today is Ira Burns, Chief Executive Officer, Mike Tejada, Executive Vice President and Chief Financial Officer and John Rao, President. And now I’d like to review our Safe Harbor Statement. Certain statements made today, including comments about our expectations regarding future plans and performance, are forward looking statements that are subject to a range of uncertainties and risks that could cause actual results to materially differ. Factors that could cause results to materially differ can be found in our Most recent Form 10K and other reports filed with the securities and Exchange Commission. We assume no obligation to revise or publicly release the results of any revisions to these forward looking statements in light of new information or future events. This presentation also includes certain non GAAP financial measures. A reconciliation of these non GAAP financial measures to their most directly comparable GAAP financial measures is included in our press release and can be found on our website. We will begin with several minutes of prepared remarks which will then be followed by a question and answer period. At this time I would like to introduce our Chief Executive Officer, Ira Burns.

Ira Burns (Chief Executive Officer)

Thank you very much Braulio and good afternoon everyone. I want to start by saying how proud I am of our team. Despite a far more volatile and unpredictable environment than anyone could have expected, we delivered a strong start to 2026, driven by strong execution and the continued benefits of our focused portfolio strategy. As conditions shifted rapidly following the escalation of the conflict in the Middle East, driving sharp price movements and heightened uncertainty across global energy markets. Our teams remain focused, disciplined and deeply engaged with our customers and suppliers. They navigated real world complexity, managing rapid price changes, logistical challenges and tightening conditions while maintaining a clear and consistent focus on safely and efficiently serving our customers. That combination of execution, professionalism and focus is a defining strength of our organization and one that continues to set us apart. Importantly, what you’re seeing in these results is not just resilience in a volatile operating environment, but evidence of the successful execution of our portfolio optimization strategy. As we’ve discussed, our exits from non core and lower margin activities, particularly within land, have enhanced our financial flexibility and increased our ability to focus on investing in areas where we see more predictable, durable and attractive returns. We announced today that World Kinect will serve as our unified corporate and commercial brand for substantially all internal and external purposes. This is the logical next step in our repositioning efforts and reflects our strategic clarity and conviction in our approach to value creation. Our customers around the world already know us as World Kinect and this brand clearly reflects who we are today, a trusted provider of transportation, fuels and complementary services. Just as importantly, this return to our roots reflects the progress we’ve made simplifying the business and allowing our teams to fully focus on the core activities that benefit from scale, generate solid returns and offer meaningful opportunities for long term growth. As noted in our earnings release, WorldConnect will remain as our corporate legal name and our ticker symbol will remain as wkc. With that, I’d like to provide an overview of each of our core operating segments before passing things over to Mike to walk through the financials for the quarter. Marine results were consistent with what we have long communicated when prices rise materially and volatility increases, this business performs exceptionally well. It has happened before and well, it just happened again. It is important to note that this was not simply a quarter in which markets did the work for us. Performance was driven by teams executing under pressure, actively managing pricing, credit exposure and operational risk in real time while continuing to support customers despite challenging market conditions. We consider this a remarkable outcome and I want to recognize our entire Marine team for their accomplishments in the first quarter. Aviation also exceeded expectations this quarter as higher prices and increased volatility expanded opportunities in our core commercial business while also driving increased government related activity. The integration of the universal trip support services business is well underway and we are pleased with both its performance and and how effectively the teams are coming together. Land core activities performed largely in line with expectations with strong card lock and retail results offset by modest softness in our natural gas business. As I mentioned earlier, we have made significant progress with our portfolio exits and expect the vast majority of that work to be completed by the end of the second quarter. Excluding these exit activities, LAND delivered an operating margin significantly above the prior year, reflecting continued momentum and the benefits of our portfolio optimization efforts across the enterprise and more broadly across the markets we serve. Customers increasingly rely on trustworthy counterparties with scale, financial strength and execution capability. Our global platform, long standing supplier relationships and strong balance sheet position us to meet and exceed customers expectations and to continue delivering when reliability matters most. Together, this reflects a simpler, more focused business with a scale, measured execution and balance sheet to reform across a broad range of market conditions. From an earnings standpoint, we delivered incremental profitability in the first quarter with results supported by the high price, high volatility environment we saw across the market. And while more upside is possible given day to day unpredictability, our core expectations for the balance of the year have not changed and our full year assumptions have only been adjusted to reflect the profitability already generated during the first quarter. Mike will walk through our updated guidance in a moment. This quarter’s performance reinforces my confidence in our platform, the strength of our team and the durability of our customer and supplier relationships. Our strong results demonstrate the consistency of our model across a wide range of market conditions and the discipline with which we operate. With that, I’ll turn the call over to Mike to walk through the financial results in more detail.

Mike Tejada (Executive Vice President and Chief Financial Officer)

Mike thank you Ira and good afternoon everyone. Before I discuss the results, I want to briefly address our use of non GAAP measures. As we have stated previously, our GAAP results can include items that do not reflect our ongoing operating performance such as restructuring and exit costs, impairments, operating results of non core divestitures and business exits, and other non recurring items. We provide reconciliations on our Investor Relations website and today’s webcast materials. Total non GAAP adjustments in the first quarter were approximately $16 million or $13 million at the time. Now on to our consolidated results which exclude these non GAAP adjustments. As Ira mentioned, we delivered a strong first quarter benefiting from a dynamic market environment. While our results were grounded in our core businesses performing in line with expectations we set last quarter, they were further enhanced by our team’s strong execution and ability to capture additional upside from pricing and volatility driven opportunities. Our first quarter results were impacted by the conflict in the Middle east and the related market dynamics. In environments like these, we have demonstrated a proven ability to balance our role as a critical partner to our customers while leveraging our scale, supplier relationships and the balance sheet to capture market driven opportunities. This is a key strength of the World Fuel platform and one that affords us the flexibility to generate incremental value when opportunities arise. While these opportunities are not always predictable, they can be meaningful contributors to Our overall performance as we saw this quarter on a consolidated …

Full story available on Benzinga.com

This post was originally published here

Carlisle Companies (NYSE:CSL) released first-quarter financial results and hosted an earnings call on Thursday. Read the complete transcript below.

Benzinga APIs provide real-time access to earnings call transcripts and financial data. Visit https://www.benzinga.com/apis/ to learn more.

The full earnings call is available at https://events.q4inc.com/attendee/246898399

Summary

Carlisle Companies reported Q1 2026 revenue of $1.1 billion, down 4% year-over-year, primarily due to winter weather delays and the non-recurrence of a $15 million tariff-related order from the previous year.

Despite revenue challenges, adjusted EPS rose 1% to $3.63, and adjusted EBITDA margin improved by 50 basis points to 22.3%, driven by productivity gains and cost discipline.

The company reaffirmed its full-year 2026 outlook with low single-digit revenue growth and approximately 50 basis points of adjusted EBITDA margin expansion.

Strategic focus remains on improving profitability, expanding margins, and maintaining strong capital allocation, with a focus on North American markets and reroofing as a primary revenue engine.

Management highlighted ongoing geopolitical and macroeconomic uncertainties, including oil price volatility and interest rate impacts, but expressed confidence in the company’s resilience and strategic initiatives like Vision 2030.

Full Transcript

Colby (Conference Operator)

Good afternoon. My name is Colby and I’ll be your conference operator today. At this time I’d like to welcome everyone to the Carlyle Company’s first quarter 2026 earnings conference call. All lines have been placed on mute to prevent any background noise and after the speaker’s remarks we will conduct a question and answer session. I would like to turn the call over to Mr. Mehul Patel. Neil is the Vice President of Investor Relations. Neil, please go ahead.

Mehul Patel (Vice President of Investor Relations)

Thank you and good afternoon everyone. Welcome to Carlisle’s first quarter 2026 earnings call. I am Mehul Patel, Vice President of Investor Relations for Carlyle. We released our first quarter financial results today and you can find both our press release and the presentation for today’s call in the Investor Relations section of our website. On a call with me today are Chris Koch, our Board Chair, President and CEO, along with Kevin Zimmel, our CFO. Today’s call will begin with Chris will provide key highlights for the first quarter. Kevin will follow Chris, and provide an overview of our Q1 financial performance and our reaffirmed outlook for the full year of 2026. Following our prepared remarks, we will open up the line for questions, but before we begin, please refer to slide two of our presentation where we note that comments today will include forward looking statements based on our current expectations. Actual results could differ materially from these statements due to a number of risks and uncertainties which are discussed in our press release and SEC filings. As Carlyle provides non GAAP financial information, we provided reconciliations between GAAP and non GAAP measures in our press release and in the appendix of our presentation materials which are available on our website. With that, I will turn the call over to Chris on slide three.

Chris Koch (Board Chair, President and CEO)

Thank you Mehul and good afternoon everyone and thank you for joining us today. Carlisle Companies’ first quarter results exemplify the focus and execution our teams consistently deliver even in challenging operating environments. Revenue for the first quarter was $1.1 billion, down 4% year over year, driven primarily by two timing related factors. First, winter weather delayed projects and shipments across many regions in North America. Second, last year’s first quarter benefited from approximately $15 million of tariff related order pull forward from Canadian customers which did not repeat this year. Despite those headwinds, the underlying fundamentals of the business performed as expected and delivered better EBITDA margins in the quarter despite the sales challenges. As we reflected in our year end 2025 call, improving profitABIlity was a top priority for 2026. Q1 results reflected strong execution on that priority with adjusted EPS rising to $3.63 up 1% versus last year and adjusted EBITDA margin expanding by 50 basis points to 22.3%, it is important to underscore that margin expansion in the quarter was a result of our focused efforts. Particularly worth noting in a quarter where volumes were pressured, the margin improvement reflects work that has been underway for several quarters. Our teams have been systematically driving productivity, improving manufacturing efficiency, tightening COSt discipline and simplifying execution across the network, effectively using all parts of the Carlisle operating system or COS. Those actions will continue to compound over time and will drive our forecasted margin expansion under our Vision 2030 goals. This is another reminder that Carlisle is built to perform through cycles, not just at peaks, regardless of the environment. Q1 was a demanding quarter operationally and the team responded exactly the right way. We stayed focused on the areas we can control, COSt discipline, thoughtful pricing, execution and supporting customers through innovation and the Carlisle experience. That execution is clearly reflected in our results. Underlying demand trends in our end markets were consistent with the information from our Q1 outlook based on the Carlisle Market Survey, with weather being the key variable that caused a slight shortfall to projections for the quarter, reroofing activity grew low single digits continuing to provide the stable recurring demand base that defines Carlisle’s resilience across economic cycles. Commercial reroofing remains our primary revenue engine, accounting for roughly 70% of CCM’s commercial roofing business supported by an aging installed base with 20 to 25 year roof life cycles and increasing content per square foot driven by innovation that improves energy efficiency and reduces labor COSts. We also understand that to protect and grow our position in the market, we must strive to be the leader in specifications, systems, performance, comprehensive warranties, the Carlisle experience, and most importantly, trust with contractors, architects and building owners, areas where Carlisle continues to lead. Importantly, orders improved as the quarter progressed and we exited March with better momentum than we entered the year April. Activity to date has been encouraging, with reroofing work in line with seasonal norms and backlog conversion improving as weather disruptions have subsided. Offsetting this is the continued uncertainty in new construction related to the issues we have discussed before, notably interest rates and economic and geopolitical uncertainty. While we remain early in the quarter, the level of order activity we are seeing gives us increased confidence in the trajectory of the business as we move into the second quarter and into the heart of the roofing season. However, at the same time we remain cautious about the second half given the ongoing geopolitical volatility New construction remains soft across both residential and non residential markets and as expected, our full year outlook does not assume a near term recovery. A higher for longer interest rate environment continues to weigh on construction activity and our plans appropriately reflect that reality. Turning to pricing and input COSts, recent geopolitical escalation has materially increased uncertainty in global energy markets. Rising oil prices impacted our petrochemical linked raw materials and freight. We acted quickly in mid March, announcing price increases across both CCM and CWT effective mid April and implementing real time freight surcharges to drive more immediate recovery. In addition, we announced a second round of price increases at CCM today to offset the additional COSt pressures that disruptions in the petrochemical supply chain are driving. Those actions are beginning to work their way through the market and we expect price COSt dynamics to improve sequentially through the remainder of of 2026. It is also important to be clear that we are constantly evaluating the actions in the market by our suppliers and will act accordingly to address any misalignment. More specifically, heightened risk surrounding the Iran conflict and sustained disruption through the Straits of Hormuz introduces uncertainty which we are monitoring very closely. If volatility persists, structural COSt levels reset higher, we are prepared to take additional pricing actions as needed. Our approach remains disciplined and deliberate. We’ve seen this type of situation play out repeatedly during periods of significant disruption, whether during the global financial crisis, the COVID 19 pandemic, or now amid elevated geopolitical risk, Carlisle has demonstrated exceptional margin sustainABIlity. That durABIlity is reinforced by the discipline embedded in Vision 2030, the depth and tenure of our team, our recurring re roofing revenue base, the fact that over 90% of our revenue is generated in North America, and our superior capital allocation approach. Another important contributor to that durABIlity is the way Carlisle allocates capital. We view capital allocation as a core competency, not a byproduct of the business. Across cycles we have consistently prioritized returns over growth for growth’s sake, investing organically where we have durable competitive advantage, pursuing acquisitions only when they meet our stated criteria and returning excess capital to shareholders when that represents the highest and best use. This balanced and disciplined approach continues to differentiate Carlisle and supports our ABIlity to compound value over time. Based on our execution and the actions already underway, we are reaffirming Our full year 2026 outlook of low single digit revenue growth and approximately 50 basis points of adjusted EBITDA margin expansion. Kevin will now walk through the financials in detail.

Kevin Zimmel (Chief Financial Officer)

Kevin thank you Chris and good Afternoon everyone. I will review our first quarter financial results and then provide additional details on our full year outlook for 2026 which is unchanged from the outlook we provided in our previous earnings call. Beginning with consolidated Results on Slide 4, first quarter revenue of $1.1 billion was down 4% compared to last year. As Chris mentioned earlier, the two primary drivers of that decline were the adverse impact of this winter’s harsh weather, limiting the number of days that roofing contractors were were able to spend on the roof, and the absence of approximately $15 million of tariff related pull forward that benefited the first quarter of 2025. M&A contributions from our recent acquisitions slightly offset the organic shortfall. Adjusted EBITDA was $235 million in the quarter resulting in adjusted EBITDA margin of 22.3% of a 50 basis points improvement from the first quarter of 2025. The margin expansion on decreased revenue is the result of strong execution led by COS driven productivity gains, procurement discipline and efficient management of selling and administrative COSts. Adjusted EPS was $3.63 for the quarter up 1% year over year. This increase was driven by share repurchases which more than offset lower organic earnings and higher interest expense. Our segment Performance starts on Slide 5. CCM generated first quarter revenue of $758 million, a 5% decline year over year reflecting lower volumes due to this winter’s weather and last year’s tariff related pull forward along with continued softness and commercial new construction activity partially offset by solid reroofing growth. CCM Adjusted EBITDA was $208 million in the quarter, down 4% year over year. However, adjusted EBITDA margin increased 30 basis points to 27.4%. Cos productivity gains, disciplined procurement and selling and administrative COSt controls all contributed to the improvement in the EBITDA margin. Moving to CWT on slide 6, CWT reported Q1 revenue of $294 million down 1% year over year. The slight decline reflects contributions from from recent acquisitions which mostly offset volume pressure from continued softness in both residential and non residential new construction activity. CWT Adjusted EBITDA was $45 million down 3% year over year. Adjusted EBITDA margin was 15.2%, a decrease of 40 basis points compared to the first quarter of last year. This margin decrease reflects the impact of lower volumes partially offset by the benefits of internal initiatives including footprint consolidation and the expansion of in house production of expanded polystyrene resin from our Plastifab acquisition. We continue to see a clear path to meaningful margin expansion at CWT over the balance of 2026 as these actions compound and integration synergies build. For your reference, Slide 7 provides our first quarter adjusted EPS bridge. Turning to Slide 8, Carlyle’s financial position remains strong. As of March 31, 2026, we had $771 million in cash and cash equivalents and $1 billion available under our revolving credit facility. Our net debt to ebitda ratio was 1.7 times within our target range of 1 to 2 times. This financial strength continues to provide us with significant flexibility to invest in innovation and capital expenditures, pursue synergistic M and A, and consistently return cash to shareholders. Moving to our cash flow on slide 9, seasonality Q1 is the quarter where we deploy cash to pay down debt, year end incentives and rebate liabilities and build working capital ahead of the construction season. Net cash used in operating activities was $45 million in a quarter and free cash flow used in continuing operations was $73 million reflecting a $125 million post year end settlement of an accrued tax related liability. Excluding this tax related payment, operating cash flow improved year over year as we deployed less cash into working capital. During the quarter we invested $28 million in capital expenditures. We also returned $296 million to shareholders through $250 million of share repurchases and $46 million of dividends and we are maintaining our pace toward our annual repurchase target for 2026 of $1 billion. Now turning to our outlook on Slide 10, oil cost volatility, interest rate uncertainty and prolonged geopolitical conflicts are adding broader macroeconomic pressure to an already soft new construction market. However, the Based on our progress to date, we are reaffirming our 2026 outlook. We continue to expect full year consolidated revenue growth in a low single digit range and with our recent price increase announcements, we now expect revenue growth at the higher end of that range along with double digit growth for eps. Our consolidated full year revenue outlook reflects CCM revenue growth and in the low single digits driven by higher prices, continued strength and re roofing more than offsetting slower new construction and CWT revenue also up low single digits as contributions from higher prices and share gain initiatives more than offset continued end market softness. Consistent with our guidance at the beginning of the year, we still expect consolidated adjusted EBITDA margins to expand below by approximately 50 basis points for the full year supported by price realization building through the year to offset raw material increases, continued COS driven productivity gains across both segments and the structural operational improvement actions underway at cwt. We will continue to execute the levers within our control while remaining mindful of the macro risks and limited visibility in this dynamic environment. We remain confident in Vision 2030 and our long term financial targets of $40 of adjusted EPS and 25% plus ROIC. Our path to Vision 2030 is founded on organic growth anchored in steadily increasing reroofing demand and content per square foot cos led margin improvements in both segments, disciplined capital return through share buybacks and targeted synergistic M and A when the right opportunities are available at the right price. These are flexible independent levers. Our strategy does not depend on all of them contributing significantly in every year. As we showed under Vision 2025, the trajectory toward the target can accommodate choppy periods and cumulative execution across these levers over time is what ultimately drives us to our destination. With that, I’ll turn the call back to Chris for closing remarks.

Chris Koch (Board Chair, President and CEO)

Thanks Kevin. Overall, …

Full story available on Benzinga.com

This post was originally published here
SS&C Technologies Hldgs (NASDAQ:SSNC) held its first-quarter earnings conference call on Thursday. Below is the complete transcript from the call.

This transcript is brought to you by Benzinga APIs. For real-time access to our entire catalog, please visit https://www.benzinga.com/apis/ for a consultation.

View the webcast at https://edge.media-server.com/mmc/p/yfudiv5t/

Summary

SS&C Technologies Hldgs reported Q1 2026 adjusted revenue of $1.648 billion, a 9% increase, and adjusted diluted EPS of $1.69, a 14% increase, both records for the company.

The company is leveraging AI to enhance software development and operational efficiencies, with initiatives like the Blue Prism Work HQ platform and increased AI integration.

SS&C Technologies Hldgs raised its 2026 guidance, anticipating revenue between $6.664 billion and $6.824 billion and adjusted diluted EPS growth of approximately 12% at the midpoint.

The company returned $233 million to shareholders in Q1 through share repurchases and dividends, maintaining a strong focus on shareholder returns.

Management emphasized the strategic importance of AI and technology-enabled services, highlighting strong client relationships and market opportunities, particularly in the asset management and healthcare sectors.

Full Transcript

OPERATOR

Good day and thank you for standing by. Welcome to the SSC Technology’s first quarter 2026 earnings call. At this time, all participants are in a listen only mode. Please be advised that today’s conference is being recorded. After the speaker’s presentation, there will be a question and answer session. To ask a question, please press star 11 on your telephone and wait for your name to be announced. To withdraw your question, please press star 11 again. I would now like to hand the conference over to your speaker today. Justine Stone, Head of Investor Relations.

Justine Stone (Head of Investor Relations)

Welcome and thank you for joining us for our Q1 2026 earnings call. I’m Justine Stone, Investor Relations for SS&C Technologies Hldgs. With me today is Bill Stone, Chairman and Chief Executive Officer Rahul Kanwar, President and Chief Operating Officer and Brian Schell, our Chief Financial Officer. Before we get started, we need to review the Safe Harbor Statement. Please note the various remarks we make about future expectation plans and prospects, including the financial outlook we provide, constitute forward looking statements for purposes of the Safe Harbor provisions under the Private Securities Litigation Reform act of 1995. Actual results may differ materially from those indicated by these forward looking statements as a result of various important factors, including those discussed in the Risk Factors section of our most recent annual report on Form 10-K, which is on file with the SEC and can also be accessed on our website. These forward looking statements represent our expectations only as of today, April 23, 2026. While the company may elect to update these forward looking statements, it specifically disclaims any obligation to do so. During today’s call we will be referring to certain non GAAP financial measures. A reconciliation of these non GAAP financial measures to comparable GAAP financial measures is included in today’s earnings release which is located in the Investor Relations section of our website at www.ssctech.com. I will now turn the call over to Bill.

Bill Stone (Chairman and Chief Executive Officer)

Thanks Justine and welcome everyone. The first quarter of 2026 included a war in Iran, tariffs galore, spiking oil prices and other macro headwinds. Nevertheless, we delivered strong first quarter results underscoring SS&C Technologies Hldgs’s resilience based on our performance and visibility. Today we are raising 2026 guidance. We recently rang the NASDAQ closing Bell to celebrate SS&C Technologies Hldgs’s 40 year anniversary of powering mission critical systems our financial services and healthcare clients rely on every day. Our business is built on deep domain expertise, strong trusted client relationships and constant innovation guided by what we call our Customer Zero strategies. These strengths position us well as our industry enters the next phase of technology transformation. Driven by AI, we are updating the name of our largest revenue line item to better reflect the deeply embedded technology framework powering our services business. Technology Enabled Services encompasses our proprietary data streams, domain expertise software, private cloud data center infrastructure with ISO and SOC certifications and the redundancy and multi layered cybersecurity measures required by our sophisticated client base. First quarter results were adjusted revenue of $1,648,000,000 up 9% and adjusted diluted earnings per share of $1.69, a 14% increase. We delivered adjusted consolidated EBITDA of 651 million, up 10% and an adjusted consolidated EBITDA margin of 39.5%. The dollar figures I just said are all Q1 records. Adjusted organic revenue growth was 5% with performance driven by GIDS which grew 10.4%, Globeop, which grew 6.7 and our recent acquisitions are executing ahead of expectation, strengthening our global capabilities and expanding our addressable markets. Intralinks grew 3.2% with positive leading indicators and an increasing adoption of its next generation AI enabled deal center platform. The resilience of our business is highlighted by the 581 billion assets under administration we have added to our fund administration business since Q1 of 2024. Across SSC, we are leveraging AI to enhance software development, increase our speed to market, accelerate implementations, improve customer experience and drive efficiencies. These initiatives support both revenue opportunities and cost leverage over time. All of our teams are partnering closely with Blue Prism to scale our AI operations in a governed and secure manner. For the three months ended March 31, 2026, cash from operating activities was $300 million, up 10% year over year. In Q1 we returned $233 million to shareholders which included 2.3 million shares repurchased for 168 million at an average price of 72.60 and 65 million in common stock dividends. Through share repurchases and our dividend policy, 98% of our allocated capital in Q1 was returned directly to our shareholders. At current levels, our conviction around share repurchase has strengthened and we are prioritizing repurchases. Absent high quality accretive acquisitions replacement, we remain bullish on our opportunities and continue to view AI as a structural tailwind for our business. Our platforms are deeply embedded in our clients day to day operation serving as systems of record and execution. That positioning makes SSZ a natural partner as clients look to advance their AI strategy, I mean their artificial intelligence intelligence strategies. I’ll now turn it over to Rahul.

Rahul Kanwar (President and Chief Operating Officer)

Thanks Bill. We had a strong first quarter. Gids and Globeop built on last year’s sales performance with additional new logo wins and continued upsell and cross sell activity across the business. Disciplined attention to our clients is generating new opportunities. SS&C Technologies Hldgs’s pipelines are robust and as always, execution remains the priority. Our AI capabilities, including agents and workflow orchestration are accelerating how services are delivered. Our Customer Zero strategy is working as intended. Internal adoption of AgentIQ capabilities is driving product maturity, credibility and faster time to market. Deep product expertise is the prerequisite for harnessing these tools and we are well positioned. We serve the largest and most sophisticated firms in the world and as their businesses grow more complex, our platforms grow with them. We sit at the center of their operating models with deeply embedded workflows. These workflows form the natural foundation for further innovation. As Bill mentioned, we’ve renamed our largest revenue line to Technology Enabled Services. Our clients are buying services such as NAV computations, tax returns, regulatory filings, investor interactions, risk calculations and hundreds of others. These services are usually tied to contracts for services rather than software license agreements. Delivery requires deep domain knowledge, expertise, operating complex workflows refined over decades, the networks we operate across counterparties, and secure, resilient infrastructure. We estimate that software, largely in the form of subscriptions, represents 11% of this category. With that, I’ll turn it over to Brian to walk through the financials.

Brian Schell (Chief Financial Officer)

Thanks Rahul and good day everyone. Unless noted otherwise, the quarterly comparisons are to Q1 2025 as disclosed in our press release. Our Q1 2026 GAAP results reflect revenues of $1.647 billion, net income of $226 million, and diluted earnings per share of $0.91. Our adjusted non GAAP results include revenues of $1.648 billion, an increase of 8.8%, adjusted diluted EPS at $1.69, a 14.2% increase. The adjusted revenue increase of $133 million was primarily driven by incremental revenue contributions from GIDS of $38 million, Globeop of $29 million and a favorable impact from foreign exchange of $22 million. As a result, adjusted organic revenue growth on a Constant currency basis was 5% and our core expenses increased 2.9%, or $27 million, which also excludes acquisition and impact of FX. Adjusted consolidated EBITDA was a first quarter record of $651 million, reflecting an increase of $59 million or 10%, and a margin of 39.5% 40 basis point expansion. Net interest expense for the quarter for Q1 2026 was $105 million flat year over year adjusted net income was $418 million up 11.1%. Our effective non GAAP tax rate was 22.5% this quarter. Note. For comparison purposes, we have recast the 2025 adjusted net income and EPS to reflect the full year effective tax rate of 22%. Also note the Q1 diluted share count share count is down $247.6 million from $254.9 million year over year primarily due to lower dilutive shares and continued impact of treasury share. Cash flow from operating activity growth of 10% was driven by growth in earnings. SSC ended the first quarter with $421 million in cash and cash equivalents and $7.5 billion in gross debt. SSC’s net debt was $7.1 billion and our last 12 months consolidated EBITDA was $2.6 billion. Resulting net leverage ratio was 2.76 times as we look forward to the second quarter and full year of 2026 with respect to guidance, we will continue to focus on client service and assume that retention rates will be in the range of our most recent results. We will continue to manage our business to support our long term growth and manage our expenses by controlling and aligning variable expenses, increasing productivity and leveraging technology to improve our operating margins and effectively investing in the business especially with respect to R and D sales and marketing. Specifically, we have assumed short term interest rates remain at current levels an effective tax rate of approximately 22.5% on an adjusted basis capital expenditures to be 4.4 to 4.8% of revenues and a stronger weighting to share repurchases versus debt reduction. 2Q26 we expect revenue to be in the range of 1.64 to $1.68 billion and 5.6% organic revenue growth at the midpoint adjusted net income in the range of 408 to $424 million interest expense excluding amortization, deferred financing costs and original issue discount in the range of 102 to $104 million and adjusted diluted EPS in the range of $1.64 to $1.70 for the full year 2026. We increased our expectations to revenue to be in the range of 6.664 to $6.824 billion …

Full story available on Benzinga.com

This post was originally published here
On Thursday, SAP (NYSE:SAP) discussed first-quarter financial results during its earnings call. The full transcript is provided below.

This transcript is brought to you by Benzinga APIs. For real-time access to our entire catalog, please visit https://www.benzinga.com/apis/ for a consultation.

The full earnings call is available at https://sap.webcasts.com/starthere.jsp?ei=1759289&tp_key=d5b76dd3fd

Summary

SAP reported a strong start to 2026, with significant growth in cloud revenue, up 27% to nearly 6 billion euros, and an operating profit increase of 24% to 2.9 billion euros.

The company highlighted strategic initiatives in AI and cloud services, including the expansion of their SAP Business AI and the introduction of new AI-driven tools for ERP migrations.

SAP maintained its financial outlook for 2026, despite geopolitical uncertainties, and expects continued market share gains driven by its comprehensive portfolio of cloud solutions.

Operational highlights included significant customer wins across various industries and a successful increase in cloud backlog by 25% to 21.9 billion euros.

Management emphasized the importance of AI in the company’s strategy, noting that while large-scale adoption is still developing, SAP’s domain expertise positions it well for future growth.

Full Transcript

OPERATOR

And answer session. If you would like to ask a question, you may press STAR followed by one on your touchtone telephone. I would now like to turn the conference over to Alexandra Steiger, Global Head of Investor Relations. Please go ahead.

Alexandra Steiger (Global Head of Investor Relations)

Good evening everyone and welcome. Thank you for joining us. With me today are CEO Christian Klein and CFO Dominic Assam. On this call we will discuss SAP’s first quarter 2026 results. You can find the deck supplementing this call as well as our quarterly statement on our investor relations website. During this call we will make forward looking statements which are predictions, projections or other statements about future events. These statements are based on current expectations and assumptions that are subject to risks and uncertainties that could cause actual results and outcomes to differ materially. Additional information regarding these risks and uncertainties may be found in our filings with the SEC, including but not limited to the Risk Factors SECtion of our annual report on Form 20F for 2025. Unless otherwise stated, all numbers on this call are non IFRS and growth rates and percentage point changes are non IFRS year on year at constant currencies. The non IFRS financial measures we provide should not be considered as a substitute for or superior to the measures of financial performance prepared in accordance with IFRS. Before I begin, I would like to highlight our upcoming Financial Analyst Conference at SAPPHIRE taking place in Orlando next month. We look forward to seeing you there. For those unable to attend in person, I would like to invite you to join our webcast and with that over to you Christian.

Christian Klein (Chief Executive Officer)

Thank you Alexandra and a warm welcome to everyone joining the call. I’m happy to say that we delivered a strong start to the year. Our Q1 results demonstrate the ongoing momentum across our entire portfolio and the continued success of our strategy. We achieved these results against a shifting macroeconomic environment and while our business is very resilient, we are not completely immune to external dynamics. Uncertainty remains high, just as it does for every company. Still, we keep on delivering quarter by quarter and we are also working on larger announcements for SAP HIRE which will set us up to deliver high value business AI at scale. We look forward to sharing more details with you in Orlando. Let’s begin by looking at our Q1 performance. Our current cloud backlog increased 25% to 21.9 billion euros. Cloud revenue grew 27%, almost crossing the 6 billion euro mark. The strong performance was driven by a 30% acceleration in our cloud ERP suite revenue, bringing total revenue to 9.6 billion euros for the quarter. This was a strong increase of 12% order entry from our Public Cloud solutions accelerated sharply in Q1, continuing the momentum from Q4, public cloud order entry accounted for over 70% of our quarterly volume and with that we keep on gaining market share, especially versus best of breed software vendors. Gartner Research just announced that SAP grew 15 percentage points faster versus the global enterprise applications cloud market in 2025. Our strong top line performance translated directly into our bottom line with an operating margin of 30% up 2.9 percentage points. As a result, our operating profit in Q1 increased by 24% to 2.9 billion euros. Finally, it’s great to see that our growing partner ecosystem performed exceptionally well. Our indirect channel order entry grew significantly faster than our direct channel, accounting for almost 30% of our total order entry. Now let me turn to the broader macro environment. Geopolitical tensions, mainly the conflict in the Middle east, have increased. The war is already having an economic impact in the region and on many energy intensive industries. SAP is of course not completely immune against these disruptions and the economic uncertainty makes it difficult to predict the impact on our total year results. But we have seen many, many times in the past that customers are turning towards SAP in moments like these to invest into the resilience of their business. Our strong portfolio together with our own resilient business model provides a great foundation for SAP in uncertain times. We see this reflected in a very healthy pipeline coverage for 2026. Let’s move on to some great customer wins in Q1. Leading companies from various industries selected Rise with SAP. They included ConocoPhillips in energy, Thales in Defense, Ali Keat in industrial gases and Bristol Myers Grip in biotech. Moreover, PayPal as well as the European division of automaker Hyundai and Swiss automotive supplier Aptif embarked on the wise journey. Our software and cloud offerings also continue to gain traction with an important win at Dfence Co. Deal. Among the net new customers selecting SAP Grow are the superfood brand Oakberry and others Adeso, a leading IT service provider. On the AI and data side, we won Red Bull as well as Carl Zeiss, a global leader in optics and semiconductor manufacturing technology. In addition a leader in building materials, German food company Hoogland and Swedish manufacturer SKF selected SAP Business Data Cloud. We also saw many successful go lives. Samsung Electro Mechanics completed the S4 Hana transformation as part of their RISE journey. Alibaba Cloud and Fonterra, a New Zealand based agribusiness, both completed their transformation journeys with Rise. We are also proud to have supported ExxonMobil with a smooth deployment of their workforce ecosystem project this go live on SAP SuccessFactors now supports more than 60,000 users globally. All of these customer wins demonstrate the confidence in our portfolio. This brings me to the core of our strategy. Business AI There is no doubt that AI will redefine how companies will run in the future. Here are some examples showing how SAP Business AI is already delivering significant value to our customers. At Daimler Trucks North America, SAP Business AI helped transform how the company wins contracts with lead customers. Bid win rates jumped from 10% to more than 40%, delivering a 70 million financial impact within 12 months. Queensland’s Department of Transport and Main Roads uses SAP Business AI to predict road surface issues across 33,000km. Engineers can now run statewide investment optimization in a single day instead of a week. Next to the accelerated speed, this predictive AI use case also generates millions of savings. At German manufacturer Hermann, an AI assistant analyzes complex construction tenders in hours instead of weeks, reducing manual effort by up to 70%. At automotive supplier mature Formpac, the invoicing process was accelerated by more than 9x and product iteration time is now 30% faster. We also see how our AI supports faster and more cost efficient ERP migrations. For example, our partner KPMG uses Joule for consultants to accelerate ERP migrations. Project sprints are now completed up to 20% faster. EY uses SAP generative AI app to accelerate how it delivers SAP transformation projects. AI agents automate key phases from requirements through testing, reducing project delivery timelines by up to 30%. Bosch Digital equipped 1,500 developers with our AI, including SAP tool for developers for their ERP migration. As a result, developer productivity increased by 20% with unit test creation now 15 to 20% faster. All of these AI use cases deliver significant customer value today. At the same time, let’s be honest, large scale adoption of enterprise AI is still in its early stages. Also, we at SAP are learning our lessons every day with our customers about what it truly takes to make business AI work reliably, which is key when you run the world’s most mission critical and complex business processes. Agents organization often don’t have yet the full understanding of business data and processes to deliver highly accurate outcomes. This is needed to deploy at scale and with high accuracy agentic AI use cases in the most mission critical parts of our customers business. But we are learning fast and we are very confident that SAP has compared to many other software companies the right assets to win very deep domain know how about business processes and data as well as enterprise grade governance and security. SAP’s ERP developed over 50 years can also be seen as the institutional brain of every company where data and process domain know how is getting stored. The launch of SAP Business Data Cloud last year was another important step to enable our customers to further expand the SAP Semantical data module to non SAP data. BDC allows our customers to build an end to end data platform which is key for high value AI. At SAP HIRE we plan to announce some fundamental changes to our portfolio to infuse this deep domain know how into SAP’s AI agents and we will govern the agentic AI layer for our customers. This foundational change will enable SAP AI agents at scale to deliver highly accurate results to take actions across end to end processes in a secure manner. So let me address as well a question many of you have in mind. How will the AI transformation impact the financials of our company? First, SAP solutions as the institutional memory of every company will not disappear. On the contrary, we expect to continue to gain market share with our best of suite offering because now more than ever a harmonized data and process layer is key to harnessing the power of AI. With the infusion of AI across our products and migration tools, you will see an increasing share of consumption related cloud revenue in our P and L. But this shift will happen gradually over the next years with the expansion of business AI in our customer base. The good news is that in line with our system of records, the related subscription revenue will not disappear. Also, it is important to highlight that less than 40% of our 2025 cloud revenue was tied to named users. The remaining subscription cloud revenue is priced via non seed based metrics like revenues, memory used and other value related metrics. Let me emphasize once again that the ramp of consumption based cloud revenue will be a gradual evolution and by no means a disruption comparable with the transition from on Prem to the cloud. At our Financial Analyst conference in Orlando, we are going to show you how our AI transformation will expand SAP’s addressable market as well as how both subscription and consumption related cloud revenue will further drive SAP’s growth ambition. Let’s now look at how AI influences the way SAP operates itself. Our internal AI transformation starts with our people and their skills. We are executing comprehensive upskilling programs across the entire organization so every team can confidently apply AI in their day to day work. Our external high wing is highly targeted focusing on recruiting top experts in data and AI. At the same time, AI will help us to run SAP as a company more autonomously in the future. We act as our customer zero using our own AI across engineering support services and go to market with a direct impact on our top and bottom line financials. Let me share with you what we have already achieved with some great examples in our engineering teams. We are using AI to work more efficiently with Joule for ABAP development and by third party tools like Claude Code and GitHub Copilot. We are increasing developer productivity already by over 30% with AI assistance. Our service and support teams are handling significantly higher ticket volumes without a proportional increase in headcount. AI assists 100% of support cases and 20% of our tickets are even resolved by AI fully autonomous. Thanks to these efforts we observed 12% higher productivity in our support function. At SAP, we have more than 80,000 colleagues in services and our consultants save with our AI one day per week by much more efficient system configuration and custom code analysis. This leads as well to faster project delivery and a huge productivity increase for our go to market teams. AI improved our demand generation activities by personalizing and automating outbound campaigns tailored to customer situation. It saved over 83,000 hours and directly influenced the pipeline with additional 50 million euros of value. Even better, it helps us to target the right customers, identifying real pain points early and replacing guesswork with focused engagement up to six times more effectively. As part of our internal transformation, we have communicated a clear goal to achieve a run rate of around 2 billion euros in efficiencies by end of 2028 and we will share further details at our upcoming Financial Analyst Conference. Let me now summarize. We delivered a strong Q1 in a challenging and uncertain business environment. Whenever tensions and crises occur, our software becomes more essential, not optional. This makes us confident for the remaining year. Finally, we are going to make significant progress with business AI in 2026. You will see this come to life at SAP HIRE. With that I hand over to you Dominic.

Dominic Assam (Chief Financial Officer)

Thank you very much Christian and thank you all for joining us this evening. As Christian stated in his opening remarks, 2026 is off to a strong start, supported by healthy current cloud backlog and total revenue growth, continued strength in cloud revenue and strong operating profit performance. These results prove the merits of the strategy we’ve put in place and the cost discipline in managing our business against the backdrop of an increasingly complex and uncertain macroeconomic and geopolitical environment. Now further shaped by the ongoing conflict in the Middle East, SAPPPPPPPPPPPP continues to be a valued partner for organizations of all sizes pursuing end to end digital transformation. And as we look ahead, SAPPPPPPPPPPPP Business AI, the business data cloud as well as the sovereign cloud continue to play an increasingly important role in customer conversations and are becoming more relevant in their decision making and deal activity. We look forward to showcasing the progress we are making across these areas at our upcoming SAPPPPPPPPPPPPPHIRE User Conference in Orlando. Taken together, these results reinforce the trust that leading organizations place in SAPPPPPPPPPPPP as they pursue complex transformation initiatives at speed and at scale. Now let me provide more details around our financial highlights Current cloud backlog reached 21.9 billion euros, up 25% while CCB growth held up remarkably well in Q1, we continue to expect a slight deceleration in this metric over the coming quarters. Shortly after the escalation of the conflict, governments as well as other customers and industries directly affected by the consequences in their supply chains and production facilities reprioritized their activities to what one could characterize as immediate firefighting. Cloud revenue grew by 27%. It was positively impacted by several quarter specific effects as these are unlikely to reoccur. We expect deceleration of cloud revenue growth in the second quarter. Cloud suite revenue increased by 30% in Q1, now accounting for 87% of total revenue. Growth in cloud software licenses revenue decreased by 33%. Finally, total revenue in the first quarter was 9.6 billion euros up 12%. So now let’s take a brief look at our regional performance in the first quarter. SAPPPPPPPPPPPP’s cloud revenue performance was particularly strong in APJ and EMEA and solid in the Americas region. Brazil, France, Germany, India, South Korea, Switzerland and the United Kingdom had outstanding performance while the US were particularly strong. Moving down the income statement, our IFS cloud gross margin in Q1 was 74.6% …

Full story available on Benzinga.com

This post was originally published here

Edwards Lifesciences (NYSE:EW) held its first-quarter earnings conference call on Thursday. Below is the complete transcript from the call.

This transcript is brought to you by Benzinga APIs. For real-time access to our entire catalog, please visit https://www.benzinga.com/apis/ for a consultation.

View the webcast at https://event.webcasts.com/starthere.jsp?ei=1756419&tp_key=ec72b2f736

Summary

Edwards Lifesciences Corp reported strong quarterly performance with notable growth in their TAVR business, driven by market expansion and some share gains.

The company is optimistic about its Sapien X4 pipeline, noting potential enhancements and a confirmatory trial expected to continue through 2026.

Guidance has been raised for TAVR for the year, attributed to better than expected Q1 results and overall market growth.

Management emphasized a focus on realistic and transparent guidance, taking into account previous year’s performance and upcoming challenges.

The company highlighted its strategic focus on mitral and tricuspid valve solutions, projecting growth opportunities and aiming to create new treatment categories.

Edwards Lifesciences Corp completed a significant share repurchase, reflecting confidence in long-term investment value.

The healthcare environment was described as favorable, with recent positive regulatory developments for breakthrough therapies.

Management is actively searching for a new CFO, with the process reportedly progressing well.

Full Transcript

OPERATOR

We try not to focus too much on share because share is a lagging indicator. Share is never driving a business. You know, we as a company, we bring data, we bring evidence, we bring, you know, best innovation to bring to physician, best tools, best solutions so they can take care of their patients. And therefore, you know, everybody is benefiting. So that’s the way we are thinking about it now. Everything that you have seen in the guide, everything that we talk about is in the guidance today. And what we try to do with our guidance is to give you a realistic guidance based on what we know today. So what you talked about happening in mid February and we gave you the best of what we know today. Providing realistic guidance is very important to us. Larry, thank you for the question. All right.

Larry

Hey, Bernard, just for my follow up, it’s been a while since since December, since we heard about Sapien X4. Could you give us a little bit of an update? You talked about confirmatory clinical work. Where does that stand? Thanks for taking the question.

Bernard

No, thank you. Thank you. Thank you, Larry. So I’m going to ask Dan, you know, who is very close to this to give you an update on this platform? Yeah. Hi, Larry.

Dan

Thanks for the question. Clearly, we’re pretty excited about our to have a pipeline in general which includes X4. X4 is a potential game changer for us, especially on the concept of personalized valve sizing. You know that we’ve set a very, very high bar with SAPIEN 3 Ultra Resilia that continues to differentiate. And we see that in the data that we’re just talking about, not only our own data, but also relative to competitive data. We talked about in December that when we put X4 in a clinic, we immediately started to see things that we would think like, hey, if we had the opportunity to enhance that product, we should take it. And we are. And that has to go into a confirmatory trial. And so we’re going to be collecting that evidence through 2026. And when we’ve completed that, we’ll have more to say about the X4 product and the timelines and all those sorts of things. So that’s exactly where we’re at.

OPERATOR

Thank you. Your next question comes from Travis Steed with Bank of America. Please state your question.

Travis Steed (Equity Analyst)

Hey, congrats on a good quarter. Maybe ask about capacity. You’ve had more left atrial appendage closure procedures shifting towards EP. What are you seeing from a capacity standpoint for structural heart doctors when you’re in the field? And are you seeing any kind of benefit on the numbers in the market.

Bernard

Thanks for the question. Capacity has not been an acute matter in the last few quarters. What we have seen is health systems in the US have done a great job managing capacity. They look at their processes, they look at their staffing, they look about how to turn the room faster in between patients. So we have been quite impressed by all what we have been doing and obviously we are there also to support them. But maybe I can add Davine and Dan to add some color here if you have seen anything.

Davine

Yeah, this is Davine. I’ll just make one comment. I think the agility that you talked about, Bernard, is especially true as you start a new therapy like TMTT right when you start like M3 or Evoke, you start taking up lab space. But what we’ve seen is, at least from our standpoint is that as they put in new lab time, they’ve worked across the system to ensure that they’re not taking away from a place like TAVR or something else. From what we’ve seen, they’ve continued to be agile and figuring out, hey, how do we get an extra shift in, how do we get an extra lab running, how do we do other things like that. So that’s been pretty consistent in what we’ve seen as centers get going in TMTT.

Dan

And if I just added from my side, I think it’s the right point. It’s different from hospital hospital, you know, but from a TAVR perspective I think what really helps is that it’s clearly a priority procedure and that’s, you know, based on the evidence. And so there is that ability to navigate some of the acuteness of, of various hospital challenges. We’re on the ground every day with the hospitals trying to understand what their specific issues are, if they have them and how, if anything we can help. But it’s something that we pay close attention to all the time.

Travis Steed (Equity Analyst)

Helpful and then maybe a follow up on the ncd. There’s a lot of stuff in the proposed NCD Centers for Heart Team. Just curious if you think it’ll all go through as proposed and how important are you each of those things in the NCD proposal? And I had a lot of questions on is the US TAVR, was it high single digits or double digits, if you’d answer that too.

Bernard

It is very tough to predict what the final NCD will be. You know that we are very pleased CMS opened the process. The first phase is over. So basically now we are waiting for, you know, I think in a mid June, you know, to get what the draft NCD will be our position, I believe is, you know, fact based in the interest of a patient to make sure they have, you know, a fast access to care. But again, you know, the decision we rely on CMS, that’s on the NCD. What’s the second part of your question?

Travis Steed (Equity Analyst)

Did US TAVR, was it high single digits or double digits this quarter and reviewed titrate between the two?

Bernard

Yeah, we don’t like to give this kind of specifics. So globally TAVR grew 11%. What we said is that TAVR in the US was healthy and at the ous TAVR grew even faster. So I’m sure she can do some math here.

Travis Steed (Equity Analyst)

Fair. Thank you.

OPERATOR

Your next question comes from Robby Marcus with JPMorgan. Please state your question.

Robby Marcus

Great. Thanks …

Full story available on Benzinga.com

This post was originally published here

On Thursday, Associated Banc (NYSE:ASB) discussed first-quarter financial results during its earnings call. The full transcript is provided below.

This transcript is brought to you by Benzinga APIs. For real-time access to our entire catalog, please visit https://www.benzinga.com/apis/ for a consultation.

The full earnings call is available at https://event.choruscall.com/mediaframe/webcast.html?webcastid=Kbrc7qOD

Summary

Associated Banc reported a strong start to 2026 with earnings of $0.70 per share, driven by a 2% increase in total loans and significant growth in core customer deposits.

The company completed the acquisition of American National Bank, boosting its presence in key markets like Omaha and the Twin Cities, and expects to complete integration by late Q3 2026.

Management highlighted strategic investments in expanding commercial operations, including a new CNI office in Dallas and the launch of a national franchise banking vertical, aiming to sustain growth momentum into 2027.

Net interest income slightly decreased from the prior quarter but increased 7% compared to Q1 2025, with expectations of 8% to 10% income growth in 2026.

Asset quality remained strong with total criticized loans decreasing and a low level of net charge-offs; a disciplined approach to risk management is emphasized amid macroeconomic volatility.

Full Transcript

OPERATOR

Good afternoon everyone and welcome to Associated Bancorp’s first quarter 2026 earnings conference call. My name is Kevin and I’ll be your operator today at this time all participants are in a listen only mode. We’ll be conducting a question and answer session at the end of this conference. A copy of the slides that will be referred to during today’s call are available on the company’s website at investor.associatedbank.com As a reminder, this conference call is being recorded as outlined on slide 2. During the course of the discussion today, management may make statements that constitute projections, expectations, beliefs or similar forward looking statements. Associated’s actual results could differ materially from the results anticipated or projected in any such forward looking statements. Additional detailed information concerning the important factors that could cause Associated’s actual results to differ materially from the information discussed today is readily available on the SEC website in the Risk Factors section of Associated’s most recent Form 10K and subsequent SEC filings. These factors are incorporated herein by reference. For a reconciliation of the non GAAP financial measures of the GAAP financial measures mentioned in this conference call, please Refer to pages 28 and 29 of the slide presentation and to page 9 of the press release. Financial Tables following today’s presentation, instructions will be given for the question and answer session. At this time, I’d like to turn the conference over to Andy Harmoning, President and CEO, for opening remarks. Please go ahead, sir.

Andy Harmoning (President and CEO)

Well, good afternoon and thank you for joining our first quarter earnings call. I’m Andy Harmoning and I am once again joined by our Chief Financial Officer Derek Meyer and our Chief Credit Officer Pat Ahern. I’ll start off with some highlights from the quarter and then from there. Derek will cover the income statement and capital trends and Pat will provide an update on asset quality. We entered 2026 with strong momentum as a company following a pivotal 2025 that advanced our growth strategy in several important ways. With relationship loan and deposit growth, record customer growth and solid credit performance combining to drive the strongest annual net income in our company’s history in the first quarter of 2026. We remain squarely focused on maintaining momentum with our growth Strategy and our first quarter results reflect that trend. We posted annualized first quarter checking household growth of 2.2%, an encouraging result in what is typically a slower season for checking acquisition. We delivered over $500 million of period C&I loan growth, a 4.6% increase point to point versus December 31st. We’ve also made meaningful progress on our commitment to accelerate our growth momentum in the major metropolitan markets over the remainder of 2026 and into 2027 year to date, we’ve made several key hires across our revenue lines of business and increased marketing acquisition spend, launched our new CNI office in Dallas and launched a new national franchise banking vertical to further complement and accelerate our growth momentum. We announced the closing of our acquisition of American National bank on April 1. Upon conversion, the combined company will feature a proven relationship focused strategy, a dynamic product suite, a modern digital experience, an effective marketing acquisition engine and expanded commercial capabilities, all positioning us to grow and deepen relationships in growth markets such as Omaha and the Twin Cities. Colleagues from both organizations continue to work closely together to facilitate a smooth and successful integration and we expect to complete the conversion process late in the third quarter of this year. We’re excited about our growth prospects at Associate over the remainder of the year and beyond, but as always, our intention is to grow in a disciplined way. Recent events have introduced volatility at the macro level, but we feel well positioned to navigate this uncertainty thanks to our disciplined approach to risk management, our enhanced profitability profile, a solid capital position, and the resilience and stability of our Midwestern markets. We look forward to providing additional updates on Associated Banks growth journey along the way. With that, I’d like to walk through our financial highlights for the quarter. On Slide 4, we reported earnings of $0.70 per share in Q1 total loans grew by over $600 million or 2% versus the prior quarter. The gross was driven primarily by commercial with CNI balances growing $540 million versus the prior quarter. On the funding side, total deposits grew by $179 million while core customer deposits grew by over $800 million versus Q4. As is typical this time of year, the quarterly increase was impacted by strong seasonal inflows in a handful of accounts in Q1 that flow back out in Q2. With that said, Q1 core customer deposits were up $1.3 billion or 4.5% relative to the same period a year ago. Moving to the income statement Q1, net interest income of 307 million dipped slightly from the record quarterly NII we posted in Q4 but increased 7% relative to Q1 of 2025. Similarly, total non interest income of $76 million decreased by $4 million from a Q4 that saw strong capital markets activity but was up meaningfully versus the same period last year. Total non interest expense of $219 million decreased slightly from the prior quarter. Delivering positive operating leverage remains a primary objective as we continue to execute our plan Shifting to credit Credit Asset quality trends remained strong in Q1 total criticized loans decreased. We booked $11 million of provision and saw just 7 basis points of annualized charge offs for the quarter after posting 12 basis points of charge offs in 2025. As I mentioned previously, we’ve seen strong growth momentum in the early part of 2026 and slide five lays that picture out in greater detail. After several years of investments to modernize our digital experience, enhance our product set and improve our marketing acquisition capabilities, we now have a proven ability to grow our customer base sustainably over time. In the first quarter we posted annualized household growth of 2.2%. This number gives us a strong start to the year as we continue to focus on attracting and deepening customer relationships as a means to decrease our reliance on higher cost wholesale funding sources. We’ve also made significant investments to grow relationships and take market share on the commercial side with a steady cadence of leadership hires, RM hires and expansion capabilities. In Q1, we posted over $500 million in CNI loan growth, nearly a 5% quarterly growth rate. Pipelines have remained strong on both loans and deposits and we expect our momentum to carry throughout the year. And as mentioned, we closed our acquisition of American National bank on April 1. This partnership provides opportunities to deepen relationships with existing American national customers through our expanded product set and capabilities while also providing growth opportunities in major metro markets like Omaha and Twin Cities, which are both growing faster than the average Midwest. The investments we’ve made in prior years are driving results in 2026, but we also expect to sustain and accelerate our growth strategy into 27 and beyond. With that in mind, we executed on several investments here early in 2026 that are intended to drive additional momentum. First, we’ve leveraged our best in class value proposition and a proven marketing acquisition engine to accelerate customer growth. As a reflection of these efforts, our marketing acquisition spend was up 23% in Q1 versus the same period a year ago. As we continue to attract and deepen relationships, we’re building a stronger pipeline into our private wealth business, particularly in major metropolitan markets where we’re under penetrated. To capitalize on these opportunities, we hired Lisa Buteau earlier this month as Director of Private Banking for major metropolitan markets. Based in the Twin Cities, Lisa brings more than 25 years of expertise and she most recently served as Managing Director and private wealth Banking Manager at Wells Fargo where she led client facing banking and lending teams across 11 states. We’ve also taken several steps to drive incremental growth in commercial adding another wave of talented bankers and expanding our capabilities. After launching a new CNI office in Kansas City last year and seeing promising results, we expanded the team in Q1 with one additional RM and two additional professionals. Based in part on the successful model we’ve developed in Kansas City, we also officially launched a new CNI office in Dallas. The commercial market leader has been hired and we expect RMM hires to begin in May and earlier this week we announced a new nationally focused franchise banking vertical led by Shawn Cord, based in the Twin Cities. Shawn brings more than 30 years of experience with deep expertise in scaling specialty banking platforms and building high performing teams. Most recently, she led the National Franchise Banking Division for Bremer Bank. We also brought on a new RM and three other professionals to round out Shawn’s team as we work to accelerate growth across the company. The successful integration of American national is a key priority to position our combined company for long term growth and Success. On slide 6, we provide a reminder of the expected benefits of the partnership and an updated timeline of the integration process and three weeks post close we are on track. In the days immediately following the close on April 1, we had over 40 legacy associated colleagues on the ground in Omaha. We’ve completed culture surveys, repositioned their securities portfolio, completed the colleague decisioning process and achieved several other integration milestones along the way. We’ve been impressed by the passion, enthusiasm and cultural fit our new colleagues have shown within the combined organization and the professionalism they’ve exhibited as they navigate change. Maintaining a strong local leadership presence in our newest market is a top priority and last week we announced Jason Hanson as a Business Segment Leader for Commercial Banking and our new Market President for Nebraska and Western Iowa. Jason most recently served as President of American national bank and he is uniquely qualified to position our combined company for a long term growth and success in Omaha and beyond, having joined American National bank in 2000. Looking ahead, colleagues from both organizations continue to work closely to ensure smooth integration process and we are on track for conversion of accounts, systems and branches in late Q3 of this year. We expect to finalize purchase accounting adjustments later this quarter. On slide 7, we recap our plans to drive sustainable growth in 2026 and beyond and it starts right here in Wisconsin. We have a 165 year foundation of longstanding loyal relationships in the Badger State that provide us with strong funding base for growth. Looking forward, we see plenty of opportunities to grow and deepen relationships across the state, but we also see clear opportunities to accelerate our growth momentum with an expanded presence in major metro markets we’re already seeing the strategy pay off in legacy upper Midwest metros like Milwaukee, Chicago and the Twin Cities, where we’re growing households and driving relationship loan and deposit growth. We’re seeing similar success stories emerge in newer markets like Kansas City, where we’ve already expanded a commercial team that launched just a year ago. And already in 2026, we’re further expanding our presence in the strategic growth markets through the American National Deal, which provides entry into Omaha and deepens our presence in the Twin Cities and through the new CNI office we launched in Dallas. Based on the strong results we’ve seen through the first quarter and the additional investments we’ve made in early 2026, we’re on track to achieving our targets for household growth and CNI loan growth in 2026, and we expect our ongoing efforts to drive growth momentum sustainably over time. Shifting to our core financial results, we highlight our quarterly loan Trends on Slide 8. We saw strong loan growth in Q1, particularly in the back half of the quarter, with total period end loans up 2% or $635 million relative to Q4. As has been the case the past several quarters, CNI loans led the way with nearly 540 million of period end loan growth during the quarter. We also saw total CRE balances increase by $143 million as loan production outpaced lower than expected payoffs during the quarter. We continue to expect payoffs to materialize throughout the year after including the impact of American National Acquisition. We now expect 2026 period end loan growth of 17% to 19% as compared to associated standalone results for the year ended December 31, 2025. Shifting to slide 9 period end deposits grew by 179 million during Q1, while core customer deposits grew by 3% or $820 million. As mentioned, the strength in core customer deposit core customer balance flow was impacted by seasonal inflows we typically see towards the end of the quarter in a handful of accounts. With that said, Q1 core customer deposits were up 4.5% relative to the same period a year ago. Over the course of the quarter, we also saw balances shift away from brokered CDs and network transaction deposits and into customer deposits and wholesale sources such as FHLB and other wholesale. We also accelerated our funding in Q1 to keep pace with strong loan growth we saw during the quarter over the remainder of 2026. We’re bullish on our ability to drive incremental core customer deposit growth thanks to a best in class consumer value proposition household growth momentum supported by increased marketing acquisition spend in growth markets and and significant momentum in our commercial deposit gathering capabilities. After including the impact of American National Acquisition, we now expect 2026 period end total deposit growth of 17% to 19% and period end customer deposit growth of 19% to 21% as compared to associated standalone results for the year ended December 31, 2025. With that, I’ll pass it over to Derek to discuss our income statement and capital trends.

Derek Meyer (Chief Financial Officer)

Thanks Andy. I’ll start with the Yield trends on slide 10 in Q1. The yields on our largely floating rate CRE and commercial books both decreased by 29 basis points during the quarter. We also saw an 11 basis point decrease in auto yields, a slight increases in the investment portfolio. On RESI Mortgage, total interest bearing Deposit costs decreased by 17 basis points in Q1 and we’re down 47 basis points since Q1 of last year. In Q1, total earning asset yields decreased 14 basis points to 5.2% while …

Full story available on Benzinga.com

This post was originally published here

Ameriprise Finl (NYSE:AMP) released first-quarter financial results and hosted an earnings call on Thursday. Read the complete transcript below.

Benzinga APIs provide real-time access to earnings call transcripts and financial data. Visit https://www.benzinga.com/apis/ to learn more.

View the webcast at https://events.q4inc.com/attendee/324934392

Summary

Ameriprise Finl reported a strong start to 2026 with adjusted operating revenues up 11% to $4.8 billion and EPS up 19% to $11.26, showcasing robust financial performance.

The company’s assets under management, administration, and advisement grew by 12% to $1.7 trillion, driven by client net inflows and positive market conditions.

Ameriprise Finl continues to invest in technology and AI to enhance advisor productivity and client engagement, with the introduction of new banking products and the expansion of the advisor-focused tech platform.

The acquisition of Huntington Bank’s retail investment program is expected to add 260 advisors and $28 billion in assets, emphasizing strategic growth and partnership.

Management remains disciplined in capital allocation, with 88% of operating earnings returned to shareholders and a 6% dividend increase, indicating strong shareholder value focus.

Full Transcript

Jael (Operator)

Welcome to the Q1 2026 earnings call. My name is Jael and I will be your conference operator for today’s call. At this time all participants are in a listen only mode. Later, we will conduct a question and answer session. During the question and answer session, if you have a question, please press Star one on your touchtone phone. As a reminder, the conference is being recorded. I’ll now turn the call over to Stephanie Raby. Stephanie, you may begin.

Stephanie Raby

Welcome to Ameriprise Financial’s first quarter earnings call. On the call with me today are Jim Cracciolo, Chairman and CEO and Walter Berman, Chief Financial Officer. Following their remarks, we’d be happy to take your questions turning to our earnings presentation materials that are available on our website. On slide 2 you will see a discussion of forward looking statements. Specifically during the call you’ll hear references to various non GAAP financial measures which we believe provide insight into the company’s operations. Reconciliation of non GAAP numbers to their respective GAAP numbers can be found in today’s materials and on our website at www.ir.ameriprise.com. Some statements that we make on this call may be forward looking Reflecting management’s expectations about future events and overall operating plans and performance, these forward looking statements speak only as of today’s date and involve a number of risks and uncertainties. A sample list of factors and risks that could cause actual results to be materially different from forward looking statements can be found in our first quarter 2026 earnings release, our 2025 annual report to shareholders and our 2025 10K report. We make no obligation to publicly update or revise these forward looking statements. On slide 3, you see our GAAP financial results at the top of the page for the first quarter. Below that you see our adjusted operating results, which management believes enhances the understanding of our business by reflecting the underlying performance of our core operations and facilitates a more meaningful trend analysis. Many of the comments that management makes on the call today will focus on adjusted operating results and with that I’ll turn it over to Jim

Jim Cracciolo (Chairman and CEO)

Good afternoon and thanks for joining us. As you saw in our earnings release, Ameriprise delivered a strong start to the year driven by our disciplined execution and the benefits of our diversified business. While the first quarter was marked by ongoing market volatility and economic uncertainty contributing to a more cautious client behavior, our value proposition continued to clearly differentiate us across our firm. We remain deeply engaged with clients and delivered excellent Financial performance. We’re focused on maintaining a high quality, well positioned business while continuing to invest and innovate to support dynamics long term client relationships. Our business generates consistent earnings across market cycles. Equally important, we maintain a disciplined approach to capital allocation that enables Ameriprise to deliver strong value to shareholders. For the quarter, adjusted operating revenues up 11% to $4.8 billion. Earnings and EPS were also up double digits with EPS up 19% to a record $11.26. And we continue to deliver best in class ROE which increased to more than 54%. In addition, our assets on the management administration advisement grew 12% to $1.7 trillion driven by our client net inflows and positive markets. The consistency of these results reflect the strength of our integrated business and the benefits of our approach. Very clearly, Ameriprise is distinguished by the compelling experience we deliver to both clients and advisors across our firm. We remain focused on serving client needs and best interests exceptionally well. That differentiation is reflected on a consistently earnings excellent client satisfaction which continues to be 4.9 out of 5 and also by the recognition our firm receives year after year. On the advisor side, our distinctive value proposition drives sustainable practice growth, higher productivity and recurring revenue over time. Turning to our results, total client assets grew 12% to $1.1 trillion with wrap assets growing 16% to $664 billion in the quarter. We were lighter on flows based on more cautious client behavior and some lumpiness in recruiting and terminations. We ended the quarter with $6 billion of wrap net inflows. Importantly, underlying activity was good for the quarter. We kept clients closely engaged and delivered strong Transactional activity up 10%. Our cash business remains stable with nearly $30 billion in suite balances. As you saw, our advisors again generated meaningful productivity and revenue growth, with productivity increasing another 10% in the quarter to a record $1.2 million per advisor. Our strategy remains grounded in organic growth built, not bought. Advisors consistently value Ameriprise for the depth of our value proposition and the strength of our partnership. We continue to prioritize our core Advisor team productivity and we complement it by recruiting high quality advisors who view us as a strategic partner supporting strong client outcomes and practice growth. 61 advisors joined during the quarter and were seeing a pickup of activity in the second quarter and in AFIg we continue to expand this channel as a premier platform for banks and credit unions. During the quarter we signed a multi year agreement to become the retail investment program provider for Huntington Bank. This relationship is expected to add approximately 260 advisors and $28 billion in assets with onboarding beginning later this year. Huntington selected Ameriprise for our leadership and advice, strong culture and capabilities as we shared, we consistently invest across our firm to meet client needs today and further strengthen the business for the future. These are intentional multi year investments across technology systems and new capabilities. We’re focused on clear, high impact outcomes that deepen engagement, deliver relevant and actionable information while enabling highly personalized quality experiences. In particular, we’ve designed our tech platform around how advisors work, not individual tools. It connects multiple capabilities like our CRM platform E meeting advice, insights and practice workflows into an intelligent ecosystem enhanced with embedded AI and automation. To that end, we feel good about the progress we’re making. Our focus is on using AI and intelligent automation capabilities at scale to help advisors deliver a consistent, high quality client experience while improving how they operate day to day in terms of investments and solutions. After the initial launch of our signature Wealth UMA MID last year, we now expanding the product capabilities and seeing positive early asset movement and engagement. There is meaningful upside as we continue to expand capabilities including the introduction of SMAs and as we broaden the strategy set over time with regard to our bank solutions which complement our overall offering. Bank assets now exceed $25 billion with continued strength in pledge lending. With the recent introduction of products including HELOCs and checking accounts, we now offer a complete suite. As we reach more of our advisors and clients, we expect this will present opportunities to bring additional assets to our firm. To close out AWM, we received new recognition in the quarter for the 2026 J.D. power US Investor Satisfaction Study, Ameriprise ranked third out of 23 firms overall, a terrific result that underscores the quality of the experience we deliver. Turning to our retirement and protection business, as advisors deliver more comprehensive advice, they are thoughtfully incorporating annuity and insurance solutions to address clients increasingly complex needs. Sales were solid in the quarter, supported by by continued demand across annuities and annuities and variable products. In addition to meeting client needs, this business continues to generate attractive margins and consistent earnings over time, but RiverSource again recognized as one of the most profitable insurers in the industry. Moving to asset management, Assets under management and advisement increased 8% year over year to $706 billion in the quarter. Investment performance remains a strength. More than 70% of our funds are performing above the peer medium over 1, 3 and 5 year periods and 85% are above the medium over 10 years. This sustained performance continues to be recognized externally in the most recent Barron’s Best Fund Family rankings, Columbia Threadneedle placed in the top 10 across all time periods and our US fixed income team recently earned four 2026 Lipper awards. Importantly, net outflows improved significantly year over year to $5.9 billion, reflecting better trends across both retail and institutional channels. Gross retail sales in North America continue to improve, up 26% even in a volatile market environment and we’re seeing nice sales within Ameriprise from good initial sales and signature wealth. Retail flows and EMEA also improved, however they were impacted by headwinds from the geopolitical volatility during the quarter. On the product side, we continue to advance our strategy across ETFs, SMAs and alternatives with a clear focus on scale, consistency and performance. Our ETF platform surpassed $10 billion in assets under management supported by a differentiated offering across North America and emea. In smas, we benefit from long standing track records and remain a top 10 provider with continued positive flows in alternatives. Our technology and healthcare hedge fund strategies delivered strong performance and sales momentum and we see good opportunities ahead. Consistent with our approach in wealth management, we’re applying advanced analytics and technology within asset management, including in investment research where these capabilities are contributing real value. At the same time, we’re transforming how we leverage our global platform. We’re driving greater efficiency across the front, middle and back office while continuing to strengthen our data foundation. We’re also making good progress on back office outsourcing with a substantial portion of the conversion expected to be completed later this year. These initiatives complement our broader efforts to streamline systems and support operating leverage over time. Now for Ameriprise overall, our focus is having a premium branded, client focused business that delivers strong financial performance and attractive returns. Over the past year we have achieved record earnings and generated best in class return on equity now exceeding 54%. As I mentioned, given this performance and our current valuation, we continue to view our shares as an attractive buying opportunity. As a result, as you know, we increased our share repurchases in the fourth quarter and continued our strong return to shareholders with 88% returned in the first quarter and our board just approved another 6% increase in our dividend. Ameriprise is built to perform across market cycles. We’re well positioned to deliver meaningful value over time, manage risk responsibly and generate resilient performance. Before I close, I want to highlight the iconic Ameriprise reputation which remains an important competitive advantage. We are proud to have a company that continues to be widely recognized in the marketplace for who we are and how we operate in the minds of consumers, employees and investors. Ameriprise has been named one of America’s most trustworthy companies in 2026 by Newsweek and from Fortune. Ameriprise is also one of America’s most innovative companies for 2026, affirming our leadership in technology and driving transformational change. In closing, Ameriprise offers a differentiated combination of an excellent client and advisor, value proposition, sustainable profitable growth and attractive capital return. With that, I’ll turn it over to Walter to discuss our financials in more detail.

Walter Berman (Chief Financial Officer)

Thank you, Jim. Ameriprise delivered strong financial results in the quarter with adjusted operating earnings per share up 19% to $11.26 and an operating margin of 28%. These results reflected the strength of our diversified earnings profile and the operating leverage embedded in our businesses as well as the return from significant investments we have continued to make. Our ability to generate attractive growth and margins across cycles underscores the durability of our platform and the discipline we bring to execution. Total assets under management, administration and advisement increased 12% to 1.7 trillion which coupled with strong client engagement drove an 11% increase in revenues to 4.8 billion. In the quarter, we returned 88% of operating earnings to shareholders through share repurchases and dividends. Our balance sheet remains exceptionally strong with 2.3 billion of both excess capital holding company available liquidity. Let’s turn to wealth management Financials on slide 6. Adjusted operating net revenues increased 14% to 3.2 billion. The core distribution business is performing well given the value of our planning model and the multiple touch points we have with the client to meet their needs holistically. Our fee based and transaction revenues remain quite strong increasing 17% benefiting from growth in client assets and higher activity levels. In addition, our bank revenues increased 6% from business growth including the expansion of our lending products while revenues from cash sweep and certificates declined. Adjusted operating expenses in the quarter increased 12% with distribution expenses up 14%. I will note that advisor compensation within distribution expenses increased in line with the revenues advisors generate. G and A expenses were a 4% primarily driven by volume and growth related expenses including investments in signature wealth and banking products. This level was consistent with our expectations pre tax adjusted operating earnings increased 20% to 951 million with continued strong contribution from core distribution and core cash earnings. In the quarter, Comerica exercised their option for early termination of your relationship with us. This resulted in a one time 25 million make whole payment for onboarding cost and future earnings which finalized all payments that were due to us for this termination. Excluding this benefit, earnings increased 17%. Our core distribution earnings grew in the mid-30s 30% range, benefiting from higher client assets and advisory fees as well as strong activity levels. The strong level of core distribution earnings that we generated is unique relative to other independent wealth managers and demonstrates our focus ensuring that our growth is profitable. Bank earnings grew 6% in the quarter while certificate earnings declined. In total, core cash earnings were essentially flat from a year ago. We continue to take actions to build the bank portfolio in a way that supports stable earnings contributions going forward. The overall bank has a yield of 4.6% with a four year duration with now only 7% of the portfolio in floating rate securities. In the quarter, new purchases at the bank were 1.9 billion at a yield of 5% with a 4.1 year duration. Last, our aggregate margins remained excellent at 30% up from 28% a year ago. Underlying that, our core distribution margin is over 20% with a solid contribution from cash. Let’s turn to slide 7. Advice and wealth management generated solid asset growth in the quarter. Client assets grew 12% to 1.1 trillion and wrap assets increased 16% to 664 billion driven by solid organic growth, stronger buys of productivity and equity market appreciation. Our new signature wealth program continues to gain momentum and a significant portion of the assets are new money to ameriprise. Client flows were 4.2 billion and rap flows were 6 billion in the quarter. This reflected several moving pieces that I will explain. Same store sales levels remain strong and consistent aside from the normal seasonal impacts and climb caution resulting from volatility in the quarter. However, in the quarter we had some lumpiness in our flows caused by a combination of the aggressive recruiting environment which drove higher advisor departures as well as the acceleration of Comerica Advisors departing as a result of their acquisition. We anticipate the higher pace of outflows related to Comerica will continue in the second and third quarters, culminating with the conversion occurring near the end of the third quarter. While we have significant capacity to recruit, the recruiting deals we are seeing today in this perceived risk on environment exceed what we believe is a balanced risk return approach. Given the long cash paybacks and marginal P and L benefits over the extended life of these arrangements. We will continue to evaluate the facts and circumstances, whether for recruiting or retention, to assess the trade offs between sustained profitability versus flows and associated risk. This approach will ensure decisions are driving sustained shareholder value creation. Lastly, I will note that in the latter part of the quarter we’ve seen improving trends as we look ahead. The addition of Huntington bank is anticipated in the fourth quarter and will bring approximately 260 of ours and 28 billion of client assets onto our platform. Separately, we are further enhancing our advisor succession strategies for both internal and external advisors, including expanding and leveraging Ameriprise’s personal wealth group, our centralized advisor group, as a potential secession option. Let’s turn to slide 8. Advisor Wealth Management generated solid productivity growth. Our advisor productivity continues to grow, reaching a new high of 1.2 million, up 10% year over year, driven by strong growth in wrap assets and related fees as well as enhancements to advisor efficiency from the integrated tools, technology and support we provide. In addition, transactional activity remains strong, increasing 10% compared to the prior year. This is primarily …

Full story available on Benzinga.com

This post was originally published here

United Airlines Holdings Inc (NASDAQ:UAL) CEO Scott Kirby spent part of his company’s Q1 earnings call Tuesday publicly lobbying against the Trump administration’s looming rescue of Spirit Aviation Holdings (OTC:FLYYQ), calling the discount carrier’s business model “fundamentally flawed” and arguing no federal intervention was warranted.

Kalshi traders are pricing it to happen anyway.

What Kirby Said

“I feel bad for the people of Spirit, but it’s been pretty obvious that Spirit’s business model was fundamentally flawed and the airline was not going to be able to make it or ever cover their cash operating costs. So I hope that doesn’t happen,” Kirby said.

He framed the broader industry case against a bailout just as bluntly.

“Well run airlines are still solidly profitable even in this environment as you can see from United. I don’t think this crisis is anywhere near big enough to cause the need for an airline bailout.”

Kirby added that United had “so distanced” itself …

Full story available on Benzinga.com

This post was originally published here

Accenture PLC (NYSE:ACN) shares are down 7.14% on Thursday. The company is investing in Iridius to enhance AI compliance solutions for life sciences. This move comes during a mixed market day, with the S&P 500 slipping slightly.

Last month, the firm reported second-quarter 2026 results, with a cautious outlook that overshadowed an earnings and revenue beat.

• Accenture shares are approaching critical lows. Why did ACN hit a new low?

“Our new strategic acquisitions will further strengthen our capabilities and expand our scale to help clients create value and achieve AI-based transformation,” said CEO Julie Sweet in a press release dated March 19

As of Feb. 28, the firm had cash and equivalents worth $9.399 billion.

What Happened?

With the latest development, Accenture has announced an investment in Iridius, an enterprise AI infrastructure company, to integrate regulatory compliance into AI solutions for the life sciences sector. This partnership aims to streamline compliance workflows and accelerate AI adoption while ensuring that regulatory standards are met.

The broader market saw minor fluctuations, with the S&P 500 down 0.03% and the Dow Jones slipping 0.15%. Accenture’s decline comes as the Technology sector is experiencing slight gains, indicating that the stock’s movement may be influenced by company-specific factors rather than overall market trends.

Accenture is currently trading near the lower end of …

Full story available on Benzinga.com

This post was originally published here

Banc of California (NYSE:BANC) held its first-quarter earnings conference call on Thursday. Below is the complete transcript from the call.

This content is powered by Benzinga APIs. For comprehensive financial data and transcripts, visit https://www.benzinga.com/apis/.

The full earnings call is available at https://edge.media-server.com/mmc/p/nsw7ch8h/

Summary

Banc of California reported a strong financial performance for Q1 2026, with a 50% increase in EPS to $0.39 and a 28% rise in pre-tax pre-provision income.

Strategic initiatives included a share buyback program, a dividend increase, and plans to redeem subordinated debt, reflecting confidence in long-term value creation.

The company expects continued net interest margin expansion and stable credit quality, with plans to further optimize its balance sheet and leverage AI for operational efficiency.

Loan production remained robust at $2.1 billion, driving balance sheet remixing towards higher-rate loans despite a declining rate environment.

Management reaffirmed guidance for 20-25% pre-tax pre-provision income growth and 3-3.5% non-interest expense growth for 2026, highlighting confidence in their strategic execution.

Full Transcript

OPERATOR

Hello and welcome to Banc of California’s first quarter 2026 earnings conference call. If you need operator assistance, please press star then zero. I’ll now turn it over to Ann DeVries, head of investor Relations at Bank of California. Please go ahead.

Ann DeVries (Head of Investor Relations)

Good morning and thank you for joining Banc of California’s first quarter earnings call. Today’s call is being recorded and a copy of the recording will be available later today on our investor Relations website. Today’s presentation will also include non GAAP measures. The reconciliations for these measures and additional required information is available in the earnings press release and earnings presentation which are available on our investor relations website. Before we begin, we would also like to remind everyone that today’s call will include forward looking statements, including statements about our targets, goals, strategies and outlook for 2026 and beyond are subject to risks, uncertainties and other factors outside of our control and actual results may differ materially. For a discussion of some of the risks that could affect our results, please see our Safe harbor statement on forward looking statements included in both the earnings release and the earnings presentation, as well as the Risk Factors section of Our most recent 10-K. Joining me on today’s call are Jared Wolf, Chairman and Chief Executive Officer and Joe Couder, Chief Financial Officer. After our prepared remarks, we will be taking questions from the analyst community. I would like to now turn the conference call over to Jared.

Jared Wolf (Chairman and Chief Executive Officer)

Thanks Ann Good morning everybody. We’re pleased to report another strong quarter for Banc of California with year over year earnings growth, net interest margin expansion and continued positive operating leverage. First quarter earnings per share grew 50% from a year ago to $0.39 driven by continued net interest margin expansion and positive operating leverage. Pre-tax, pre-provision income increased 28% while our adjusted efficiency ratio improved by nearly 500 basis points year over year. More importantly, the quarter reinforced our confidence in the earnings trajectory ahead. We continue to see durable momentum across the core drivers of the franchise, including margin expansion, deposit mix improvement, disciplined expense management and embedded balance sheet remixing that should support profitability and shareholder value for the coming quarters. Efficient use of capital remains an important priority for us. In the first quarter we repurchased 1.7 million shares and also extended our buyback program through March 27th and increased our dividend from $0.10 per share to $0.12 per share. We also announced our plans to redeem $385 million of subordinated debt in May. These actions reflect both our confidence in the long term value we are building and our commitment to deploying capital thoughtfully and opportunistically for the benefit of shareholders. Our core earnings engine continues to generate capital at a healthy pace with CET1 ratio ratio of 10.18% at quarter end while our tangible book value per share increased 1.5% quarter over quarter to $17.77. Core deposit trends were constructive during the quarter with continued growth in average non interest bearing deposits of 4% annualized quarter over quarter and improvement in deposit mix with nib representing about 29% of total average deposits. We continue to steadily attract new business relationships and are also seeing non interest bearing deposit balances ramp up and in previously opened accounts with average balances per account of 2.5% from the prior quarter. That reflects the quality of the relationships our teams are bringing in and the strength of our relationship based deposit strategy. Loan production and disbursements remain strong at 2.1 billion in the quarter with healthy and broad based activity across the portfolio. Strong production levels continue to drive the remixing of the balance sheet toward higher rate loans from lower fixed rate legacy CRE loans. This remixing has helped protect our overall loan yield and net interest margin despite a declining rate environment. We expect the margin benefit from remixing to continue as new production comes in at meaningfully higher rates than maturing loans providing embedded earnings upside in the portfolio. New production in Q1 came in at a rate of 6.65% while fixed rate and hybrid loan repricing or maturing by year end have a weighted average coupon of 4.7%. We view that ongoing remixing as an important driver of future net interest income growth. This quarter we continue to manage credit proactively, remaining quick to upgrade and slow to downgrade. This resulted in some credit migration during the quarter which was concentrated in a few specific real estate credits and does not reflect a broad change in portfolio performance or underwriting standards. We believe this disciplined approach to managing credit is important because it allows us to address issues early and helps reduce the risk of larger surprises later and should keep credit from becoming a more meaningful headwind as we continue to grow earnings. As in the past, we will migrate credit when appropriate to take proactive action. We expect the ratios to improve over several quarters and importantly, such migration will not disrupt our earnings trajectory. This quarter’s delinquency and special mention inflows were primarily driven by a limited number of credits with defined resolution paths. Special mentioned inflows and delinquency inflows were driven primarily by LIHTC or low income housing tax credit loans tied to a long standing customer where we’ve had a relationship for more than 20 years with no historical losses. The loans have low loan to values and personal guarantees in place and strong collateral values and we expect them to be made current before the end of the second quarter. Classified inflows were tied mainly to two multifamily loans in a single relationship tied to a long standing customer of the company. These loans were restructured with credit enhancements and are not expected to result in any losses. Overall, we do not expect losses to appear with migrated loans based on our strong collateral and defined resolution paths. Net charge offs were 13.8 million or 23 basis points annualized and were driven by two specific situations that had already been identified and actively managed. Net charge offs also included a partial charge off related to a hotel property that migrated to non performing status in 1Q25 and an office loan where the balance was adjusted to reflect an updated appraisal. While the loan remains current and performing, we do not view these items as indicative of broader deterioration trend in any of our portfolios. Importantly, reserve levels remain solid. We increased reserves where appropriate in the areas that saw migration. Taken together, we do not expect this quarter’s credit migration to disrupt reserve earnings trajectory. Our balance sheet remains strong with healthy capital and liquidity positions. We are also encouraged by the constructive backdrop from proposed regulatory changes around capital requirements which if finalized substantially as proposed, could provide 150 to 160 million dollars of additional CET1 ratio that would create additional flexibility as we evaluate attractive capital deployment opportunities, including further optimizing our balance sheet to accelerate our earnings trajectory, supporting prudent balance sheet growth and returning capital to our shareholders. The $150,000 to $160 million is a baseline projection and could be higher under various scenarios. Overall, this was another strong quarter for Banc of California. We continue to build the company the right way with disciplined execution, a strong and resilient balance sheet and a clear focus on sustainable growth and and long term shareholder value. Let me now turn it over to Joe for some additional financial details and I’ll return afterwards.

Joe Couder (Chief Financial Officer)

Joe thank you Jared. For the quarter we reported net income of $62 million or 39 cents per diluted share which was up 50% from 26% per diluted share in the comparable period prior year period. Net interest income of 251.6 million increased 8% year over year and was relatively flat versus the prior quarter. The increase in net interest income from a year ago reflects materially improved funding costs, while the linked quarter variance was mainly due to 2 fewer days in Q1 versus Q4 Q1 interest income from securities also increased due to the purchase of high yielding securities and a 1.3 million special dividend on Federal Home Loan Bank (FHLB) stock. Net interest margin expanded to 3.24% up 4 basis points from Q4 and 16 basis points from a year ago driven primarily by lower funding cost. Our spot NIM at 3-31- was 3.22. After normalizing for the Federal Home Loan Bank (FHLB) special dividend, we expect NIM to continue expanding through the remainder of the year supported by strong production, ongoing balance sheet remixing and disciplined deposit pricing and mix. These tailwinds are evident in our portfolio today. As a result, we continue to expect average quarterly NIM expansion of three to four basis points, though the path may not be perfectly linear. As always, we do not assume any Fed rate cuts in our outlook. Average loan yield declined 9 basis points to 5.74% versus the Q4 loan yield of 5.83% and was relatively flat to the December 31 spot yield of 5.75%. The Q1 loan yield reflects the full quarter impact of two Fed rate cuts on the rates for new production and on our floating rate loan portfolio which represents 38% of total loans. Our spot loan yield at the end of Q1 remained stable at 5.75%. Total average loan balances increased 4% annualized while Q1 loan production was strong. End of period loans declined modestly from the prior quarter mainly due to higher payoffs and pay downs which were primarily in warehouse fund finance and other cre. We continue to expect full year loan growth in mid single digits dependent on broader economic conditions. Deposit trends remain solid with average non interest bearing deposits continuing to grow in the quarter and average core deposits excluding one way ICS deposit sales also increasing modestly. We used one way ICF sales to move deposits off balance sheet and manage excess liquidity in the first quarter. Average balances swept off balance sheet through one way ics sales were $271 million. End of period deposits declined slightly from the fourth quarter due to lower broker deposits and retail CD deposits. We continue to expect deposits to grow mid single digits for the course of this year. Deposit cost declined 11 basis points to 1.78% driven by the benefit of Q4 Fed rate cuts and the continued runoff of higher cost deposits. We remained disciplined on pricing and achieved an interest bearing deposit beta of 57% in the first quarter. Spot cost of deposits at March 31 was 1.78%. Our balance sheet remains positioned to perform well across rate environments and is largely neutral to changes in rates from a net interest income perspective. Sitting at neutral we have the flexibility to manage our balance sheet to optimize results in any interest rate environment. For example, in a rising rate environment we would expect to manage deposit betas to be more measured than in a down rate cycle and the interest impact would be outpaced by the impact of interest income of the contractual repricing of our variable rate loans. At the same time, we expect ongoing balance sheet remixing to continue to support net interest income expansion across rate environments. Fixed rate and hybrid loan repricing or maturing by year end have a weighted average coupon of 4.7%, well below current production rates and approximately $3.2 billion of multifamily loans are expected to mature or reprice over the next two and a half years. That embedded repricing opportunity remains an important earnings tailwind. Non interest income was $35.3 million which was relatively flat quarter over quarter when excluding the $6 million lease residual gain in the fourth quarter. Noninterest expense of 181.4 million was relatively flat from the prior quarter and down 1% from a year ago. Compensation expense increased linked quarter due to seasonality which includes Q1 resets for payroll taxes and benefits. Customer related expenses declined 1.1 million quarter over quarter due to the impact from Q4 rate cuts on ECR cost. The broader expense base remains well controlled and we continue to target positive operating leverage through revenue growth, margin expansion and disciplined expense management. Turning to credit reserve levels remain solid with the ACL ratio stable at 1.12% and the economic coverage ratio at 1.60%. Provision expense of 9.8 million reflects the Q1 migration and impact of other credit activity, while the Moody’s updated economic forecast which included a significant improvement in the CRE price Index would have supported a reserve release. We continue to maintain a more conservative outlook for purposes of our methodology and increase the weighting of adverse scenarios offsetting that benefit. We continue to believe overall loan reserve levels are appropriate, particularly given the continued shift in growth towards historically lower loss categories which now represent 34% of loans held for investment. We are pleased with the strong start to the year and the progress we are making in building the company’s earnings power as we look ahead to the rest of 2026. The we are reaffirming our guidance for pretax pre provision income growth of 20 to 25% and non interest expense growth of 3 to 3.5%. Our net drivers of earnings growth remain firmly in place including continued loan portfolio remixing, disciplined expense …

Full story available on Benzinga.com

This post was originally published here

La Rosa Holdings Corp. (NASDAQ:LRHC) shares are seeing heavy selling pressure on Thursday. The stock dropped over 20% following news of a regulatory hurdle.

The Nasdaq is up 0.04% while the S&P 500 has shed 0.05%.

• La Rosa Holdings stock is testing lower boundaries. Why did LRHC hit a new low?

Nasdaq Issues Delinquency Notice

On April 16, the Nasdaq notified the multi-service real estate company of non-compliance with Listing Rule 5250(c)(1). This notice follows the company’s failure to timely file its Annual Report on Form 10-K. The report covers the fiscal year ended Dec. 31.

Path to Regaining Compliance

The notice does not immediately delist the stock. However, the company must submit a compliance plan by June 15. If accepted, Nasdaq may …

Full story available on Benzinga.com

This post was originally published here
Thoma Bravo is inching closer to a deal that would transfer control of software provider Medallia to its lenders, effectively erasing $5.1 billion tied to the private equity firm.

Medallia is an AI-driven experience management platform that helps companies capture, analyze, and act on customer and employee feedback in real-time. It gathers data from surveys, social media, mobile, and voice/chat, using AI to identify sentiment and trends to reduce churn and improve engagement. Thoma Bravo purchased the company for $6.4 billion in 2021.

Reuters reports that Medallia has been under recent pressure as investors reassess software assets amid worries that artificial intelligence could reduce demand for some services. 

On a February conference call, Blackstone’s private credit chief Brad Marshall said Medallia had been “underperforming, not because of anything related to AI, but due to what we believe to be execution-driven issues.” 

“We also expect there to be discussions around …

Full story available on Benzinga.com

This post was originally published here

Elon Musk is about to take SpaceX public on terms that would get most CEOs laughed out of a roadshow. Investors are lining up to buy in.

The Wall Street Journal reported Thursday that SpaceX’s board has granted Musk his own “moonshot” pay package and is structuring the June IPO around a dual-class share system. Musk and a handful of executives will hold Class B shares with 10 votes each. Outside investors, including the retail buyers SpaceX hopes will take one-third of the offering, get Class A shares with one vote each.

It is the governance setup Musk has publicly admitted he wishes he had locked in at Tesla Inc. (NASDAQ:TSLA) in 2010, where his roughly 18% stake leaves him technically removable.

What Polymarket Is …

Full story available on Benzinga.com

This post was originally published here
Keurig Dr Pepper Inc. (NASDAQ:KDP) shares rose after delivering a clean earnings beat and showing pricing power across key segments.

Quarterly Earnings

The company, which owns brands such as Dr Pepper, 7Up, Snapple and Green Mountain Coffee, reported first-quarter adjusted earnings per share of 39 cents, beating the analyst consensus estimate of 37 cents. Quarterly sales of $3.976 billion (+9.4% year over year) outpaced the Street view of $3.838 billion.

On a constant currency basis, net sales advanced 8.1%, driven by favorable net price realization of 5.5% and volume/mix growth of 2.6%.

U.S. …

Full story available on Benzinga.com

This post was originally published here
Helen of Troy Limited (NASDAQ:HELE) storms higher after beating expectations and signaling a bold reset toward growth.

A sharp earnings beat and confident outlook are leading to a short squeeze despite lingering category weakness.

Short Squeeze

According to data from Benzinga Pro, Helen of Troy’s stock has a short interest of 22% of its float. Therefore, the high stock movement is a result of positive earnings and a short-squeeze

Quarterly Earnings Performance

The consumer products company reported fourth-quarter adjusted earnings per share of 83 cents, beating the analyst consensus estimate of 74 cents. Quarterly sales of $470.025 million (down 3.3% year over year) outpaced the Street …

Full story available on Benzinga.com

This post was originally published here

SoftBank Group is pursuing a $10 billion loan backed by its stake in U.S. artificial intelligence leader OpenAI, as the firm ramps up borrowing to fund its expansion into AI.

Following the announcement, credit-default swaps rose by about 10 basis points, according to Bloomberg. The increase brings it to roughly 360 basis points, nearing March’s one-year high of 376 basis points.

The $10 billion margin loan—a revolving line of credit that allows a firm to borrow cash to finance additional investments—would have a two-year term. Under its terms, SoftBank would have the option to extend the loan for an additional year, sources told Bloomberg.

Softbank has previously made large investments in Sam Altman‘s company. The firm made an additional follow-on investment of $30 billion earlier this year, representing a 13% ownership interest in the company. 

“AI is transforming the world at an unprecedented pace. OpenAI …

Full story available on Benzinga.com

This post was originally published here
Old Republic Intl (NYSE:ORI) released first-quarter financial results and hosted an earnings call on Thursday. Read the complete transcript below.

Benzinga APIs provide real-time access to earnings call transcripts and financial data. Visit https://www.benzinga.com/apis/ to learn more.

The full earnings call is available at https://events.q4inc.com/attendee/731300872

Summary

Old Republic Intl reported a consolidated pre-tax operating income of $211.5 million, down from $252.7 million in the previous year, with a combined ratio of 96.6.

Specialty insurance saw a 4.7% increase in net premiums earned, with pre-tax operating income dropping to $209 million from $260 million. Title insurance premiums grew 12%, leading to a pre-tax operating income of $16.7 million, up from $4.3 million.

The company emphasized ongoing investments in new specialty operating companies, technology, and AI, which are impacting expense ratios but expected to yield long-term benefits.

Net investment income increased by over 4% due to a larger investment base and higher bond yields. The company repurchased $161 million worth of shares in the quarter.

Management pointed to challenges in commercial auto retention rates due to competitive pressures but remains committed to maintaining underwriting discipline.

The company announced the formation of Old Republic Property and rebranded Lodestar Claims and Risk Services, with expectations of closing the ECM acquisition by July 1.

Title insurance reported strong commercial activity and improved loss and expense ratios, supported by a new excess of loss reinsurance agreement.

Full Transcript

OPERATOR

Thank you for standing by and welcome to the Old Republic Intl first quarter 2026 earnings conference call. All lines have been placed on mute to prevent any background noise. After the speaker’s remarks, there will be a question and answer session. If you would like to ask a question during this time, simply press Star followed by the number one on your telephone keypad. If you would like to withdraw your question again, press star one. Thank you. I would now like to turn the call over to Joe Calabrese with the Financial Relations Board. You may begin.

Joe Calabrese (Operator)

Thank you, Rob. Good afternoon everyone and thank you for joining us for the Old Republic conference call to discuss first quarter 2026 results. This morning we distributed copies of the press release and posted a separate financial supplement. Both of the documents are available on Old Republic’s website at oldrepublic.com Please be advised that this call may involve forward looking statements as discussed in the press release dated April 23, 2026. Assumptions, uncertainties and risks exist that may cause results to differ materially from those set forth in these forward looking statements. For more information on these assumptions, uncertainties and risks, please refer to the forward-looking statements discussion in the press release and the company’s other recent SEC filings and the risk factors discussed in the company’s Most recent form 10K and other recent SEC filings. We may also include references to net income excluding net investment gains or net operating income, a non GAAP financial measure, and our remarks are in response to questions. GAAP reconciliation are included in the press release. Presenting on today’s conference call will be Craig Smiddy, President and CEO, Carolyn Monroe, President, Frank Zadara, Chief Financial Officer and Carolyn Monroe, President and CEO, Carolyn Monroe, President of Old Republic’s National Title Insurance Group. Management will make some opening remarks and then we’ll open the line for your questions. At this time I’d like to turn the call over to Craig, please. Go ahead, sir.

Craig Smiddy

Okay, Joe. Thank you very much. Good afternoon everyone and welcome again to Old Republic Intl’s first quarter 2026 earnings call. In the quarter we produced $211.5 million of consolidated pre tax operating income compared to $252.7 million and our consolidated combined ratio was 96.6 compared to 93.7 for the quarter. Our operating return on beginning equity was 11.5% and growth in book value per share including dividends was 2.6%. Specialty insurance grew net premiums earned by 4.7% over 1Q25 produced 209 million of pre tax operating income compared to 260 million specialties combined ratio was 94.8 compared to 89.8. Title insurance group premiums and fees increased by 12% over 1Q25 and produced $16.7 million of pre tax operating income compared To $4.3 million. Title’s combined ratio was 100 compared to 102. Our conservative reserving practices continue to produce favorable prior year loss development in both specialty insurance and title insurance and Frank will provide more details on that topic. So with that Frank, I will turn the discussion over to you and then you can turn it back to me to cover specialty insurance and we’ll have Carolyn cover Title Insurance thank you Craig

Frank Zadara (Chief Financial Officer)

and good afternoon everyone. In this morning’s release we reported net operating income of $171 million for the quarter compared to $202 million last year on a per share basis. Comparable quarter over quarter results were $0.68 compared to $0.81 per share. So starting with investments, net investment income increased just over 4% in the quarter, primarily as a result of a larger investment base and higher yields on the bond portfolio. While our average rate on corporate bonds acquired during the quarter was 4.7% compared to the average yield rolling off of about 3.8%, the total bond portfolio book yield held fairly steady with year end at about 4.75%. With the current interest rate environment, we expect net investment income growth to remain in the low to mid single digits throughout the rest of 2026. Turning now to loss reserves, both specialty and title insurance recognized favorable development in the quarter, leading to a 1.5 percentage point benefit, the consolidated loss ratio compared to 2.6 points of benefit last year. While this level of favorable development was lower than we had experienced in recent years, it is within our expectations for specialty insurance. Property continued to have favorable development and led the way this quarter with a slightly higher level than last year. Commercial auto and workers camp had solid favorable development in the quarter. However, both were at lower levels than last year and General Liability had a moderate amount of unfavorable development that spanned several more recent accident years. It was partially offset by favorable development in older years. We ended the quarter with book value per share of $24.53, which inclusive of the regular dividend equated to an increase of 2.6% since year end, resulting primarily from our operating earnings. In the quarter we paid nearly $77 million in dividends and repurchased $$161 million worth of our shares. Since the end of the quarter we repurchased another $$52 million worth of shares which leaves us with about $640 million remaining in our current repurchase program. I’ll now turn the call back over to Craig for a discussion of specialty insurance.

Craig Smiddy

Thanks Frank. So Specialty insurance net premiums written were up 3.4% during the quarter coming from strong rate increases on commercial auto and general liability., some new business writings and increasing premium in our newer specialty operating companies partially offset by a decline in our renewal retention ratios. And as we continue to prioritize rate in certain lines of coverage within our portfolio, we appear to be leading the market specifically within commercial auto by driving mid teen rate increases. As mentioned in my opening remarks, in the quarter specialty insurance pre tax operating income was $209 million while the combined ratio was 94.8. The loss ratio for the quarter was 63.6 and that included 1.6 percentage points of favorable prior year reserve development and that compares to a 61.7% loss ratio in the first quarter last year and that included 3.3 points of favorable development. The expense ratio for the quarter was 31.2 and that compares to 28.1 in the first quarter last year. Our continued investments into new specialty operating companies, technology modernization, data and analytics and AI placed some strain on on the expense ratio this quarter, but we remain confident that all of these investments will provide significant long term upside. Turning to commercial auto, net premiums written were up just over 1% in the quarter while the loss ratio came in relatively flat with the first quarter of last year at 70. As I referred earlier, rate increases remained steady with the fourth quarter that we reported and that is at a 16% rate increase level which is in line with loss trends Workers comp. On the other hand, net written premiums were also up just over 1% in the quarter while the loss ratio came in at 62.3% compared to 58.7% in the first quarter last year and most of that difference is due to the difference in the level of favorable prior year loss reserve development rate decreases for work computer were about 2% and here too that’s in line with loss trends with severity remaining relatively consistent and frequency continuing its downward trend. So while we’re seeing some top line pressure along with some pressure on the expense ratio, we remain confident that our underwriting approach to focus on risk adequate rates will continue to produce profitable combined ratios which is really the foremost priority for us. We also expect to see continuing growth in top line contributions from our newer specialty operating companies. A couple of other things additionally in the quarter we announced the formation of another new operating company Old Republic Property, led by Patrick Haggerty, who has assembled a highly respected team of underwriters that will specialize in very selective property placements. Just this week, the executive team here at the holding company in Chicago met with Patrick and his team and they’re currently focused …

Full story available on Benzinga.com

This post was originally published here

Blockchain Capital is looking to raise $700 million for two new funds, despite declines in the overall cryptocurrency market.

The firm is raising funds for its seventh early-stage vehicle and a second growth fund. Both funds expect to close within the next five to six months, according to Bloomberg News.

Bitcoin (CRYPTO: BTC) and the broader $2.3 trillion digital asset market are bleeding retail capital as traders pivot into equities. Plunging crypto volatility and a new AI-powered edge in the stock market are driving this trend.

Despite the struggling market, other crypto-focused VC firms …

Full story available on Benzinga.com

This post was originally published here
Cricket Stars MS Dhoni, Jasprit Bumrah, Hardik Pandya along with Shreyas Iyer, Ravindra Jadeja, Tilak Varma and Sai Sudharsan come on board as Investors; the funding round drew investments from Blume, V3 Ventures, MIXI and Times Internet.

SAN FRANCISCO and BENGALURU, India, April 23, 2026 /PRNewswire/ — LightFury Games (LFG), a AAA-focused game-tech studio, today announced it has raised US$11 million in its Pre-Series A. The 100-member studio spans deep creative talent and advanced technical capability to build premium, globally competitive games. Its backers include Blume, V3 Ventures, MIXI, Times Internet and strategic investments from top members of the Indian cricket team.

In a defining endorsement for the company and its debut title ‘eCricket, some of the biggest names in the world of cricket – MS Dhoni, Jasprit Bumrah, Hardik Pandya along with Shreyas Iyer, Ravindra Jadeja, Tilak Varma and Sai Sudharsan have joined the round as investors.

At a time when cricket remains one of the world’s most-followed sports, the backing of iconic and leading cricketers gives LightFury Games a rare athlete-backed momentum as it builds ‘eCricket’, a AAA cricket game from India with global ambitions, slated for release in 2026 on mobile.

The fresh capital will be primarily deployed to complete game development and strengthen its live operations (live ops) capabilities. This includes the post-launch infrastructure content pipelines and systems designed to deliver a high-quality, continuously evolving player experience at scale. With cricket commanding a global audience estimated to be over 2.5 billion, LightFury aims to address a significant gap in the sports gaming category by delivering a technically advanced, competitive, and live-service-driven Cricket e-game Franchise from India.

“We’ve backed LightFury from inception, in their mission to pioneer a new generation of Indian gaming studios, building IPs …

Full story available on Benzinga.com

This post was originally published here
First Citizens BancShares (NASDAQ:FCNCA) released first-quarter financial results and hosted an earnings call on Thursday. Read the complete transcript below.

Benzinga APIs provide real-time access to earnings call transcripts and financial data. Visit https://www.benzinga.com/apis/ to learn more.

View the webcast at https://events.q4inc.com/attendee/965447944

Summary

First Citizens BancShares Inc (Delaware) reported adjusted earnings per share of $44.86 with a ROE of 10.39% and ROA of 0.97%, despite challenges from lower interest rates.

The company saw strong deposit growth, particularly in tech and healthcare sectors, and utilized broker deposits to strengthen its liquidity position.

Strategic initiatives include expanding commercial solutions, optimizing the brand portfolio, and accelerating capabilities in payments, international banking, and digital assets.

The company returned $900 million to shareholders through share repurchases and prepaid $2.5 billion on its FDIC Promissory Note.

Guidance for 2026 remains optimistic with expected modest growth in loans and deposits, amidst a competitive deposit market and macroeconomic uncertainties.

Management emphasized a disciplined capital return strategy, with ongoing share repurchases and a recalibrated CET1 target range of 10 to 10.5%.

Non-interest expenses were lower than expected, with reductions in professional fees and marketing costs, while maintaining investments in technology.

Credit quality remains stable with a slight increase in non-accrual loans, but no systemic pressure is anticipated across the portfolio.

Full Transcript

OPERATOR

Ladies and gentlemen, thank you for standing by and welcome to the First Citizens BancShares Inc (Delaware) First Quarter 2026 Earnings Conference Call. At this time, all participants are in a listen only mode. After the speaker’s presentation, there will be a question and answer session. To ask a question during the session, you need to press Star one on your telephone. If you require operator assistance during the program, please press star then zero. As a reminder, today’s conference is being recorded. I would now like to introduce the host of this conference call, Ms. Deanna Hart, head of Investor Relations. You may begin.

Deanna Hart (Head of Investor Relations)

Good morning and thank you. Welcome to First Citizens BancShares Inc (Delaware) first quarter 2026 earnings call. Joining me on the call today are our Chairman and Chief Executive Officer Frank Holding and Chief Financial Officer Craig Nix. They will provide first quarter business and financial updates referencing our earnings call presentation which you can find on our website. Our comments will include forward looking statements which are subject to risks and uncertainties that may cause actual results to differ materially from expectations. We assume no obligation to update such statements. These risks are outlined on page 33 of the presentation. We will also reference non GAAP financial measures. Reconciliations of these measures against the most directly comparable GAAP measures can be found in section 5 of the presentation. Finally, First Citizens BancShares Inc (Delaware) is not responsible for and does not guarantee the accuracy of earnings transcripts provided by third parties. I will now turn it over to Frank.

Frank Holding (Chairman and Chief Executive Officer)

Thank you Deanna. Good morning and welcome everyone. Thank you for joining us. I’ll start by highlighting our overall performance for the quarter before turning it over to Craig Nix to take you through our financial results and outlook for 2026 in more detail starting on page 5. We were pleased with our first quarter results this morning. We reported adjusted earnings per share of $44.86, representing an adjusted ROE and ROA of 10.39% and 0.97% respectively. While lower rates were a headwind, we saw strong deposit growth, credit quality remained strong and expenses came in below our expectations. Deposit growth accelerated this quarter up by 5.7%, sequentially anchored by increased client activity in tech and healthcare and global fund banking. In addition, deposits grew in the General bank segment and the Direct Bank. This growth was also supplemented by the strategic use of broker deposits to further further bolster our liquidity position. We also achieved solid increases in off balance sheet client funds driven by the tech and healthcare and global fund banking businesses. We continue to optimize our capital stack, returning another $900 million to shareholders through share repurchases. Due to our strong liquidity position, we were able to prepay another $2.5 billion FDIC on our FDIC Promissory Note during the quarter Turning to our announcement this morning, we are expanding our commercial solutions and optimizing our brand portfolio to better serve our clients and drive growth in 2026. We are accelerating our strategic roadmap by expanding capabilities in payments, international banking and digital assets. As part of this growth, we will transition to a united brand structure in the fourth quarter featuring innovation banking and fund banking sub brands under the First Citizens umbrella. Now, brand adjustments always generate questions and we want to be perfectly clear that while names are changing, the client experience is not. Our relationship teams remain the cornerstone of our service, providing the same deep specializations that our clients rely on. This brand alignment simply opens the door to a larger platform of solutions and a more connected network of experts for the future. Despite a complex global backdrop, we continue to operate from a position of strength. Our capital liquidity and risk discipline provide a solid foundation that allows us to focus on what matters most, serving our clients and customers and continuing to drive long term shareholder value. We are confident in our strategy, disciplined in our execution, and very optimistic about the path ahead. I’ll conclude with that and pass it over to Craig Nix to take us through the financial results for the quarter and guidance for the remainder year.

Craig Nix (Chief Financial Officer)

Craig thank you Frank and good morning everyone. I will anchor my comments to page 8 of the presentation. Pages 9 through 27 provide details underlying our first quarter results. In the first quarter we delivered adjusted earnings of $44.86 per share on net income of $560 million. The sequential decline of $6.41 per share largely reflects the impact of lower interest rates on our net interest margin. However, we were pleased that lower non interest expense helped offset a portion of the net interest income decline. In line with our previous guidance, net interest income declined by $101 million with NIM compressing 11 basis points to 3.09%. This decline was primarily driven by a lower earning asset yield following the Fed’s rate cut in late 2025 alongside a shorter day count this quarter. However, these headwinds were moderated through strong organic loan growth, lower funding costs and a reduction in average borrowings. Non interest income was down $9 million from the linked quarter, but in line with our previous guidance, the majority of the decline centered in other non interest income which was down $15 million, largely attributable to a decrease in other investment income, a line item subject to fluctuation on a quarterly basis outside of the decline in other non interest income, our core fee categories performed well. We saw solid growth in deposit fees and lending related capital market fees, though these increases were partially tempered by seasonal declines and factoring commissions. Additionally, while the fed funds rate environment pressured client investment fees, we successfully mitigated that impact through a $3.9 billion increase in average off balance sheet client funds. Adjusted non interest expense was $38 million lower, sequentially outperforming our previous guidance. This reduction reflects a $16 million decline in professional fees as we successfully completed several technology and risk management projects at the end of 2025. Marketing costs also declined by $15 million as we pivoted our funding strategy this quarter to leverage lower cost broker deposits rather than higher cost deposits in the direct bank. While the direct bank remains a critical funding source and we expect marketing expense to normalize in the future, we will remain agile balancing deposit growth with cost efficiency to protect our margins. Finally, we saw a $16 million seasonal normalization and other expenses. These reductions were partially offset by seasonally higher benefits expense due to resets as well as continued deliberate investments in our technology platforms which are essential to scaling our operations and enhancing our client experience. Turning to the balance sheet period, end loans grew $762 million or 0.5% sequentially driven by global fund banking which was up $1 billion on record production of over $6 billion, surpassing the record set just last quarter. With average line utilization also trending higher, we see evidence of higher client demand and and a robust pipeline moving forward. In middle market banking we added $327 million in growth as stable production was bolstered by lower prepayments. While we are pleased with this quarter’s growth, we maintain a guarded outlook given the broader macro environment. General bank loans decreased $591 million primarily reflecting a strategic decision to move $365 million in SBA loans to held for sale. Excluding this balance sheet optimization, the decline was driven by typical first quarter seasonality. On an average loan basis, loans increased $2.2 billion sequentially, led by our global fund banking business. Turning to the right hand side of the balance sheet period, end deposits grew by $9.3 billion or 5.7% sequentially. This growth reflects strong organic growth in our core business segments as well as execution of our balance sheet optimization strategies. Within SVB Commercial, we saw significant momentum and momentum in global fund banking and Tech and Healthcare where deposits grew sequentially by $5.6 billion driven by visible pickup in VC investment and exit activity growth here underscores the strength of our franchise within the innovation economy. While these inflows were encouraging, we remain disciplined in our outlook as a portion of this growth stemmed from large short term deposits. As we’ve noted before, these inflows can be lumpy and we have already observed some anticipated outflows in April. We are managing these balances with a strict focus on liquidity and funding cost optimization in mind. In the general bank deposits grew by $1.1 billion. This was largely driven by successful seasonal campaign within our CAB business and solid growth in our branch network, demonstrating our ability to consistently execute on core deposit gathering initiatives. To support the transition away from the purchase money note and limit impacts to net interest income, we also tactically utilized $1.8 billion in broker deposits. This was a flexible lever for us this quarter as the all in cost was lower than leading rates in the direct bank. As we continue to monitor pricing and tenor to ensure a resilient and cost effective funding mix. On an average basis, deposits also perform well, growing by $2.7 billion or 1.7% sequentially driven primarily by tech and healthcare banking and cab. Finally, off balance sheet momentum was equally strong. SVB commercial client funds rose $8.1 billion to nearly $78 billion while average off balance sheet funds grew by $3.9 billion. Turning to credit provision was $103 million for the quarter, up 46 million from the link quarter. The increase was driven almost entirely by a larger reserve release last quarter which rather than a negative shift in credit quality. In fact the net charge off ratio came in 9 basis points lower than the linked quarter at 30 basis points with net charge offs totaling $111 million. This was favorable to our previous guidance though I’d characterize the beat as a matter of timing on specific resolution efforts, particularly within our general office book rather than a significant change in our overall outlook. While non accrual loans moved slightly higher to 96 basis points, the …

Full story available on Benzinga.com

This post was originally published here

KKR Real Estate Finance (NYSE:KREF) held its first-quarter earnings conference call on Thursday. Below is the complete transcript from the call.

Benzinga APIs provide real-time access to earnings call transcripts and financial data. Visit https://www.benzinga.com/apis/ to learn more.

The full earnings call is available at https://event.choruscall.com/mediaframe/webcast.html?webcastid=w0xtbxq5

Summary

KKR Real Estate Finance Trust Inc reported a GAAP net loss of $62 million or negative $0.96 per share for the first quarter of 2026, with a book value of $11.87 per share.

The company is focusing on reducing legacy office exposure, resolving watch list loans, and addressing life science exposure as part of its 2026 transition strategy.

A dividend reduction to $0.10 per share per quarter was announced, aligning with expectations for distributable earnings amidst a strategic shift towards share repurchases and higher quality investments.

Management highlighted significant liquidity of $653 million and plans for a $75 million share repurchase program to enhance shareholder value.

Operational updates include the refinancing of a $225 million office loan and leasing success in Mountain View, with a full property lease signed with OpenAI.

Full Transcript

OPERATOR

Good morning and welcome to the KKR Real Estate Finance Trust Inc First Quarter 2026 Financial Results Conference call. All participants will be in listen only mode. Should you need assistance, please signal a conference specialist by pressing the star key followed by zero. After today’s presentation, there will be an opportunity to ask questions. To ask a question, you may press then one on your telephone keypad. To withdraw your question, please press then 2. Please note this event is being recorded. I would now like to turn the conference over to Jack Switala. Please go ahead. Great.

Jack Switala

Thanks operator and welcome to the KKR Real Estate Finance Trust earnings call for the first quarter of 2026. As the operator mentioned, this is Jack Switala. This morning I’m joined on the call by our CEO Matt Salem, our President and COO Patrick Matson and our CFO Kendra Decius. I’d like to remind everyone that we will refer to certain non GAAP financial measures on the call which are reconciled to GAAP figures in our earnings release and in the supplementary presentation, both of which are available on the investor relations portion of our website. This call will also contain certain forward looking statements which do not guarantee future events or performance. Please refer to our Most recently filed 10Q for cautionary factors related to these statements. Before I turn the call over to Matt, I will go through our Results. For the first quarter of 2026. We reported a GAAP net loss of $62 million or negative $0.96 per share. Book value as of March 31, 2026 is $11.87 per share. We reported a distributable loss of $4 million or negative $0.06 per share. Distributable earnings before realized losses was $13 million or $0.20 per share. Finally, we paid a $0.25 cash dividend in April which with respect to the first quarter. With that, I’d now like to turn the call over to Matt. Thanks Jack. Good morning everyone and thank you for joining us. As we outlined last quarter, 2026 represents a transition year for the company with the goal of narrowing the gap between share price and book value per share. Our focus is on two key priorities. First, executing an aggressive resolution strategy across our watch list assets and certain legacy office exposures. And second, positioning a portion of our REO portfolio for liquidity. We have significant liquidity sitting at 653 million today in extensive capabilities across KKR to execute both our asset management and REO strategies. Today I want to provide additional detail on our progress against those objectives and what you should expect over the course of the year this quarter book value declined by 9% as we position our watch list loans for resolution. Our action plan is designed to reposition the portfolio to optimize medium and long term performance. However, as we execute, we may choose to incur book value declines as we seek liquidity on legacy assets to create a higher quality portfolio. As we complete this transition, we see a clear path to redeploy capital in newer vintage higher quality investments which we believe will support a return to book value per share stability and over time drive earnings and book value accretion. Overall. Our specific goals for 2026 as outlined on page 8 of the Supplemental are to reduce our watch list and legacy office exposure, rotate the portfolio into newer vintage higher quality assets and reduce our REO footprint. With that, I want to walk through our action plan for 2026 in further detail. First, reduce legacy office exposure from 21% to under 10%. We expect over half this reduction to come from par repayments with the remaining driven by resolution of our watch list loans. We’ve already begun to action both prongs. Our largest office loan $225 million loan in Bellevue was refinanced in the first quarter at par with a CMBS single asset single borrower transaction and the property securing our largest watch list office loan is currently being marketed for sale. Second, we plan to resolve all of our current watch list loans by year end by positioning these assets for sale or modification and accelerating their resolution. Third, address our life science exposure. Our goal is to have 100% of this exposure modified. We already have made progress here having modified 19% and when including our Cambridge asset this quarter we have modified 30% of our life science exposure. We also took a material increase in reserves for our Seaport loan in anticipation of a potential modification. Finally, we are continuing to originate new investments as we reposition the portfolio. As a result of this activity, loans originated between 2024 and 2026 are expected to represent approximately 50% of the portfolio by year end. This highlights the significant turnover into newer vintage assets which we believe will have improved earnings potential. Let me turn to liquidity and capital allocation which is another priority for us as a management team. For 2026 we announced a dividend reduction to $0.10 per share per quarter payable on July 15th. This decision is not driven by liquidity constraints. In fact, as we look ahead through the year, we expect to have over $500 million of capital to invest, largely driven by over $2 billion of expected repayments in 2026. Rather, the dividend decision reflects a disciplined approach to capital allocation. At this stage, we see more attractive opportunities, including repurchasing our stock and funding new originations. While we have ample liquidity to pay dividends at the current level, the new dividend level has the added benefit of being aligned with our expectations for distributable earnings per share before realized losses as we work through repositioning our portfolio. While we expect $0.40 per year of dividends to be covered by earnings excluding losses, quarterly results may vary in the near term, with earnings expected to trough in the second half of 2026 into the first half of 2027. Once we get through this period, we expect distributable earnings per share to increase. Regarding capital allocation, given our current trading levels relative to book value, we believe share repurchases represent an attractive opportunity to drive accretion to book value per share while also providing greater strategic flexibility. We were largely inactive with respect to share buybacks this past quarter due to trading restrictions, while we were actively evaluating our dividend policy. With that process now complete and our dividend framework established, those constraints have been lifted. On April 14, our board authorized a new $75 million share repurchase program providing us with meaningful flexibility to deploy capital as a management team. Together with our board of directors, we have not taken this dividend decision lightly, but given where the stock is trading, we believe the dividend cut and meaningful share buybacks are in the best interest of shareholder value creation. With that, I will turn the call over to Patrick.

Patrick

Thanks, Matt. Good morning, everyone. Let me start with a few changes to the watch list. This quarter we downgraded our Philadelphia office assets with two smaller Texas multifamily loans from risk rated 3 to 4 as previously previewed on last quarter’s earnings call. We also downgraded our Boston Life Science asset from risk rated 3 to 5. We upgraded our Cambridge Life Science from risk rated 5 to 3 following the loan restructuring that includes new sponsor equity commitment and a loan paydown. As a result, we recorded CECL provisions of 74 million, bringing our total allowance to 260 million. These actions are part of our broader action plan to proactively reposition the portfolio. Turning next to our REO portfolio, we are actively managing these assets with a clear focus on monetization and value realization. To help frame it, we’ve grouped these assets into near medium and longer term monetization buckets. Starting with the near term bucket West Hollywood condos where units are currently listed and actively being marketed with proceeds returning equity as closings occur Raleigh, North Carolina Multifamily where we’re completing targeted upgrades to common areas and expect to list the asset for sale by year end. Philadelphia Office where our business plan is largely complete. The asset is now approximately 85% leased and we plan to sell the property this year. In the medium term bucket we have Mountain View, California office where our platform, market positioning and patience have driven meaningful value creation. As we announced in March, we signed a long term full property lease with OpenAI. We expect to bring this asset to market within the next 12 to 16 months as we complete the remaining work and the tenant takes occupancy. Portland Redevelopment where we’ve executed on our plan and are near final entitlement on over 4 million square feet of mixed use space and expect to begin our monetization strategy over …

Full story available on Benzinga.com

This post was originally published here

Texas Capital Bancshares (NASDAQ:TCBI) reported first-quarter financial results on Thursday. The transcript from the company’s first-quarter earnings call has been provided below.

This content is powered by Benzinga APIs. For comprehensive financial data and transcripts, visit https://www.benzinga.com/apis/.

The full earnings call is available at https://events.q4inc.com/attendee/521777696

Summary

Texas Capital Bancshares Inc reported a 72% increase in adjusted quarterly earnings per share year-over-year to $1.58, driven by a 16% rise in total revenue to $324 million.

Strategic leadership changes were announced, including new roles for Jay Clingman and Dustin Kosper to enhance private and commercial banking, and John Cummings as Chief Operating Officer.

The company initiated a quarterly common stock cash dividend, reflecting confidence in earnings momentum and a strong capital position.

Investment banking fees rose 89% year-over-year to $42.3 million, with significant contributions from syndications, capital markets, and sales and trading.

The company’s capital ratios remain strong, with a tangible common equity to tangible assets ratio of 9.87% and CET1 ratio at 11.99%.

Operationally, the company emphasized its continued focus on new client acquisition and the expansion of fee income areas, with non-interest income making up 21% of total revenue.

Texas Capital Bancshares Inc successfully repurchased approximately $75 million of common shares during the quarter, signaling confidence in the franchise.

Management reiterated its full-year guidance, expecting mid to high single-digit total revenue growth and maintaining a provision outlook of 35 to 40 basis points of average LHI excluding mortgage finance.

Full Transcript

Sammy (Moderator)

Hello everyone and thank you for joining us today for the TCBI first quarter 2026 earnings conference call. My name is Sammy and I’ll be coordinating your call today. During the presentation, you can register a question by pressing STAR followed by one on your telephone keypad. If you change your mind, please press STAR followed by two on your telephone keypad to remove yourself from a question queue. I’ll now hand over to your host, Jocelyn Kokulka, Head of Investor Relations to begin. Please go ahead.

Jocelyn Kokulka (Head of Investor Relations)

Jocelyn Good morning and thank you for joining us for TCBI’s first quarter 2026 earnings conference call. I’m Jocelyn Kokulka, Head of Investor Relations. Before we begin, please be aware this call will include forward looking statements that are based on our current expectations of future results or events. Forward looking statements are subject to both known and unknown risks and uncertainties that could cause actual results to differ materially from these statements. Our forward looking statements are as of the date of this call and we do not assume any obligation to update or revise them. Today’s presentation will include certain non GAAP measures including but not limited to adjusted operating metrics, adjusted earnings per share and return on capital. For reconciliation of these and other non GAAP measures to the corresponding GAAP measures, please refer to the earnings press release and our website. Statements made on this call should be considered together with the cautionary statements and other information contained in today’s earnings release, our most recent annual report on Form 10K and subsequent filings with the SEC. We will refer to slides during today’s presentation which can be found along with the press release in the Investor Relations section of our website@texascapital.com our speakers for the call today are Rob Holmes, Chairman, President and CEO, and and Matt Scurlock, CFO. At the conclusion of our prepared remarks, the operator will open up the call for Q and A. I’ll now turn the call over to Rob for opening remarks.

Rob Holmes (Chairman, President and CEO)

Good Morning. We enter this quarter with clear conviction in our strategy and the disciplined execution required to continue unlocking substantial value for our shareholders and clients. First quarter outcomes reflect our shift in strategic focus to consistent execution and realizing the full potential of our investments. This quarter we took decisive steps to align our organizational structure with that imperative. I am pleased to announce strategic executive leadership appointments that further enhance our positioning for growth. Jay Clingman will transition to Head of Private bank and family office following five successful years building and scaling our middle market and business banking franchises. Dustin Kosper assumes the role of Head of Commercial Banking, overseeing Real estate banking, middle market banking and business banking. This shift positions the firm to drive enhanced client outcomes across private banking and commercial banking through more comprehensive and integrated solutions. John Cummings has been named Chief Operating Officer, charged with driving sustained operational excellence and further positioning our platform for scale. Matt Scurlock, Texas Capital’s Chief Financial Officer, will assume the role of President of Texas Capital bank, further aligning financial, operational and business leadership across the organization. We have also appointed Jeff Hood as Chief Human Resources Officer to ensure our talent, strategy and culture align with our operational and commercial ambitions. He will be joining the firm in early May. Turning to the quarterly results, Contributions across the firm enabled another quarter of strong financial progress as adjusted quarterly earnings per share increased 72% versus the prior year period to $1.58 per share as total revenue increased 16% each year over year to $324 million, driven by 8% growth in net interest income and 56% growth in non interest revenue. Fee income from our areas of focus increased 59% year over year, reaching $58.8 million in the quarter, a record for the firm. Notably, all three focus areas delivered record quarterly fee income, demonstrating the platform’s continued maturity and enhanced cross functional strength. This is not a single driver story. It reflects embedded momentum across advisory capital markets, wealth and treasury services, all facilitated by excellent client banking coverage across the platform. New client acquisition remains a fundamental driver to platform value. Each quarter, the firm onboards clients who generate revenue across multiple service lines, a structural advantage that indeed compounds over time. Investment banking fees of $42.3 million grew 89% year over year with broad contributions across syndications, capital markets and sales and trading, reflecting our unique ability to deliver high quality client outcomes across a range of product solutions. Treasury product fees of $12.1 million increased 14% as existing clients continue to leverage our differentiated payment capabilities and new clients on board at an accelerated pace. Wealth management fees also increased for the third straight quarter, reflecting building momentum that we expect to continue through the year. In Total fee income comprised 21% of total revenue versus 16% a year ago, demonstrating the success of our multi year shift toward a more diversified capital efficient and resilient revenue base. This trajectory directly reflects disciplined client selection and our ability to deepen relationships over time. Our first quarter capital position highlights both the strength of our platform and the discipline of our capital management approach. Tangible book value per share of $75.67 increased 11% year over year, marking an eighth consecutive quarterly record for this important metric. During the quarter, we repurchased approximately $75 million of common shares at a weighted average price of $96.82 per share, demonstrating our confidence in the franchise and our conviction that earnings momentum will continue. Tangible common equity intangible assets of 9.87% exceeds peer levels and CET1 of 11.99% remains well above our stated target of 11% and internally assessed risk Profile as previously discussed, we do not manage the firm to an expected economic scenario. We instead regularly evaluate potential macroeconomic impacts on both credit quality and earnings capacity. Detailed reviews over the past few quarters include topics such as private credit disruption from artificial intelligence and exposure to data center supply chains, all of which confirm our adherence to disciplined client selection and diligent concentration management leading up to the recent conflict in the Middle East. We assess the impact of rising commodities pricing on a series of client segments, including commercial clients that rely on commodity inputs such as helium, urea and aluminum, as well as clients whose customers are potentially impacted by rising prices. While our assessment across these topical areas suggests impacts on specific clients or at this point tangential, we nonetheless continue to assume a credit posture in the reserve calculation that is increasingly reliant on a downside scenario. Weighting we maintain a balance sheet that is intentionally positioned, carry capital and reserves that provide meaningful flexibility and deliver a breadth of products and services that keep the firm relevant to our clients in any environment. That posture is a choice, one we have made consistently and is the reason we approach periods of uncertainty from a position of strength and are front footed in the market. Our earnings trajectory is sustainable, our balance sheet is strong and our platform is positioned for durable growth. Today we are pleased to announce the initiation of a quarterly common stock cash dividend, a tangible expression of our confidence in earnings momentum and our commitment to returning capital to shareholders while funding continued organic growth. This dividend reflects a mature platform, the strength of our capital position and management’s conviction in a long term trajectory of the firm. Thank you for your continued interest in and support of Texas Capital. I’ll turn it over to Matt for details on the financial results for the quarter.

Matt Scurlock

Thanks Rob and good morning. Starting on slide 4, first quarter total revenue increased 43.5 million or 16% year over year driven by 8% growth in net interest income and a 56% increase in non interest revenue. Net interest income increased 18.7 million year over year to 254.7 million in line with our January guidance of 250 to 255 million which anticipated modest linked quarter decline of 12.7 million consistent with typical first quarter seasonality. Net interest margin expanded 24 basis points year over year to 3.43% the sixth consecutive quarter of year over year expansion and improved 5 basis points relative to the prior quarter. Non interest expense increased 5% year over year to 213.6 million on an adjusted basis. Non interest expense was 212.2 million, an increase of 9.1 million relative to the first quarter of last year. As expense based productivity continues to deliver, anticipated revenue growth and incremental new investments align directly with defined areas of capability build taken together pre Provision net revenue increased 33 million or 43% year over year to 110.4 million. Adjusted PP&R reached 1.11.8 million of 34.4 million or 44% marking the fifth consecutive quarter of year over year expansion. Provision for credit losses of 16 million was stable year over year reflective of anticipated quarterly credit trends and management’s continued assumption that economic scenarios materially more severe than consensus estimates. Net income to common was 69.5 million up 26.7 million or 63% year over year and adjusted net income increased 65% to 70.5 million. Strong financial performance coupled with a disciplined multi year share repurchase program is consistently driving meaningful EPS growth for our shareholders. First quarter earnings per share reached $1.56 which is up 70% year over year with adjusted earnings per share of $1.58 up 72% year over year. Book value per share of $75.71 and tangible book value per share of $75.67 both increased 11% year over year representing the eighth consecutive quarter end record high for the firm. While the allowance for credit losses held relatively steady at 331 million or 1.32% of total LHI and 1.81% of total LHI. Excluding Mort total LHI of 25.2 billion increased 13% year over year and 5% linked quarter with contributions across both the commercial and mortgage finance portfolios period End commercial loans of 12.5 billion increase 1.2 billion or 10% year over year driven by now consistent contributions across industries and geographies and sustained quarterly increases in target client acquisition. Linked quarter commercial loans increased 336 million or 3% representing the ninth consecutive quarter of commercial loan growth and continuing the trajectory of risk appropriate and return accretive portfolio expansion facilitated by our bankers across business banking, middle market and corporate banking. Commercial real estate loans of 5.3 billion decreased 9% year over year and 2% linked quarter as payoff rates continue to outpace client appetite for capital deployment. With expectations previously provided for full year average CRE balances to decline approximately 10% remaining intact despite the expected seasonal linked quarter pullback. Average mortgage finance loans increased 32% year over year to 5.2 billion with period imbalances increasing to 7 billion 33% above average for the quarter, inconsistent with the annual pattern of origination volumes building at the end of Q1 heading into the spring and summer home buying season, enhanced credit structures now represent 67% of period end mortgage finance balances up from 59% at Q4 2025, further improving the blended risk weighting of the portfolio to 53%. We anticipate that an incremental 5% could migrate to the enhanced structures over the next several quarters, at which point we should read the maximum near term potential for the portfolio. Total deposits of 28.5 billion at quarter end increased 9% year over year and 8% linked quarter with reductions in interest bearing deposits associated with seasonal tax payments supplemented by modest levels of broker deposits to support the temporary and predictable late Q1 growth in mortgage finance volumes. Ending period commercial managed bearing deposits increased 76 million or 2% and are now at 309 million since Q3 2025 with average commercial non interest bearing deposits remaining at 13% of total deposits for the quarter. Average non interest bearing mortgage Finance deposits of 4.2 billion decreased 288 million year over year bringing the self funding ratio down to 80% for the quarter as eight quarters of focus reduction clearly improved both the balance sheet resilience and earnings generation. We have now established a more balanced deposit base with a complete treasury offering increasingly embedded across our clients platforms and would expect the mortgage finance self funding ratio to settle between 70 to 80% in the near to medium term. The majority of …

Full story available on Benzinga.com

This post was originally published here

Intel Corp. (NASDAQ:INTC) reports first-quarter earnings after the close today, with a call scheduled for 5 p.m. ET.

The stock has ripped 78% in 2026 on new CEO Lip-Bu Tan‘s turnaround pitch, touching a multi-year high of $70.33 and closing Wall Street’s most remarkable chip rally of the year.

Polymarket gives Intel a 92% chance of beating the EPS consensus.

Kalshi has a market where traders are pricing the specific words Lip-Bu and his team will say on the call.

Words On The Board

“Panther Lake” sits at 92%. It’s the first real product on Intel’s 18A process, which Tan has staked the turnaround on. A mention signals ramp is on track.

“Arizona” at 81% points to the Chandler fabs where 18A is ramping. Operational color on yields gets priced straight into the foundry thesis.
“Xeon” is a lock at 98%. Xeon is Intel’s server CPU line, the chip that has powered enterprise data centers for two decades. AMD’s EPYC has been taking share since 2017 and surpassed Intel on server CPU revenue at the end of 2024, while …
Full story available on Benzinga.com

This post was originally published here

Acme United (AMEX:ACU) held its first-quarter earnings conference call on Thursday. Below is the complete transcript from the call.

Benzinga APIs provide real-time access to earnings call transcripts and financial data. Visit https://www.benzinga.com/apis/ to learn more.

Access the full call at https://edge.media-server.com/mmc/p/kotfa92p/

Summary

Acme United reported a 14% increase in net sales to $52.3 million, although net income decreased to $985,000 from $1.6 million the previous year.

The acquisition of MiMedic contributed 8% to the sales increase, but the company is focusing on integrating and expanding its retail distribution for future profitability.

Gross margins improved slightly to 39.7%, but core margins declined due to tariffs and higher costs, expected to stabilize by the third quarter.

Operational highlights include strong growth in Europe and Canada and the opening of the new Spill Magic facility in Tennessee.

Management is optimistic about overcoming tariff impacts and leveraging recent acquisitions for long-term growth, despite short-term challenges.

Full Transcript

OPERATOR

Good day and welcome to the Acme United first quarter 2026 financial results call. At this time I’d like to turn the call over to Walter Johnson, Chairman and CEO. Please go ahead, sir.

Paul Driscoll (Chief Financial Officer)

Good morning. Welcome to the first quarter 2026 earnings conference call for Acme United Corporation. I am Walter C. Johnson, Chairman and CEO. With me is Paul Driscoll, our Chief Financial Officer, who will first read a safe harbor statement. Paul. Forward-looking statements in this conference call, including without limitation statements related to the Company’s plans, strategies, objectives, expectations, intentions and adequacy of capital and other resources, are made pursuant to the safe harbor provisions of the Private Securities Litigation Reform act of 1995. Investors are cautioned that such forward looking statements involve risks and uncertainties, including, among others, those arising as a result of a challenging global macroeconomic environment characterized by continued high inflation, high interest rates and the imposition of new tariffs or changes in existing tariff rates. In addition, we have experienced supply chain disruptions in the past and we may experience these disruptions in the future. We are also subject to additional risks and uncertainties as described in our periodic filings with the securities and Exchange Commission and in our current earnings release.

Walter Johnson

Thank you, Paul Acme United had a difficult first quarter of 2026. While our net sales increased 14% to $52.3 million, our net income was $985,000 compared to $1.6 million last year and earnings per share were $0.24 compared to $0.41 last year. As you may remember, we purchased MiMedic for $18.6 million during the first quarter of 2026. The company sells directly to consumers and is cyclical with most of the profits generated in the fourth quarter of the year. It also generates high gross margins which it spends on advertising, promotions, new product development and customer support. Our sales increase of 14% in the first quarter of 2026 includes approximately 8% from MiMedic, which was at break even in P and L. Revenues excluding MiMedic increased 6%. The company’s gross margins in the first quarter of 2026 were 39.7% compared to 39% last year. When the impact of the high gross margins at Mimedic are removed, the core gross margins declined due to higher costs and tariffs. We turn our inventory about twice per year, so the costs reflected in the first quarter were from products made and purchased when the tariffs were at their peak. We expect to run through these items during the second quarter with a return to normal levels in the third quarter. Shortly after the war in Iran began, we started purchasing higher than normal quantities of raw materials and finished goods inventory. So far we have purchased approximately $10 million of incremental inventory. While we hope for a quick end to the war, we are planning and acting to be prepared for increasing costs and shortages. Operationally, we’re working to increase the revenues of Mimedic by expanding its retail distribution and building a strong core of non seasonal business. Our teams are integrating product lines, leveraging our purchasing strengths and reducing duplicate expenses with the goal of generating significant profits throughout the year. The project is well underway. We are completing the move into our new Spill Magic facility in Mount Pleasant, Tennessee. Production has begun there even as additional equipment is being installed. Orders for the business are strong and we are experiencing record growth. In Europe, sales increased 19% in local currency to 4 million euro. Our growth there includes the acquisition last November of Schmiediglut, a small direct to consumer company which is exceeding expectations. Our first aid business in Europe had record performance and we continue to expand its product line and sales team. The Westcott cutting tool business overcame market headwinds and increased 10% in Europe. In Canada, First Aid Central had a strong quarter and the cutting segment also grew. Overall, our Canadian business increased 16% compared to the first quarter of 2025. I will now turn the call to Paul

Paul Nachme

Acme’s net sales for the first quarter of 2026 were $52.3 million compared to $46 million in 2025, a 14% increase excluding mimedic sales increased 6%. Net sales in the US segment increased 12% in the quarter, driven by higher sales of first aid and medical products including Mimedic products. Net sales in Europe for the first quarter of 2026 increased 19% in local currency compared to the first quarter of 2025, due mainly to the new line of cutting and sharpening tools. The base business had a good performance with a sales increase of 12%. Net sales in Canada for the first quarter of 2026 increased 11% in local currency due to higher sales of first aid products. The gross margin was 39.7% in the first quarter of 2026 versus 39% in the first quarter of 2025. The favorable mix from higher margin direct to consumer mimetic products was mostly offset by the impact of increased tariffs. SG&A expenses for the first quarter of 2026 were $19 million or 36% of net sales, compared with $15.5 million or 34% of net sales for the same period of 2025 the higher SG&A was primarily due to the addition of the Mimedic business. The higher percentage of sales was due to the higher amount of advertising needed for the direct to consumer mimedic business. Net income for the first quarter of 2026 was $1 million or $0.24 per diluted share compared to net income of $1.7 million or $0.41 per diluted share for the same period of 2025 of 40% in net income. The decline in net income was primarily due to the higher tariff and Mednap costs we experienced in the first quarter of this year. The higher tariff spending commenced in July of 2025. However, the costs were capitalized into inventory and we started to realize the full impact to earnings as the high cost products were sold in the first quarter of 2026. We expect the tariff impact to gradually lessen over the next three quarters as the tariff rate declined in November 2025 and again in February 2026. Additionally, the incremental cost to enhance the …

Full story available on Benzinga.com

This post was originally published here

AZZ (NYSE:AZZ) reported fourth-quarter financial results on Thursday. The transcript from the company’s fourth-quarter earnings call has been provided below.

Benzinga APIs provide real-time access to earnings call transcripts and financial data. Visit https://www.benzinga.com/apis/ to learn more.

The full earnings call is available at https://event.choruscall.com/mediaframe/webcast.html?webcastid=NQC0z1aD

Summary

AZZ Inc reported record sales of $1.65 billion for fiscal 2026, with an adjusted EBITDA of $367 million, marking a 19% increase in adjusted EPS to $6.19.

The company completed a greenfield pre-coat metals facility in Washington, Missouri, and acquired a galvanizing facility in Canton, Ohio, to strengthen its metal coatings platform.

Guidance for fiscal 2027 includes expected sales between $1.725 to $1.775 billion, adjusted EBITDA of $360 to $400 million, and adjusted diluted EPS of $6.5 to $7.

The company reduced its debt by $385 million, ending the year with a net debt to EBITDA ratio of 1.4x, showing significant financial flexibility.

Management expressed confidence in capturing market share through strategic growth opportunities and M&A, particularly in the metal coatings segment.

Full Transcript

OPERATOR

Good day and welcome to the AZZ Incorporated Fourth Quarter Fiscal Year 2026 Earnings Conference Call and webcast. All participants will be in listen only mode. Should you need assistance, please signal a conference specialist by pressing the star key followed by zero. After today’s presentation, there will be an opportunity to ask questions. To ask a question, you may press star then one on a touchtone phone. To withdraw your question, please press star then two. Please note this event is being recorded. I would now like to turn the conference over to Philip Cooper, Managing Director of Three Part Advisors. Please go ahead.

Philip Cooper (Managing Director)

Good morning. Thank you for joining us today to review AZZ’s fiscal 2026 fourth quarter and full year results for the period ended February 28, 2026. Joining the call today are Tom Ferguson, President and Chief Executive Officer Jason Crawford, Chief Financial Officer and David Narc, Chief Marketing, Communications and Investor Relations Officer. After today’s prepared remarks, we will open the call for questions. Please note that the live webcast of today’s call is available at www.azz.cominvestor-events before we begin, I would like to remind everyone that our discussion today will include forward-looking statements made in accordance with the Safe harbor provisions of the Private Securities Litigation Reform act of 1995. By their nature, forward-looking statements are uncertain and outside the company’s control except for actual results. AZZ’s comments containing forward-looking statements may involve risks and uncertainties, some of which are detailed from time to time in documents filed by Azz with the securities and Exchange Commission, including the latest annual report on Form 10-K. These statements are not guarantees of future performance, therefore undue reliance should not be placed upon them. Actual results could differ materially from these expectations. In addition, today’s call will discuss non-GAAP financial measures which should be considered supplemental and not as a substitute for GAAP financial measures. We refer shareholders to our reconciliations from GAAP to non-GAAP measures contained in today’s earnings press release. I would now like to turn the call over to Tom Ferguson.

Tom Ferguson (President and Chief Executive Officer)

Thanks Philip Good morning everyone and thank you for joining us today. We delivered a strong close to the year and achieved record sales and profitability for the third consecutive year. I’m especially proud of how our teams recovered from the major winter storm in late January to finish a strong fourth quarter full year. Sales totaled $1.65 billion, adjusted EBITDA surpassed $367 million and adjusted earnings per share grew 19% year over year to $6.19. Our performance reflects the strength of our strategy, disciplined execution, operational excellence and commitment. Teamwork and values based culture across the organization. During fiscal 2026, we further fortified our competitive position by driving market share gains across our segments. AZZ continued to win by delivering superior customer service and operating with discipline and consistency while leveraging our proprietary technologies and galvanizing research capabilities to create differentiated value. Throughout the year, we made organic investments across both of our segments to enhance operating efficiencies and support our long A key milestone in this effort was the completion of our greenfield Precoat metals facility in Washington, Missouri. This investment advances our organic growth strategy and strengthens our Precoat metals segment, expanding AZZ’s participation in the growing aluminum coatings and beverage related end markets. We further expanded our metal coatings platform last year through the acquisition of a galvanizing facility in Canton, Ohio which extended our footprint and broadened our service offering for new and existing customers. At the same time, we continue to evaluate acquisition opportunities through a disciplined capital allocation framework while growing an active strategic pipeline of deals. Jason will cover our fourth quarter results in detail, so I’ll focus my remaining comments on the significant secular tailwinds that continue to propel our long term growth. We are seeing momentum across our end markets driven by infrastructure related investment themes that are reshaping the industrial landscape. These include industrial reshoring, bridge and highway investments, hyperscale data center expansion, investments in power generation, transmission and distribution and continued growth in renewable energy. Each of these trends are structural, multi year and increasingly central to our customers capital spending priorities. As we’ve seen throughout the year, these markets rely heavily on galvanized steel and coated metal solutions areas where AZZ brings meaningful scale, deep coding experience, operational reliability and exceptional value. Our diversified portfolio positions us uniquely to be able to support large scale complex projects across multiple end markets and states, often simultaneously, and to do so with consistency and speed together. These demand drivers in our differentiated operating model allows AZZ to capture market share and deepen existing customer relationships. Dave will share additional details on how industry dynamics translate into project activity in just a moment. We continue to drive incremental improvements across our network using our digital galvanizing system in metal coating plants and Kolene in Precoat metals. These systems strengthen customer engagement while driving productivity and margin improvement across our operations. Together, these custom digital capabilities reinforce our competitive advantages and support consistent, profitable growth. With that, I’ll turn it over to Jason.

Jason Crawford (Chief Financial Officer)

Thank you Tom and good morning. Starting with a summary of results for the year, in fiscal 2026, which ended February 28, 2026, we reported record sales of $1.65 billion, up 4.6% from the prior year. For our core segments, we increased metal coating sales 14.1% and and generated strong EBITDA of over $235 million or 31% of sales. For Precoat Metals, despite a modest 2.3% sales decline driven by industry wide softness in residential and other key markets, we generated solid EBITDA of $176 million or 19.8% of sales. Consolidated gross margins remained robust at 23.9% and operating income from the year rose by 12% to $265 million. Also for the full year, GAAP net income comparisons included two noteworthy matters. First, in 2026 our AVAIL joint venture generated equity and earnings from unconsolidated subsidiaries totaling $210 million, primarily driven by successfully divesting businesses within the joint venture, which I will discuss in more detail in a moment. Second, for the fiscal year 2025, GAAP net income AVAILable to common shareholders included a preferred stock redemption Premium expense totaling $75 million. Adjusted net income excluding these items plus intangible asset amortization and restructuring charges resulted in adjusted EPS of $6.19, an increase of 19% on the prior year. In addition, consolidated adjusted EBITDA increased year over year to $367.6 million or 22.3% of sales, up from 22% of sales a year ago. Shifting to our quarterly results, we reported record fourth quarter sales of $385.1 million representing a 9.4% increase from $351.9 million in the prior year period. This was supported by strong double digit sales growth from our metal coating segment up 25.7% year over year compared to the prior year. Q4 results benefited from continued momentum from higher infrastructure related demand and less impact from inclement weather. Precoat metal sales were down 2.4% for the same quarter of the prior year, primarily due to continued lower end market demand in pockets of construction, transportation and H Vac. The company’s fourth quarter gross profit was $87.6 million or 22.7% of sales, up 30 basis points from 22.4% of sales and in the same quarter of the prior year. Selling general and administrative expenses totaled $30.5 million in the fourth quarter or 7.9% of sales. This compares favourably with last year’s fourth quarter which reported $38.3 million or 10.9% of sales inclusive of $6.7 million in accrued costs related to legal retirement and SEVERANCE expenses. Operating income for the quarter was $57.1 million or 14.8% of sales, an exceptional 330 basis point improvement compared with $40.4 million or 11.5% of sales in the fourth quarter of the prior year. Also in the fourth quarter we reported a net loss from the AVAIL joint venture equity in earnings or of $21.7 million, primarily reflecting a loss in the sale of the welding services businesses and an unfavourable prior period adjustment from AVAIL. Excluding the loss in sale and prior period adjustment transactions, the AVAIL joint ventures equity and earnings for the quarter was approximately $700,000 compared with $3.7 million for the fourth quarter of the prior year. Interest expense for the fourth quarter was $11.2 million, an improvement of $6.2 million from the prior year driven by debt pay down from continuing operations, debt pay down from the AVAIL joint venture distribution, the issuance of an AR securitization loan with favorable pricing and a favorable repricing of the term loan. The fourth quarter’s income tax expense was $8.7 million and GAAP net income was $15.9 million compared to GAAP net income of $20.2 million. For the fourth quarter of the prior year, we reported adjusted net income of $40.4 million excluding intangible asset amortization and the AVAIL equity loss discussed earlier, resulting in adjusted diluted EPS of $1.34 up 36.7% versus a year ago. Fourth quarter adjusted EBITDA was $81.3 million or 21.1% of sales compared to $71.2 million or 20.2% of sales for the same period last year. Turning to our financial position and balance sheet consistent with our capital allocation priorities for the year, we executed with discipline across our balance sheet, growth investments and shareholder returns. We reduced debt by $385 million and ended the year with a net debt to ebitda ratio of 1.4 times, providing significant financial flexibility. Moving forward, we continue to invest in the foundations of the core businesses. During the year we invested $80.8 million in capital expenditures, a growing portion of which was dedicated to internal growth initiatives. Also included in the year within our capital expenditures was approximately $7.9 million on our new Washington, Missouri facility. Over the past three years we have invested approximately $125 million in this aluminum coil coating facility with the team delivering the project on time and on budget. With the facility now fully operational, volume continues to ramp in alignment with our partner customer and was profitable at the contribution margin level in Q4. Finally, rounding off our investments for the year, we further strengthened our metal coating segment by acquiring a galvanizing facility in Canton, Ohio for approximately $30 million, demonstrating our commitment to grow the core businesses organically and inorganically. At the same time, we remain committed to returning capital to our shareholders. During the year, we paid $23 million in cash dividends and repurchased $20 million in shares and an average price of $99.28 per share. Together, these actions reflect our disciplined approach to capital deployment and our focus on creating long term shareholder value for the remaining AVAIL joint venture investment. We account for our 40% interest as equity and earnings and unconsolidated subsidiaries which also constitutes a separate operating segment. In 2026, Aveel generated equity in the earnings of $210 million which includes the sale of its electrical and welding businesses and provided cash distributions of $287 million during the year. AZZ’s cash flows from operations of $525 million includes $273 million of cash distributions from Avail, net of the associated taxes paid. The remaining $14 million of cash distributions from AVAIL were classified as cash flows from investing activities. Finally, as expected, 2026 cash taxes were higher in the year associated with higher equity and earnings from AVAIL, offset somewhat by positive effects from the one big beautiful Bill act on depreciation, R and D expenses and interest expense. With that, I’ll turn the call over to David.

David Narc (Chief Marketing, Communications and Investor Relations Officer)

Thank you Jason Good morning everyone. Consistent with our disclosures found in the company’s 10k, total sales for the full year grew at 5% as compared to the prior fiscal year. Construction, our largest end market, grew at 3% while electrical and industrial delivered strong double digit sales growth resulting in 17 and 15% growth rates respectively. As Tom noted, AZZ Inc. continues …

Full story available on Benzinga.com

This post was originally published here

Unity Software Inc (NYSE:U) shares fell on Thursday. The decline comes despite the S&P 500 gaining 0.08%. The downward move appears driven by intense sector-wide pressure rather than company-specific news.

• Unity Software stock is taking a hit today. Why is U stock dropping?

AI Concerns Weight on Valuations

Traders are reacting to quarterly reports from IBM (NYSE:IBM) and ServiceNow Inc (NYSE:NOW). Both companies beat estimates but offered cautious outlooks. This reignited fears that artificial intelligence is structurally breaking the traditional software-as-a-service (SaaS) business model.

IBM and ServiceNow Guidance Drags Peers

ServiceNow CFO Gina Mastantuono cited a “prudent view of the geopolitical environment” for their guidance. Meanwhile, IBM’s …

Full story available on Benzinga.com

This post was originally published here

First American Financial (NYSE:FAF) held its first-quarter earnings conference call on Thursday. Below is the complete transcript from the call.

This content is powered by Benzinga APIs. For comprehensive financial data and transcripts, visit https://www.benzinga.com/apis/.

The full earnings call is available at https://events.q4inc.com/attendee/748719981

Summary

First American Financial reported a strong financial performance with adjusted earnings per share of $1.33, a 58% increase from the prior year, driven by robust growth in commercial revenue which increased by 48%.

The company is leveraging AI to enhance operational efficiency, launching platforms like Endpoint and Sequoia, which have shown significant improvements in automating title decisioning and reducing order processing times.

Future outlook remains optimistic for commercial business, with expectations for 2026 to be a record year, although caution is advised in the residential market due to sluggish home sales.

Operational highlights include strong performance in the National Commercial Services Division, with notable growth in asset classes like data centers and energy, and an increase in deposits at First American Trust.

Management emphasized strategic focus on AI to maintain competitive advantages and expressed confidence in the company’s technology, distribution, and data capabilities against potential industry disruptions.

Full Transcript

OPERATOR

Greetings and welcome to the First American Financial Corporation first quarter 2026 earnings conference call. At this time all participants are in a listen only mode. A brief question and answer session will follow the formal presentation. If anyone should require operator assistance during the conference, please press Star 0 on your telephone keypad. A copy of today’s press release is available on First American’s website at www.firstam.com/investor. Please note that the call is being recorded and will be available for replay from the Company’s investor website and for a short time by dialing 877-660-6853 or 201-612-7415. and by entering the conference. ID 1375-9993 we will now turn the call over to Craig Barbario, Vice President, Investor Relations, to make an introductory statement.

Craig Barbario (Vice President, Investor Relations)

Good morning everyone and again, welcome to First American’s earnings conference call for the first quarter of 2026. Joining us today on the call will be our Chief Executive Officer Mark Seaton and Matt Wagner, Chief Financial Officer. Some of the statements made today may contain forward looking statements that do not relate strictly to historical or current fact. These forward looking statements speak only of as of the date they are made and the Company does not undertake to update forward-looking statements to reflect circumstances or events that occur after the date the forward-looking statements are made. Risks and uncertainties exist that may cause results to differ materially from those set forth in these forward looking statements. For more information on these risks and uncertainties, please refer to yesterday’s earnings release and the risk factors discussed in our Form 10K and subsequent SEC filings. Our presentation today contains certain non-GAAP financial measures that we believe provide additional insight into the operational efficiency and performance of the Company relative to earlier periods and relative to the Company’s competitors. For more details on these non-GAAP financial measures, including presentation with and reconciliation to the most directly comparable GAAP financials, please refer to yesterday’s earnings release which is available on our website@www.firstam.com I’ll now turn the call over to Mark Seaton.

Mark Seaton (Chief Executive Officer)

Thank you Craig. We are pleased to report continued momentum in the first quarter, generating adjusted earnings per share of $1.33. A 58% increase from the prior year in commercial revenue grew 48%, achieving a record for a first quarter. Notably, we closed 20 orders generating more than 1 million in premium, double the amount from last year. In our National Commercial Services Division we are seeing broad base strength with nine of our 11 asset classes up year over year Data centers remain a meaningful tailwind with revenue tied to this sector increasing 76% relative to last year. We are also seeing strong activity in our energy group, which grew 250% and was a top five asset class during the quarter. Residential purchase revenue continues to lag we have been more bearish on the purchase market this year than most public forecasts and that view is proving accurate as purchase revenue declined 4% year over year. On the refinance side, we saw a modest benefit during the quarter when mortgage rates dipped into the low 6% range. While this provided some lift in the first quarter, volumes have since softened as rates moved higher again. Another key earnings driver is our bank First American Trust, which continues to provide a steady stream of investment income. During Q1, average deposits totaled 6.8 billion, up 19% from last year. Growth has been driven by both commercial deposits and deposits from our outside of our captive title business. During the quarter, 29% of deposits came from sources beyond our captive title business, including 1.4 billion from ServiceMac and an additional 300 million from 1031 exchange deposits. Our agent banking strategy is also gaining traction with 284 agents currently banking with First American Trust, up 26% from last year. These balances are expected to grow as the market recovers. The bank continues to serve as a countercyclical earnings driver with meaningful long term growth potential as we expand servicing 1031 Exchange and agent banking deposits. Our primary strategic focus is to leverage AI across our business to amplify the talents of our team, better serve our customers and strengthen our operational capabilities. Over the past year we launched an enterprise AI platform that helps product teams develop, govern and deploy secure compliant AI systems. This platform is an internal system that will allow us to deploy products faster and at scale. While we regularly discuss our two major enterprise initiatives, Endpoint and Sequoia, we are also seeing incremental gains across the company. One example is in our agency division where we are deploying AI driven tools that expand our quality control capacity by more than six fold. We have also introduced AI assisted examination capabilities that reduce order processing time by roughly 30 minutes per file. Importantly, these examination capabilities are not confined to our internal operations. This quarter we are extending these same AI driven tools into Agent Net, our title agent facing platform, leveraging our proprietary data domain expertise and proven production performance to deliver value to our customers. AI driven efficiency improvements like these not only enhance our operating leverage, allowing us to scale efficiently as volumes recover, but also provide revenue opportunities by enabling us to deliver new solutions to our clients. We are also redefining how we build software. Today, 25% of our engineers are trained in agentic AI development and are moving from concepts to production in weeks rather than months. Productivity will continue to improve as the rest of our product engineering teams complete training this quarter. The impact goes beyond speed. Our teams are spending more time solving customer challenges and ensuring every investment drives real value. We are embracing this transformation and believe we are on the leading edge of our industry in adopting these capabilities. Turning to Endpoint, we have outlined a plan to scale the platform across First American Title’s local branch network by the end of 2027 and we remain on track. Endpoint is live in Seattle where we have opened around 310 orders and closed 150 orders on the new system. With each transaction we continue to learn and improve. In this pilot we have automated approximately 30% of the tasks required to close a transaction, allowing our people to focus more on customer facing activities and complex issues. These automation rates will only increase over time. We are expanding the Endpoint pilot this quarter to First American Title’s escrow officers across the state of Washington, an important milestone. We expect approximately 80 to 85% of our local branch network to be on Endpoint by the end of next year. This represents a significant transformation, not just a technology rollout, but a standardization of workflows that shifts the nature of work from executing tasks to verifying them. The real value of AI lies not only in the tools themselves, but in how workflows evolve to fully leverage them. While substantial work remains, we are confident and energized by the opportunities ahead with Sequoia. We also continue to make strong progress. As a reminder, Sequoia is our AI powered title decisioning platform. We are currently live with refinance transactions in eight counties across California and Arizona in our Direct division where we have fully automated title decisioning 35% of the time. The more complex challenge has been purchase transactions and last month we reached a key milestone by launching Sequoia for purchase transactions. Today in three counties we are automating title decisioning for 13% of purchase transactions, instantly determining insurability at order open. Over time our automation rates will improve and ultimately we believe we can deliver instant title decisioning for 70% of purchase and 80% of refinance orders in markets that we have title plants. This is made possible by our industry leading title plant data underwriting expertise and innovative technology. By the end of this year we plan to expand Sequoia across California and Florida with a national Rollout planned for 2027 Looking ahead, we are optimistic about our earnings trajectory. Our commercial business remains strong. For the first three weeks in April, our opened commercial orders are down 4% relative to last year. But as we experienced this quarter, the fee profile matters more in commercial than the number of orders. And given our strong pipeline of sizable commercial transactions, we still believe 2026 will be a record year in our commercial business. On the purchase market, we remain more cautious than the consensus view. So far in April, open Purchase orders are down 3% as the sluggish home sale trend continues. While the residential market remains at trough levels, we are focused on rolling out our new AI powered title and escrow platforms which will provide greater operating leverage when the market recovers. From a capital management perspective, we continue to deploy earnings into opportunities with the most attractive risk adjusted returns. We are taking a disciplined approach to acquisitions, focusing on the right partners rather than growth for its own sake. As our stock has pulled back while our earnings and outlook have strengthened, we have taken the opportunity to repurchase shares. Matt will discuss our financial results and capital management in more detail and with that, I’ll turn the call over to him.

Matt Wagner (Chief Financial Officer)

Thank you, Mark. This quarter we generated GAAP earnings of $1.21 per diluted share. Our adjusted earnings, which exclude the impact of net investment losses and purchase related intangible amortization, were $1.33 per diluted share. Focusing on the title segment, adjusted revenue was $1.7 billion, up 17% compared with the same quarter of 2025. Looking at the components of title revenue, we saw strong growth in commercial and refinance, partially offset by weakness in purchase. Commercial revenue was $271 million, a 48% increase over last year, reflecting both increased transaction volumes and significantly higher average revenue per order. Our closed orders increased 9% from the prior year and our average revenue per order was up 36%. Purchase revenue was down 4% during the quarter, driven by a 6% decline in closed orders, partially offset by a 3% improvement in the average revenue per order. This reflects continued weakness in home sale activity. Refinance revenue was up 76% compared with last year, driven by a 57% increase in closed orders and a 13% increase in the average revenue per order. This growth was supported by a temporary decline in mortgage rates during the quarter, though activity has since softened as rates have moved higher. Refinance accounted for just 8% of our direct revenue this quarter and highlights how challenged this market continues to be Compared to historic levels in the agency business. Revenue was $759 million, up 16% from last year given the reporting lag in agent revenues of approximately one quarter. These results primarily reflect remittances related to fourth quarter economic activity. Information and other revenues were $269 million during the quarter, up 14% compared with last year. The increase was driven by revenue growth at the company’s subservicing business, higher demand for non insured information products and services and refinance activity in the company’s Canadian operations. Investment income was $154 million in the first quarter, up 12% compared with the same quarter last year despite the Fed cutting rates three times. The increase in investment income was primarily due to higher average balances driven by commercial 1031 exchange subservicing and warehouse lending activity. Investment income fitted from our bank subsidiary shifting its asset mix to fixed income …

Full story available on Benzinga.com

This post was originally published here

On Thursday, Banner (NASDAQ:BANR) discussed first-quarter financial results during its earnings call. The full transcript is provided below.

This content is powered by Benzinga APIs. For comprehensive financial data and transcripts, visit https://www.benzinga.com/apis/.

Access the full call at https://events.q4inc.com/attendee/947594631

Summary

Banner reported a net profit of $54.7 million, or $1.60 per diluted share, for Q1 2026, compared to $1.30 per share in Q1 2025.

The company’s core earnings for Q1 2026 were $66.3 million, up from $58.6 million in Q1 2025, reflecting a 6% increase in revenue from core operations.

Banner’s loan portfolio showed modest year-over-year growth of 2.4%, with significant commercial real estate payoffs impacting overall balances.

The company increased its quarterly dividend by 4% to $0.52 per share, reflecting strong capital and liquidity positions.

Management highlighted continued execution of its super community bank strategy and resilience in its core deposit base, which represents 89% of total deposits.

Operational highlights included recognition as one of America’s 100 Best Banks and one of the best banks in the world by Forbes.

The outlook anticipates mid-single-digit loan growth for 2026, with some margin expansion expected in the second half of the year.

Full Transcript

Tiffany (Conference Operator)

Hello and thank you for standing by. My name is Tiffany and I will be your conference operator today. At this time I would like to welcome everyone to The Banner Corporation First Quarter 2026 Conference Call and webcast. All lines have been placed on mute to prevent any background noise. After the speaker’s remarks, there will be a question and answer session. If you would like to ask a question during that time, simply press Star then the number one on your telephone keypad. I would now like to turn the call over to Mark Grescovich, President and Chief Executive Officer of Banner Corporation. Mark, please go ahead.

Mark Grescovich (President and Chief Executive Officer)

Thank you, Tiffany and good morning everyone. I would also like to welcome you to the first quarter 2026 earnings call for Banner Corporation. Joining me on the call today is Rob Butterfield, Banner Corporation’s Chief Financial Officer, Jill Rice, our Chief Credit Officer and Rich Arnold, our Head of Investor Relations. Rich, would you please read our forward looking Safe harbor statement?

Rich Arnold (Head of Investor Relations)

Sure. Mark. Good morning. Our presentation today discusses Banner’s business outlook and will include forward looking statements. These statements include descriptions of management’s plans, objectives or goals for future operations, products or services, forecast of financial or other performance measures and statements about Banner’s general outlook for economic and other conditions. We also may make other forward looking statements in the question and answer period following management’s discussion. These forward looking statements are subject to a number of risks and uncertainties and actual results may differ materially from those discussed today. Information on the risk factors that could cause actual results to differ are available in the earnings press release that was released yesterday and a recently filed Form 10-K for the year ended December 31, 2025. Forward looking statements are effective only as of the date they are made and Banner assumes no obligation to update information concerning its expectations.

Mark Grescovich (President and Chief Executive Officer)

Mark. Thank you, Rich. As is customary today we will cover four primary items with you. First, I will provide you with high-level comments on Banner’s first quarter 2026 performance. Second, the actions Banner continues to take to support all of our stakeholders, including our Banner team, our clients, our communities and our shareholders. Third, Jill Rice will provide comments on the current status of our loan portfolio. And finally, Rob Butterfield will provide more detail on our operating performance for the quarter as well as comments on our balance sheet. Before I get started, I wanted to thank all of my 2,000 colleagues in our company who are working extremely hard to assist our clients and our communities. Banner has lived our core values summed up as doing the right thing for the past 135 years. Our overarching goal continues to be to do the right thing for our clients, our communities, our colleagues, our company and our shareholders and to provide a consistent and reliable source of commerce and capital through all economic cycles and change events. I am pleased to report again to you that is exactly what we continue to do. I am very proud of the entire Banner team that is living our core values. Now let me turn to an overview of our performance. As announced, Banner Corporation reported a net profit available to common shareholders of $54.7 million, or $1.60 per diluted share for the quarter ended March 31, 2026. This compares to a net profit to common shareholders of $1.30 per share for the first quarter of 2025 and $1.49 per share for the fourth quarter of 2025. Our strategy to maintain a moderate risk profile and the investments we have made and continue to make in order to improve operating performance have positioned the company well for the future. Rob will discuss these items in more detail shortly. The strength of our balance sheet coupled with the strong reputation we maintain in our markets will allow us to manage through the current market uncertainty. To illustrate the core earnings power of Banner, I would direct your attention to pre tax, pre provision earnings excluding gains and losses on the sale of securities, changes in fair value of financial instruments, and building and lease exit costs. Our first quarter 2026 core earnings were $66.3 million compared to $58.6 million for the first quarter of 2025. Banner’s first quarter 2026 revenue from core operations was $169 million compared to $160 million for the first quarter of 2025, an increase of nearly 6%. We continue to benefit from a strong core deposit base that has proved to be resilient and loyal to Banner, a very good net interest margin and core expense control. Overall, this resulted in a return on average assets of 1.37% for the first quarter of 2026. Once again, our core performance reflects continued execution on our super Community bank strategy that is Growing new client relationships, maintaining our core funding position, promoting client loyalty and advocacy through our responsive service model, and demonstrating our safety and soundness through all economic cycles and change events. To that point, our core deposits continue to represent 89% of total deposits. Reflective of this performance, coupled with our strong regulatory capital ratios and the fact that we increased our tangible common equity per share by 11% from the same period last year, we announced a core dividend increase of 4% to $0.52 per common share. Finally, I’m pleased to say that we continue to receive marketplace recognition and validation of our business model and our value proposition Banner was again named one of America’s 100 Best Banks as well as one of the best banks in the world by Forbes and Newsweek, named Banner bank one of the most trustworthy companies both in America and the world again this year, and just recently again named Banner one of the best regional banks in the country. Additionally, J.D. power and Associates named Banner bank the best bank in the Northwest for retail client satisfaction. For 2025. Our company was certified by Great Place to Work S and P Global Market Intelligence ranked Banner’s financial performance among the top 50 public banks with more than $10 billion in assets. And as we’ve noted previously, Banner bank again received an outstanding CRA rating. Let me now turn the call over to Jill to discuss trends in our loan portfolio and her comments on Banner’s credit quality.

Jill Rice (Chief Credit Officer)

Jill thank you Mark and good morning everyone. As detailed in our press release, we again had a strong quarter of loan originations in line with that reported in the fourth quarter and 61% higher than that reported in the first quarter of 2025. Still, significant commercial real estate payoffs coupled with expected paydowns within the AG portfolio offset production such that portfolio loans decreased 14 million when compared to December 31, 2025. Year over year loan growth was modest at 2.4%. Production within the commercial real estate portfolio continued to be meaningful with owner occupied CRE up 3% in the quarter and 15% year over year and investor real estate up 1% in the quarter and nearly 8% year over year. Those increases, however, were almost entirely offset by the significant commercial real estate paydowns within the multifamily portfolio, down 6% in the quarter and 9% year over year as stabilized properties moved into the secondary market within the construction portfolios. The 12% increase quarter over quarter in commercial construction reflects the continued funding of previously approved projects. In addition to the multifamily payoffs noted previously. We had two large land development projects payoff which resulted in a 7.5% decrease in balances this quarter. We are continuing to see an elongation of the days on market within the for sale one to four family construction portfolio given the elevated interest rate environment and general economic uncertainty. Still, the level of completed and unsold inventory remains within historical norms and the builders continue to have strong balance sheets and profit margins to work with. In total, the One4Family Construction portfolio continues to represent a modest 5% of the loan portfolio and the total construction portfolio including land and land development continues to be acceptable at 14% of the loan book. After declining 3% last quarter, CNI line utilization moved closer to normal, increasing 2% this quarter. In total, commercial loans were up a modest 1% both in the quarter and year over year. Agricultural balances, as expected, were down 6% in the quarter as crop proceeds reduced line balances and the decline reported year over year reflects the collection and payoff of multiple classified ag balances. Shifting to credit quality Our credit metrics remain Strong. Delinquent loans increased 2 basis points and now represent 0.56% of total loans, which compares to 0.63% reported as of March 31, 2025. Adversely classified loans increased by 42 million in the quarter, representing 2% of total loans and total non performing assets at 51.7 million represent a modest 0.32% of total assets. The increase in adversely classified assets is centered in three relationships operating in manufacturing, residential construction and wholesale agricultural supplies. As of March 31, the allowance for credit losses totals 160.4 million, providing 1.37% coverage of total loans. Consistent with prior quarters, loan losses in the quarter totaled 1.5 million and were offset in part by recoveries totaling 253,000. The risk rating migration discussed previously, coupled with the net charge off resulted in a provision of 1.3 million to the Reserve for credit losses loans. This was offset by a release from the Reserve for unfunded commitments of 2.1 million for a net provision recapture of 796,000. The first quarter of 2026 continued to be impacted by economic uncertainty given persistent inflation, the higher for longer interest rate environment and increasing geopolitical issues. Through this we have maintained consistent underwriting standards which include a focus on strong sponsors, properly margined collateral, seasoned repayment sources, and in the vast majority of cases, personal guarantees. And we continue our practice of robust quarterly portfolio reviews in order to identify any emerging issues early. We remain well positioned to weather the uncertain economic environment ahead. With that, I will hand the microphone over to Rob for his comments.

Rob Butterfield (Chief Financial Officer)

Rob thank you Jill. We reported $1.60 per diluted share for the fourth quarter compared to $1.49 per diluted share for the prior quarter. The increase in earnings per share compared to the prior quarter was primarily due to the current quarter having lower expenses, a recapture of provision for credit losses. In addition, the prior quarter included a decrease in the valuation of financial instruments carried at fair value and any loss on the disposal of assets. Core pre tax pre …

Full story available on Benzinga.com

This post was originally published here

QCR Hldgs (NASDAQ:QCRH) held its first-quarter earnings conference call on Thursday. Below is the complete transcript from the call.

This content is powered by Benzinga APIs. For comprehensive financial data and transcripts, visit https://www.benzinga.com/apis/.

The full earnings call is available at https://event.choruscall.com/mediaframe/webcast.html?webcastid=43Kx4XV9

Summary

QCR Hldgs reported the most profitable first quarter in its history, driven by healthy loan and deposit growth, lower non-interest expenses, and margin expansion.

Strategic initiatives include ongoing digital transformation with successful system conversions and growth in LIHTC lending, enhancing capital markets revenue.

The company reaffirmed guidance for annualized loan growth of 10-15% and increased capital markets revenue guidance to $60-70 million over the next four quarters.

Operational highlights include strong traditional banking and wealth management performance, significant investments in technology, and robust share repurchase activity.

Management expressed confidence in maintaining strong financial performance, emphasizing disciplined expense management and strategic capital allocation, including share buybacks.

Full Transcript

OPERATOR

Good morning and thank you for joining us today for QCR Holdings Inc. first quarter 2026 earnings conference call. Following the close of the market yesterday, the Company issued its earnings press release for the first quarter. If anyone joining us today has not yet received a copy, it is available on the company’s website, www.qcrh.com. with us today from management are Todd Gippel, President and CEO and Nick Anderson, CFO. Management will provide a summary of the financial results and then we will open the call to questions from analysts. Before we begin, I would like to remind everyone that some of the information management will be providing today falls under the guidelines of Forward looking Statements as defined by the Securities and Exchange Commission. As part of these guidelines, any statements made during this call concerning the Company’s hopes, beliefs, expectations and predictions of the future are forward looking statements and actual results could differ materially from those projected. Additional information on these factors is included in the Company’s SEC filings which are available on the Company’s website. Additionally, Management may refer to non-GAAP measures which are intended to supplement but not substitute for the most directly comparable GAAP measures. The press release available on the website contains the financial and other quantitative information to be discussed today as well as reconciliation of the GAAP to non-GAAP measures. As a reminder, this conference call is being recorded and will be available for replay through April 30, 2026 starting this afternoon, approximately one hour after the completion of this call. It will also be accessible on the Company’s website. I will now turn the call over to Mr. Todd Gippel at QCR Holdings. Please go ahead.

Todd Gippel (President and CEO)

Good morning everyone. Thank you for joining our call today. I’d like to start with an overview of our first quarter performance and then Nick will walk us through the financial results in more detail. We are pleased to deliver the most profitable first quarter in our company’s history. This performance was driven by healthy loan and deposit growth, significantly lower non interest expense and modest margin expansion. We maintained excellent asset quality and generated meaningful growth and tangible book value per share while returning capital to our shareholders through opportunistic share repurchases. We also continue to make further investments in our digital transformation as we build a more modern scalable bank for our clients and employees. Strong performance in our traditional banking and wealth management businesses partially offset the linked quarter reduction in our capital markets revenue. Capital markets results were in line with our expectations given typical first quarter seasonality and were equal to our five year average for Q1 production. As a result, we delivered a very strong return on average assets of 1.40% and earnings per share growth of 31% compared to the same period last year, highlighting the strong earnings potential of our diverse business model. Our traditional banking business continues to deliver solid organic growth supported by healthy commercial and industrial activity and across our markets. Our multi charter model enables us to consistently gain market share with locally led community banks that build deep relationships with high value clients and communities where they live and work. Our digital transformation remains on track with the successful completion of the second of four core system conversions in early April. Modernizing our technology stack will deliver meaningful benefits for both our clients and employees, expanding our service capabilities, enhancing the client experience and driving operating leverage. Our wealth management business also delivered very strong results with annualized revenue growth of 14%. Our success in this business continues to be driven by the experience of our team and the power of our relationship driven model which connects our traditional banking clients and key professionals in each of our communities with our dedicated wealth advisors. Across our markets, we are deepening client engagement and reinforcing wealth management as a key driver of our sustained top tier financial performance. Our Low-Income Housing Tax Credit (LIHTC) lending business also continues to perform as the demand for affordable housing remains robust driven by a lack of supply and ongoing affordability challenges nationwide. We view Low-Income Housing Tax Credit (LIHTC) lending as a highly profitable, annually consistent and differentiated line of business for QCR Holdings. Anchored by our deep network of developer relationships and historically high quality assets, our platform delivers. Our Low-Income Housing Tax Credit (LIHTC) business has consistently delivered strong results demonstrating our success in navigating various interest rate cycles and and dynamic market conditions. Our strong relationships with industry leading LYTC developers combined with market demand position us well to grow this business and further strengthen our financial performance. Given the strength of our pipeline in our traditional and Low-Income Housing Tax Credit (LIHTC) lending platforms, we are reaffirming our guidance for gross annualized loan growth of 10 to 15% over over the final three quarters of 2026. We are also increasing the lower end of our capital markets revenue guidance by 5 million now targeting a range of 60 million to 70 million for the next four quarters. In combination with our Low-Income Housing Tax Credit (LIHTC) Permanent loan securitizations launched in 2023, we have also begun partnering with private investors in Low-Income Housing Tax Credit (LIHTC) Construction loan sale transactions. These transactions enable us to expand our permanent Low-Income Housing Tax Credit (LIHTC) lending capacity which will drive increased capital markets revenue. The ability to sell off these Low-Income Housing Tax Credit (LIHTC) construction loans allows our team to say yes when our developer clients would like us to provide the construction financing for their projects. In addition to the permanent financing that generates our capital markets revenue. This is allowing us to grow our market share in the affordable housing space. During the quarter we identified a total of 523 million in Low-Income Housing Tax Credit (LIHTC) loans, both construction and permanent for securitization and sale. The transactions are planned to close during the second quarter and will mark our fifth permanent loan securitization and our second construction loan sale. This is our Low-Income Housing Tax Credit (LIHTC) flywheel in action. Strong demand for affordable housing reinforced by the Federal government’s commitment to increase Low-Income Housing Tax Credit (LIHTC) tax credits, combined with our deep developer relationships and our exceptional client service positions us to capture market share from the larger competitors in this space. Litec Industries proven long term performance drives investor demand for these assets enabling us to execute Low-Income Housing Tax Credit (LIHTC) loan securitizations and sales. These transactions allow us to proactively manage concentration, risk, balance sheet growth, liquidity and capital levels while generating increased capital markets revenue. We are building an asset light capital efficient and revenue heavy business in affordable housing. While securitizations and Low-Income Housing Tax Credit (LIHTC) construction loan sales temper near term on balance sheet growth, they enhance long term profitability by creating more capacity. The balance sheet capacity created by these transactions is then rapidly redeployed into new originations allowing us to replace the earning assets quickly and expand our capital markets revenue to more than offset the foregone interest income over time. These loan sales and securitizations are also allowing us to strategically manage our total assets under the 10 billion asset threshold this year. We anticipate growing beyond 10 billion sometime in 2027 and we plan to be fully prepared for the associated organizational impacts by mid-2028. Building on the planning efforts we began in 2023, our company is executing at a high level across all three of our core lines of business. Our team has driven a 5 year earnings per share CAGR of 14% and a 5 year tangible book value per share CAGR of 12.5%. Our continued investments in talent, technology and strategic growth combined with disciplined expense management position us to sustain this top tier financial performance. I am grateful for our 1,000 teammates that take exceptional care of our clients, our communities and each other as they deliver long term value for our shareholders. I will now turn the call over to Nick to provide further details regarding our first quarter results.

Nick Anderson (Chief Financial Officer)

Thank you Todd and good morning everyone. We delivered net income of 33 million or $1.99 per diluted share for the quarter. Net interest income was $67 million and increased slightly on a linked quarter basis when adjusted for fewer days in the first quarter. Our Net Interest Margin Tax Equivalent Yield (Net Interest Margin (NIM) Tax Equivalent Yield (TEY)) increased 1 basis point from the fourth quarter of 2025 which was below the low end of our guidance range. Our robust deposit growth came early in the quarter from our correspondent business which carries higher pricing and when combined with loan growth occurring very late in the quarter, margin expansion was muted. The increase in our margin was driven by significant improvements in the cost of funds partially offset by a reduction in our earning asset yields. We continue to have a disciplined approach to deposit pricing and combined with a liability sensitive balance sheet, our cost of funds betas are more than one and a half times those of our earning assets during the current rate cutting cycle. Since the Fed began cutting rates in 2024, our cost of funds have declined by 79 basis points compared to only a 47 basis point decline in earning asset yields. While we continue to benefit from repricing lower yielding loans into higher market rates, the opportunity is naturally moderating as the rate cutting cycle matures. During the quarter, new loan origination yields exceeded those on loan payoffs by 22 basis points. However, loan growth arrived very late in the quarter and average loan balances were down 109 million, contributing to the decline in the loan yield compared to the prior quarter. While our balance sheet has moved closer to neutral since the rate cutting cycle began, we remain positioned to benefit from future rate reductions with rate sensitive liabilities exceeding rate sensitive assets by approximately 900 million, providing upside to margin in a declining rate environment. For future cuts in the fed funds rate, we estimate 1 to 2 basis points of Net Interest Margin (NIM) accretion for every 25 basis point cut in rates. If the yield curve steepens, we’d expect Net Interest Margin (NIM) expansion at the top end of that range and if the yield curve remains relatively flat, we would expect Net Interest Margin (NIM) expansion at the lower end of the range supported by our late first quarter loan growth. We are guiding second quarter Net Interest Margin (NIM) Tax Equivalent Yield (TEY) ranging from static to an increase of three basis points assuming no further fed funds rate changes. Upside in our second quarter Net Interest Margin (NIM) is supported by repricing opportunities on approximately 163 million in fixed rate loans currently yielding 6.2% which we would project to reset nearly 25 to 30 basis points higher. We also anticipate continued CD repricing during the second quarter with approximately 400 million of maturities currently costing 3.7% which we expect to retain and reprice nearly 25 to 30 basis points lower. We project investment yields to expand supported by a solid pipeline of new municipal bonds priced well above 7% on a tax equivalent basis. Additionally, we are planning to offtake approximately 523 million of Low-Income Housing Tax Credit (LIHTC) loans through the securitization and loan sale in the second quarter, which should be moderately Net Interest Margin (NIM) accretive and is reflected in our Net Interest Margin (NIM) guidance. Non interest income totaled $23 million in the first quarter, including $11 million from capital markets revenue and $5 million from wealth management. Our Low-Income Housing Tax Credit (LIHTC) lending team closed 13 projects during the quarter, including three with new developers. As we continue to expand our Low-Income Housing Tax Credit (LIHTC) platform, our wealth management team delivered strong results this …

Full story available on Benzinga.com

This post was originally published here

PG&E (NYSE:PCG) held its first-quarter earnings conference call on Thursday. Below is the complete transcript from the call.

This content is powered by Benzinga APIs. For comprehensive financial data and transcripts, visit https://www.benzinga.com/apis/.

View the webcast at https://events.q4inc.com/attendee/408210508

Summary

PG&E reported first quarter core earnings per share of $0.43 and reaffirmed full-year 2026 core EPS guidance of $1.64 to $1.66, marking a projected 10% growth over 2025.

The company announced a 23% reduction in electric rates for its most vulnerable customers since January 2024, driven by its affordability initiatives.

PG&E is focused on wildfire mitigation, highlighting progress in undergrounding and continuous monitoring, which has helped avoid $100 million in maintenance costs.

The Diablo Canyon nuclear power plant received a 20-year license extension, supporting California’s clean energy goals.

PG&E’s five-year capital plan remains at $73 billion, with no new equity issuance required through 2030, and the company aims to maintain investment-grade credit ratings.

The company is optimistic about large load growth from data centers, with 1.8 gigawatts expected online by 2030, contributing to future rate reductions.

Management expressed confidence in legislative progress for wildfire liability reform, emphasizing the need for a whole-of-society approach.

Full Transcript

OPERATOR

Thank you for standing by. At this time, I would like to welcome everyone to the PG&E Corporation first quarter 2026 earnings release. All lines have been placed on mute to prevent any background noise. After the speaker’s remarks, there will be a question and answer session today. We ask you to limit yourself to one question one follow up.

Jonathan Arnold (Vice President of Investor Relations)

Good morning everyone and thank you for joining us for PG&E’s first quarter 2026 earnings call. With us today are Patty Poppy, Chief Executive Officer, and Carolyn Burke, Executive Vice President and Chief Financial Officer. We also have other members of the leadership team here with us in our Oakland headquarters. First, I should remind you that today’s discussion will include forward looking statements about our outlook for future financial results. These statements are based on information currently available to management. Some of the important factors which could affect our actual financial results are described on the second page of today’s earnings presentation. The presentation also includes a reconciliation between non GAAP and GAAP financial measures. The slides, along with other relevant information can be found online at investor.pgecorp.com we’d also encourage you to review our quarterly report on Form 10-Q for the quarter ended March 31, 2026. And with that, it’s my pleasure to hand the call over to our CEO Patty Poppy.

Patty Poppy (Chief Executive Officer)

Thank you Jonathan. Good morning everyone. I’m pleased to be with you this morning to report another quarter of strong progress on multiple fronts. Today we announced core earnings per share for the first quarter of $0.43. This strong start puts us solidly on track to deliver again and reaffirm our full year 2026 core EPS guidance of $1.64 to $1.66 at the midpoint. Our guidance implies 10% growth over 2025 and would mark our fifth consecutive year of double digit core earnings growth. Looking forward, we’re reaffirming our EPS growth guidance for 2027 through 2030 which is unchanged at 9% plus annually. We’re also reaffirming our five-year capital and financing plans including zero new equity issuance needs through 2030. We continue to deliver for our customers on affordability. On March 1st we lowered electric rates for the fifth time since January 2024 for our most vulnerable residential customers. Bundled rates are now down 23%. For other residential customers, rates are down 13% over that same period. In February, our Diablo Canyon nuclear power plant received the final state permit approvals needed to support extended operations through 2030, and in early April, the Nuclear Regulatory Commission granted Diablo Canyon a 20 year license extension. These actions underscore Diablo Canyon’s critical role in supporting California’s reliability and clean energy goals, although further action by the state is required in order to operate beyond 2030. Turning to slide 4 we remain focused on helping California build a durable long term wildfire solution. The CEA’s report and recommendations provide a strong foundation as the Legislature begins the next phase of this important work. We were encouraged to see the CEA emphasize the cost of inaction, noting that, and I quote, inaction perpetuates unaffordability for consumers and hinders the ability to attract the capital required to maintain safe, clean and reliable infrastructure. End quote. This is a strong call to act for California policymakers. As we said last quarter, the CEA report marks the beginning of the legislative phase. With the session running through August, policymakers now have the opportunity to evaluate a menu of options across multiple pathways. We remain encouraged by the progress toward meeting the commitment made by the Legislature last year to find and implement a long term whole of society solution. That commitment began with last year’s SB254, followed by the governor’s executive order, the CPUC’s submission to the CEA, and now the CEA’s report. As I said last quarter, the status quo is neither sustainable nor affordable and California needs a model that works for all stakeholders, whether they are those affected by wildfires, utility and insurance customers, communities, the state and the capital providers needed to support a safe, reliable and clean energy system. Turning to Slide 5 Our focus on wildfire mitigations remains clear and unwavering. We know this work is never finished, which is why we continuously look for better and more effective ways to strengthen our mitigations. Our operational mitigations, including PSPs, EPSs and continuous monitoring are making us safer every day and position us to respond effectively whatever the weather conditions. Looking forward, our long term infrastructure hardening plans will combine safety and improved reliability and and lower maintenance costs. Undergrounding is an important driver of customer affordability too, reducing the need for and expense of annual inspections and vegetation management. As you heard on our last call, the CPUC has now provided a clear path for us to request additional undergrounding through a 10 year plan. We’re still on track to make this filing with the oeis in the third quarter, including our next approximately 5000 miles and covering years 2028 through 2037 combined with the 1900 miles of undergrounding we expect to have completed by the end of 2027, plus an additional 4,000 miles of overhead hardening, this would result in nearly 11,000 miles of planned system hardening through 2037, or more than 3/4 of the high fire threat miles we plan to harden. Based on our current risk modeling. We’ll provide more detail in our 10 year filing, but in the meantime, we calculate that our undergrounding to date over 1,200 miles has already allowed us to avoid more than $100 million of maintenance spend which otherwise would have been paid by customers. That is exactly the kind of durable affordability we’re working hard every day to deliver for our customers. Looking at slide 6, you’ll see our simple, affordable model as amplified last quarter, giving us line of sight to customer bill growth of 0 to 3%. We call that our path to flat, a destination our customers would love. As noted earlier, in March we implemented our fifth reduction in electric rates in two years. That’s real progress on affordability, and this progress matters most for customers who need it most. Since January 2024, electric rates for our most vulnerable customers are down 23%. For our other residential customers, rates are now down 13%, about $300 less per year. That is real money. Turning to Slide 7, you can see the progress we’re making in enabling rate reducing load growth. Projects are moving through our development pipeline, with our final engineering stage increasing to 4.6g gigawatts since our year end update. This progression from application to preliminary engineering and on to final engineering is a natural and expected part of the project cycle and reflects healthy forward momentum. We also recently initiated our third cluster study and the results reinforce that there’s strong interest across our service area. In total, customer interest exceeded an additional 10 gigawatts spanning multiple regions including Silicon Valley and the Central Valley. Importantly, this demand remains diversified. There’s no single project driving these totals. We’re committed to only adding load that is definitively rate reducing. We simply need to get the pricing right. Projects from this latest cluster study, which meet the rate reducing threshold, will move through preliminary engineering over the next six months, refilling the pipeline funnel from the top as earlier projects mature. Importantly, this growth is occurring alongside significant resource additions across California. Since 2020, CAISO load serving entities have added more than 33 gigawatts of new resources to the grid, including over 7 gigawatts in 2025 alone. In addition, the CPUC is continuing their practice of issuing new build procurement orders, which have resulted in 22 gigawatts under contract through 2029. This kind of growth is good for customers and good for California’s economy. Every gigawatt of new data center load can contribute to affordability by reducing electric bills by 1% or more, while also supporting thousands of construction jobs and generating hundreds of millions of dollars in additional tax revenue. Before I hand it over to Carolyn, I’d like to tie all this together with my story of the month this quarter. That story is about continuous monitoring and how we are shifting from reactive maintenance to proactive data driven risk management. Continuous monitoring uses sensors, our smart meters, analytics and machine learning models to identify emerging issues on the system before they turn into outages, ignitions or safety events. It’s allowing us to see developing conditions in real time and intervene earlier, often before there’s any customer impact. We’re seeing tangible operational benefits from this approach. Continuous monitoring helped US avoid approximately 12 million unplanned customer outage minutes in 2025 and another 4 million minutes in the first quarter of 2026. In many cases, these interventions occurred before customers were even aware there was a problem. Since the beginning of last year, we’ve had 1484 good catches where sensor data flagged, developing weaknesses or active events on the grid. 23 of these could have become ignitions, but didn’t. Identifying stressed equipment early also allows us to fix issues at a lower cost and avoid more expensive emergency repairs down the road. In fact, over that same five quarter period, early detection of stressed equipment helped us save an estimated $8 million of capital spend through lower cost repairs and over $1 million in expense. By reducing time spent responding to emergency asset failures, continuous monitoring is also improving how our teams work in the field. More precise diagnostics mean our troubleshooters spend less time searching for problems and more time fixing them, improving both productivity and safety. Taken together, our continuous monitoring program is an important step forward and an example of how we manage risk control costs and deliver reliable service. With that, I’ll turn it over to Carolyn.

Carolyn Burke (Executive Vice President and Chief Financial Officer)

Thank you Patty and good morning everyone. Turning to Slide 9, you can see our first quarter 2026 earnings walk. Core earnings for the quarter were $0.43, up $0.10 from the first quarter last year, putting us in position to once again deliver on our plan. Customer capital investments contributed 6 of that $0.02 reflects ongoing execution of our capital plan and the associated return on rate base, including CPUC ROE. We also have a 4 cent benefit related to February’s final Commission decision. In our 2023 Wildfire Mitigation Safety Initiative application, non fuel O&M savings contributed an additional two cents, partially offset by our decision to redeploy one penny back into the business timing and other was a 3 cent tailwind in the quarter compared to the prior year. As we look forward to the balance of 2026, you can count on us to remain focused on disciplined execution and delivering our guidance while taking a thoughtful approach to redeploying savings in ways that benefit customers and help to de risk 2027 and beyond. On slide 10 there is no change to our five year $73 billion capital plan through 2030. We continue to see strong demand for customer beneficial investment across our transmission and distribution systems and we still see at least $5 billion of incremental customer investment opportunity outside the current plan. We have flexibility in how and when we may pursue these additional opportunities to ensure we’re making the right decisions for customers and investors. Our preference today remains making the plan better by prioritizing bringing in investments which enable new beneficial load and help lower rates for our core customers over time. Or we could make the plan longer by extending the duration of our top tier rate base growth. A third option, though not one we’re considering right now, is to make the plan bigger by adding to our current $73 billion plan envelope. Taken together, these options give us confidence that we have flexibility in the plan and that we can continue to deploy growth capital in a disciplined way while at the same time supporting affordability growth and long term value creation for ownership. Turning to slide 11, our five year financing plan is also unchanged from our prior call. The plan continues to be built on conservative assumptions which align with the guideposts I’ve previously shared. First, our plan is built to require no new common equity through 2030. Second, we remain focused on achieving investment grade ratings including sustaining FFO to debt in the mid teens. And third, we continue to target ramping up to a 20% dividend payout ratio by 2028, then maintaining that level through 2030. In February we took advantage of favorable market conditions to execute two financings. We issued 1 billion of parent level junior subordinated notes opportunistically starting to address 2027 parent funding needs. There is no change to our guidance for a net $2 billion of financing from parent debt and other through 2030. At the utility, we issued $2.2 billion of first mortgage bonds covering roughly half of our 2026 utility debt needs which remain unchanged from a capital allocation perspective and in light of encouraging indications that the state is serious about pursuing additional wildfire reform. We continue to see our current plan as the right one for both customers and investors. However, I’ll reiterate that if we stop seeing progress towards reforming the wildfire risk model, you can be sure that we will actively reevaluate all aspects of our capital allocation Plan. On Slide 12, we continue to make steady progress toward investment grade credit ratings and I’m encouraged by the momentum we’re seeing following our fourth quarter call. Moody’s revised their outlook to positive, reflecting continued improvement in our credit trajectory. Our focus on strong financial ratios, disciplined holding company leverage and continued progress on wildfire mitigation directly supports the criteria for potential upgrades. …

Full story available on Benzinga.com

This post was originally published here

For years, Tesla, Inc. (NASDAQ:TSLA) owned the autonomy narrative. But in robotaxis, the race is no longer about who started first—it’s about who scales first.

From Promise To Deployment

Tesla still holds an edge in data and manufacturing scale. But its robotaxi rollout remains early—largely geofenced, supervised, and limited in scope.

Meanwhile, Alphabet Inc’s (NASDAQ:GOOGL) (NASDAQ:GOOG) Waymo is doing what the market cares about most: deploying.

The company has built the largest active robotaxi fleet in the West, logged millions of commercial ride miles, and is now pushing beyond the U.S., with planned …

Full story available on Benzinga.com

This post was originally published here

On Thursday, First Industrial Realty (NYSE:FR) discussed first-quarter financial results during its earnings call. The full transcript is provided below.

Benzinga APIs provide real-time access to earnings call transcripts and financial data. Visit https://www.benzinga.com/apis/ to learn more.

The full earnings call is available at https://edge.media-server.com/mmc/p/r6itwu3x/

Summary

First Industrial Realty reported stable financial results with NAREIT funds from operations (FFO) at $0.68 per share for Q1 2026, matching the prior year’s performance, and adjusted FFO at $0.72 per share after excluding advisory costs.

The company achieved significant leasing wins, notably a large renewal in Southern California with a rental rate change exceeding 40%, and a pending $131 million land sale in Phoenix which greatly surpasses market land values.

Guidance for 2026 FFO is maintained at $3.05 to $3.15 per share, with an adjusted range excluding advisory costs of $3.09 to $3.19. The company anticipates a stable occupancy rate between 94% and 95% and cash same store NOI growth of 5% to 6%.

Development leasing activity was robust, with 383,000 square feet leased across multiple markets, contributing positively to FFO, although offset by upcoming land sale impacts and adjusted leasing assumptions.

Management expressed optimism about tenant demand, particularly in Pennsylvania and South Florida, while maintaining a cautious approach to new development starts based on market conditions and concentration risks.

Full Transcript

OPERATOR

Good day and welcome to the First Industrial Realty Trust Inc. First Quarter 2026 Results Call all participants will be in listen only mode. Should you need assistance, please signal a conference specialist by pressing the star key followed by zero. After today’s presentation there will be an opportunity to ask questions. To ask a question you may press star, then one on a touchtone phone. To withdraw your question, please press star and then two. Please note this event is being recorded. I would now like to turn the conference over to Art Harmon, SVP Investor Relations and Marketing. Please go ahead.

Art Harmon (SVP Investor Relations and Marketing)

Thanks very much, Dave, hello everybody and welcome to our call. Before we discuss our first quarter 2026 results and our updated guidance for 2026, please note that our call may include forward looking statements as defined by federal securities laws. These statements are based on management’s expectations, plans and estimates of our prospects. Today’s statements may be time sensitive and accurate only. as of today’s date, April 23, 2026. We assume no obligation to update our statements or the other information we provide. Actual results may differ materially from our forward looking statements and factors which could cause this are described in our 10K and other SEC filings. You can find a reconciliation of non GAAP financial measures discussed in today’s call in our Supplemental report and our earnings release. The supplemental report, earnings release and our SEC filings are available at firstindustrial.com under the Investors tab. Our call will begin with remarks by Peter Bacilli, our President and Chief Executive Officer, and Scott Musil, our Chief Financial Officer, after which we’ll open it up for your questions. Also with us today are JoJo Yap, Chief Investment Officer, Peter Schultz, Executive Vice President, Chris Schneider, Executive Vice President of Operations, and Bob Walter, Executive Vice President of Capital Markets and Asset Management. Now let me turn the call over to Peter.

Peter Bacilli (President and Chief Executive Officer)

Thank you Art and thank you all for joining us today. I’d like to express my congratulations and gratitude to our team for their efforts in getting 2026 off to an excellent start. We delivered some significant development leasing wins and signed a key renewal in Southern California for our largest remaining 2026 expiration. We’re also capturing significant value creation via a pending $131 million land sale that I’ll detail shortly. Turning to the overall market, industry fundamentals continued to steady. According to CBRE, national vacancy was stable at 6.7% at the end of the first quarter. Net absorption was a solid 43 million square feet, modestly below new deliveries of 55 million square feet. New supply nationally continued to be disciplined with starts remaining muted at 39 million square feet. The national construction pipeline is 237 million square feet and highly pre leased at 39% in our portfolio. Overall touring activity has increased for our availabilities with decision making accelerating for space sizes under 200,000 square feet within our development portfolio with respect to potential economic and demand consequences from the conflict in the Middle East. Thus far we’ve seen no discernible impact to leasing activity, but this is a risk we’ll continue to monitor. From a portfolio standpoint, our in-service occupancy at quarter end was 94.3% in line with our expectations. Since our last earnings call, we made further progress on our 2026 rollovers. We’ve now taken care of 61% by square footage and our overall cash rental rate increase for new and renewal leasing is 41%. This includes our largest remaining 2026 expiration, the 556,000 square footer in Southern California for which we achieved a cash rental rate change that significantly exceeded the top end of our annual guidance range of 40%. Moving now to development leasing, we saw some broad based success across several markets, inking 383,000 square feet in total. These included a full building lease for our 155,000 square foot first Wilson 2 project in the Inland Empire. We also signed several sub-100,000 square foot leases in the markets of Chicago, South Florida, Central Florida as well as Central Pennsylvania. There we leased a 54,000 square foot space at the recently completed first phase of First Park 33 in the Lehigh Valley. As I noted in my opening comments, we’re pleased to share with you that the ground lessee of 100 acres of land in the 303 corridor in the Phoenix market exercised its option to purchase the site for a sales price of 131 million. The proceeds are approximately $30 per land square foot, which is more than three times industrial land values in that market. We expect this transaction to close in June. Before I turn it over to Scott, I would like to remind you of two upcoming property tours we will be hosting. On May 12th we will tour our Inland Empire portfolio and on June 4th we’ll be touring our Central New Jersey assets. Please reach out to Art Harmon to register or for more information. With that I’ll turn it over to Scott.

Scott Musil (Chief Financial Officer)

Thank you Peter first quarter of 2026 Nareit funds from operations were $0.68 per fully diluted share compared to $0.68 per share in the first quarter of 2025. The first quarter 2026 FFO per share was negatively impacted by $0.04 per share of advisory costs related to the contested proxy campaign that was initiated by landed buildings. Excluding these costs, our FFO per share was $0.72. As we noted on our fourth quarter earnings call, FFO in the first quarter was impacted by higher G&A costs due to accelerated expense related to an accounting rule that required us to fully expense the value of granted equity based compensation for certain tenured employees. Our cash same store NOI growth for the quarter excluding termination fees was 8.7%. The results in the quarter were primarily driven by increases in rental rates on new and renewal leasing, lower free rent and contractual rent bumps partially offset by lower average occupancy. Summarizing our leasing activity during the quarter, approximately 2.4 million square feet of leases commenced. Of these, 300,000 were new, 2 million were renewals and 100,000 were for developments and acquisitions with lease up. Before I discuss guidance, let me update you on the 3 PL tenant on our credit watch list. If you recall, we were collecting rent directly from a subtenant. While working through the collection process, we are pleased to announce that we signed an agreement with the 3 PL that required a lump sum payment of approximately 60% of the balance owed us at December 31, 2025 which we received in March. In addition, the agreement calls for scheduled payments to pay off the remaining past due rent by the end of 2026. Now moving on to our guidance, our guidance range for 2000 AREIT FFO is now $3.05 to $3.15 per share, reflecting $0.04 per share of incremental advisory costs related to the land and buildings Contested Proxy Campaign 2026 FFO Guidance Range absent these advisory costs $3.09 to $3.19 per share, which is unchanged compared to our last call. Our other major operating metric guidance assumptions are as follows. Average quarter end in service occupancy of 94 to 95%. This range now reflects approximately 1.3 million square feet of incremental development, leasing and the 708,000 square footer in central Pennsylvania, all to occur in the second half of the year Cash same store NOI growth before termination fees of 5 to 6%. Guidance includes the anticipated 2026 costs related to our completed and under construction developments at March 31st. For the full year 2026 we expect to capitalize about $0.08 per share of interest. Our GINA expense guidance range is 42 to $43 million, which excludes the $5.6 million of incremental advisory costs related to the contested proxy campaign, and our guidance assumes that the aforementioned forecasted land sale in Phoenix will close in June. Let me turn it back over to Peter.

Peter Bacilli (President and Chief Executive Officer)

We are optimistic about the activity levels we are seeing across our availabilities. As always, our team is focused on taking care of our customers, gaining new ones, and sourcing and executing on profitable investments to drive long term cash flow and value for shareholders. Operator with that, we’re ready to open it up for questions.

OPERATOR

We will now begin the question and answer session. To ask a question, you may press star then one on your touchtone phone. If you are using a speakerphone, please pick up your handset before pressing the keys. If at any time your question has been addressed and you would like to withdraw your question, please press start and then 2. Also, please limit yourself to one question and one follow up re queue to ask additional questions. The first question comes from Craig Mailman with Citi. Please go ahead.

Craig Mailman (Analyst at Citi)

Hey, good morning, guys. Peter, you know you mentioned that touring activities improved, velocity under 200,000 square feet has improved. Could you talk about other your peers have talked about the data center adjacent demand. Could you talk about how much of this improvement is that segment of demand versus just either e-commerce or other broader industrial demand? I mean from what we’re seeing, most of it is just broader industrial demand. 3 PLs continue to be very active. Manufacturing’s picked up, you know, and that includes data center tech, aerospace, et cetera. So that’s picked up. But it looks more like broader demand for industrial than completely data center driven. And then sorry Scott, I know you had mentioned the Central PA is now second half. Could you just talk about kind of the activity you’re seeing at Denver and Central PA and kind of the the prospects today versus maybe on the fourth quarter call?

Scott Musil (Chief Financial Officer)

Hey Craig, it’s Scott. I think you mentioned that we pushed it to the second half. The 708,000 square footer that’s always been in the second half of the year per our 4Q guidance call. So I wanted to clarify that and then I’ll turn it over to Peter for an update on that vacancy in the Denver development.

Peter Bacilli (President and Chief Executive Officer)

Good morning Craig, it’s Peter. So in Denver we continue to have interested prospects for our large vacancy there. Activity or decision making, I would say for larger users has been slow, limited competitive supply. There were just two buildings that came back that will compete with us. One from a business failure from another landlord and another from a lease expiration. But we continue to have prospects. They’re just very slow in their decision-making. Smaller mid-size tenants in Denver continue to be pretty active. Moving to Pennsylvania to the second part of your question, Pennsylvania probably is our most active or certainly one of our most active markets across the country in terms of prospect activity across a range of sizes and the industries. Including Peter’s comments about 3PLs being very active, we have several prospects for our 708,000 square foot building in central Pennsylvania, all but one of which are full building users. And all of those continue to be engaged in discussions with us.

Craig Mailman (Analyst at Citi)

Great, thank you.

OPERATOR

And the next question comes from Nick Thillman with Baird. Please go ahead.

Nick Thillman (Analyst at Baird)

Hey, good morning. Maybe touching a little bit, Peter. Just thought process on starting some new projects here. Given the land bank, it’s a little bit more heavy, concentrated and say the ie you did sign a lease there, but just how you’re viewing the landscape and just thought process on …

Full story available on Benzinga.com

This post was originally published here

U.S. stocks traded lower midway through trading, with the Nasdaq Composite falling around 0.4% on Thursday.

The Dow traded down 0.20% to 49,392.89 while the NASDAQ fell 0.38% to 24,562.83. The S&P 500 also fell, dropping, 0.11% to 7,130.12.

Leading and Lagging Sectors

Utilities shares jumped by 2.1% on Thursday.

In trading on Thursday, information technology stocks fell by 0.9%.

Top Headline

U.S. initial jobless claims climbed by 6,000 to 214,000 in the week ending April 18, compared to market estimates of 212,000.

Equities Trading UP
           

  • United Rentals Inc (NYSE:URI) shares shot up 20% to $965.28 after the company reported better-than-expected first-quarter financial results and raised its FY26 sales guidance.
  • Shares of Cumberland Pharmaceuticals, Inc. (NASDAQ:CPIX) got a boost, surging 43% to $4.36 after the company announced that Apotex will acquire its line of branded pharmaceuticals for $100 million.
  • Helen of Troy Ltd (NASDAQ:HELE) shares were also up, gaining …

Full story available on Benzinga.com

This post was originally published here

Robinhood Markets, Inc. (NASDAQ:HOOD) on Thursday advanced its Asia-Pacific expansion strategy with a regulatory milestone in Singapore.

The trading platform said that it has secured “in-principle” approval from the Monetary Authority of Singapore, marking a significant step toward launching brokerage operations in the region.

Regulatory Milestone In Singapore

The approval signals regulatory confidence in Robinhood’s application, though it does not yet grant a full operating license. Authorities may still revoke the clearance if conditions change or requirements are unmet.

The company said it must satisfy specific regulatory conditions before receiving final authorization. Until then, it cannot offer brokerage services locally.

Expansion Strategy Gains Traction

Robinhood aims to establish Singapore as its …

Full story available on Benzinga.com

This post was originally published here

Super Micro Computer Inc. (NASDAQ:SMCI) shares cratered during Thursday’s session. The sell-off follows reports that Oracle Corp. (NYSE:ORCL) reportedly canceled a massive server contract.

  • Super Micro Computer stock is feeling bearish pressure. What’s behind SMCI decline?

Oracle Cuts Billion-Dollar Deal

According to Bluefin Research, Oracle canceled an order for 300 to 400 NVIDIA Corp. (NASDAQ:NVDA) GB300 NVL72 racks. Each rack carries a $3.5 million price tag, reported Investing.com. This represents a total contract loss between $1.1 billion and $1.4 billion. Bluefin estimates SMCI shipped only 100 to 200 racks before the termination.

Legal Allegations Drive Shift

Bluefin research indicates the cancellation stems from serious legal headwinds. Sources cite the indictment of an SMCI co-founder for smuggling artificial intelligence Graphics Processing Unit (GPU) into China. Reportedly, …

Full story available on Benzinga.com

This post was originally published here

Graco (NYSE:GGG) released first-quarter financial results and hosted an earnings call on Thursday. Read the complete transcript below.

This content is powered by Benzinga APIs. For comprehensive financial data and transcripts, visit https://www.benzinga.com/apis/.

Access the full call at https://edge.media-server.com/mmc/p/5gty3q3o/

Summary

Graco reported first-quarter sales of $540 million, marking a 2% increase year-over-year, with acquisitions contributing 5% growth and currency translation adding 3%, offset by a 6% decline in organic sales.

Net earnings decreased by 5% to $119 million, with a decrease in gross margin by 60 basis points due to higher product costs, lower factory volume, and tariffs, which increased costs by $7 million.

Operating expenses rose by 7%, primarily due to acquisitions and currency effects, while operating earnings decreased by 4%, with the operating margin in the industrial segment dropping from 34% to 32%.

The company maintains its 2026 revenue guidance of low single-digit organic growth on a constant currency basis and mid-single-digit growth including acquisitions.

Graco highlighted a positive backlog increase of $26 million, driven by the industrial segment, with expectations for improved conversion in the second half of the year.

Strategically, Graco is focusing on further acquisitions, with a well-populated pipeline, particularly in the industrial segment.

The company is celebrating its centennial and continues to prioritize innovation and customer support as part of its long-term strategic direction.

New product launches in the contractor segment are expected to be similar to last year, with no major deviations anticipated.

Management expressed confidence in offsetting tariff impacts through pricing actions and noted a solid cash flow performance, with plans for continued share repurchases and dividends.

Full Transcript

Chris Knudsen (Vice President, Comptroller and Chief Accounting Officer)

Good morning and welcome to the first Quarter Conference call for Graco, Inc. If you wish to access the replay for this call, you may do so by visiting the company website@www.Graco.com. Graco has additional information available in a PowerPoint slide presentation which is available as part of the webcast player. At the request of the Company, we will open the conference up for questions and answers after the opening remarks from Management during this call, various remarks may be made by management about their expectations, plans and prospects for the future. These remarks constitute forward-looking statements for the purposes of the safe harbor provisions of the Private Securities Litigation Reform Act. Actual results may differ materially from those indicated as a result of various risk factors, including Those identified in Item 1A of the Company’s 2025 Annual Report on Form 10-K and in Item 1A of the Company’s most recent Quarterly Report on Form 10-Q. These reports are available on the Company’s website at www.Graco.com and the SEC’s website at www.sec.gov. forward-looking statements reflect Management’s current views and speak only as of the time they are made. The Company undertakes no obligation to update these statements in light of new information or future events. I will now turn the conference over to Chris Knudsen, Vice President, Comptroller and Chief Accounting Officer. Good morning everyone and thank you for joining the call. I’m here today with Mark Sheehan, David Lowe and Sanjeev Gupta. I’ll begin with a brief overview of our first quarter results and then turn the call over to Mark for additional commentary. Yesterday, Baker reported first quarter sales of $540 million, up 2% from the same quarter last year. Acquisitions contributed 5% growth and currency translation added 3% growth, partially offset by a 6% decline in organic sales. Reported net earnings were $119 million, down 5% or $0.70 per diluted share, excluding excess tax benefits from stock option exercises. Adjusted non-GAAP net earnings were $0.66 per diluted share, down 6%. Gross margin decreased 60 basis points versus the first quarter last year. The benefit from our pricing actions helped offset higher product costs from lower factory volume, lower margin rates from acquired operations and incremental tariffs. Tariffs increased product costs by $7 million in the quarter. Operating expenses increased $9 million, or 7% in the quarter, excluding $5 million in incremental expenses from acquired operations and the effects of currency translation. Expenses were flat in the quarter. The operating margin rate in both our contractor and expansion market segments was 24%, consistent with the same period Last year, industrial segment operating margin was 32%, down from 34% in the prior year quarter. The decline is due primarily to unfavorable volume and tariffs that were not offset by price realization. Total company operating earnings decreased $6 million, or 4% in the quarter. Operating earnings as a percentage of sales were 26% compared to 27% in the same period last year. The adjusted effective tax rate was 20% in line with our expected full year adjusted tax rate of 20 to 21%. Cash provided by operations totaled $120 million for the year, down $5 million or 4%. Cash provided by operations as a percentage of adjusted net earnings was 107% for the quarter year to date. Uses of cash include share repurchases of 189,000 shares totaling $16 million, dividends of $49 million and capital expenditures of $12 million. These uses were partially offset by share issuances of $40 million. A few comments as we look forward to the rest of the year, Based on current exchange rates and assuming similar volume, product mix and business mix as in 2025, currency is expected to have a 1% favorable impact on net sales and a 2% favorable impact on net earnings for the full year. 2026. For the full year, we continue to expect unallocated corporate expenses of 40 to 43 million dollars and capital expenditures of 90 to 100 million dollars, including approximately 50 million dollars for facility expansion projects. 2027 will be a 53 week year with an extra week occurring in the fourth quarter. And finally, in the attached materials, we updated our outlook slide to highlight performance by segment and region, with the size of each color dot indicating its relative size versus the others. With that, I’ll turn the call over to Mark for more details on our segment and regional performance.

Mark Sheehan

Thank you, Chris Good morning Everybody. Overall sales increased 2% in the quarter, with acquisitions contributing 5% and foreign currency adding another 3%. That growth was partially offset by a 6% decline in organic revenue. Organic revenue started the year slower than expected, particularly in January, but business activity improved steadily as the quarter progressed, with bookings up 3% at actual currency rates, driving nearly a $26 million increase in backlog, primarily in our industrial segment. If those orders had been converted to revenue within the quarter, organic revenue at actual currency rates would have increased 2% and total sales, including acquisitions, would have been up 7%. The Middle East region represents about $35 million of sales on a full year basis for Graco. To date, we’ve not seen any significant impact on demand or operations. Though the environment remains uncertain, we are staying close to our customers and channel partners and are monitoring order patterns and logistics carefully. From an exposure standpoint, the contractor segment would be the most impacted, primarily related to our protective coating product application. Let me provide some additional color on our segments and regions. In the contractor segment, sales increased 2% in the quarter, with acquisitions and currency translation each contributing 3%, partially offsetting a 4% decline in organic revenue within the segment. Our foam, polyurea and protective coatings businesses continued to be bright spots supported by strong global demand tied to infrastructure, border wall and data center projects. That said, construction demand remains softer than we would like particularly, particularly in the Americas. Housing starts are expected to be relatively flat year over year with fewer new home sales and only modest improvement in existing home sales. Overall, the market has shown limited growth over the past four years and we expect those conditions to persist this year. Turning to the industrial segment, sales increased 4% in the quarter, with acquisitions contributing 8% and currency translation adding another 4%. This growth was partially offset by an 8% decline in organic revenue. Despite the organic decline, bookings were up 5% at actual currency rates, driving a $23 million increase in backlog. If those orders have been converted to revenue within the quarter, organic revenue at actual currency rates would have increased 6%. Industrial Americas performed well, delivering revenue growth despite lower project based activity. In our powder group, bookings in the region were up double digits, supported by broad based strength across multiple end markets. EMEA (Europe, the Middle East, and Africa) and Asia Pacific were more heavily impacted by the timing of completion and acceptance of project based activity, which drove the decline in the quarter. That said, both regions saw activity improve as the quarter progressed, with quoting levels moving higher in our expansion markets Segment Organic revenue declined 5% in the quarter, driven primarily by our semiconductor business, which was coming off an exceptionally strong prior year comparison. Semiconductor delivered its largest quarter of the year in 2025, growing 51%. Despite the tough comparison, semiconductor demand remained solid, with first quarter bookings up at least 20% in each region. We’re also seeing improvement in our environmental business. While the year started slowly, activity has picked up meaningfully with a strong start to the second quarter and bookings are trending positive year to date. Moving on to the outlook despite the slow start to the year, we’re encouraged by demand trends across our broader end markets. We saw a meaningful pickup in both ordering and quoting activity in our industrial and semiconductor businesses throughout the quarter, and based on current order rates, strength in these areas should help offset continued softness in the contractor segment. As a Result, we’re maintaining our 2026 revenue guidance of low single digit organic growth on a constant currency basis and mid single digit growth, including contributions from acquisitions. Looking ahead, second half comparisons are more favorable reflecting an easier contractor comparison in the third quarter and the expected timing of project activity in the industrial businesses towards the end of the year. Finally, I’d like to take a moment to welcome Sanjeev Gupta Dagreko. Sanjeev comes from General Motors where he spent more than 20 years in finance and operating roles across the globe, most recently as CFO of GM International. He brings deep experience across corporate finance, operations, manufacturing and supply chain, and a strong track record of leading global teams. In addition, I want to recognize and thank David Lowe for his more than 30 years of dedicated service as he prepares for retirement. David’s leadership, deep financial expertise and steady guidance have played an important role in shaping our company and supporting our long term success. On behalf of the entire organization, I want to thank David for his many contributions and wish him the best in his next chapter. In closing, I want to take a moment to recognize an important milestone for our company. On April 26, we will celebrate our centennial. This milestone reflects the strength of our people, the durability of our business model, and the deep relationships we’ve built with customers and partners around the world. While we’re proud of our history, this anniversary is really about the future. Continuing to invest in innovation, supporting our customers, and building on the foundation that has sustained the company for a century. That concludes the prepared remarks.

Operator

Operator. We’ll open it up for questions. Thank you. The question and answer session will begin at this time. To ask a question, please press star 11 on your telephone and wait for your name to be announced. To withdraw your question, please press star 11 again. Your question will be taken in the order that it is received. Please stand by for your first question. Our first question comes from Dean Dray of RBC Capital Markets. Please state your question.

Dean Dray (Equity Analyst at RBC Capital Markets)

Thank you. Good morning, everyone. Morning, Dean. Hey, can I add my welcome to Sanjeev and to wish David all the best. Appreciate that. Thank you. Thank you. Since we’re in kind of an uncertain macro here, Mark, maybe you can just kind of take us through the major verticals and kind of what surprised you versus expectations. I know housing remains tough, but semiconductor looks like that’s a positive side. And then just same thing on the. The geographies. And if you could elaborate a bit more on the Middle East exposure for contractor. Thanks.

Mark Sheehan

Yeah, I guess I would start out at a high level and just say that our Industrial bookings in the quarter were actually up mid single digits, which was good and unfortunately we weren’t able to convert that into revenue that you all saw. But in terms of how that mid single digit booking growth took place, it was really across multiple product categories. Look at finishing process. Our lubrication businesses, both ale automatic lubrication as well as our vehicle service business and a little bit of pressure in our sealant and adhesive business offset some of that. But overall I was pretty happy with the growth in industrial in the quarter. The powder business again was influenced mostly by some project activity on the bookings front that booked right at the end of the quarter that we just couldn’t convert. Those projects usually take time between booking and billing. And then the overall Gamma powder business again in aggregate was in line with our long term expectation for the full year of kind of the low single digit organic growth, constant currency. Obviously the home center and the paint channel continue to be, you know, a little bit of a headwind for us. I wouldn’t characterize them as, you know, down significantly, but they were down in the quarter. We did see nice growth in the areas that I mentioned in my script on the high performance coatings and foam business that wasn’t quite enough to offset all of the headwinds that …

Full story available on Benzinga.com

This post was originally published here

On Thursday, Popular (NASDAQ:BPOP) discussed first-quarter financial results during its earnings call. The full transcript is provided below.

This transcript is brought to you by Benzinga APIs. For real-time access to our entire catalog, please visit https://www.benzinga.com/apis/ for a consultation.

Access the full call at https://edge.media-server.com/mmc/p/wdp97ufc/

Summary

Popular reported a strong first quarter with net income of $246 million and earnings per share of $3.78, marking significant improvements compared to the previous quarter and year-over-year.

The company highlighted strategic investments in digital channels and new product offerings aimed at enhancing customer engagement and expanding market reach.

Credit quality remained stable, with favorable trends in non-performing loans and charge-offs, though some increases in specific commercial relationships were noted.

Popular repurchased $155 million in common stock and paid a quarterly dividend, demonstrating a commitment to returning capital to shareholders.

The company provided guidance for 2026, expecting net interest income growth at the higher end of 5-7% and maintaining a focus on cost control and strategic investments.

Full Transcript

OPERATOR

Good day and thank you for standing by. Welcome to Popular Inc. First quarter 2026 conference call. At this time, all participants are in a listen only mode. After the speaker’s presentation, there will be a question and answer session. To ask a question during the session, you will need to press star 11 on your telephone. You will then hear an automated message advising that your hand is raised. To withdraw your question, please press star 11 again. Please be advised that today’s conference is being recorded. I would now like to hand the conference over to the Investor Relations Officer at Popular Inc. Paul Cardillo. Please go ahead.

Paul Cardillo (Investor Relations Officer)

Good morning and thank you for joining us. With me on the call today is our President and CEO Javier Ferrer, our CFO Jorge Garcia and our Chief Risk Officer, Lydia Soriano. They will review our results for the first quarter and then answer your questions. first quarter and then answer your questions. Other members of our management team will also be available during the Q and A session. Before we begin, I would like to remind you that during today’s call we may make forward looking statements regarding Popular such as projections of revenue, earnings, credit, quality, expenses, taxes and capital, as well as statements regarding Popular’s plans and objectives. These statements are based on management’s current expectations and are subject to risks and uncertainties. Factors that could cause actual results to differ materially from these forward looking statements are discussed in in today’s earnings release and our SEC filing. You may find today’s press release and our SEC filings on our webpage at popular.com I will now turn the call over to Javier Ferrer. Thank you Paul and good morning everyone. Please turn to Slide 4 where we share highlights of our strong operating performance. In the first quarter we reported net income of 246 million and earnings per share of $3.78, up 12 million 25 cents per share from the fourth quarter. The improvement was driven by higher net interest, income margin expansion and lower operating expenses. Net income and EPS improved by 38% and 48% respectively compared to the first quarter of 2025. We continue to invest in our businesses and expand our capabilities in support of our strategic objectives. When we deliver for customers, our franchise strengthens and our shareholders benefit. Overall credit trends remain favorable with lower NPLs and improved NPL ratios. Quarterly net charge offs increased primarily due to a single previously identified commercial relationship. We also demonstrated our commitment to returning capital to our shareholders by repurchasing 155 million in common stock and paying a quarterly common stock dividend of $0.75 per share. Our ROTC was 15.5% up from 14.4% in the fourth quarter of 2025 and 11.4% a year ago. We are very pleased with these returns and remain focused on reaching our 14% through the cycle objective. Before turning the call over to Jorge, I will comment on the business environment in Puerto Rico. Business activity in Puerto Rico remained positive, supported by steady trends in employment and consumer activity. With manufacturing, construction and tourism leading the way. We’re closely monitoring ongoing geopolitical developments as sustained higher oil and commodity prices can impact our customer base. As of the end of the first quarter, we have not seen significant signs of economic stress. The labor market remains healthy with the unemployment rate at 5.6%, stable near historic lows. Three sectors have outperformed the broader labor market construction, transportation and warehousing and leisure and hospitality. Consumer spending remains healthy. Combined credit and debit card purchase by Banco Popular customers increased by approximately 5% compared to the first quarter of 2025. We continue to see healthy demand for homes in Puerto Rico. Mortgage balances at Banco Popular increased modestly during the quarter. Momentum in the construction sector continues to be solid, with public and private investment fueling high employment and strong activity. We’re optimistic that these trends will persist given the backlog of obligated federal disaster recovery funds. On the private side, real estate and tourism development projects and the renewed focus on reshoring to Puerto Rico by global manufacturing companies should continue to support economic growth on the island. The tourism and hospitality sector continues to be an important contributor to a Puerto Rico economy. Year to date through February, hotel occupancy increased to 83%, up from 76% in the same period last year. Over the same period, RevPAR increased 6%. Hotel demand averaged roughly 400,000 room nights, representing 10% growth versus the same months in 2025. Passenger traffic at Luis Munoz Marin International Airport was down 2% in the first quarter after a record year in 2025. JetBlue also announced an expansion of its San Juan Hubba with five new nonstop domestic routes beginning in the spring of 2026. Cruise activity has also been a meaningful tailwind after record Cruise arrivals in 2025. Arrivals accelerated sharply in the first two months of 2026, with year to date arrivals through February up 40% year over year. In addition, the Puerto Rico Tourism Company announced a strategic partnership with Royal Caribbean beginning in July of this year that would establish San Juan as the cruise line’s home port. Moving to our strategic framework, we continue to advance our three objectives. A growing number of initiatives are gaining traction simultaneously and the pace of execution is accelerating. One of our objectives is to be the number one bank for our customers by delivering exceptional service and products. A key part of that is making it easier for customers to engage with Popular through our digital channels. We recently launched an integrated marketplace within our digital app Mivanco, one of Puerto Rico’s most widely used mobile apps. The platform gives our retail customers access to exclusive Exclusive offers, discounts and benefits from a wide variety of merchants while enabling businesses, many of them small and medium sized, to reach a high volume of potential customers. This allows us to create meaningful connections between our retail and commercial customers and strengthens the value of banking with Popular, we also launched two new corporate credit cards designed to facilitate payments and optimize cash flow. Both have gained traction and driven purchase volume. In addition to our core retail and commercial efforts, we are advancing targeted segment strategies to improve service, enable more personal relationship based engagement and position Popular as the primary bank earlier in our relationship with our customers. A recent example is our newly launched program designed to meet the unique financial needs of doctors, dentists and veterinarians. The momentum behind these initiatives reflects the energy and focus of our teams. We are encouraged to see that execution translating into stronger results and we expect the benefits to become more visible over time. And with that, I turn the call over to Jorge for more details on our financial results.

Jorge Garcia (Chief Financial Officer)

Thank you Javier Good morning and thank you all for joining the call today. As Javier mentioned, our quarterly net income increased by 12 million to 246 million and our EPS improved by $0.25 to $3.78 compared to adjusted net income in the fourth quarter, which excluded a partial reversal of the FDIC Special Assessment Reserve net income increased by 22 million. These results were driven by better NII, higher NIM and lower expenses, partly offset by a slightly higher provision for credit losses. Our objective is to deliver sustainable financial results and we’re pleased to have generated a 15.5% ROE (Return on Equity) for the period. We will continue to use all levers to position the company as a top performing bank when compared to our mainland peers. Please turn to Slide 7. Net interest income of $670 million increased by approximately $13 million driven by fixed rate asset repricing and a higher balance of investments due to higher deposit balances and lower deposit costs at both banks. Net interest margin expanded 5 basis points to 3.66% on a GAAP basis. On a taxable equivalent basis, the margin improved by 11 basis points to 4.14%, driven primarily by lower interest expense including a meaningful reduction in the cost of Puerto Rico public deposits. Ending loan Balances were essentially flat at $39.3 billion, down about 38 million from the fourth quarter, driven primarily by lower balances at Popular bank due to paydowns in the construction segment and runoff from the exited residential mortgage business. At BPPR, modest growth in the mortgage and commercial segments were somewhat offset by weaker trends in auto lending. Given the slower demand in the consumer and auto segments, we expect consolidated loan growth in 2026 to be at the low end of our original 3% to 4% range. In our investment portfolio, we have maintained our strategy of reinvesting proceeds from bond maturities into U.S. Treasury notes and bills. During the quarter, we purchased approximately 1.9 billion of treasury notes with a duration of 2.6 years and an average yield of around 3.7%. Taking advantage of a modestly steeper curve, deposit balances ended the quarter at 67.6 billion, 1.4 billion higher than the fourth quarter. Retail and commercial deposits increased by 1.2 billion, driven by tax refund activity. On an average basis, total deposits increased by 1.1 billion or by 384 million when excluding Puerto Rico public deposits, Puerto Rico public deposits increased by 250 million to end the quarter at 19.7 billion. We continue to expect public deposits to be in a range of 18 to 20 billion. For the year, total deposit costs decreased by 12 basis points quarter over quarter to 1.56% with improvement in both of our banks. Excluding Puerto Rico public deposits, total deposit costs decreased by 5 basis points to 1.09%. At BPPR, deposit costs decreased by 11 basis points mostly as a result of Puerto Rico public deposits repriced lower by 31 basis points due to lower short term rates at popular bank. The 16 basis points reduction in deposit costs was primarily related to lower online savings, deposit costs and repricing of time deposits. Given positive deposit trends in Puerto Rico, we now expect 2026 net interest income growth at the upper end of our 5 to 7% guidance range. Please turn to slide 8. Non interest income was 166 million in line with Q4 and at the high end of our quarterly guidance with solid performance across most of our fee generating segments. Compared to the first quarter of 2025, non interest income improved by 9% driven by growth in debit and credit card fees of 14 and 6% respectively, as well as 13% increase in asset management and insurance fees, demonstrating our ability to benefit from our breadth of product offerings. We continue to expect quarterly non interest income to be in the range of 160 to 165 million. Please turn to Slide 9.. Total operating expenses were 467 million, a decrease of 6 million when compared to Q4. Excluding the FDIC reversal in Q4, operating expenses decreased by 22 million. The decrease was primarily driven by lower personnel costs as the fourth quarter included a profit sharing accrual of approximately 13 million. Along with the impact of fewer calendar days in the first quarter, this quarter also benefited from lower employee health care related costs. We also saw lower seasonal business promotion expenses and lower professional fees partly offset by higher technology and software expenses. Reflecting our continued investment in technology and transformation initiatives, we expect full year expenses to increase by 2 to 3% compared to our original guidance of 3%. We will continue to prioritize investments in our people and technology and continue to target expense efficiencies. Our effective tax rate in the first quarter was 16% unchanged from the fourth quarter. We now expect the effective tax rate for the year to be at the low end of our original 15 to 17% guidance range due to higher projected exempt income. Please turn to Slide 10. Tangible book value per share at the end of the quarter was $84.98, an increase of $2.33 per share driven by our net income and offset in part by our capital return activity. During the quarter, we repurchased approximately $155 million in common stock. We ended the quarter with $126 million remaining under our active repurchase authorization which we expect to exhaust during the second quarter. As we have said in the past, we seek to maintain an active repurchase authorization in place and we are targeting an update on capital actions before the second quarter earnings call. In addition to common stock repurchases, we also expect to continue evaluating capital optimization alternatives and pursue a dividend increase during the year. Of course, our plans are subject to market conditions, regulatory considerations and any required board approvals. With that, I turn the call over to Lidia.

Lydia …

Full story available on Benzinga.com

This post was originally published here

Cemex (NYSE:CX) held its first-quarter earnings conference call on Thursday. Below is the complete transcript from the call.

Benzinga APIs provide real-time access to earnings call transcripts and financial data. Visit https://www.benzinga.com/apis/ to learn more.

The full earnings call is available at https://events.q4inc.com/attendee/799171124

Summary

Cemex reported a record quarterly EBITDA of $794 million, a 34% increase year-on-year, driven by transformation efforts leading to a structurally stronger cost base and higher margins.

The company continues to focus on strategic initiatives, including the sale of assets in Colombia and the acquisition of Omega, enhancing its U.S. operations with significant synergies.

Cemex maintains a positive full-year EBITDA guidance, despite ongoing global uncertainties, with expectations of further operational efficiency and pricing adjustments to offset energy inflation.

Operational highlights include strong performance in Mexico with a 47% EBITDA growth and margin expansion, and resilient operations in EMEA and the U.S. despite adverse weather conditions.

Management highlighted the effectiveness of its energy hedging strategy, reducing exposure to volatility, and emphasized continued commitment to shareholder returns through increased dividends and share buybacks.

Full Transcript

Becky (Operator)

Good morning and welcome to the CEMEX first quarter 2026 conference call and webcast. My name is Becky and I will be your operator today. At this time, all participants are in a listen only mode. Later, we will conduct a question and answer session. If at any time you require operator assistance, please press star followed by zero and we’ll be happy to assist you. And now I will turn the conference over to Lucy Rodriguez, Chief Communications Officer. Please proceed.

Lucy Rodriguez (Chief Communications Officer)

Good morning and thank you for joining us for our first quarter 2026 conference call and webcast. We hope this call finds you well. I am joined today by Jaime Muguerza, our CEO, and by Maher Al-Hafar, our CFO. We will start our call with some brief comments on our current views on the immediate ramifications of the Iran war and then review our first quarter results followed by our expectations and guidance for full year 2026 and then we will be happy to take your questions in relation to the recent portfolio rebalancing transactions that we have announced. I would like to clarify the relevant accounting treatment with respect to the announcement of the sale of some of our operating assets in Colombia, which we expect to close by the end of the year as a partial sale of an operation. We will continue to fully consolidate these operations in our P&L until the transaction closes. In addition, we announced the purchase of Omega on February 26th and began consolidating the business as of April 1st. And now I will hand the call over to

Jaime Muguerza

thank you Lucy and good day to everyone. Before turning to our quarterly results, let me share a few thoughts on the global backdrop. I last spoke to you at our Analyst Day in late February, just two days before the Iran war began. First and foremost, our thoughts are with those affected by the war. We have colleagues, customers and partners in the region and our priority is and will continue to be ensuring their safety and well being. The war adds another layer of uncertainty to an already complex global environment. Once again, it reinforces the importance of focusing on what we control and those levers are working. Over the past several quarters, our transformation has delivered a structurally stronger cost base, higher margins and improved free cash flow generation positioning Cemex to navigate increased volatility well, to date we have seen limited direct impact from the war on our business. Our operations in Israel and the UAE together represent around 4% of consolidated EBITDA. While we experienced some temporary disruptions at the outset of the war, construction activity has largely normalized. The most relevant immediate exposure is energy, where we benefit from a comprehensive strategy that limits our risk to volatile markets. Approximately 60% of our total energy spend in 2025 has been hedged for 2026 through a combination of financial derivatives, yearly contracts and regulated pricing frameworks. Maher will go into more detail on this. In addition, operationally we have flexibility to adjust the fuels we use in our kilns, allowing us to switch between petcoke, natural gas, coal and alternative fuels when economically attractive. We also typically maintain two to three months of fossil fuel inventories across our network, further limiting short term sensitivity to market disruptions. Consequently, we believe our direct exposure to energy price volatility this year is significantly contained. We also have dusted off our Ukraine war playbook to help cushion us more medium term. We have already begun implementing fuel surcharges and are reviewing additional pricing increases for this year throughout the portfolio. The war is disrupting cement supply chains, making some import sources more expensive. We expect that over time this will increase pressure on U.S. cement importers, leading to relevant pricing opportunities in several U.S. markets. Finally, our transformation mindset has allowed us to identify additional structural savings and self help initiatives that should provide important support in an increasingly volatile environment. While we have a currency hedge in place to protect our leverage ratio, the Mexican Peso has been resilient and remains stronger than the FX assumption embedded in our 2026 EBITDA guidance. While volatility will persist with our approach to date on our strong first quarter performance, I remain confident in our ability to deliver our full year EBITDA guidance and with that let me turn to our results. I am very pleased with our first quarter results that continue to benefit from our transformation efforts. Record quarterly EBITDA of $794 million, a 34% increase serves as a great start to achieve our full year plan. EBITDA growth was broad based with Mexico, EMEA and South Central America and the Caribbean all delivering solid results. EBITDA margin expanded meaningfully with a more than 300 basis point increase year on year. Cost of sales and operating expenses as a percentage of sales improved significantly. Importantly, a large part of this margin gain is structural and sustainable driven by improved operating efficiency and a leaner cost base. These efforts were complemented by disciplined pricing and the benefit of operating leverage in some markets. As you know, through our regional review process we have identified a number of facilities that did not meet our return requirements. At the next day, we highlighted both the size of this opportunity and that it would take time to realize it. Since launching this effort in 2025, while not yet material in scope, we have already disposed of approximately 60 of these facilities. Free cash flow from operations grew at a multiple to EBITDA, increasing by about $300 million. The trailing twelve month conversion rate reached 51% after adjusting for severance and discontinued operations. Our Mexico operations delivered strong EBITDA growth and margin expansion with a recovery gaining traction and cement volumes posting year over year growth for the first time since mid 2024. During the quarter, Cemex was upgraded to AAA, the highest MSCI ESG rating, placing us among the leaders in our industry. This upgrade reflects our continued progress on sustainability and our commitment to decarbonize through value accretive levers. We continued advancing on our portfolio rebalancing during the quarter with the announced divestment of selected assets in Colombia in a transaction expected to close by year end. We also acquired Omega, a leading stucco and mortar player in the Western U.S. which offers significant synergies to our existing business and serves as an important foundation to expand this product line throughout the U.S. these transactions of course adhere to our new capital allocation framework. Regarding our commitment to bolster shareholder return, we repurchased approximately $100 million in shares during the quarter. In addition, at our annual shareholder meeting in March, the annual dividend was approved with an increase of almost 40%. In short, our quarterly results and activities reinforce a key point we are delivering on the commitments of our Project Cutting Edge plan we introduced a year ago centering on operational excellence and best in class shareholder returns. And there is more still to be done. We are actively working on dimensioning the next phase of our savings program and continued reorganization. I intend to share more detail on this in our second quarter earnings call. First quarter performance reflects a structurally stronger Cemex with a more resilient earnings profile and clear momentum heading into the rest of the year. Despite challenging weather in the US and EMEA, net sales grew 3% supported by higher consolidated prices and cement volume recovery in Mexico. But what really stands out is how effectively revenue growth translated into ebitda, EBIT and free cash flow generation. On a like to like basis, EBITDA increased 23% driven by operational efficiencies and pricing. EBIT, a key metric in our transformation, expanded 40%. Our free cash flow from operations increased by nearly $300 million and was positive in a quarter that has historically generated negative free cash flow due to our working capital cycle with a significant investment in the first half of the year. Adjusting for severance payments and discontinued operations, free cash flow from operations conversion rate reached 51% on a trailing 12 month basis, reflecting a structurally stronger cash Generation up from 31% a year ago. Additional project cutting edge savings and transformation initiatives coupled with operating leverage as volumes in our core markets, recovery should increasingly translate into higher margins and a stronger cash conversion. Adjusting for the effect of the one off gain from the sale of our operations in the Dominican Republic in 2025, first quarter net income would have almost doubled. at the consolidated level. Cement volumes reflect continued recovery in Mexico which along with improvement in South, Central America and the Caribbean as well as in the Middle east and Africa more than offset weather disruptions in the US and Europe. US volumes were impacted by adverse weather in the mid south and Texas. In aggregates, volumes benefited from our couch acquisition and our recently completed expansion projects which more than offset the weather impact in Europe. Volume performance also reflected difficult winter conditions throughout the portfolio which were further exacerbated by a prior year comparison base with very benign weather for the full year. Our consolidated volume guidance of low single digit growth across our three core products remains unchanged with only slight regional adjustments. With our focus on operational efficiency and available capacity, we remain well positioned to capitalize on the strong operating leverage in our business. As volumes recover, Consolidated prices across cement ready mix and aggregates increased at a low to mid single digit rate on a sequential basis supported by positive pricing dynamics in most of our markets. In Mexico cement prices rose 5% while in the US aggregates prices increased mid single digits. In Europe, mid single digit pricing gains were supported by the introduction of a carbon border adjustment mechanism together with tightening of free CO2 allowances under the EU ETS system. Our pricing strategy seeks to compensate for input cost inflation. With recent sudden moves in energy prices, we have moved to implement fuel surcharges in most markets as well as evaluating subsequent pricing increases to offset energy cost inflation. EBITDA in the quarter was supported by positive contributions across all levers. Importantly, nearly half of EBITDA growth came from self help initiatives, underscoring our focus on the things we can control, particularly in a volatile environment. Pricing and FX driven primarily by a large year over year peso rate differential were also important factors in EBITDA growth. Finally, organic growth in our core products and urbanization solutions portfolio also made an important contribution. EBITDA margin expanded by 3.3 percentage points reflecting a combination of the structurally lower costs, pricing discipline and operating leverage. A year ago I laid out the priorities of our transformation centered on operational excellence and best in class shareholder returns. Since then we have worked relentlessly to execute on our plan focusing on operational efficiency, elimination of overhead and enhanced free cash flow generation. We have clear evidence of progress in the quarter with $60 million in incremental recurring savings under Project Cutting Edge as well as improved EBITDA margins across our regions. Our efforts to reduce overhead along with our operating initiatives are paying off with important reduction in cost of goods sold and HGA as a percentage of sales. We still have more to deliver with an additional $105 million in savings expected during the rest of this year under our announced $400 million project cutting edge commitment. Importantly, three quarters of the savings relate to overhead reduction decisions taken last year. As I have mentioned, there are additional transformation opportunities we are identifying and you should expect that the $400 million in project cutting edge cost savings from 2025 to 2027 will be upsized when I address this in July. In March we announced the divestment of several assets in Colombia including cement operations and a portfolio of ready mixed concrete aggregates, mortars and admixtures for total proceeds of approximately $485 million. We are currently in discussions to divest related non operational assets in the country for around $70 million. We expect these transactions to close by the end of the year representing a combined multiple of 10 times 2025 EBITDA. In line with our strategy to grow our US business, we recycled a portion of the future proceeds into higher return opportunities in the US at the next day we announced the acquisition of Omega, the leading stucco producer in the Western US with the number one brand at A Post Energy multiple below seven times. The acquisition was completed on March 31st. This transaction is highly accretive with significant direct synergies driven by vertical integration as stuccos and mortars use cement, sand and admixtures as key raw materials. In fact, Omega’s cement requirements are equivalent to Those of approximately 8 average sized ready mix plants and it has already begun to direct the raw materials needs to Femex. In the first quarter. Direct synergies are expected to amount to close to 50% of Omega’s 2025 EBITDA of roughly $23 million. Beyond direct input synergies, the acquisition also unlocks cost efficiencies across procurement and R and D as well as cross selling opportunities through our existing customer base. With a free cash flow conversion rate of around 65%, Omega will enhance our overall cash generation and improve our earnings quality. More importantly, leveraging Omega’s expertise provides us with a strong platform from which to expand our mortars and stucco business in the U.S. consistent with our focus on adjacent high return growth opportunities. I would also like to take a moment to warmly welcome the Omega team to themx. We are excited to have you join us and look forward to learning from your solid capabilities, strong culture and market leadership as we build this platform together. And with that, back to you Lucy.

Lucy Rodriguez (Chief Communications Officer)

Thank you Jaime. Mexico delivered strong results supported by continued cement volume recovery, relevant operational efficiencies, pricing and operating leverage, reinforcing the momentum built over recent quarters. For the first time in six quarters year over year, cement volumes inflected positively as the government accelerated the rollout of their social programs. Demand to date has largely benefited from self construction and government backed social programs such as rural roads and housing supporting bagged cement volumes. The social housing program targeting 1.8 million units through 2030 is also ramping up. We are currently participating in the construction of approximately 120,000 units, double the level of fourth quarter and are in negotiations for an additional 110,000 more in infrastructure. While conditions remain relatively soft, activity on the ground is improving and our ready mixed backlog is trending higher. We are currently participating in the construction of relevant projects including the elevated viaduct in Tijuana and rail line projects such as Querétaro-Irapuato and Saltillo-Nuevo Laredo, with additional projects expected in the near term. Going forward, we expect the main drivers of growth to come from resilient housing demand and while timing remains difficult to pinpoint infrastructure activity, the market volume performance was also supported by a temporary market share gain as a few competitors experience outages in the central part of the country. In the quarter, EBITDA grew 47%, benefiting …

Full story available on Benzinga.com

This post was originally published here

POET Technologies Inc (NASDAQ:POET) shares are retreating on Thursday. This move follows a massive 75% rally earlier this week. The Nasdaq is down 0.33% while the S&P 500 has shed 0.08%.

Natural Pullback After Massive Rally

Traders are likely taking profits on Thursday. The stock surged after CFO Thomas Mika dismissed a Wolfpack Research report.

Mika called the bearish allegations a “big nothing burger.” He also confirmed a business relationship with Marvell Technology Inc (NASDAQ:MRVL).

Short Sellers Increase Pressure

Bearish bets against …

Full story available on Benzinga.com

This post was originally published here

Redwire Corp (NYSE:RDW) shares are trading lower on Thursday. This move follows a massive 15% surge on Wednesday.

The Nasdaq is down 0.32% while the S&P 500 has gained 0.09%.

Profit Taking After Massive Rally

The Thursday decline appears to be a standard price correction. Investors are likely locking in gains from Wednesday’s momentum.

On Wednesday, the stock hit a high of $11.27 behind heavy buying pressure.

The Commanders Marketing Partnership

The volatility stems from a new multi-year deal. Redwire is now the drone technology partner of the Washington Commanders, an American football team.

CEO Peter Cannito …

Full story available on Benzinga.com

This post was originally published here

Waste Connections (TSX:WCN) released first-quarter financial results and hosted an earnings call on Thursday. Read the complete transcript below.

Benzinga APIs provide real-time access to earnings call transcripts and financial data. Visit https://www.benzinga.com/apis/ to learn more.

Access the full call at https://events.q4inc.com/attendee/450269878

Summary

Waste Connections Inc. reported a strong start to 2026 with revenue of $2.371 billion, up 6.4% year-over-year, and an adjusted EBITDA margin of 32.5%, up 90 basis points excluding commodity impacts.

The company highlighted strategic investments in AI and human capital, contributing to improved pricing effectiveness and customer retention, and plans to continue M&A activity with a pipeline expected to close deals worth $100 million by early Q3.

Future guidance remains positive with high visibility for full-year core pricing at the high end of the 5-5.5% range, despite challenges such as higher fuel costs mitigated by hedges and surcharges.

Full Transcript

OPERATOR

Hello everyone. Thank you for joining us and welcome to the Waste Connections Inc. Q1 2026 earnings call. After today’s prepared remarks, we will host a question and answer session. If you would like to ask a question, please press star one to raise your hand. To withdraw your question, please press Star one again. I will now hand the conference over to Ron Mittelstadt, President and CEO. Please go ahead.

Ron Mittelstadt (President and CEO)

Thank you operator and good morning. I’d like to welcome everyone to this conference call to discuss our first quarter results. I am joined this morning by Marianne Whitney

Marianne Whitney (Chief Financial Officer)

Whitney, our CFO, as well as several other members of our senior management. As noted in our earnings release, we are are well positioned for 2026 following a strong start with upside potential from recent trends, we not only exceeded expectations for revenue and EBITDA, but delivered EBITDA margin of 32.5% up 90 basis points year over year excluding commodity impacts in spite of outsized weather impacts and in advance of recovering higher fuel costs against a volatile macroeconomic and geopolitical backdrop, our results reflect the durability of our model and consistency of execution as we continue to benefit from improved operating trends along with recent increase in commodities and special waste activity. Before we get into much more detail, let me turn the call over to Maryanne for our forward looking disclaimer and other housekeeping items. Thank you Ron and good morning. The discussion during today’s call includes forward looking statements made pursuant to the safe harbor provisions of the U.S. private Securities Litigation Reform act of 1995, including forward looking information within the meaning of applicable Canadian securities laws. Actual results could differ materially from those made in such forward looking statements due to various risks and uncertainties.

Ron Mittelstadt (President and CEO)

Factors that could cause actual results to differ are discussed in the cautionary statement included in our April 22 earnings release and in greater detail in Waste Connections filings with the U.S. Securities and Exchange Commission and the Securities Commissions or similar regulatory authorities in Canada. You should not place undue reliance on forward looking statements as there may be additional risks of which we are not presently aware or that we currently believe are immaterial which could have an adverse impact on our business. We make no commitment to revise or update any forward looking statements in order to reflect events or circumstances that may change. After today’s date on the call, we will discuss non GAAP measures such as adjusted EBITDA, adjusted net income on both a dollar basis and per diluted share, and adjusted free cash flow. Please refer to our earnings releases for a reconciliation of such non GAAP measures to the most comparable GAAP measures. Management uses certain non GAAP measures to evaluate and monitor the ongoing financial performance of our operations. Other companies may calculate these non GAAP measures differently. I will now turn the call back over to Ron. Thank you Marianne. On the strength of our business and consistent execution, 2026 is off to a great start with results exceeding expectations. Despite the volatility of the broader macro environment, we haven’t seen anything to date that doesn’t support our full year outlook

Marianne Whitney (Chief Financial Officer)

as provided in February. In fact, we believe we should be well positioned for incremental benefits both from external factors driving higher fuel and other commodities, and also as a result of our ongoing investments in human capital and AI which have broad implications for our operations along with continued M and a in Q1 we saw improving dynamics across our business, starting with better than expected solid waste pricing retention resulting in core price of 6%, providing visibility for the high end of our full year 2026 outlook of five to five and a half percent. Next, our landfill tons were slightly stronger than expected, offsetting the volume impacts from slowdowns and closures, related to severe winter weather which persisted in several markets, most notably in the Northeast. Landfill activity was led by higher special waste tons, up 8% year-over-year over year in Q1, the sixth consecutive quarter of improving special waste. Looking next at the aspects of our results related to crude oil prices and related volatility which are twofold. First, our E and P waste business where revenues increased sequentially and were up about 4% over a year on a like-for-like basis. We saw increases both in Canada on greater production oriented activity and higher pricing and in the US on drilling oriented activity, most notably in the Gulf. To date we haven’t seen a meaningful increase in recount or pickup in drilling activity which may be driven by sustained higher crude prices or long term supply disruptions and would be additive to the levels we are currently experiencing. Next fuel and related costs Spot Diesel in the US was up 12% year over year, including an increase of over 35% in March. That surge drove our internal fuel costs about 5 million above our expectations for Q1. Our exposure to the cost impacts is limited due to hedges we proactively put in place for over 45% of our expected diesel requirements for 2026. Additionally, in certain markets our pricing mechanisms allow for recovery of a portion of higher fuel related costs over time through surcharges which will step up in Q2 as a result of the incremental costs we have already absorbed. Based on what we have seen to date, we would expect to be largely insulated on an EBITDA basis over time from most of the effects of higher fuel costs between the benefit from any pickup in the NP waste activity, the impact of hedges and the recovery of higher diesel costs through surcharges, albeit with some lag in timing. Looking next at trends for other commodities, recycled commodity value stepped up sequentially in Q1 for the first time in seven quarters, led by improving values for fiber during the quarter. Although nominal, the increase is a positive indicator and landfill gas sales also stepped up sequentially in this case due to increased volumes unstable values for renewable energy credits or RINs. Moving next to operating trends, Q1 marked our 14th consecutive quarter of improvement in employee retention and the achievement of another milestone as voluntary turnover dropped to below 10%. We can’t overstate the value of human capital and as a differentiator and continue to see the benefits of lower turnover throughout our operations, from our record safety levels to increased employee engagement and ultimately customer retention Shifting to the subject of technology, our continued investment and focus on AI and our overall digital platform are showing promising results within pricing effectiveness, customer engagement and asset optimization. Specifically, our AI driven pricing tool has yielded approximately 20% improvement in customer retention and pricing effectiveness while maintaining our core pricing strength. We are encouraged by early results, knowing our analytics and capabilities will only get better as our technology advances further for the balance of 26 and into 2027, we are excited about our continued involvement with the field to expand our AI powered tools, reinforcing our commitment to our decentralized first model and value based approach to the business. These current and future tools will continue to expand our customer engagement and routing productivity with early indications suggesting strong returns on investment. Moving next to M and A, we continue to anticipate another outsized year of activity based on a robust and and building pipeline with high visibility and handful of deals. With aggregate annualized revenue of approximately 100 million expected to close by the end of Q2 or early Q3, we are on track for another above average M and A year. Most importantly, we remain disciplined in our approach to acquisitions and well positioned for implementing our growth strategy while also increasing return of capital to shareholders. To that end, on a year to date outlays of approximately 365 million, we’ve repurchased about 1% of shares outstanding. And finally, an update on our management of the ongoing elevated temperature landfill or ETLF event at Chiquita Canyon, our closed landfill in Southern California. We continue to make progress on mitigating the reaction which based on objective data collected to date is stable, controlled and decelerating. As noted previously, we have sought out the increased involvement and oversight of the US EPA in an effort to streamline the process. And finally, an update on our management of the ongoing elevated temperature landfill or ETLF event at Chiquita Canyon, our closed landfill in Southern California. We continue to make progress on mitigating the reaction which based on objective data collected to date is stable, controlled and decelerating. As noted previously, we have sought out the increased involvement and oversight of the US EPA in an effort to streamline the process. Over the past several weeks, the EPA has expanded its involvement at the facility which we welcome. To date, the EPA has weighed in and provided direction on two critical issues and we respect their expertise and experience which have facilitated the development of plans to resolve these matters. Consistent with our expectations, we continue to work with the EPA in a long term agreement which should provide even greater clarity. Once consummated, there is no change in our 2026 outlook for Chiquita, which reflects free cash flow impacts of 100 to 150 million. That said, we did adjust our accrual in Q1 to reflect the higher spending we saw in 2025, which was incorporated into our 2026 outlook. That said, we did adjust our accrual in Q1 to reflect the higher spending we saw in 2025 which was incorporated into our 2026 outlook. We look forward to being in a position to more formally reforecast the outlays for subsequent periods once we have a roadmap for moving forward still anticipated this year. Additionally, we continue to expect free cash flow impacts in 2027 will decline as compared to 2026 as previously communicated, and continue to step down in each year going forward. And now I’d like to pass the call to Maryann to review more in depth the financial highlights of the first quarter. I will then wrap up before heading into Q and A. Thank you ron in the first quarter, revenue of 2.371 billion exceeded our expectations and was up $143 million, or 6.4% year over year. Contributions from acquisitions net of divestitures totaled $55 million in the quarter. Organic growth in solid waste collection, transfer and disposal of 3.1% was led by 6% core price, which ranged from about 4% in our mostly exclusive market Western region to over 7% in our competitive markets. Total price of 5.9% included a reduction of about 10 basis points in fuel and material surcharges. Given the lag in recovery of higher costs. With over 75% of our price increases already in place or contractually provided for,

Ron Mittelstadt (President and CEO)

we have high visibility for full year 2026 core pricing at the high end of the range we provided or about 5.5% and given the recent step up in diesel costs, we would expect surcharges to increase accordingly, albeit with a lag driven not only by the mechanics of the surcharges but also due to advanced monthly or quarterly billing for some of our customers. As Ron noted, we have hedges in place for almost half of our diesel requirements and utilize surcharges in a portion of our markets. Yield of 4.7% reflects ongoing reductions in customer churn and implies solid waste volumes down about 1 1/2 percent, including up to about half a point attributable to outsized weather events that contributed to Q1 volume losses to varying degrees across all of our regions except the western region where volumes were up about 1.5%. Looking at year over year results in the first quarter on a same-store basis, roll-off pulls were down 1% on rates per pull up 3% and with the exception of our western region, polls were down in all regions. That said, we are encouraged by improving roll off trends especially given weather impacts as compared to Q4 year over year results. Polls were less negative by almost half a point and year over year rates per poll stepped up by 120 basis points. Landfill trends, while still mixed, are also encouraging. Total tons were up 4% on MSW, up 5% and special waste up 8%, partially offset by ongoing weakness in C&D down 5%. Increases in MSW tons were spread across our western Canadian and central regions while special waste activity was broad based driving increases in five of six of our geographic regions. Most noteworthy though was a 20% increase in special waste activity in our central region where the pickup in activity we noted in recent quarters had been lagging other markets and following up on Ron’s comments about improving commodity driven activity, recycled commodity revenues improved during Q1, led by an increase in old corrugated cardboard or occurring which averaged $89 per ton in Q1 and exited the quarter in line with the 2025 full year average price of $94 per ton. Additionally, our landfill gas sales increased sequentially as a result of contributions from one of our new RNG facilities currently in startup and also from higher natural gas prices which spiked in Q1 similar to last year. Values for renewable energy credits or RINs remain stable at about $2.40 following the EPA’s updates for renewable volume obligations. Adjusted EBITDA for Q1 is reconciled in our earnings release with $769.5 million up 8% year over year at 32.5% of revenue. Our adjusted EBITDA margin exceeded our expectations and was up 50 basis points year over year driven by 90 basis points. Underlying margin expansion by offset by about 40 basis points. Drag from commodities Outside solid waste margin expansion reflected improvement in several cost items reflecting favorable price cost spread dynamics led by strong pricing retention and magnified by benefits from employee retention and safety. These benefits were partially offset by higher fuel and related costs and finally adjusted free cash flow of 246 million was in line with our expectations and consistent with our full year outlook as provided in February of 1.4 to 1.45 billion. We were pleased to see Q1 capital expenditures (CapEx) outlays outpace last year’s slow start, largely as a result of more expeditious deliveries of fleet and equipment and faster progress on projects including our RNG facilities in development. Moving next to our balance sheet, we opportunistically access the public debt market with significant $600 million note offering in early March to further diversify funding sources following that highly successful offering and activities during the quarter including share repurchases. As noted by Ron, our debt outstanding of about $9.1 billion with a tenor of over eight years at an average interest rate of about 4% with about 80% of our debt fixed with liquidity of approximately $1 billion and quarter end net debt to EBITDA leverage of about 2.6x. We retain flexibility for acquisitions as well as returning capital to shareholders through additional repurchases and dividends. And now let me turn the call back over to Ron for some final remarks before Q and A. Okay, thank you Marianne. As we’ve said, 2026 is off to a great start and there are a number of factors working in our favor for the rest of the year. The strength of our results is a reflection of the projectability and and consistency that sets us apart regardless of the macroeconomic environment. Our industry leading results are also reminder of the importance we place on asset positioning and market selection, both of which are fundamental to our strategy and which we believe drive differentiation. Our results highlight the importance of discipline around capital allocation as well as the value of human capital and culture in driving results. These are the tenets that have guided Waste Connections approach since our founding over 28 years ago and which remain fundamental as we approach 10 billion in revenue very soon. To that end, we’re most grateful for

OPERATOR

the commitment of our 25,000 plus employees who live our values every day, putting safety first and making waste connections. Such a great place to work. We appreciate your time today. I will now turn this call over to the operator to open up the lines for your questions. Operator thanks Ron. We will now begin the question and answer session. Please limit yourself to one question and one follow up. If you would like to ask a question, please press Star one. To raise your hand to withdraw your question, please press Star one. Again, we ask that you pick up your handset when asking a question to allow for Optimum sound quality if want you. If you are muted locally, please remember to unmute your device. Please stand by while we compile the Q and A roster. Your first question comes from the line of Tyler Brown with Raymond James. Your line is open. Please go ahead.

Ron Mittelstadt (President and CEO)

Hey, good morning, Tyler. How are you? Hey, doing okay, Ron. Hey, Marianne. So I appreciate some of the comments on fuel, but I just want to make sure. Excuse me. That I’ve got it. So sorry for this, it’s kind of a multi part question. But number one, I just want to make sure that it’s clear that kind of over the course of the year you would expect fuel to be effectively a push from an EBITDA dollar perspective. But then two, if we assume where where fuel is and it stays where it is, we clearly need to contemplate higher surcharges and that will be dilutive on margins. So I assume that needs to be considered. Can you maybe size some of the dilution there? And then three, for my garbage bill, I believe I paid two months in advance. So we also need to consider that there is a lag on fuel recovery. So can you help us think about fuel dilution specifically in Q2? So I know there’s a lot there. I’m sorry about that. But just some more color on fuel. Sure, happy to address that. And there are a lot of moving parts.

Tyler Brown (Equity Analyst at Raymond James)

So here’s how I’d approach it. First of all, you have fuel impacts that are direct and indirect. And what we know is that the direct impacts are mitigated or impacted by first of all the hedges we have in place. So we’ve got hedged almost 50% of our fuel requirements. And then we get fuel surcharges in certain of our markets. And as you said, and as we said in the script, largely in terms of the dollar amounts of the impact from fuel, we, we can recover that over time through fuel surcharges. You use the term during the year. I just remind that since the spike started in March, it goes into next year. In terms of the recovery, to your point, there is a lag. The lag is driven by it’s twofold. One is the mechanism specified by whatever the what limits or provides for the surcharge. And then secondly, as you also pointed out, we advance bill customers on a quarterly or monthly basis. And so you can appreciate that when fuel ran in March, customers who we had billed in January, of course we couldn’t have recovered that. We hadn’t anticipated it. So it could take by example up until May to get that so then that brings you to the question of how quickly we recover. …

Full story available on Benzinga.com

This post was originally published here

As of April 23, 2026, two stocks in the real estate sector could be flashing a real warning to investors who value momentum as a key criteria in their trading decisions.

The RSI is a momentum indicator, which compares a stock’s strength on days when prices go up to its strength on days when prices go down. When compared to a stock’s price action, it can give traders a better sense of how a stock may perform in the short term. An asset is typically considered overbought when the RSI is above 70, according to Benzinga Pro.

Here’s the latest list of major overbought players in this sector.

Whitestone REIT (NYSE:WSR)

  • On April 9, Whitestone REIT announced it will be acquired by …

Full story available on Benzinga.com

This post was originally published here

Intel Corporation (NASDAQ:INTC) will release earnings for its first quarter after the closing bell on Thursday, April 23.

Analysts expect the Santa Clara, California-based company to report quarterly earnings of 1 cent per share, down from 13 cents per share in the year-ago period. The consensus estimate for Intel’s quarterly revenue is $12.37 billion (it reported $12.67 billion last year), according to Benzinga Pro.

The company has beaten analyst estimates for revenue in six straight quarters and in eight of the last 10 quarters overall.

Intel shares fell 1.5% to close at $65.27 on Wednesday.

Benzinga readers can access the latest analyst ratings on the Analyst Stock Ratings page. Readers can sort by stock ticker, company name, analyst firm, rating change or other variables.

Let’s have a look at how Benzinga’s most-accurate analysts …

Full story available on Benzinga.com

This post was originally published here

Editor’s note: The futures, ETFs data, earnings and headline were updated.

U.S. stock futures were mixed on Thursday following another record-breaking surge on Wednesday. Futures of major benchmark indices were trading mixed at the time of writing as peace efforts in the Iran war stalled amid seizures of vessels in the Strait of Hormuz.

On Wednesday, the Dow Jones index closed 341 points higher after President Donald Trump extended the ceasefire indefinitely, citing a “seriously fractured” government in Tehran.

Meanwhile, the 10-year Treasury bond yields stood at 4.313%, and the two-year bond was at 3.808% at the time of writing. The CME Group’s FedWatch tool‘s projections show markets pricing a 99.5% likelihood of the Federal Reserve leaving the current interest rates unchanged in April.

Index Performance (+/-)
Dow Jones -0.41%
S&P 500 -0.20%
Nasdaq 100 -0.15%
Russell 2000 0.12%

The SPDR S&P 500 ETF Trust (NYSE:SPY) and Invesco QQQ Trust ETF (NASDAQ:QQQ), which track the S&P 500 index and Nasdaq 100 index, respectively, were lower in pre-market on Thursday. The SPY was down 0.29% at 709.16, while the QQQ declined 0.32% to $653.03.

data-variant=”card”
data-news-mode=”manual”

>


Read Also:

Will S&P 500 Open Up Or Down On April 23? Here’s How Traders Lean After Record Session

This post was originally published here

Top Wall Street analysts changed their outlook on these top names. For a complete view of all analyst rating changes, including upgrades and downgrades, please see our analyst ratings page.

  • Susquehanna raised the price target for Hyatt Hotels Corporation (NYSE:H) from $150 to $185. Susquehanna analyst Christopher Stathoulopoulos maintained a Neutral rating. Hyatt Hotels shares closed at $165.44 on Wednesday. See how other analysts view this stock.
  • Truist Securities raised Synchrony Financial (NYSE:SYF) price target from $71 to $82. Truist Securities analyst Brian Foran maintained a Hold rating. Synchrony Financial shares closed at $78.69 on Wednesday. See how other analysts view this stock.
  • Rosenblatt slashed price target for Pegasystems Inc (NASDAQ:PEGA) from $62 to $58. Rosenblatt analyst Blair Abernethy maintained a Buy rating. Pegasystems shares closed at $37.48 on Wednesday. See how other analysts view this stock.
  • Morgan Stanley cut the price target for Hershey Co

Full story available on Benzinga.com

This post was originally published here

TAL Education (NYSE:TAL) held its fourth-quarter earnings conference call on Thursday. Below is the complete transcript from the call.

This transcript is brought to you by Benzinga APIs. For real-time access to our entire catalog, please visit https://www.benzinga.com/apis/ for a consultation.

Access the full call at https://event.choruscall.com/mediaframe/webcast.html?webcastid=Rt2sc3t1

Summary

TAL Education reported a significant year-over-year revenue increase of 31.5% in USD, reaching US$802.4 million in the fourth quarter of fiscal year 2026.

The company has expanded its learning services and content solutions, focusing on integrating technology to enhance user experience and engagement.

Profitability has improved with a non-GAAP net income of US$254.5 million for the quarter, highlighting efficient operations and a strong foundation for sustainable growth.

The learning device business achieved revenue growth, launching the X5 Ultra to enhance at-home learning with AI capabilities.

Future strategies include disciplined network expansion, leveraging AI, and maintaining operational efficiency to drive quality growth and profitability.

Full Transcript

OPERATOR

Ladies and gentlemen, good day and thank you for standing by. Welcome to TAL Education Group’s fourth quarter and fiscal year 2026 earnings conference call. All participants will be in a listen only mode. Should you need assistance, please signal a conference specialist by pressing the star key followed by zero. After today’s presentation, there will be an opportunity to ask questions. To ask a question, you may press Star then one on a touch tone phone. To withdraw your question, please press Star then two. Please be informed today’s conference is being recorded. I would like to hand the conference over to Ms. Fang Liu, Investor Relations Director. Thank you. Please go ahead.

Fang Liu (Investor Relations Director)

Thank you all for joining us today for TAL Education Group fourth quarter and fiscal year 2026 earnings conference call. The earnings release was distributed earlier today and you may find a copy on the company’s IR website or through the news wires. During this call you will hear from Mr. Alex Peng, President and Chief Financial Officer, and Ms. Jackson Ding, Deputy Chief Financial Officer. Following the prepared remarks, Mr. Peng and Ms. Ding will be available to answer your questions. Before we continue, please note that today’s discussions will contain forward looking statements made under the safe harbor provisions of the U.S. private Securities Litigation Reform act of 1995. Forward looking statements are subject to risks and uncertainties that may cause actual results to differ materially from our current expectations. Potential risks and uncertainties include, but are not limited to, those outlined in our public filings with the SEC. For more information about these risks and uncertainties, please refer to our filings with the SEC. Also, our earnings release and this call include discussions of certain non GAAP financial measures. Please refer to our earnings release which contains a reconciliation of the non GAAP measures to the most directly comparable GAAP measures. I would like to turn the call over to Mr. Alex Peng. Alex, please go ahead.

Alex Peng (President and Chief Financial Officer)

Thank you Fang Liu and thanks to all of you for joining today’s conference call. As we reflect on fiscal year 2026, it is worth stepping back to consider the progress we’ve made over the past several years. That progress has been built on more than two decades of experience in education, along with continued investment in our capabilities and innovation. Together, these efforts have enabled us to continuously refine our offerings and better serve the evolving needs of students and society. So, with that context in mind, let me now turn to our Learning Services business. Learning Services Business remains our largest revenue contributor. We are committed to delivering quality learning service experiences to our user base. We’re also building our Content Solutions business, including learning devices. These products significantly extend the accessibility and customer reach of our proprietary and third party content. They work alongside our learning services to create a more integrated learning experience, driving longer, deeper and stronger user engagement. Beyond our domestic operations, we also expanded into select international markets leveraging our R and D capabilities and operational know how to serve educational needs globally. While our businesses are at different stages of maturity, we are beginning to see meaningful improvement in company level profitability. This underscores our ability to optimize core operations and build a more efficient operating model, further strengthening our foundation for sustainable growth and long term value creation. So with that overview, let me walk you through our business Progress for the fourth fiscal quarter and full year 2026. Our offline PAYO enrichment programs demonstrated continued year over year growth in both the fourth quarter and the full fiscal year. Throughout the past year, we maintained a disciplined and consistent approach to expanding our offline learning center network with a strong focus on service quality, operational health and sustainable growth. Our expansion decisions are guided by a holistic assessment of factors including local market demand, receptivity to our offerings, our operational capabilities and our commitment to maintaining high service quality. This approach supported solid growth and healthy operating performance throughout fiscal year 2026 in our online enrichment learning business. We continue to enhance user experience and service quality through technology. During the fourth quarter and throughout fiscal year 2026, we upgraded key products with richer content and technology enabled features creating a more engaging learning experience. Together, these efforts strengthened the value proposition of our online enrichment offerings and supported sustained user growth and user engagement over time. Our learning device business achieved year over year revenue growth this quarter. In the last couple of quarters, this business has transitioned from its rapid expansion phase toward more moderate growth. We believe product quality and go to market capabilities will be critical to this business long term success. In March 2026 we introduced the X5 Ultra Classic, a device incorporating enriched content and upgraded AI capabilities. With the X5 Ultra now integrated into our learning devices port portfolio, we are positioned to address a broader spectrum of at home self directed learning needs as we expand our install base. Our key user engagement metrics remain Strong with around 80% weekly active users and an average daily active usage time of about one hour per device. This allows us to serve customers beyond our physical presence and enhance at home engagement. Next, let me turn to our financial performance for the quarter. In the fourth quarter our net revenues were US$802.4 million or 5,590,000,000 RMB, representing a year over year increase of 31.5% and 25.8% in US dollar and RMB terms respectively. Our non GAAP income from operations was US$82.2 million and non GAAP net income attributable to CAL reached US$254.5 million for the quarter. I will now hand the call over to Jackson who will provide an update on the operational developments across our four business lines and a review of our financial results for the fiscal fourth quarter. Jackson over to you.

Jackson Ding (Deputy Chief Financial Officer)

Thank you Alex. I am pleased to update you on our progress during the fourth fiscal quarter and full year across all core business lines. Our PAYO Small Cost Enrichment programs continued its operational momentum during this quarter. As we grow, we continue to uphold our service quality and operational efficiency in terms of physical footprint. We expanded our learning center network at a measured pace. Our operational discipline is reflected in our key performance indicators, with PAYO small cost maintaining a generally stable retention rate of around 80% across fiscal year 2026 with certain quarters exceeding that level. Turning to our online enrichment learning business, we continue to leverage technology to enhance the student learning experience. A core focus remains deepening student engagement to drive meaningful learning outcome. To that end, we have driven engagement through interactive formats such as immersive online classrooms and role playing activities. By offering both offline and online enrichment programs, we aim to address the evolving needs of students and support their holistic development. Next Our learning devices business delivered year over year growth in the fourth quarter as well as the full fiscal year. This reflects our progress in product development and go to market execution. Over the past year. We have also broadened our content library and incorporated AI driven features to support a more engaging and effective self directed learning experience. As Alex mentioned, last month we launched the X5 Ultra. This device expands our pricing points while offering more content, a unified learning interface and improved AI tools, among them the upgraded AI thinke 101 Turing feature. To complement these upgrades, we’ve also improved the hardware. The X5 Ultra includes a faster processor and a 13.2-inch eye comfort display, ensuring solid performance across different learning activities. While technology itself is important, we believe the true value lies in how it integrates curriculum aligned content, scenario based AI and seamless hardware into a cohesive learning system, one that is intended to be more intuitive and practical for students. By organizing fragmented learning materials and …

Full story available on Benzinga.com

This post was originally published here

Boston Scientific Corporation (NYSE:BSX) reported upbeat earnings for the first quarter on Wednesday.

The company posted first-quarter 2026 revenues of $5.20 billion on Wednesday, slightly better than the consensus estimate of $5.17 billion, beating the management guidance of $5.22 billion-$5.31 billion.

The medical technology giant reported adjusted earnings of 80 cents, beating the consensus of 79 cents and the management guidance of 78-80 cents.

The company lowered its fiscal 2026 adjusted earnings per share guidance from $3.43-$3.49 to $3.34-$3.41, below the Wall Street estimate of $3.45.

Boston Scientific forecasts net sales growth of approximately 7%-8.5% (prior 10.5%-11.5%) in 2026 on a reported basis, and 6.5%-8% (prior 10%-11%) organically. The company also lowered 2026 sales guidance from …

Full story available on Benzinga.com

This post was originally published here

Altisource Portfolio (NASDAQ:ASPS) reported first-quarter financial results on Thursday. The transcript from the company’s first-quarter earnings call has been provided below.

This transcript is brought to you by Benzinga APIs. For real-time access to our entire catalog, please visit https://www.benzinga.com/apis/ for a consultation.

Access the full call at https://edge.media-server.com/mmc/p/vqj9ai3i/

Summary

Altisource Portfolio reported a strong start to 2026 with a 10% increase in service revenue, driven by 71% growth in the origination segment, despite a 5% decline in the servicer and real estate segment.

The company achieved a significant turnaround with a pre-tax GAAP income of $400,000 compared to a $4.5 million loss in the first quarter of 2025, attributed to lower interest expenses and debt-related costs.

Altisource Portfolio’s Hubzu inventory surged to over 18,800 assets, positioning the company for further revenue growth, and the management anticipates continued positive cash flow for the year, supported by both business segments.

Full Transcript

OPERATOR

Good day and thank you for standing by. Welcome to the Altisource Portfolio Solutions first quarter 2026 earnings call. At this time, all participants are in a listen only mode. After the speaker’s presentation, there will be a question and answer session. To ask a question during the session, you’ll need to press Star one one on your telephone. You will then hear an automated message advising your hand is raised to withdraw your question, please press Star one one again. Please be advised that this conference is being recorded. I would now like to introduce your speaker for today, Michelle Esterman, Chief Financial Officer. Please go ahead.

Michelle Esterman (Chief Financial Officer)

Thank you operator we first want to remind you that the Earnings Release and Quarterly slides are available on our website at www.altisource.com. These provide additional information investors may find useful. Our remarks today include forward looking statements which include a number of risks and uncertainties that could cause actual results to differ. Please review the Forward Looking Statements sections in the Company’s Earnings Release and Quarterly slides as well as the risk factors contained in our 2025 Form 10K. These describe some factors that may lead to different results. We undertake no obligation to update statements, financial scenarios and projections previously provided or provided herein as a result of a change in circumstances, new information or future events. During this call, we will present both GAAP and non GAAP financial measures in our earnings release and quarterly slides. You will find additional disclosures regarding the non GAAP measures. A reconciliation of GAAP to non GAAP measures is included in the appendix to the Quarterly slides. Joining me for today’s call is Bill Sheppard, our Chairman and Chief Executive Officer. I will now turn the call over to Bill.

Bill Sheppard (Chairman and Chief Executive Officer)

Thanks Michelle and good morning. I’ll begin on slide four. We’re off to a strong start this year. For the quarter we grew service revenue and pre tax GAAP earnings compared to the first quarter of 2025 from sales wins and lower debt related interest and transaction costs. More importantly, we are seeing strength in both business segments. The origination segment’s first quarter service revenue and EBITDA growth compared to last year accelerated from sales wins and a stronger origination market. The servicer and real estate segment is positioned extremely well with Hubzu inventory at 17,200 homes as of the end of the first quarter and exciting first quarter sales wins in the title and foreclosure trustee businesses. We anticipate this momentum to continue as the year progresses. Turning to slide 5, for the first quarter we generated service revenue of 45.1 million, a 10% increase over the first quarter of 2025. This was driven by 71% growth in service revenue in our origination segment primarily from sales wins in our lenders one business origination segment revenue growth is partially offset by a 5% revenue decline in our servicer and real estate segment primarily from a one time 2025 pricing adjustment benefit in our foreclosure trustee business. Total company adjusted EBITDA declined by $800,000 due to revenue mix including higher revenue in the lower margin origination segment, lower revenue in the servicer and real estate segment and modestly higher corporate costs. Moving to slide 6, the company generated first quarter pre …

Full story available on Benzinga.com

This post was originally published here

Dow (NYSE:DOW) released first-quarter financial results and hosted an earnings call on Thursday. Read the complete transcript below.

This transcript is brought to you by Benzinga APIs. For real-time access to our entire catalog, please visit https://www.benzinga.com/apis/ for a consultation.

The full earnings call is available at https://events.q4inc.com/attendee/893685223#xd_co_f=ZTcwNWM0NWEtZmRkZS00ZGE4LTk0ZjMtOTAyNjViNzA4NGZm~

Summary

Dow reported first quarter net sales of $9.8 billion and operating EBITDA of $873 million, alongside $193 million in cost savings.

Future guidance includes expected second quarter revenue of $12 billion and EBITDA of $2 billion, driven by pricing gains and increased asset utilization.

Strategic initiatives focus on Transform to Outperform and self-help actions, with expectations of $2 billion in near-term EBITDA improvement.

Operational highlights include a 3% sequential volume growth and the completion of a turnaround in the US Gulf Coast, as well as progress on the Alberta project and European asset shutdowns.

Management is confident in the company’s ability to navigate market volatility, citing Dow’s cost advantage and agility, and announced leadership changes with Karen S. Carter set to become CEO in July.

Full Transcript

OPERATOR

Greetings and welcome to the Dow first quarter 2026 earnings conference call. At this time, all participants are in a listen only mode. A brief question and answer session will follow the formal presentation. If you’d like to ask a question at that time, please press STAR followed by the number one on your telephone keypad. As a reminder, this conference call is being recorded. I’ll now turn it over to Dow Investor Relations Vice President Andrew Ryker. Mr. Riker, you may begin.

Andrew Ryker

Good morning. Thank you for joining today. The accompanying slides are provided through this webcast and posted on our website. I’m Andrew Riker, Dow’s Investor Relations Vice President. Leading today’s call are Jim Fitterling, Chair and Chief Executive Officer Karen S. Carter, Chief Operating Officer and Jeff Tate, Chief Financial Officer. Please note our comments contain forward looking statements and are subject to the related cautionary statement contained in the earnings News release and slides. Please refer to our public filings for further information about principal risks and uncertainties. Unless otherwise specified, all financials, where applicable, excludes significant items. We will also refer to non GAAP measures. A reconciliation of the most directly comparable GAAP financial measure and other associated disclosures are contained in the earnings news release that is posted on our website. On Slide two is our agenda for today’s call. Jim and Karen will start with a summary of our first quarter performance, including details on each of our three operating segments. Karen will then provide an update on current industry dynamics, including how global supply disruptions are influencing market conditions. She will also discuss Dow’s competitive advantages, particularly our purpose built asset footprint and advantaged feedstock positions. We will then outline several actions underway to deliver a step change improvement in earnings across the cycle, including progress on Transform to Outperform and our other self help initiatives. Jeff will close with our outlook for the second quarter in an overview of our capital allocation priorities and focus areas for disciplined financial management both in 2026 and across the cycle. Following the prepared remarks, we’ll open the call for Q and A. Now let me turn the call over to Jim.

Jim Fitterling (Chair and Chief Executive Officer)

Thank you Andrew. I’d like to first take a moment to step back and recognize our colleagues, neighbors, customers and partners in the Middle east who are facing significant turmoil and uncertainty. Our thoughts are with everyone affected by this conflict and we wish for their safety and well being during these difficult times. On slide 3, I’ll now cover additional details from the first quarter. The solid results we delivered reflect our commitment to controlling what we can control. While January and February order books were solid, we experienced a sharp positive inflection in March with the beginning of the conflict in the Middle east, we expect this supply disruption will persist throughout 2026. During this quarter, we focused on Dow’s strengths of prioritizing our customers, managing costs aggressively and operating with safety, reliability and long term value creation. We delivered 3% sequential volume growth, net sales of $9.8 billion and operating EBITDA of $873 million and with our self help actions well underway, we delivered approximately $193 million in period cost savings. As we look ahead to the second quarter and beyond, we are taking actions to enhance Dow’s agility and resilience. We’re also entering a seasonally high demand period, providing additional tailwinds as we move through the next couple of quarters. In addition, an increasingly positive margin backdrop continues to unfold and we expect the pricing momentum that began in March to continue across every business and every region in Dow’s portfolio. On the supply side, the conflict in the Middle east has created constraints that are clearly evident in the near term. This includes supply chain disruption for an extended period of time. We also anticipate impact to future investments, including potential delays or cancellations of planned industry capacity additions as well as increased pressure for capacity rationalization. And lastly, we expect that the higher global oil and naphtha prices will steepen the global cost curve. Against this backdrop, our in flight actions serve to further strengthen Dow’s competitiveness and position us to drive margin improvement and capture earnings upside. First, our incremental growth investments are delivering returns like our New World Scale Polyethylene train in Freeport, Texas. And we’re making progress on our Alberta project where the overarching merits of this investment in the cost advantaged Americas are further reinforced by the current global dynamics. In addition, the benefits from our previously announced European asset shutdowns begin this year. And lastly, we are building a Dow that is more agile and resilient through any cycle, a company that delivers through periods of volatility and one that focuses on capturing upside, improving margins and outperforming our peers to effectively reset the competitive benchmark. We’ll share more details on all of this later in the call and Karen is going to cover our first quarter operating segment performance. But before that, I’d like to briefly address our recent leadership announcement. Effective July 1, Karen will assume the role of Chief Executive Officer and I will move to the role of Executive Chair. This announcement follows a deliberate multi year succession process in partnership with our board and ensures continuity as we execute our strategy. Serving as CEO of Dow has been the privilege of a lifetime and I’m incredibly proud of what our team has accomplished together. This transition comes at the right time as we transform our company for its next phase of growth. I have full confidence in Karen’s leadership, her deep operational experience and her ability to drive performance and and value creation. As CEO, she will continue our efforts to transform Dow, positioning us for greater agility and resiliency through any phase of the cycle. She is exactly the right leader to guide our company and deliver on our strategic priorities with discipline and rigor.

Karen S. Carter (Chief Operating Officer)

Thank you Jim and good morning to everyone joining today, I’m honored to step into the role of CEO of dow. Having spent my entire career with the company, I have a deep appreciation for our people, our innovation capabilities and the critical role we play in enabling our customers growth. As we look ahead, our priorities remain consistent. We will continue to drive operational excellence, maintain disciplined capital allocation and advance high value growth in our core markets. Dow is well positioned with our advantaged global portfolio and a strong balance sheet and a talented global team. My focus will be on driving execution, delivering value for our customers and ensuring consistent long term value for our shareholders. I’m excited about the opportunities ahead and confident in our ability to continue to deliver for all stakeholders. Turning now to our first quarter results by segment as Jim mentioned, Team Dow remains focused on disciplined execution in every business throughout the first quarter. As the situation in the Middle east unfolded in March, we continue to manage costs and cash tightly while also prioritizing our customers. We delivered solid results in January and February and then dynamics in the Middle east quickly impacted industry supply demand conditions. In fact, our operations outside the region continue experienced the largest percent sales gain from February to March that we’ve seen in our company’s history. Our teams remain focused on balancing near term dynamics with discipline while also progressing our long term objectives and this agility continues to be a key differentiator for Dow and packaging and specialty plastics. On slide 4, first quarter net sales were $4.9 billion reflecting price declines versus the same period last year. Polyethylene volumes increased in all regions both versus the prior year and last quarter, supported by continued global growth in flexible food and specialty packaging applications. Polyethylene volume gains were offset by lower merchant olefins sales following a turnaround in the US Gulf coast and lower licensing revenue. With safety and reliability at the forefront of our priorities, this turnaround is now complete, the unit is fully operational and our team is shifting their focus to completing our second cracker turnaround for the year which is planned for the second quarter operating EBIT was $208 million, driven by lower integrated margins and higher planned maintenance activity. This was partly offset by higher polyethylene volumes as well as tailwinds from the company’s cost reduction efforts. Looking ahead, our significant Americas footprint, including our new Poly 7 asset, will enable our teams to capture improved margins. Next, turning to our industrial, intermediate and infrastructure segment on slide five, net sales were $2.6 billion down 8% year over year. This was largely due to lower prices in both businesses as well as lower volumes and polyurethanes as a result of impacts from the Middle east conflict. Our proactive cost savings actions in both businesses provided tailwinds that offset some of the decline. Volume declined in the quarter as well, primarily due to our actions to reset our competitiveness by shutting down our higher cost upstream propylene oxide asset late last year. As a reminder, this action rationalized approximately 20% of North American PO industry capacity and while we are experiencing a prolonged weak demand landscape across building and construction, our new alcoxylation assets are driving growth in industrial solutions which serve attractive end markets such as home care, pharma and energy. Moving to the performance, materials and coatings segment on slide 6, net sales were $2.1 billion which is flat compared to the same period last year with higher volumes in both businesses. Volume increased 2% year over year, largely in downstream silicones, particularly in electronic and and home and personal care. In markets. Notably, downstream silicones continue to be a growth engine for the business, delivering high single digit volume improvement versus last quarter. The business remains focused on advancing our multi year asset and market strategy which will help us grow with key customers. The strategy includes shifting our mix towards higher value products in markets like electronics and mobility while right sizing higher cost upstream capacity and this work is further advanced by our previously announced European asset actions including the shutdown of our Basics Siloxanes plant in Barrett, UK by the middle of this year. This capacity represents approximately 25% of European siloxane industry capacity. Next on slide seven, I’ll take a step back to frame further details on the current macroeconomic environment. The headline is Demand across many markets is steady. At the same time supply is short and arbitrage is increasing. On the demand side for our core polyethylene packaging markets, conditions remain resilient, but we are seeing mixed signals in other key markets that Dow serves. For example, in the US inflationary pressures and higher interest rates are still weighing on existing home sales. This continues to be reflected in our industrial intermediates and infrastructure and performance materials and coating segments, both of which serve the building and construction market. Consumer spending has shown some modest improvement, but the landscape and behaviors are likely to remain cautious until we see a significant inflection in macroeconomic conditions. Moving to supply dynamics, we anticipate that shutdowns, feedstock limitations, and logistical constraints will continue to reshape polyethylene product availability across regions. These conditions are creating ripple effects well beyond the Middle east, including significant impacts to logistics costs and transit times. Supply and feedstocks into Asia and Europe are constrained, which is triggering price increases globally. It is also leading to increased production in the Americas and is providing Dow the opportunity to capture new business in Europe. The duration and severity of these constraints increases the likelihood of lasting industry impacts, including the potential for accelerated capacity rationalization as well as delays or cancellation of planned capacity additions. In this context, expectations for higher US Supply are helping to ease some of the pressure and provide stability. North American LNG markets remain well supplied and regionally insulated from these disruptions. In addition, US Gulf Coast NGOs, including Ethane, continue to be largely unimpacted. All of these factors underscore the benefits of Dow’s cost advantage footprint in the Americas. Next, on slide 8, we’ll unpack some of the current regional and industry impacts in more detail. In the two months since the conflict began, the scale of disruption we have seen is unprecedented. Roughly 20% of global oil capacity is currently offline, and approximately half of global ethylene and polyethylene supply is either offline, constrained, or directly impacted. These are unparalleled numbers, reflecting a combination of physical infrastructure damage, feedstock limitations, and severe logistics disruptions. Transit through the region remains significantly impaired, largely driven by the ongoing disruption in the Strait of Hormuz, and the disruption has been amplified across Asia and Europe, tightening feedstock availability and pushing producers to reduce production or increase prices to cover the rapidly escalating costs occurring from the conflict. Looking across regions, a large portion of Middle east capacity remains offline, with increasing risk of lasting infrastructure damage. In Asia Pacific, feedstock constraints are limiting operating rates and reducing export availability, challenging producers who are operating at uncompetitive levels. And in Europe, high costs will require continued price increases to justify additional production. In contrast, the Americas continue to operate at high rates, highlighting the importance of Dow’s cost and feedstock advantages in the region. Currently, it is estimated that roughly three quarters of announced global capacity additions would be either directly impacted by the conflict or dependent on supply chains that remain highly constrained. The longer these conditions persist, the greater the potential for further industry changes. And lastly, it is not likely that the pricing impact of these events will be temporary. We expect rising global production costs and a steepening global cost curve to continue influencing pricing and spread. Next I’ll turn to slide 9 where we will discuss how Dow Specific Advantages drive Near term value at the beginning of the Middle east conflict, petrochemical prices, especially polyethylene, were at multi year unsustainable lows. Despite broader near term market volatility, we anticipate packaging demand will remain resilient providing meaningful pricing potential as evidenced by recent March settlements. That brings me to our advantaged global asset footprint. Dow operates a large portion of our light cracking capacity in the cost advantaged Americas with assets in the US Canada and Argentina, all of which continue to operate at high rates. Our consistent focus on investing in the Americas gives us reliability, feedstock security and cost stability at a time when global supply chains are strained. In Europe, our feedstock flexibility remains a critical differentiator. With NAFTA supplies impaired and PRONAF spreads increasing, Dow’s ability to optimize across feedstocks provides a clear cost and availability advantage versus peers. This allows us to …

Full story available on Benzinga.com

This post was originally published here

On Thursday, CenterPoint Energy (NYSE:CNP) discussed first-quarter financial results during its earnings call. The full transcript is provided below.

This transcript is brought to you by Benzinga APIs. For real-time access to our entire catalog, please visit https://www.benzinga.com/apis/ for a consultation.

Access the full call at https://edge.media-server.com/mmc/p/6z8cbm3c/

Summary

CenterPoint Energy reported a strong first quarter of 2026 with non-GAAP EPS of $0.56, exceeding GAAP EPS of $0.48.

The company reaffirmed its full-year 2026 non-GAAP EPS guidance of $1.89 to $1.91, representing an 8% growth over 2025.

Significant growth is expected in the Houston Electric segment with a firmly committed load forecast increased to 12.2 gigawatts by 2029.

CenterPoint Energy plans to invest $6.8 billion in 2026 and has de-risked its financing plan, completing 70% of its financing needs.

Advanced manufacturing and data centers are key contributors to load growth, supporting affordability and potentially reducing customer bills.

A major project in Indiana could bring $250 million in savings for customers over 15 years, enhancing affordability and economic growth.

The company expects to finalize a refresh load study to inform future transmission planning by the second half of 2026.

Management remains optimistic about long-term growth, targeting EPS growth at the mid to high end of a 7-9% range annually through 2035.

Full Transcript

OPERATOR

Good morning and welcome to CenterPoint Energy’s first quarter 2026 earnings conference call with senior management. During the Company’s prepared remarks, all participants will be in a listen only mode. There will be a question and answer session after Management’s remarks. To ask a question, please press star 11 on your touch phone keypad. I will now turn the call over to Ben Vallejo, Vice President of Investigations and Corporate Planning. Please go ahead

Ben Vallejo (Vice President of Investigations and Corporate Planning)

Good morning and welcome to CenterPoint’s Q1 2026 earnings conference call. Jason Wells, our Chair and CEO, and Chris Foster, our CFO will discuss the company’s first quarter 2026 results. Management will discuss certain topics that will contain projections and other forward looking information and statements that are based on management’s beliefs, assumptions and information currently available to management. These forward looking statements are subject to risks and uncertainties. Actual results could differ materially based on various factors. As noted in our Form 10Q other SEC filings and our earnings materials, we undertake no obligation to revise or update publicly any forward looking statement other than as required under applicable securities laws. We reported $0.48 per diluted share for the first quarter of 2026 on a GAAP basis. Management will be discussing certain non GAAP measures on today’s call when providing guidance. We use the non GAAP EPS measure of diluted adjusted earnings per share on a consolidated basis referred to as non-GAAP EPS. For information on our guidance methodology and reconciliation of the non GAAP measures used in providing guidance, please refer to our earnings news release and presentation on our website. We use our website to announce material information. This call is being recorded. Information on how to access the replay can be found on our website. Now I’d like to turn it over to Jason.

Jason Wells (Chair and CEO)

Thank you Ben and good morning everyone. On today’s call, I’d like to address four key areas of focus for the quarter. First, I’ll walk through our strong first quarter financial results. Second, I’ll provide an update on our load outlook for Houston Electric, including yet another significant increase in our firmly committed load forecast to 12.2 gigawatts of new industrial load. Third, I will cover how our continued and accelerating growth in the Greater Houston area can provide incremental capital investment opportunities and further support customer affordability. And lastly, I’ll touch on our growing optimism for transformational load growth opportunities for our Indiana Electric Service territory which would similarly provide for incremental capital investment and support customer affordability. I will start with our strong first quarter financial results. This morning we reported non GAAP EPS of 56 cents for the first quarter of 2026. Chris will walk through the details of these results, but I want to highlight that our execution through the first quarter positions U.S. well for the remainder of the year. With that said, we are reiterating our full year 2026 non GAAP EPS guidance of $1.89 to $1.91, which at the midpoint would represent 8% growth over actual 2025 delivered results. As a reminder, we rebase our long term earnings guidance from each year’s actual results. This approach provides our investors with the direct benefit from compounding effect of the earnings we have consistently delivered. In addition, this approach helps contribute to the durability of our earnings profile, underscoring our commitment to delivering value through disciplined execution and sustained growth each and every year. Over the long term, we continue to expect to grow non GAAP EPS at the mid to high end of our 7 to 9% annual guidance range through 2028 and 7 to 9% annually thereafter through 2035. I would now like to provide an update on the accelerating growth our Houston Electric business continues to experience and our strong execution which enables us to take advantage of the growth in the near term. As we shared on the fourth quarter call, we have meaningfully accelerated our load growth outlook, bringing forward our forecast for a 50% increase in peak demand by a full two years. Our conviction in that accelerating timeline was grounded in seven and a half gigawatts, a firmly committed load that we expected to be energized by 2029, including 2 1/2 gigawatts that was already under construction as of our last update. Since then, we have made significant progress in executing against our prior forecast while adding additional customers. As a result, we now have clear line of sight to 12.2 gigawatts of firmly committed load with the team’s disciplined execution. We have already secured ERCOT approval for 3.2 gigawatts of this load. Two and a half gigawatts was approved since our last earnings call alone and within less than 80 days of filing for approval. We expect to submit the remaining 9 gigawatts of projects to ERCOT for approval within the next few weeks. Importantly, this firmly committed load is highly diversified, spanning more than a dozen unique customers across nearly 20 distinct projects. We believe these projects are manageable in size with 90% representing half a gigawatt of demand or less. That, along with our utilization of existing capacity and our customer selection of project sites near substations, allows for quick and efficient interconnections. Our focused Execution over the last few months has also provided us with a clear path to energization. Notably, we are positioned to energize approximately 8 gigawatts of this firmly committed load by 2029, which is 80% of our 10 gigawatt increase we originally forecasted to be energized by the end of 2031. This diversified growth and economic development has another key benefit to the Greater Houston area, which helps us keep electricity delivery charges affordable. The Greater Houston area is no longer an emerging destination to site new data centers. It is now firmly established as a location of choice for some of the world’s largest hyperscalers and developers. However, this is only one facet of Houston’s multidimensional growth. The region’s growth is being propelled by significant investments in life sciences, energy, energy exports and advanced manufacturing. With this growth comes new jobs and an influx of new residents which has fueled the 2% annual residential growth the area has experienced for the last few decades. The expansion of the economy and increase in population have significant affordability benefits for our customers. Notably, we expect that utilizing 10 gigawatts of existing system capacity could provide approximately $4 billion in aggregate savings for Texas residential and commercial customers over the next 10 years, supporting affordability and creating headroom for future customer driven investments. This affordability profile is one that very few areas in the country can offer as our charges are 11% below the national average and the lowest in ERCOT. Looking ahead, we believe this growth will continue for years to come, requiring the further expansion of our system to support growth beyond the near term. We are making steady progress on a refresh load study that will inform our transmission planning process and we expect to complete the study later this year in Indiana. We are increasingly confident in our ability to secure potentially transformational opportunities to support local economic growth and address affordability. We continue to make considerable progress in our conversations with a large load customer on a project that would represent our single largest load in our Southern Indiana service territory with substantial upside for additional growth. Beyond the significant economic development benefits this opportunity would bring to the local community, it represents a powerful lever to enhance affordability for our customers. We estimate that this initial incremental load could enable $250 million in savings for residential customers over 15 years, meaningfully reducing customer bills with the opportunity for even greater savings as potential upside for growth materializes. In closing, we continue to believe we have one of the most tangible and executable long term growth plans in the industry. We are uniquely positioned to move at the speed of business to execute on near term customer driven opportunities while also delivering our service affordably. We are laser focused on making longer term investments to enhance growth across all of our service territories while also improving customer outcomes. With that, I’ll turn it over to Chris to cover their financials in more detail.

Chris Foster (Chief Financial Officer)

Thanks Jason. This morning I will cover four areas of focus. First, the details of our strong first quarter financial results and how they position us for the rest of the year. Second, I will provide a brief regulatory update in our progress with respect to timely recovery of our capital investments through the filing of our interim capital trackers. Third,, I will touch on our planned capital deployment in 2026 which is right on track as we target to invest $6.8 billion this year for the benefit of our customers and communities. And finally, I will provide an update on our derisked financing plan, balance sheet health and credit metrics now starting with our strong financial results on slide 6. On a GAAP EPS basis we reported 48 cents for the first quarter of 2026. On a non-GAAP EPS basis we reported 56 cents for the quarter. Our non GAAP EPS excludes the impacts from the tax gain and other expenses related to the sale of our Ohio LDC which is on track to close in the fourth quarter of this year. In addition, we continue to exclude the impacts of removing our temporary generation units from base rates as they are no longer part of our regulated utility business. As a reminder, we expect to start marketing these units for either a sublease or sale later this year in anticipation of getting those units back no later than spring of next year. Taking a closer look at the Drivers of our first quarter earnings growth and rate recovery contributed $0.11 when compared to the same quarter last year driven by a full quarter impact of updated rates reflecting the interim filing mechanisms that went into effect late last year. Weather and usage were $0.02 unfavorable when compared to the comparable quarter last year driven by milder weather across our Texas and Indiana service territories. Additionally, higher interest expense was $0.04 unfavorable, reflecting new issuances slightly offset by lower commercial paper balances and favorable pricing on the convertible debt we issued during the quarter. O and M was flat for the quarter as we continue to accelerate our peer leading vegetation management program to enhance the customer experience and improve customer outcomes during severe weather events. Lastly, the absence of earnings from our Louisiana and Mississippi businesses post divestiture resulted in $0.05 of unfavorability when compared to the first quarter of 2025. The divested rate base has already been replaced by the acceleration of investments in our Texas businesses. These results reinforce our confidence in delivering on our full year 2026 non-GAAP EPS guidance range of $1.89 to $1.91. The accelerated growth that Jason highlighted and the work we’ve done to de risk our financing needs and more efficiently execute are additional tailwinds that further position us well to deliver and could continue to provide upside as we move through the year. Over the long term, we continue to expect to grow non GAAP EPS at the mid to high end of our 7 to 9% long term annual guidance range through 2028 and 7 to 9% annually thereafter through 2035. Now turning to a broader regulatory update As a reminder, we continue to recover approximately 85% of our investments through capital trackers, several of which we filed this quarter. I’ll start with Houston Electric. In February, we submitted the first of our two permitted filings of our distribution capital recovery factor, or DCRF, and our transmission cost of service tracker, or TCOs. The DCRF filing requested a revenue requirement increase of approximately $108 million capturing incremental distribution investments over the last six months. I’m pleased to share that we entered into a settlement agreement earlier this month and requested new rates to be effective in June ahead of our planned timing. The TCOS filing requested a revenue requirement increase of approximately $36 million incorporating transmission investments made between July and December of last year. During this quarter, the filing was approved and new rates went into …

Full story available on Benzinga.com

This post was originally published here

On Thursday, CACI International (NYSE:CACI) discussed third-quarter financial results during its earnings call. The full transcript is provided below.

This transcript is brought to you by Benzinga APIs. For real-time access to our entire catalog, please visit https://www.benzinga.com/apis/ for a consultation.

The full earnings call is available at https://events.q4inc.com/attendee/226577560

Summary

CACI International reported third-quarter revenue of $2.4 billion, marking an 8.5% year-over-year increase, with an EBITDA margin of 12.3% and free cash flow of $221 million.

The company acquired ARCA, a technology firm specializing in space domain national security, enhancing capabilities in space-based imaging and AI processing.

CACI International raised its fiscal 2026 revenue and EBITDA margin guidance due to the ARCA acquisition and strong organic performance.

The company secured $2.2 billion in awards this quarter, with a book-to-bill ratio of 0.9 times for the quarter and 1.2 times on a trailing twelve-month basis, despite government shutdown impacts.

Future outlook includes significant growth opportunities in electronic warfare, counter-UAS, and space domains, backed by a constructive macro environment and a $33.4 billion backlog.

Full Transcript

OPERATOR

Ladies and gentlemen, thank you for standing by. Welcome to CACI International International third quarter fiscal year 2026 earnings conference call. Today’s call is being recorded currently. All lines are in a listen only mode. Later we will announce the opportunity for questions and instructions will be given at that time. If you should need assistance during this call, please press star zero and someone will help you. At this time, I would like to turn the conference call over over to George Price, Senior Vice President of Investor Relations for CACI International. Please go ahead, sir.

George Price (Senior Vice President of Investor Relations)

Thanks, Jeannie. Good morning everyone. I’m George Price, Senior Vice President of Investor Relations for CACI International. Thank you for joining us this morning. We are providing presentation slides, so let’s move to slide 2. There will be statements in this call that do not address historical fact and as such constitute forward looking statements under current law. These statements reflect our views as of today and are subject to important factors that could cause our actual results to differ materially from anticipated. Those factors are listed at the bottom of last night’s press release and are described in the company’s SEC filings. Our safe harbor statement is included on this exhibit and should be incorporated as part of any transcript of this call. I would also like to point out that our presentation will include discussion of non-GAAP financial measures. These should not be considered in isolation or as a substitute for performance measures prepared in accordance with GAAP. Let’s turn to Slide 3 please. To open our discussion this morning, here’s John Menguchi, President and Chief Executive Officer of CACI International. John. Thanks, George. And good morning everyone. Thank you for joining us to discuss our third quarter fiscal year 2026 results as well as our updated fiscal 2026 guidance. With me this morning is Jeff McLaughlin, our Chief Financial Officer. Move to Slide 4, please. Before turning to our results, I want to start by reminding everyone the CACI is a fundamentally different company than it was 10 or even five years ago. This evolution is the result of a clear and consistent strategy, intentional leadership and disciplined execution over many years. It did not happen by accident. The key elements of our strategy are. First, we operate in seven markets where we possess decades of deep mission knowledge. We know and understand what our customers need. Second, we focus on enduring priorities. We are a national security company that targets narrow, deep funding streams. Third, we’re a software defined technology leader. We differentiate ourselves by using software, excuse me, to address critical needs with the speed, agility and efficiency our customers demand. Fourth, we invest ahead of customer need to show the art of the possible without waiting for requirements. And fifth, we deploy capital in a flexible and opportunistic manner to create value for our customers and our shareholders. Executing this strategy has enabled us to expand our portfolio, increase free cash flow per share and generate additional shareholder value. Slide 5 Please Turning to our third quarter results, we delivered another quarter of outstanding performance on our way to another exceptional year. Revenue for the quarter was 2.4 billion, up 8.5% year over year. We also generated a strong ebitda margin of 12.3% and robust free cash flow of 221 million. In addition, we won $2.2 billion of awards which represents a book to bill of 0.9 times for the quarter and 1.2 times on a trailing twelve month basis. These awards were driven by our exceptionally strong recompete performance, an important indicator of customer confidence and a key enabler of long term growth. While award activity improved in the quarter, it is not yet fully recovered from the multiple government shutdowns and acquisition organization changes. As we said before, quarterly awards can be lumpy, but we continue to have excellent visibility, a strong pipeline and see a very constructive macro environment. Our results continue to reinforce the CACI is differentiated and well positioned. With that said, we’re raising our fiscal 26 revenue and EBITDA margin guidance driven by the addition of ARCA and the strength of our organic margin performance. Slide 6 please on that note, let’s discuss our recent acquisition in a bit more detail. During the third quarter, we closed the acquisition of arca, a leading technology company focused on national security missions in the space domain. ARCA brings exquisite space based imaging sensor technology with high technical barriers to entry, agentic AI based ground processing software and deep customer relationships built over decades of strong performance. ARCA is a powerful addition to caci. We now have sensors deployed across all domains. We can provide multi source actionable intelligence and bring operationalized agentic AI capabilities to classified customers across the national security apparatus. In fact, we already have agentic AI efforts underway with our shared customer footprint and we see significant additional cross selling opportunities. ARCA positions us for opportunities including Golden Dome, Indo paytime support, future ground architecture and space superiority missions. To fully leverage our combined capabilities, we have integrated ARCA and ceci’s existing space portfolio under leadership of arca’s former CEO. ARCA exemplifies the type of acquisition that investors should want us to make wide competitive moat, unique capabilities and technology, exceptional execution history and strong financial performance and all in one of the most strategically important domains in national security. It’s our flexible and opportunistic capital deployment strategy in action positioning CACI to drive long term growth and free cash flow per share and additional shareholder value. Slide 7 Please CACI is a national security company that focus continues to be a powerful differentiator in the marketplace. We have more than 1400 people embedded in mission spaces across all combatant commands performing planning, intelligence, analysis, cyber and operational support. We are involved in every operational headline you read as well as the many operations you will never read about. This proximity to mission gives us an advantage that is hard to replicate. We understand the mission and the threats because we see them every day. This creates a feedback loop that sharpens our business development, strengthens our reputation for execution and informs on decision making allowing us to confidently invest ahead of customer need. These are meaningful discriminators that create competitive advantage and help drive our financial performance. For example, CACI recently received multi year extensions on several contracts in critical mission focused areas as a direct result of our exceptional delivery. Slide 8 please Our strategic investments informed by the mission proximity I just described have positioned CCI as a leader in software defined technology and key war fighting domains that are receiving significant attention and funding from our customers and these investments also demonstrate a repeatable strategy that will drive future growth and shareholder value. A great example is our Spectral program where we are developing the next generation of shipboard signals intelligence and electronic warfare capabilities for the Navy Surface Combatant ships. We initially invested ahead of customer need to show them the art of the possible and to demonstrate our differentiated solution during the bid phase. Now we are actively investing ahead of need during execution to accelerate delivery of capabilities to the field, a key ask of the current administration. During the quarter the program continued to progress as we achieved milestone C marking the start of Spectro’s low rate initial production and deployment phase. This is a defining step towards ramping up the program and and delivering this critical EW technology to the fleet. And because Spectral is built using software defined technology with open architectures, another key administration priority, we see significant additional opportunities across the Department of War and internationally. Another example is in Counter UAS where we are seeing accelerating demand, increasing orders and a growing pipeline driven by Merlin, our commercially sold counter UAS system. Merlin leverages nearly two decades of our counter UAS investments and work across the Department of War to deliver a system to seize further detects more, provides more critical decision making time and delivers more effective low to no collateral damage capabilities than any other available system. Merlin is a software defined system that can be rapidly updated and provides a nearly unlimited magazine of economically sustainable non kinetic effects including unique cellular detection and defeat capabilities from concept to deployment in under a year. We are not only providing the Department of War with the capabilities they are asking for, we are also delivering them at the speed demanded. We are proving this in real time with the Merlin system that our customers deployed on the southern border. A final example is our strong positioning for Golden Dell. CSCI has been investing in developing and building many of the capabilities this mission requires across many critical layers. First are our counter UAS systems. Defending the homeland is not just about ballistic or hypersonic threats, it’s also increasingly about threats from unmanned aircraft systems. CCI’s technology is ideally suited for this mission where extended detection range provides critical time for decision making and low to no collateral damage effects are critically important for mission success. Second are our exquisite left of launch capabilities. These include sensitive cyber activities as well as our worldwide set of embedded sensors which can detect and defeat threats before they are deployed. And third is our space based sensing. ARCA significantly expands our capabilities in the space domain, including technologies such as hyperspectral imaging for missile detection. Spectral Merlin and Golden Dome are three significant proof points of how CACI creates value for our customers and our shareholders. They demonstrate where we identified an enduring need early, invested well ahead of award and had established differentiated positions through years of disciplined execution and continued innovation. Slide 9 please. Turning to the macro environment, we continue to see constructive budgets and demand signals. While the government fiscal year 27 budget is still evolving, the proposed spending looks very positive in many key areas for CACI including electronic warfare and counter UAS space, especially classified space and counter space programs, C5, ISR and IT modernization, including AI and the digital backbone. We are in the right markets that are aligned to enduring well funded priorities. We’re providing the right capabilities to address our national security customers most pressing needs. And with that I’ll turn the call over to Jeff.

John Menguchi (President and Chief Executive Officer)

Thank you John and good morning everyone. Please turn to Slide 10. As John mentioned, we’re very pleased with our third quarter performance despite some modest disruption from the ongoing DHS shutdown. Our revenue and awards reflect our strong market position in a recovering but still sluggish award environment, while our strong margins and cash flow demonstrate the high value differentiated characteristics of our offerings and our operational excellence. In the third quarter we generated revenue of $2.4 billion representing 8.5% year over year growth, of which 6.8% was organic. Despite the modest DHS impacts that I mentioned, we still saw the expected acceleration in organic growth moving into the second half of the year. EBITDA margin of 12.3% in the quarter represents a year over year increase of 60 basis points even after absorbing $17 million of ARCA transaction costs. Adjusting for these expenses, our strong third quarter profitability was driven primarily by overall mix and Strong program execution. Third quarter adjusted diluted earnings per share of $7.27 were 17% higher than a year ago. Greater operating income along with a lower share count more than offset higher interest expense including $11 million related to ARCA, a higher income tax provision and the transaction costs I mentioned earlier. Finally, we delivered healthy free cash flow of $221 million in the quarter driven by strong profitability and good working capital management. Third quarter cash flow was reduced by approximately $20 million due to transaction costs and other acquisition related financing fees. Days sales outstanding or DSO were 55 days, 2 days lower than the prior quarter. Slide 11 please turning to our balance sheet and capital structure, our pro forma leverage at the end of Q3 was was 4.2 times net debt to trailing 12 month EBITDA, slightly better than the expectation we provided when we announced the ARCA acquisition. We continue to expect leverage to return to the low 3s within 6/4 based on the strong cash flow characteristics of our business. I’ll remind you again that we have a strong track record of successfully and quickly deleveraging after major acquisitions, which underscores our consistent financial performance, disciplined capital deployment and demonstrated access to capital. As we have previously indicated, ARCA is accretive to both growth and margins. The acquisition of ARCA is just the latest example of our flexible and opportunistic capital deployment strategy and the evolution of our portfolio which positions CACI to deliver long term growth and free cash flow per share and and additional shareholder value. Slide 12 Please we’re pleased to increase our fiscal 26 revenue and EBITDA margin guidance driven by the addition of ARCA and the strength of our organic margin performance. You’ll notice on the right hand side of the chart we provided a breakdown of costs associated with an acquisition. For transparency and your modeling purposes. We now expect revenue to be between 9.5 and $9.6 billion. This represents total growth of 10.1% to 11.3% which includes about 3.5 points of growth from acquisitions including $150 million from ARCA. We’re increasing our fiscal 26 EBITDA margin to the 11.8% to 11.9% range, underscoring our strong execution and evolving portfolio as well as contributions from arca. Our full year margin outlook includes the impact of approximately $22 million of transaction costs related to the acquisition. Our updated FY26 adjusted net income guidance is between 615 and $630 million. Adjusted net income reflects the after tax impact of approximately $60 million of pre tax transaction costs and higher interest expense, largely offset by stronger organic margin and arca’s earnings contribution. This yields full year adjusted eps guidance of between 2770 and 2838 per share which represents growth of 5 to 7% even as we absorb these costs. And finally, we are reaffirming our free cash flow guidance of at least $725 million even after absorbing nearly $50 million of transaction costs, interest expense and an increased investment in capital expenditures. As we consistently say, we see free cash flow per share as the ultimate value creation Metric and our FY26 guidance represents 65% growth in free cash flow per share over FY25. Slide 13 please turning to forward indicators all metrics continue to provide good long term visibility into the strength of our business. Our third quarter book to bill of 0.9 times and our trailing twelve month book to bill of 1.2 times reflect good performance in the marketplace. Even with the multiple shutdowns and slow rebound in award decisions. The trailing 12 month weighted average duration of our awards in Q3 continued to be just over six years. Our total backlog of $33.4 billion increased 6% year over year while our funded backlog increased 19% over the same period. Both metrics reflect healthy organic growth even when normalizing for Arca’s contribution of $835 million to total backlog and 422 million to funded backlog. Additionally, Arca has another $2 billion of non competitive franchise programs from which we expect to recognize revenue over time but that don’t yet meet the regulatory criteria to be added to backlog for fiscal year 26. We now expect 98% of our revenue to come from existing programs with 1% each from recompetes and new business. Progress on these metrics reflects our continued strong operational performance and yields increased confidence in our outlook as we close out the year. In terms of our pipeline, we have more than $4 billion of bids under evaluation, over 80% of which are for new business to CACI. We expect to submit another $22 billion in bids over the next two quarters with over 75% of those being for new business. We continue to have excellent visibility, are well positioned in a very …

Full story available on Benzinga.com

This post was originally published here

ServiceNow Inc (NYSE:NOW) reported upbeat financial results for the first quarter after the market close on Wednesday.

ServiceNow posted first-quarter revenue of approximately $3.77 billion, beating the consensus estimate of $3.74 billion, according to Benzinga Pro. The software solutions company reported adjusted earnings of 97 cents per share for the quarter, narrowly beating analyst estimates of 96 cents per share.

“As new technologies create both opportunity and risk, our two decades of engineering combined with deep business context enable us to orchestrate and secure the agentic enterprise,” said Bill McDermott, chairman and CEO of ServiceNow.

ServiceNow expects second-quarter subscription revenue of $3.815 billion to $3.82 billion, representing approximately 21% to 21.5% growth. The company sees full-year 2026 subscription revenue …

Full story available on Benzinga.com

This post was originally published here

U.S. Senator Lindsey Graham (R-S.C.) has expressed his support for the ongoing oil blockade against Iran, predicting its expansion in the near future.

Graham took to X on Wednesday and said that President Donald Trump‘s decision to leave the blockade in place is “very smart” because it is significantly weakening Iran’s capacity to sustain its alleged support for militant activities.

He further added, “I not only expect this blockade to stay in place until Iran shows a commitment to change their ways, I expect the blockade will be growing and that it could become global soon.”

This post was originally published here

U.S. stock futures were lower this morning, with the Dow futures falling around 200 points on Thursday.

Shares of ASGN Inc (NYSE:ASGN) fell in pre-market trading after the company reported worse-than-expected first-quarter financial results and issued second-quarter guidance below estimates.

ASGN reported quarterly earnings of 69 cents per share which missed the analyst consensus estimate of 98 cents per share. The company reported quarterly sales of $968.300 million which missed the analyst consensus estimate of $971.659 million.

ASGN shares dipped 25.2% to $30.23 in pre-market trading.

Here are some other stocks moving lower in pre-market trading.

  • Medpace Holdings Inc (NASDAQ:MEDP) fell 17.3% to $420.01 in pre-market trading after posting first-quarter results.
  • Altimmune Inc

Full story available on Benzinga.com

This post was originally published here

Top Wall Street analysts changed their outlook on these top names. For a complete view of all analyst rating changes, including upgrades, downgrades and initiations, please see our analyst ratings page.

  • BMO Capital analyst Michael Zaremski upgraded W. R. Berkley Corp (NYSE:WRB) from Underperform to Market Perform and raised the price target from $64 to $68. WR Berkley shares closed at $67.50 on Wednesday. See how other analysts view this stock.
  • B of A Securities analyst Vivek Arya upgraded Texas Instruments Inc (NASDAQ:TXN) …

Full story available on Benzinga.com

This post was originally published here

The world may seem like it’s in chaos with war in Iran, volatility at fever pitch and oil prices soaring, but when it comes to the Federal Reserve’s view of its interest rate policy, it appears to be steady as she goes, at least in the near term. 

The steady as she goes mindset was the signal Fed Chairman Jerome Powell sent at the central bank’s last meeting in January, even as the Fed stood divided. In prepared remarks, Powell said the committee is “well-positioned” to assess incoming data, noting they need to see more consistent evidence that inflation is moving sustainably toward their 2% goal before committing to further reductions. 

Expectations on Wall Street were for the Fed to keep rates steady in the 3.5% to 3.75% range through April, with any cuts coming during the July meeting at the earliest. It could be pushed back to September or even further if inflation keeps rising, the war in Iran continues and disruptions in the Strait of Hormuz don’t end. 

On the other hand, while stock market volatility tends to drive many investors to seek out the relative stability of bonds, finding the right investment vehicle in the current interest rate environment can be a challenge – but there are options that may hold advantages.

Actively Managing The Wait With The Infrastructure Capital Bond Income ETF

The Fed’s policy shouldn’t be too much of a shock to the bond market, even though it complicates the path for bond price appreciation; however, for income-seeking investors, there are opportunities to be found through actively managed bond ETFs. That’s because they can continually reinvest the proceeds from maturing bonds with lower interest into securities that pay higher rates. As a result, investors could potentially get higher monthly dividend payments, which is what income-seeking investors are after.

It’s the philosophy behind the Infrastructure Capital Bond Income ETF (NYSE:BNDS), which seeks to maximize current income, with a secondary objective to pursue strategic opportunities for capital appreciation. BNDS …

Full story available on Benzinga.com

This post was originally published here

Xpeng Inc. (NYSE:XPEV) is targeting volume production of its flying cars next year, as well as scaling its humanoid robot efforts.

Humanoid Robots In Q4

In a statement to Reuters on Thursday, Xpeng President Brian Gu shared that the company is targeting a fourth-quarter 2026 production timeline for its humanoid robot. Xpeng said that it has ​received more than 7,000 orders for its flying cars, all of which are from China, the report said. The company is also working to secure approval from China’s aviation regulator.

data-variant=”card”
data-news-mode=”manual”

>


Read Also:

Former Diplomat Detained By China Warns Against Influx Of Chinese EVs In Canada, Echoing Trump’s Concerns: ‘They Want To Control…’

This post was originally published here

Xpeng Inc. (NYSE:XPEV) is targeting volume production of its flying cars next year, as well as scaling its humanoid robot efforts.

Humanoid Robots In Q4

In a statement to Reuters on Thursday, Xpeng President Brian Gu shared that the company is targeting a fourth-quarter 2026 production timeline for its humanoid robot. Xpeng said that it has ​received more than 7,000 orders for its flying cars, all of which are from China, the report said. The company is also working to secure approval from China’s aviation regulator.

data-variant=”card”
data-news-mode=”manual”

>


Read Also:

Former Diplomat Detained By China Warns Against Influx Of Chinese EVs In Canada, Echoing Trump’s Concerns: ‘They Want To Control…’

This post was originally published here

C$ unless otherwise stated  

TORONTO, April 23, 2026 /CNW/ – Manulife Investments today announced the April 2026 cash distributions for Manulife Exchange Traded Funds (ETFs) and ETF series of Manulife Mutual Funds, including Manulife Alternative Mutual Funds (Manulife Funds), that distribute monthly. Unitholders of record at the close of business on April 30, 2026, will receive cash distributions payable on May 15, 2026.

Details of the distribution per unit amounts are as follows:

Manulife ETF/Fund Name

Ticker

Distribution
Amount
(per unit) ($)

Distribution
Frequency

Manulife Smart Short-Term Bond ETF

TERM

0.029440

Monthly

Manulife Smart Core Bond ETF

BSKT

0.025648

Monthly

Manulife Smart Corporate Bond ETF

CBND

0.031194

Monthly

Manulife Smart Global Bond ETF

GBND

0.000000

Monthly

Manulife Smart Enhanced Yield ETF

CYLD

0.160000

Monthly

Full story available on Benzinga.com

This post was originally published here

C$ unless otherwise stated  

TORONTO, April 23, 2026 /CNW/ – Manulife Investments today announced the April 2026 cash distributions for Manulife Exchange Traded Funds (ETFs) and ETF series of Manulife Mutual Funds, including Manulife Alternative Mutual Funds (Manulife Funds), that distribute monthly. Unitholders of record at the close of business on April 30, 2026, will receive cash distributions payable on May 15, 2026.

Details of the distribution per unit amounts are as follows:

Manulife ETF/Fund Name

Ticker

Distribution
Amount
(per unit) ($)

Distribution
Frequency

Manulife Smart Short-Term Bond ETF

TERM

0.029440

Monthly

Manulife Smart Core Bond ETF

BSKT

0.025648

Monthly

Manulife Smart Corporate Bond ETF

CBND

0.031194

Monthly

Manulife Smart Global Bond ETF

GBND

0.000000

Monthly

Manulife Smart Enhanced Yield ETF

CYLD

0.160000

Monthly

Full story available on Benzinga.com

This post was originally published here

On CNBC’s “Halftime Report Final Trades,” Stephen Weiss, chief investment officer and managing partner of Short Hills Capital Partners, named Vertiv Holdings Co (NYSE:VRT) as his final trade.

On the earnings front, Vertiv reported first-quarter results on Wednesday, with both earnings and revenue beating the consensus estimate.

Net sales rose 30% year-over-year (Y/Y) to $2.65 billion, exceeding the $2.627 billion Street consensus. Adjusted EPS stood at $1.17, beating the consensus of $1.01.

Anastasia Amoroso, managing director, chief investment strategist …

Full story available on Benzinga.com

This post was originally published here

On CNBC’s “Halftime Report Final Trades,” Stephen Weiss, chief investment officer and managing partner of Short Hills Capital Partners, named Vertiv Holdings Co (NYSE:VRT) as his final trade.

On the earnings front, Vertiv reported first-quarter results on Wednesday, with both earnings and revenue beating the consensus estimate.

Net sales rose 30% year-over-year (Y/Y) to $2.65 billion, exceeding the $2.627 billion Street consensus. Adjusted EPS stood at $1.17, beating the consensus of $1.01.

Anastasia Amoroso, managing director, chief investment strategist …

Full story available on Benzinga.com

This post was originally published here

During times of turbulence and uncertainty in the markets, many investors turn to dividend-yielding stocks. These are often companies that have high free cash flows and reward shareholders with a high dividend payout.

Benzinga readers can review the latest analyst takes on their favorite stocks by visiting Analyst Stock Ratings page. Traders can sort through Benzinga’s extensive database of analyst ratings, including by analyst accuracy.

Below are the ratings of the most accurate analysts for three high-yielding stocks in the communication services sector.

National CineMedia, Inc. (NASDAQ:NCMI)

  • Dividend Yield: 3.42%
  • Barrington Research analyst Patrick Sholl maintained an Outperform rating and cut the price target from $6.5 to $5.5 on Jan. 26, 2026. This analyst has an accuracy rate of 71%
  • B. Riley Securities analyst Drew Crum maintained a Neutral rating and slashed the price target from $5 to $4 on Jan. 22, 2026. This analyst has an accuracy rate of 69%.
  • Recent News: On Feb. 26, National CineMedia …

Full story available on Benzinga.com

This post was originally published here

During times of turbulence and uncertainty in the markets, many investors turn to dividend-yielding stocks. These are often companies that have high free cash flows and reward shareholders with a high dividend payout.

Benzinga readers can review the latest analyst takes on their favorite stocks by visiting Analyst Stock Ratings page. Traders can sort through Benzinga’s extensive database of analyst ratings, including by analyst accuracy.

Below are the ratings of the most accurate analysts for three high-yielding stocks in the communication services sector.

National CineMedia, Inc. (NASDAQ:NCMI)

  • Dividend Yield: 3.42%
  • Barrington Research analyst Patrick Sholl maintained an Outperform rating and cut the price target from $6.5 to $5.5 on Jan. 26, 2026. This analyst has an accuracy rate of 71%
  • B. Riley Securities analyst Drew Crum maintained a Neutral rating and slashed the price target from $5 to $4 on Jan. 22, 2026. This analyst has an accuracy rate of 69%.
  • Recent News: On Feb. 26, National CineMedia …

Full story available on Benzinga.com

This post was originally published here

On CNBC’s “Mad Money Lightning Round,” Jim Cramer said Alphabet Inc. (NASDAQ:GOOGL) (NASDAQ:GOOG) is going to $400.

Supporting his view, BMO Capital analyst Brian Pitz, on Wednesday, maintained Alphabet with an Outperform rating and raised the price target from $400 to $410.

JPMorgan analyst Doug Anmuth reiterated an Overweight rating on Monday with a $395 price forecast for Alphabet. The firm named the tech giant a “Top Pick” just as the Google Cloud Next event kicked off …

Full story available on Benzinga.com

This post was originally published here

On CNBC’s “Mad Money Lightning Round,” Jim Cramer said Alphabet Inc. (NASDAQ:GOOGL) (NASDAQ:GOOG) is going to $400.

Supporting his view, BMO Capital analyst Brian Pitz, on Wednesday, maintained Alphabet with an Outperform rating and raised the price target from $400 to $410.

JPMorgan analyst Doug Anmuth reiterated an Overweight rating on Monday with a $395 price forecast for Alphabet. The firm named the tech giant a “Top Pick” just as the Google Cloud Next event kicked off …

Full story available on Benzinga.com

This post was originally published here

Jim Cramer, host of CNBC’s Mad Money, on Wednesday, shared a practical strategy for navigating a hot market: be willing to pay a premium for high-quality stocks rather than risk missing out on strong upside potential.

Cramer emphasized the importance of discipline in a heated market. He recalled a lesson from his early career where a fellow trader would “divide stocks by 10” to make their prices seem more palatable. He used the example of Bloom Energy (NYSE:BE), explaining that a $230 stock could be perceived as a $23 stock, making it psychologically easier to invest in high-momentum stocks.

“Would it really kill you to pay $24 for a $23 stock?” Cramer said. “The answer is no.”

Despite being a “price-sensitive buyer”, the CNBC host suggested a flexible approach of applying this “must-own” mindset to a small number of high-conviction stocks, particularly in a stable interest rate environment supporting the bull market.

Cramer noted that stocks of chipmakers Micron Technology (NASDAQ:MU) …

Full story available on Benzinga.com

This post was originally published here

A WalletHub analysis released on Wednesday showed Hawaii has the highest housing cost burden in the U.S.

Hawaiian homeowners spend 50.02% of their median monthly household income on housing, including mortgage and energy costs. California ranks second at 43%, followed by Massachusetts at 33.67%, while Iowa sits lowest at 17.26%.

The ranking combines mortgage, rent and home energy costs and adjusts them against median income across all 50 states.

High Costs Despite High Incomes

Hawaii’s burden stands out even with relatively strong earnings. The state has the fourth-highest median household income at $100,389, yet housing costs still consume a disproportionate share. The report attributes this to consistently high expenses across categories, with Hawaii recording both the highest mortgage payments and the highest home energy costs in the country.

California shows a similar pattern. Despite a median income of $99,122, residents spend 43% of their income on housing, driven by the second-highest mortgage costs and elevated …

Full story available on Benzinga.com

This post was originally published here

Amidst today’s fast-paced and highly competitive business environment, it is crucial for investors and industry enthusiasts to conduct comprehensive company evaluations. In this article, we will delve into an extensive industry comparison, evaluating Netflix (NASDAQ:NFLX) in comparison to its major competitors within the Entertainment industry. By analyzing critical financial metrics, market position, and growth potential, our objective is to provide valuable insights for investors and offer a deeper understanding of company’s performance in the industry.

Netflix Background

Netflix’s relatively simple business model involves only one business, its streaming service. It has the biggest television entertainment subscriber base in both the United States and the collective international market, with more than 300 million subscribers globally. Netflix has exposure to nearly the entire global population outside of China. The firm has traditionally avoided a regular slate of live programming or sports content, instead focusing on on-demand access to episodic television, movies, and documentaries. The firm introduced ad-supported subscription plans in 2022, giving the firm exposure to the advertising market in addition to the subscription fees that have historically accounted for nearly all its revenue.

Company P/E P/B P/S ROE EBITDA (in billions) Gross Profit (in billions) Revenue Growth
Netflix Inc 30.08 12.61 8.60 18.3% $11.13 $6.36 16.19%
The Walt Disney Co 15.44 1.71 1.98 2.2% $5.45 $9.31 5.23%
Spotify Technology SA 42.22 10.97 5.44 14.58% $1.05 $1.5 6.81%
Warner Bros. Discovery Inc 94.19 1.91 1.85 -0.7% $4.25 $4.24 -5.65%
Liberty Media Corp 35.14 2.62 4.67 1.08% $0.38 $0.49 37.87%
Roku Inc 200.58 6.56 3.77 3.05% $0.19 $0.61 16.14%
Warner Music Group Corp 51.40 21.26 2.22 25.46% $0.39 $0.85 10.44%
TKO Group Holdings Inc 82.42 3.89 7.63 -0.06% $0.21 $0.62 11.86%
Cinemark Holdings Inc 27.43 8.22 1.23 7.03% $0.13 $0.5 -4.67%
Imax Corp 57.49 5.79 4.90 0.19% $0.02 $0.07 35.11%
Reservoir Media Inc 101.50 1.78 3.96 0.59% $0.02 $0.03 7.72%
Marcus Corp 45.46 1.25 0.77 1.31% $0.02 $0.07 2.75%
Average 68.48 6.0 3.49 4.98% $1.1 $1.66 11.24%

Full story available on Benzinga.com

This post was originally published here

Amidst the fast-paced and highly competitive business environment of today, conducting comprehensive company analysis is essential for investors and industry enthusiasts. In this article, we will delve into an extensive industry comparison, evaluating Micron Technology (NASDAQ:MU) in comparison to its major competitors within the Semiconductors & Semiconductor Equipment industry. By analyzing critical financial metrics, market position, and growth potential, our objective is to provide valuable insights for investors and offer a deeper understanding of company’s performance in the industry.

Micron Technology Background

Micron is one of the largest semiconductor companies in the world, specializing in memory and storage chips. Its primary revenue stream comes from dynamic random access memory, or DRAM, and it also has minority exposure to not-and or NAND, flash chips. Micron serves a global customer base, selling chips into data centers, mobile phones, consumer electronics, and industrial and automotive applications. The firm is vertically integrated.

Company P/E P/B P/S ROE EBITDA (in billions) Gross Profit (in billions) Revenue Growth
Micron Technology Inc 23.01 7.59 9.51 21.0% $18.48 $17.75 196.29%
NVIDIA Corp 41.33 31.28 22.99 31.11% $51.28 $51.09 73.21%
Broadcom Inc 82.39 25.05 30.12 9.12% $11.15 $13.16 29.47%
Advanced Micro Devices Inc 116.27 7.85 14.33 2.44% $2.86 $5.58 34.11%
Texas Instruments Inc 43.36 13.22 12.20 7.03% $2.07 $2.47 10.38%
Analog Devices Inc 69.73 5.51 16.06 2.46% $1.52 $2.04 30.42%
Qualcomm Inc 27.43 6.29 3.32 13.57% $4.11 $6.68 5.0%
Marvell Technology Inc 51.24 9.61 16.70 2.79% $0.75 $1.15 22.08%
Monolithic Power Systems Inc 118.35 21.17 26.35 4.95% $0.21 $0.41 20.83%
NXP Semiconductors NV 28.40 5.67 4.68 4.53% $0.98 $1.81 7.2%
ON Semiconductor Corp 306.86 4.56 6.11 2.33% $0.45 $0.55 -11.17%
GLOBALFOUNDRIES Inc 38.01 2.78 4.97 1.68% $0.73 $0.51 0.0%
Astera Labs Inc 159.07 24.22 40.87 3.41% $0.07 $0.2 91.77%
Credo Technology Group Holding Ltd 104.12 18.90 32.95 10.03% $0.16 $0.28 201.49%
Tower Semiconductor Ltd 106.24 7.97 14.95 2.78% $0.2 $0.12 13.69%
MACOM Technology Solutions Holdings Inc 125.34 15.36 20.34 3.64% $0.07 $0.15 24.52%
First Solar Inc 13.28 2.13 3.89 5.62% $0.7 $0.67 11.15%
Lattice Semiconductor Corp 5779.50 22.16 30.54 -1.08% $0.01 $0.1 24.16%
Rambus Inc 62.28 10.42 20.29 4.81% $0.09 $0.15 18.09%
Average 404.07 13.01 17.87 6.18% $4.3 $4.84 33.69%

Full story available on Benzinga.com

This post was originally published here

Traders reportedly placed bets worth $430 million on a decrease in crude oil prices, just 15 minutes before President Donald Trump announced an extension of the ceasefire with Iran on Tuesday.

This marks the fourth instance of large, well-timed directional oil bets placed just ahead of major Iran war developments, with April wagers totaling about $2.1 billion, Reuters reported on Wednesday. Previously, in March, traders placed bets amounting to more than $500 million in the oil market minutes before a significant Truth Social post by Trump concerning “productive” Iran talks. 

Between 19:54 and 19:56 GMT on Tuesday, traders sold 4,260 lots of oil, worth a total of $430 million, based on the prevailing Brent futures price, reported the publication, citing LSEG data. Trump announced the indefinite ceasefire extension at 20:10 GMT. These trades occurred during post-settlement hours, a period when trading volumes are typically very low.

At 5:16 am ET, Brent crude oil was trading 2.62% higher at $104.60 per barrel.

The U.S. Securities and Exchange Commission and CME Group did not immediately respond to Benzinga‘s request for comments.

data-variant=”card”
data-news-mode=”manual”

This post was originally published here

QatarEnergy and Exxon Mobil Corp. (NYSE:XOM) loaded the first liquefied natural gas (LNG) export cargo from the Golden Pass terminal in Sabine Pass, Texas, on Thursday, marking a key commissioning milestone for the $10 billion-plus joint venture amid escalating Middle East tensions.

QatarEnergy, Qatar’s state-owned national petroleum company, manages all oil and gas activities in the country — including exploration, production, refining, and marketing of crude oil, natural gas, LNG and petrochemicals.

Golden Pass Hits Key Milestone

According to QatarEnergy, the cargo was loaded onto its LNG carrier Al-Qaiyyah, a 174,000-cubic-meter vessel built in South Korea. The terminal achieved its first LNG production from Train 1 on Mar. 30, out of a planned three liquefaction trains.

QatarEnergy holds a 70% controlling stake in the venture, while ExxonMobil owns the remaining 30%. Together, the partners committed …

Full story available on Benzinga.com

This post was originally published here

Nokia Corp. (NYSE:NOK) on Thursday posted first-quarter results, highlighting strong momentum in optical networking and a sharp jump in sales tied to AI and cloud customers.

Nokia Q1 Results

The Finnish company reported net sales of $5.26 billion (EUR 4.5 billion), up 4% year over year, but missed Benzinga’s estimates of $5.40 billion. EPS came at $0.06, missing estimates by 3% but increasing 67% year-on-year.

The company’s Network Infrastructure segment grew 6% year over year, driven by a 20% increase in Optical Networks sales. Mobile Infrastructure sales grew 3% year over year with strength in Core Software (up 5%) and Technology Standards (up 10%). Sales growth at Radio Networks remained flat.

Justin Hotard, Nokia’s president and CEO, said, “We are increasing our growth assumption for Optical and IP Networks and we are investing to capture accelerating demand from AI & Cloud customers.”

Nokia’s AI Surge: A Game Changer?

Hotard tied the quarter’s performance to demand from AI and cloud buyers and said the company is leaning further into this market. AI & Cloud sales jumped 49% year over year in the quarter and now account for 8% of group sales. Nokia booked $1.17 billion (EUR 1 billion) in orders from those customers during the quarter.

Nokia raised its view for the AI and cloud …

Full story available on Benzinga.com

This post was originally published here

The most oversold stocks in the information technology sector presents an opportunity to buy into undervalued companies.

The RSI is a momentum indicator, which compares a stock’s strength on days when prices go up to its strength on days when prices go down. When compared to a stock’s price action, it can give traders a better sense of how a stock may perform in the short term. An asset is typically considered oversold when the RSI is below 30, according to Benzinga Pro.

Here’s the latest list of major oversold players in this sector, having an RSI near or below 30.

ASGN Inc (NYSE:ASGN)

  • On April 22, ASGN reported worse-than-expected first-quarter financial results and issued second-quarter guidance below estimates. “Revenues for the first quarter of 2026 were $968.3 million, in line with our guidance range. In the Commercial Segment, we achieved year-over-year growth in three out of five industries, including Healthcare, Consumer and Industrial, and TMT, while in the Federal Government Segment, we achieved year-over-year growth in National Security and Other clients. While Adjusted EBITDA margins were …

Full story available on Benzinga.com

This post was originally published here

Imprisoned cryptocurrency fraudster Sam Bankman-Fried on Wednesday touted his investments in some of the world’s most valuable companies, and what the total stake could have been if the fire-sale had not occurred.

‘Many Such Cases’

Bankman-Fried, popularly known as SBF, quoted a post highlighting the pre-seed investment of Alameda Research—the sister company of fallen cryptocurrency exchange FTX—in AI coding tool Cursor. The startup is reportedly close to securing at least $2 billion in fresh capital at a $50 billion pre-money valuation.

Under SBF, FTX and associated companies took stakes in several technology startups, including AI company Anthropic, Robinhood Markets (NASDAQ:HOOD), K5 Global, which had investments in SpaceX and cryptocurrency project Solana (CRYPTO: SOL).

The bankruptcy of FTX led to the company selling off most of these assets. SBF posted an image showing what FTX’s top holdings would be worth …

Full story available on Benzinga.com

This post was originally published here

Commercial space flight giant SpaceX has warned investors it could face supply chain risks as it moves to scale up its in-house AI compute efforts.

Supply Risks Plague SpaceX

According to S-1 filings accessed by Reuters on Wednesday, SpaceX had listed its in-house chip manufacturing as one of its “substantial capital expenditures.” SpaceX also outlined that it did not have long-term contracts in place with suppliers and that it will continue to source a “significant” portion of its compute from third-party suppliers.

“There can be no assurance that we will be able to achieve our objectives with respect to TERAFAB within ​the expected timeframes, or at all,” SpaceX said.

data-variant=”card”
data-news-mode=”manual”

>


Read Also:

Environmental Group To Protest At Starbase As Investors Visit SpaceX Ahead Of IPO

This post was originally published here

Baker Hughes Company (NASDAQ:BKR) will release earnings for its first quarter after the closing bell on Thursday, April 23.

Analysts expect the Houston, Texas-based company to report quarterly earnings of 49 cents per share, down from 51 cents per share in the year-ago period. The consensus estimate for Baker Hughes quarterly revenue is $6.33 billion (it reported $6.43 billion last year), according to Benzinga Pro.

On April 13, the company agreed to sell its Waygate Technologies business to Hexagon (OTC:HXGBY) in an all-cash transaction valued at approximately $1.45 billion.

Baker Hughes shares gained 3.8% to close at $62.54 on Wednesday.

Benzinga readers can access the latest analyst ratings on the Analyst Stock Ratings page. Readers can sort by stock ticker, company name, analyst firm, rating change or other …

Full story available on Benzinga.com

This post was originally published here

Weatherford International (NASDAQ:WFRD) reported first-quarter financial results on Wednesday. The transcript from the company’s first-quarter earnings call has been provided below.

This content is powered by Benzinga APIs. For comprehensive financial data and transcripts, visit https://www.benzinga.com/apis/.

Access the full call at https://edge.media-server.com/mmc/p/64roocdf/

Summary

Weatherford International PLC reported Q1 2026 revenue of $1.152 billion, adjusted EBITDA of $233 million, and adjusted free cash flow of $85 million.

The company plans to redomesticate from Ireland to Texas, aiming to simplify its corporate structure and enhance shareholder value.

Revenue declined 3% year-over-year due to the divestiture of the pressure pumping business in Argentina and was down 11% sequentially due to seasonality and the Iran conflict.

Strong cash flow and collection improvements were noted, particularly with their key customer in Mexico, contributing to a working capital efficiency improvement.

The company reported operational disruptions in the Middle East due to the Iran conflict, impacting revenue and costs, but expects a rebound in the second half of 2026.

Management is optimistic about the multi-year growth outlook, driven by increased energy security needs and offshore activity, especially in the Middle East and North America.

Weatherford International PLC continues to focus on strategic divestitures of non-core, lower-margin businesses to align with their strategic priorities.

The company anticipates a second-half ramp-up in activity and is optimistic about 2027 growth prospects, with several new contract wins and offshore opportunities.

Full Transcript

OPERATOR

Ladies and gentlemen, thank you for standing by. Welcome to the Weatherford first quarter 2026 results conference call. All participants will be in a listen only mode. Should you need assistance, please signal a conference specialist by pressing the star key followed by zero. After today’s presentation there will be an opportunity to ask questions. To ask a question you may press star and then one on your telephone keypads. To withdraw your questions you may press star and 2. As a reminder, today’s event is being recorded. At this time, I’d like to turn the conference call over to Luke Lemoine, Senior of Corporate Development. Sir, you may begin.

Luke Lemoine (Senior of Corporate Development)

Welcome everyone to the Weatherford International first quarter 2026 earnings conference call. I’m joined today by Grace Elligram, President and CEO and Anuj Executive Vice President, CFO. We’ll start today with our prepared remarks and then open it up for questions. You may download a copy of the presentation slides corresponding to today’s call from our website’s Investor Relations section. I want to remind everyone that some of today’s comments include forward looking statements. These statements are subject to many risks and uncertainties that could cause our actual results to differ materially from any expectation expressed herein. Please refer to our latest securities and Exchange Commission filings for risk factors and cautions regarding forward looking statements. Our comments today also include non GAAP financial measures. The underlying details and a reconciliation of GAAP to non GAAP financial measures are included in our earnings press release or accompanying slide deck which can be found on our website. As a reminder, today’s call is being webcast and a recorded version will be available on our website’s Investor Relations section following the conclusion of this call. With that, I’d like to turn the call over to Girish.

Girish

Thanks Luke and thank you all for joining our call. I’ll start with an overview of our financial and operational performance followed by a short term outlook on the markets. Anuj will then cover specifics on financial performance, balance sheet, detailed guidance and I will wrap up with some thoughts on the current operating environment and structural market dynamics before opening for QA. To summarize our Q1 2026 performance, we delivered revenue of $1.152 billion, adjusted EBITDA of $233 million at a 20.2% margin and adjusted free cash flow of $85 million. I would like to thank all of our one Weatherford team and especially our Middle east based employees for their focus on customers safety and operational discipline in a complex and challenging environment. I would also like to highlight Our announcement during the quarter of a proposal to redomesticate from Ireland to the United States, specifically Texas, which we believe will simplify our corporate structure, enhance capital management flexibility and support long term shareholder value creation. As illustrated on slide three, revenue declined 3% on a year on year basis, but it is important to note that it was predominantly driven by the divestiture of the pressure pumping business in Argentina. On a sequential basis, revenues were down 11% reflecting typical first quarter seasonality and the conflict in Iraq, partly offset by continued strength in parts of our international portfolio and some second quarter opportunities that materialized earlier. In the first North America was modestly softer as operators maintained tight budgets and U.S. land activity remained under pressure. Latin America declined sequentially as expected, but this was partly offset by higher artificial lift in Argentina. In Mexico, we continued to make meaningful progress in the first quarter. Collections remained strong and consistent, reinforcing our confidence in the new payment mechanisms we discussed on our last call. This not only supported our Q1 cash flow performance, but also contributed to a sequential improvement in working capital efficiency. The Middle East, North Africa and Asia region was impacted by the Iraq conflict in the Middle east, which drove delays, dropped drilling and workover activity and resulted in project suspensions in multiple countries. Since the start of the recent Iraq conflict and over the course of the past few weeks, our priority has been the safety and security of our employees and ensuring business continuity to the extent it was feasible. Each country in the Middle east has been impacted in different ways and we have taken actions in close coordination with customers and advice from local authorities. While the drop in revenue and resultant high decremental margins are the most obvious manifestation financially, we are also working through additional complexities. Freight costs have risen dramatically and with logistical disruptions, there are both delays and higher costs in moving materials and people to the appropriate locations. With a strong manufacturing supply chain base and local expertise in the region, we were able to navigate the first month of the conflict well. There was a financial impact, but that has been offset through contributions from the rest of the international regions and other items in the first quarter. However, with the prolonged nature of the conflict, the impact of lead times, inventory drawdowns, logistical bottlenecks, the impact is expected to show more clearly in the second quarter, both in the region and to shipments outside the region. With the assumption that the conflict is behind us and activity starts to normalize towards the latter part of the quarter, we believe the conflict would result in about $30 million to $50 million profit impact over the first half of the year. However, we are very encouraged about second half 2026 along with increasing confidence in activity levels in 2027 as the region rebounds in response to a growing need for energy security, we believe we will be well positioned to assist our customers in their efforts to normalize operations and provide that energy to the world. From a segment perspective, WCC revenue was largely flat year over year with higher liner hangar activity partly offsetting lower cement addition products and Tubular Running Services activity in MENA. DRE revenue declined 8% year over year, primarily from lower activity in Latin America, MENA and North America, partly offset by higher wireline and drilling services activity in Europe. Pri revenue declined 11% year over year, mostly driven by the sale of our pressure pumping business in Argentina, partly offset by higher subsea intervention activity across all three segments. Our product lines continue to benefit from differentiated technology, a strong installed base and the operational and manufacturing capability we have built over the past several years. Our first quarter adjusted EBITDA margin came in at 20.2%. Typical Q1 seasonality resulted in lower margins and that was further exacerbated starting in March by the Iraq conflict. We remain focused on productivity and cost actions to support margin performance and barring the Iraq conflict persisting, we believe they will result in margin expansion in the second half of 2023. We are also taking further actions to fine tune our portfolio through a series of small non core divestitures. These will each be smaller than our Argentina pressure pumping divestiture. By divesting these businesses should remove lower margin revenue from our portfolio base, reduce capital intensity and align with our strategic priorities. Our adjusted free cash flow for the first quarter was $85 million which was supported by very strong collections across most of our geographies including continued progress on payments from our largest customer in Mexico. Importantly, our Q1 working capital efficiency improved by approximately 100 basis points sequentially reflecting disciplined execution and the positive impact of continued strong collections. We believe free cash flow conversion will improve for the full year versus our prior expectations with continued progress towards our 50% through cycle target. Turning to our segments, slide 7 through 9 lay out key highlights during the quarter we continued to build momentum with new contract wins across our portfolio and key regions. These wins are a testament to our operational and technical capabilities to deliver a range of differentiated technology and cost effective solutions for our customers. I’m especially encouraged by key awards this quarter quarter including a multi year integrated completions contract with Total Energies in Denmark, a five year Tubular Running Services contract with Phu Quoc POC in Vietnam and a multi year contract with Shell to provide artificial lift in Argentina. On the operational side. In our PRI segment we completed the first half a week casing system deployment in the UK sector of Liverpool Bay. We also achieved important milestones in the Kingdom of Saudi Arabia where we set a new global record for extended reach y line work logging over 29,000ft measured depth with our compact well shuttle system successfully executed the first rigless through tubing sand control gravel pack there restoring a shut in gas well without a workover rig and we also successfully trialed our rod lift system at the Jafura gas field. Now turning to our outlook as we near the second half, we are encouraged by a number of contract awards and project startups that are that should lead to noticeable second half growth over the first half. However, it goes without saying that the conflict in the Middle east must conclude and operations must normalize to pre conflict levels. These startups in the second half include Argentina, UAE, Brazil, Australia, Indonesia and Egypt. We are encouraged that second half 2026 international revenues could possibly be up year on year and are constructive on 2027 being a year of growth. Furthermore, we are seeing early signs of improvement in offshore deepwater activity underpinned by rising service related demands in core basins such as Gulf of America, Brazil, the Caribbean and the Caspian Sea. With that, I’d like to turn the call over to Anuj.

Anuj

Thank you Girish Good morning and thank you everyone for joining us on the call. Girish has already shared an overview of our first quarter performance. For a more detailed breakdown of the results, please refer to our press release and accompanying slide deck presentation. My comments today will center around our cash flow working capital balance sheet, liquidity, capital allocation and guidance. Turning to Slide 21 for cash flows and liquidity in the first quarter we generated $85 million of adjusted free cash flow, representing a 36.5% adjusted free cash flow conversion. This compares favorably to the 26.1% conversion we delivered in the first quarter of 2025 and was supported by very strong collections across most of our geographies, including continued progress on collections from our key customer in Mexico. While sizable collections remain outstanding, recent payment trends have remained consistent, reinforcing our confidence in the full year free cash flow outlook. Our adjusted net working capital as a percentage of revenues was 27.9% in the first quarter, a sequential improvement of approximately 100 basis points driven largely by improved collections relative to the revenue base supported by continued collections from our key customer in Mexico. While the year over year comparison remains affected by the revenue base decline, we are encouraged by the direction of travel. All things considered, we remain fully committed to our internal initiatives aimed at achieving the goal of 25% or better. As we stay agile and adapt to evolving market conditions, we continue to execute on a series of cost improvement actions across the company during the first quarter. Our cost optimization efforts remain guided by two objectives. First, we are right sizing elements of our cost structure including headcount, real estate and supply chain footprint to better align with activity levels with a clear focus on ensuring each incremental dollar invested supports profitability. Second, we are maximizing the productivity of the current cost base by leveraging shared services, digital platforms and artificial intelligence to enhance efficiency and margin performance. We have seen the impact of these cost actions in the first quarter and they have helped partially offset the impact of revenue decrementals, pricing pressure, geopolitical conflict in the Middle east and the Argentina divestiture impact during the first quarter CapEx was $54 million or 4.7% of revenues, down approximately $23 million compared to the first quarter of 2025. As we align our budgets with the current market conditions, we continue to expect the midpoint of CAPEX for the full year 2026 to decline relative to 2025. Given our investment in our infrastructure programs, the mix of our capex spend in 2026 will be noticeably different. Our CAPEX on product and service line assets will decline commensurate with market activity and and the completion of build out on key projects, but we will see an increase in IT related spend on our ERP systems. We continue to remain in the 3 to 5% range that we have laid out and will make the appropriate and prudent trade offs through the cycle with cash returns guiding our decisions. In the first quarter of 2026, we returned $30 million to shareholders comprising $20 million in dividends and $10 million in share repurchases, reflecting the 10% increase in the quarterly dividend announced in January. Since the inception of the shareholder return program, we have now returned more than $330 million to shareholders via share repurchases and dividends. Our balance sheet remains very strong. At the end of the first quarter we had approximately $1.05 billion of cash and restricted cash and our net leverage ratio remained well below 0.5 times. This outcome reflects our focus on strengthening the capital structure over time. Our stronger than ever balance sheet provides a solid foundation to not just navigate business operations in a challenging environment, but also pursue strategic opportunities. Turning to second quarter 2026 guidance on slide 22, we expect revenues to be in the range of 1.017 billion to $1.110 billion and adjusted EBITDA to be between 195 million and 220 million. The sequential decline in the range is primarily a function of the Iran conflict and the operational disruptions in the Middle East. We expect adjusted free cash flow in the second quarter to be broadly in line with first quarter levels for the full year 2026. We have greater confidence in the second half ramp, but are refining our guidance ranges to reflect the impact of the Iran conflict. In the first half. Revenues are now expected to be in the range of 4.5 billion to 4.95 billion and adjusted EBITDA is expected to be in the range of 945 million to 1.075 billion. Adjusted free cash flow conversion is now expected to be in the mid 40% range, reflecting increased confidence on collections combined with their operational initiatives and their effective tax rate is expected. Expect it to be in the low to mid 20% range for 2026. Thank you for your time today. I will now pass the call back to Girish for his closing comments.

Girish

Thanks Anuj. Before we open it up to questions, I want to step back and address the macro backdrop as I know it’s the lens every one of you is applying to our results and to our guide. The first quarter unfolded against the most severe disruption to the physical oil market in the industry’s history. I want to acknowledge and recognize the leadership, efforts and resilience of our colleagues, customers and partners across the Middle east region. Our people performed extraordinarily through this period, operations continued in a lot of cases and the attitude and focus of our team was frankly one of the proof points I’m proudest of this quarter. The conflict in Iran, the closure of the Strait of Hormuz in early March and the subsequent damage to infrastructure across the Gulf pulled roughly 20% of seaborne crude and significant LNG volumes out of the market almost overnight. Several well respected sources have indicated this will take months to years to fully repair. The IEA has characterized this as the largest supply disruption in the history of the global oil market and I don’t think that framing is hyperbole. The April 8 ceasefire was a welcome development, but OPEC output supply fell by more than 9 million barrels a day, month on month and prompt physical cargoes are still trading at meaningful premiums to the Strip. Even right now. It is clear with the daily announcements and volatility that the notion of the Strait being completely open to passage …

Full story available on Benzinga.com

This post was originally published here

Boeing Co. (NYSE:BA) CEO Kelly Ortberg on Wednesday expressed optimism about the aircraft manufacturer’s orders from Chinese airlines ahead of President Donald Trump‘s meeting with Chinese President Xi Jinping.

Confident About China Deals

During Boeing’s earnings call with investors, Ortberg was asked about the developments of Boeing’s orders from Chinese airlines. “I think that’s dependent on the U.S.-China negotiations and relations,” Ortberg said, adding that he was “confident” the negotiations would result in agreements that would be at the country level. “I’m confident that that will include some aircraft orders,” Ortberg said in the conference.

data-variant=”card”
data-news-mode=”manual”

>


Read Also:

Trump Would ‘Love’ Someone To Buy Spirit Airlines, Floats Federal Aid, But DOT Secretary Sean Duffy Is Skeptical: ‘Why Would We…’

This post was originally published here

Neptune Insurance Hldgs (NYSE:NP) reported first-quarter financial results on Wednesday. The transcript from the company’s first-quarter earnings call has been provided below.

This content is powered by Benzinga APIs. For comprehensive financial data and transcripts, visit https://www.benzinga.com/apis/.

Access the full call at https://events.q4inc.com/attendee/239893151

Summary

Neptune Insurance Holdings Inc reported a record first quarter with revenue of $37.8 million, a 29% increase year over year, and net income of $7.3 million.

The company launched ATLAS Plus, an AI-driven agent assistant, and a beta version of Neptune’s application inside ChatGPT to improve agent engagement and customer interaction.

Neptune Insurance Holdings Inc announced a $100 million stock repurchase program funded through free cash flow over the next two years.

The company is focused on AI-driven growth with an emphasis on increasing efficiency and expanding its data-driven underwriting capabilities.

Full-year 2026 expectations have been raised to a revenue target of $195 million and adjusted EBITDA margins between 60% and 61%.

Full Transcript

OPERATOR

Thank you for standing by. My name is Angela and I will be your conference operator today. At this time I would like to welcome everyone to the Neptune Insurance holdings first quarter earnings call. All lines have been placed on mute to prevent any background noise. After the speaker’s remarks, there will be a question and answer session. If you would like to ask a question during this time, simply press star followed by the number one in your telephone keypad. If you would like to withdraw your question, press star one again. Thank you. I would now like to turn the call over to Mr. John Carlon, Director of Corporate Development. You may begin.

John Carlon (Director of Corporate Development)

Thank you and good afternoon. With me here today is Trevor Burgess, Chairman and CEO Matt Duffy, President and Chief Risk Officer and Jim Steiner, CFO and COO. Before we begin, I’d like to remind everyone that today’s discussion will include forward looking statements, including among others, statements about our expectations for our future financial performance, growth opportunities, business strategy, market trends and capital allocation plans. These statements are based on our current views and assumptions and are subject to risks and uncertainties that could cause actual results to differ materially. We direct you to our recent SEC filings for a full description of these risks. We undertake no obligation to update any forward looking statements, whether as a result of new information, future events or otherwise, except as required by law. We will also reference certain non GAAP financial measures. These measures should be considered only as supplements to their comparable GAAP measures. Additional information, including reconciliations of the non GAAP measures to their most comparable GAAP measures can be found in our earnings release@investors.neptuneinsurance.com and in our current report on Form 8K that was publicly filed with the SEC on April 22, 2026. And now I’d like to turn the call over to Trevor. Good evening and thank you for joining us for Neptune’s first quarter earnings call. Before we review the quarter, I wanted to talk about how excited I am by this moment in the history of technology. I was an investment banker during the first.com boom. I built one of the first technology first banks and now am leading one of the first AI native public companies. What AI has enabled in the last few months has far surpassed anything I’ve seen before. This is the power of the exponential. The Neptune team has the horse by the reins and is building something very special. People often ask how we think about AI at Neptune. The answer goes back to the very beginning in 2018 when we hired our first engineers. I put a sign on the wall that said no humans, not because we don’t value people. But because we wanted to build a system where technology could do what humans cannot, faster, more consistently and at scale. What is now being described as AI native we simply viewed as the right way to build from day one. That mindset continues to guide us today. We don’t start with today’s constraints and optimize around them. We start with where the world is going and build towards that future. And as the technology continues to evolve, the gap between NEPTUNE and traditional insurance platforms is not narrowing, it is widening. AI also creates a significant opportunity to expand the market. Tens of millions of properties in the United States remain uninsured for flood risk. By using AI to improve risk awareness, simplify the buying process and support agents with better tools, we believe we can meaningfully grow the insured base over time. That brings me to what we are seeing in the business today. Last quarter I spoke about turning agents into what we call super agents. We are now seeing that come to life. Following quarter end, we launched in a beta release ATLAS plus, our agentic assistant for insurance agents. ATLAS can answer questions, generate sales materials and interact directly with quotes in real time. Early feedback has been extremely strong, including examples of policies being sold directly. As a result of these interactions over time, we expect ATLAS to become a core part of the sales workflow. Importantly, these capabilities are built on top of what we believe is one of our most important advantages, our proprietary data. Our platform has processed tens of millions of quotes and over a million policies, generating real world underwriting, pricing and behavioral data that continuously improves our models. We believe that data advantage will continue to compound over time and create a structural barrier to entry in an AI driven market. From a financial perspective, the implications are equally important. In 2025 we operated at a 60% adjusted EBITDA margin. As AI continues to reduce friction in distribution and automate workflows, we believe our current level is a floor and not a ceiling. Turning to the quarter the first quarter of 2026 was a record first quarter for Neptune and reflected continued strength across the business. Highlights from Q1 include revenue of 37.8 million, a 29% increase year over year, net income of 7.3 million with adjusted net income of 13.4 million. Adjusted EBITDA was 21.6 million, that’s growth of 26%. Written premium was 86.7 million, driving 32% year over year. Premium enforced growth and we had record first quarter new business sales. As a reminder, the first quarter is typically our lowest margin quarter due to seasonality and this year that effect is more pronounced as public Company audit and compliance costs are front end loaded in Q1. As a result, adjusted EBITDA margin in the quarter was approximately 57.1%. Importantly, this is a timing dynamic, not a structural change in the business and we continue to expect full year margins in the 60 to 61% range. Premium in force reached approximately 389 million at quarter end and we look forward to celebrating our 400 million threshold shortly. As a reminder, NEPTUNE operates as an asset light MGA and takes no balance sheet risk. This allows us to scale efficiently while maintaining strong profitability. On a trailing twelve month basis, revenue per employee reached 2.8 million and adjusted EBITDA per employee reached 1.7 million, both record levels. To put our revenue per employee in context, do this calculation for other companies. This is how you can tell if a company is really AI native In addition to our earnings results, today we announced that our board has approved a $100 million stock repurchase program. We expect to fund this program through free cash flow over the next two years. This is incremental to our previously announced plan to retire shares associated with RSU tax settlements, review share repurchases as a high return use of capital. Given the strength of our cash generation and the scalability of our model, stepping back, we believe our competitive position is defined by three core proprietary data and AI driven underwriting, deep and expanding capacity relationships and flexible technology enabled distribution. Together these create a durable and widening moat. I’ll now turn things over to Matt to walk through the business in more detail.

Trevor Burgess (Chairman and CEO)

Thank you Trevor. Q1 was a very strong quarter for our system and our team of 62 exceptional employees across our three core pillars. We continued to adapt, innovate and perform with the results able to speak for themselves. Starting with technology, Trevor touched on the pace of change we’re seeing in technology inside neptune. That’s showing up in a very tangible way and I’ll be honest, it’s hard to capture in an earnings call just how fast things are moving. Internally, our team is building with tools that didn’t exist a matter of months ago, and they’re using them to rethink how we build, how we operate and how we serve our agents and customers. You can see that directly in the pace of product development coming out of the company. During and immediately following the first quarter, we rolled out three major technology advancements, all of which lay the groundwork for a continued redefinition of how our system is utilized, accessed and built. The first is Atlas, which is the AI layer we’re building across the NEPTUNE platform and which we introduced in April through an initial beta experience for a small group of agents. This beta is a conversotional interface embedded directly into the quoting workflow. Agents can ask questions, adjust coverage, and move through the quote to bind process using natural language. In the first couple of weeks, we’ve seen thousonds of agent interactions, which tells us this fits naturally into how agents already work. And this is just the starting point. Over the coming quarters, we expect ATLAS to expand beyond this initial interface and become a core part of how users interact with NEPTUNE across our platform. The second is our neptune application inside ChatGPT, which gives property owners a new way to interact with our platform. Instead of navigating a traditional quoting flow, users can ask questions about flood risk in plain language and receive a real time NEPTUNE quote directly within the interface. What’s important here is less the interface itself and more what it represents. As conversotional AI continues to evolve, we expect experiences like this to play an increasing role in how people access information and make decisions. And the third is Proteus, an internally developed AI software developer. The way we think about this is pretty simple. Our engineers are exceptionally talented and their highest value comes from problem solving, system design and building new capabilities, not from spending time on execution that can be automated. So we’ve built Proteus as a set of agent-like tools and skills that can take on that execution work. Proteus writes code, reviews, it completes development tasks and monitors the system in real time. It allows our engineers to stay focused on the critical thinking and design work that actually moves the platform forwards. In March alone, Proteus was responsible for over 30% of the engineering tickets completed. Put differently, that’s nearly a 50% increase in the amount of work the team is shipping. And you can feel that inside the company, things that used to take weeks are getting done in hours, and ideas we’ve had for years are now becoming feasible projects. Each of these changes I’ve discussed is powered by the data running through our system. Tens of millions of quotes, over a million bound policies, and constant interaction from tens of thousonds of agents. And as they evolve, these changes will continue to represent a fundamental shift in how neptune’s platform is accessed, how it’s used, and how it’s built. Turning to capacity, during the quarter, we renewed one of our eight programs, increasing the size of that program for the 2627 treaty period and adding two new reinsurers, bringing our total panel to 42 capacity providers. Program renewals are important milestones for the business. They reflect long term relationships and a track record of consistent underwriting performance. In this case, we sow the program grow and terms update in a way that reflect the results we’ve delivered. That’s been a consistent pattern for us. As the platform scales and the data continues to improve, our capacity partners are growing alongside us and finally, distribution. Our growth continues to be supported by the strength of our agent network, which remains an important part of how we reach and serve property owners across the country. During the first quarter we delivered record first quarter new business production driven by strong agent engagement and continued deepening of distribution relationships. One of the clearest indicators of that momentum is user based activity. Since launching our new user based login system in December, more than 45,000 individual agents have signed up for direct access to Neptune, and that number continues to grow daily. To be clear, this is not the total number of agents we work with, but rather the number of individual users who created direct accounts using their email and phone number and verified that access by a Multi Factor authentication on the platform between December and March, and nearly 11,000 of those users have already bound new business policies in that some timeframe. Those stats show the real scale of how the platform is being used and the associated data allows us to build better tools and experiences around how agents actually work. We continue to invest heavily in our agents through building tools and products that are driving adoption and helping us to help insurance agents become increasingly effective. I’ll summarize with this. What you’re seeing here is a system, an ecosystem that gets better in real time, faster to build, easier to use, and more valuable to the agents, customers and capacity providers that are a part of it. And that’s really how this business can continue to compound over time. As we head into hurricane season, which is typically our busiest period, that level of performance really matters. With that, I’ll turn it over to Jim.

Matt Duffy (President and Chief Risk Officer)

Thanks, Matt. The first quarter reflects another strong period of execution with continued growth in revenue, strong retention across the portfolio, and sustained profitability. Revenue for the quarter increased 28.8% year over year to 37.8 million, driven by record first quarter new business production and the continued expansion of our premium in force. Adjusted EBITDA increased 26% to 21.6 million, which demonstrates that revenue growth didn’t come at the expense of operating discipline. We continue to see strong performance on renewals. Premium retention remains high, reflecting both the value of our product and the consistency of our pricing approach. The Q1 adjusted EBITDA margin was 57.1%, even though substantially all of our public company accounting costs hit the P and L during the first quarter. Again, this is a timing dynamic, not a structural change in the business. And we continue to expect full year adjusted EBITDA margins in the 60 to 61% range. Stepping back, the underlying economics of the model remain very strong. A reminder on the model, we don’t carry any of the underwriting risk, the carriers do. What we carry is the technology that decides which risk to bind, who to bind them with and at what price. That means we grow by adding policies, not by adding capital. And we scale by writing more code, not by hiring underwriters. We track our employee metrics as key indicators of our performance. Revenue per employee was 2.8 million on a trailing twelve month basis. Adjusted EBITDA per employee was 1.7 million. Both metrics are up double digits year over year. These headcount ratios hold the roof up on the whole margin story. If we had to add one employee for every few …

Full story available on Benzinga.com

This post was originally published here

Microsoft Corp. (NASDAQ:MSFT) had been reportedly eyeing AI coding startup Cursor before SpaceX made headlines with its $60 billion acquisition option of the company.

The Satya Nadella-led company’s interest in Cursor was part of its strategy to expand its artificial intelligence tools in the rapidly growing AI market.

However, the tech giant ultimately chose not to move forward with a bid, CNBC reported on Wednesday.

Microsoft and Cursor did not immediately respond to Benzinga‘s request for comments.

data-variant=”card”
data-news-mode=”manual”

>


Read Also:

Xbox Price Cuts: Microsoft Slashes Game Pass Rates to Win Back Fans

This post was originally published here

STMicroelectronics (NYSE:STM) held its first-quarter earnings conference call on Thursday. Below is the complete transcript from the call.

Benzinga APIs provide real-time access to earnings call transcripts and financial data. Visit https://www.benzinga.com/apis/ to learn more.

Access the full call at https://event.choruscall.com/mediaframe/webcast.html?webcastid=fXICoiPS

Summary

STMicroelectronics reported first-quarter net revenues of $3.1 billion, with a contribution from the NXP MEMS sensor business acquisition.

The company experienced strong growth in segments like automotive and industrial, with significant design wins in electric vehicles and AI data centers.

Gross margin was 33.8%, negatively impacted by temporary suboptimal efficiencies due to manufacturing transitions.

Free cash flow was negative $720 million, primarily due to the $895 million cash out for the NXP MEMS acquisition.

Strategic initiatives include integrating ST products with Nvidia’s robotics ecosystem and expanding engagement with AWS for AI data centers.

Future outlook includes expected Q2 revenues of $3.45 billion and a gross margin of 34.8%, with plans to achieve double-digit growth in 2026.

Full Transcript

Moira (Operator)

Ladies and gentlemen, welcome to the STMicroelectronics First Quarter 2026 Earnings Release Conference Call and live webcast. I am Moira, the chorus call operator. I would like to remind you that all participants will be in listen only mode and the conference has been recorded. The presentation will be followed by a Q and A session. You can register for questions at any time by pressing 1 on your telephone. For operator assistance, please press and 0. The conference must not be recorded for publication or broadcast at this time. It is my pleasure to hand over to Jerome Bramel, EVP Corporate Development and Integrated External Communication. Please go ahead.

Jerome Bramel (EVP Corporate Development and Integrated External Communication)

Thank you Moira thank you everyone for joining our first quarter 2026 financial result call. Hosting the call today is Jean Marc Cheri, ST President and Chief Executive Officer. Joining Jean Marc on the call are Lorenzo Grandi, President and CFO and Marco Cassis, President Analog power and discrete MEMs and sensor groups and Head of ST Microelectronics Strategy System, Research and Application and Innovation Office. These live webcasts and presentation materials can be accessed on STMicroelectronics Investor Relations website. A replay will be available shortly after the conclusion of this call. This call will include forward looking statements that involve risk factors that could cause ST results to differ materially from management expectations and plans. We encourage you to review the Safe harbor statement contained in the press release that was issued with the result this morning and also in ST most recent regulatory findings for a full description of these risk factors. Also, to ensure all participants have an opportunity to ask questions during the Q and A session, please limit yourself to one question and a brief follow up. Now I’d like to turn the call over to Jean Marc Cheri, ST President and CEO.

Jean Marc Cheri (President and Chief Executive Officer)

Thank you Jerome. Good morning everyone and thank you for joining ST for Q1 2026 earnings conference call. I will start with an overview of the first quarter including Business Dynamics and I will hand over to Lorenzo for the detailed financial overview. I will then comment on the outlook and conclude before answering your questions. So starting with Q1, our first quarter net revenues were $3.1 billion including about $40 million revenues associated with NXP’s MEM sensor business which we acquired during the quarter. Excluding this contribution on a sequential basis, net revenues were above the midpoint of our business outlook range, driven mainly by higher revenues in our engaged customer programs in personal electronics and in communication equipment computer peripheral. Gross margin was 33.8% or 34.1% excluding the impact of the purchase price allocation so called ppa. Following our acquisition of NXP MEM Sensor business excluding impairment, restructuring charges and other related phase-out costs and purchase price allocation effects from our acquisition of NXP MEM Sensor business non US GAAP diluted earnings per share was $0.13 during the first quarter. Inventory in our balance sheet increased slightly and we continue to work down inventories and distributions. They are now normalized. We generated a negative $720 million free cash flow including $895 million cash out related to the payment of our acquisition of NXP MEM Sensor. Let’s now discuss our business dynamics during Q1. Well, first we had a strong booking momentum during Q1 with booked to be well above 1 across all end markets and regions in automotive during the quarter, revenue declined 10% sequentially year over year revenues increased 15%, marking the return to your overall growth. Automotive design momentum progressed with various OEM and Tier one ecosystems. We had design wins across electric, hybrid and traditional vehicles spanning onboard chargers, DC DC converters, powertrain, active suspension, vehicle control electronics. Key products include power semiconductors, smart power devices, automotive microcontrollers, analog devices and sensors. In February, we completed the acquisition of NXP’s MEMS sensor business. The acquired technology and product portfolio are highly complementary to eSteeze and strengthen our automotive sensor business. We are progressing as planned with the integration into our portfolio and operational flows. Industrial decreased by 1% sequentially and improved 26% year over year. Importantly, inventories in distribution further decreased and are now normalized in industrial Our broad portfolio of microcontrollers, sensing, analog and power devices is strongly aligned with industrial transformation trends and the evolving needs of physical AI. During the quarter we saw design wins across industrial automation and robotics, building automation, power systems, health care and home appliances. We announced our collaboration with Nvidia to integrate ST sensors, microcontrollers and motor control solutions with Nvidia robotics ecosystem. This aims to help developers design, train and deploy humanoid robots and other physical AI systems with higher efficiency, readability and scalability. We are also proud to have been ranked the number one vendor worldwide for general purpose microcontrollers for the fifth consecutive year based on research by UBDIA. During March, we announced that the first batch of STM32 wafers fully produced in China for ST by our partner Waiwan has been delivered to customers in China. This was a major step forward in St China 4 China supply chain strategy for personnel electronics first quarter revenues were down 14% sequentially reflecting the seasonality of our engaged customer programs and up 21% year over year reflecting increasing content. During the quarter we reinforced our position in mobile platforms and connected consumer devices supported by both engaged programs and a broad open market portfolio spanning sensors, secure solutions and power management. We announced Super Formation Sensing and secure wireless technology on Qualcomm Technologies newly launched personal AI platform based on ST smart sensor and secure NFC controllers for communications equipment and computer peripherals. First quarter revenues were above our expectations, up 3% sequentially and 41% year over year. We continue to reinforce our position as a supplier of critical semiconductors that power, cool and connect AI data centers from the grid to the core and from the core to the user. ST is now strategically positioned to capture upside from new AI driven program leveraging specialized technologies to enable the evolving AI infrastructure. We confirm our data centers revenue expectation to be nicely above 500 billion US

Lorenzo Grandi (President and Chief Financial Officer)

dollars for 2026 and well above $1 billion for 2027. In a major development, we expanded our strategic engagement with Amazon Web services through a multi year multibillion US dollar commercial engagement to enable new high performance compute infrastructure for cloud and AI data centers. This engagement covers a broad range of semiconductor solutions leveraging ST portfolio of proprietary technologies. During the quarter we secured multiple design wins for silicon and silicon carbide based power solutions. This supports the drive for higher power density and increased energy efficiency for next generation AI computer and data center architectures. We announced the expansion of our 800 volt DC AI data center power conversion portfolio with new 12 volt and 6 volt architectures in collaboration with Nvidia. With this, ST now provides a complete portfolio for the 800 VDC power distribution inside gigawatt scale compute infrastructure leveraging ST power, analog and mixed signal and microcontrollers products. We also announced the start of high volume production for our silicon Photonics based photonics IC100 PIC100 platform used by hyper scalers for optical interconnected for data centers and AI clusters. The technology enables higher boundaries, low latency and greater energy efficiency. As I mentioned last quarter, the momentum in optical interconnect technologies is also driving demand growth for our high performance microcontrollers in pluggable optics. We are also seeing initial demand for our secure element in data server power supply units to support authentication and detect data manipulation attacks. Our Low Earth orbital satellite business, based mainly on our bicymos and panel level packaging technologies strongly progressed during the quarter. We were selected to develop a power amplifier controller for direct to cell satellites based on our proprietary BCD technology by our main Low Earth Orbike customer and we continue to ramp shipments to our second largest customer. For sustainability, we issued our annual integrated report during the quarter. This report integrates our sustainability statement detailing our performance in 2025. We made further progress and remain on track for our commitment to becoming carbon neutral by 2017 on scopes one and two and on product, transportation, business travel and employee commuting. For scope three, we also target the sourcing of 100% renewable electricity by 2027 and achieve 86% in 2025. Now over to Lorenzo who will present our key financial figures. Thank you Jean Marc Good morning everyone. Let’s start with a detailed review of the first quarter. Starting with revenues on a year over year basis by reportable segment. Analog products, MEMS and sensor grew 23.2% mainly due to imaging and MEMS and to a lesser extent analog power and discrete product decreased 1.8%. Embedded processing revenues were up 31.3% due to general purpose MCU and to a lesser extent custom processing and RF and optical communication grew 33.9% by end market. Communication equipment and computer peripherals grew 41%, industrial 26%, personal electronic 21% and automotive 15% year over year. Sales to OEMs and distribution increase at 24.5% and 19.2% respectively. On a sequential basis, analog product, MEMS and sensor decreased by 9.1%, power and discrete by 5.4%, embedded processing by 4% and RF optical communication by 9%. By end market on a sequential basis, communication equipment and computer and peripheral was up 3% while the other end markets declined. Industrial was down 1%, automotive 10% and personal electronic 14%. Turning now to profitability, gross profit in the first quarter was $1.05 billion increasing 24.3% on a year over year basis. Gross margin was 33.8% increasing 40 basis points year over year mainly due to lower unused capacity charges and better product mix on a sequential basis. Gross margin decreased by 140 basis points. Gross profit included $11 million purchase price allocation effects from our acquisition of NXP’s MEMS sensor business. Non US GAAP gross margin excluding this item was 34.1%. Excluding the impact of NXP’s MEMS sensor business and related BPA effects, gross margin stood at 33.9 20 basis points better than the midpoint of ST guidance which did not include impact related to our acquisition of NXP’s MEMS sensor business. Q1 gross margin included about 50 basis points of negative impact resulting from a non recurring cost related to our manufacturing reshaping programs. The negative impact on gross margin from the just mentioned non-recurring cost is expected to remain at similar level over the rest of the year. Total net operating expenses excluding Restructuring amounted to $904 million in the first quarter. Excluding the purchase price allocation PPA effects from our acquisition of NXP’s MEM sensor business, non US GAAP opex stood at 885 million. Non US GAAP net opex included OPEX related to the acquired NXP MEMS sensor business and a one off impact related to a settlement with a supplier. Excluding these two items, non US GAAP net opex was broadly in line with the expectations given in January, which did not include any impact related to our acquisition. For the second quarter of 2026 we expect a non US GAAP net opex to stand between 950 and 960 million dollars. The sequential increase is mainly due to calendar days effect, startup costs and one incremental month of OPEX related to the acquired NXP MEMS sensor business. Excluding these items, Q2 26 and non US GAAP net opex would slightly decrease sequentially in light of Our acquisition of NXP’s MEM sensor business and the new AI revenues opportunity. Let me give you some more color on the 2026 OPEX for a full year 2026 we now expect like for like net OPEX to be up mid to high single digit year over year versus our previous expectation for a low single digit increase as we are accelerating our investment in new business opportunities including NXP’s MEM sensor business acquisition and the exchange rate impact net opex should be up low double digit year over year. In the first quarter we reported a $70 million of operating income which include $71 million for impairment, restructuring charges and other related phase out costs. These charges are related to the execution of the previously announced company wide program to reshape our manufacturing footprint and resize our global cost base. Q1 operating income also included $30 million purchase price allocation effects from our acquisition of NXP’s MEMS sensor business. Excluding these items, Q1 non US GAAP operating income stood at $171 million. A non US GAAP operating margin was 5.5% with analog product, MEMS and sensors at 12.2%, power and discrete at negative at 21.5%, embedded processing at 16.9% and RF optical communication at 14. First quarter 2026 net income was $37 million compared to a net income of $56 million in the year ago quarter. Diluted earnings per share were 0.$04 compared to $0.06 one year ago. Non US GAAP net income stood at $122 million and non US GAAP diluted earning …

Full story available on Benzinga.com

This post was originally published here

The S&P 500 surged on Wednesday, rising 1.05% to close at a record 7,137.90, as easing geopolitical fears and strong earnings lifted market sentiment.

However, the Polygon-based (CRYPTO: POL) Polymarket crowd is turning sharply bearish heading into Thursday. The April 23 market shows just about 13% of traders betting “Up,” with the majority expecting a lower open for the benchmark index.

Why That Number Matters

Wednesday’s rally pushed the S&P 500 to fresh all-time highs, extending a run driven by optimism around a ceasefire extension between the U.S. and Iran and a solid start to earnings season.

However, geopolitical tensions remain unresolved. Iran has signaled reluctance to engage in talks, while reports indicate seizures of container ships in the Strait of Hormuz, keeping concerns around global energy supply elevated.

At the same time, …

Full story available on Benzinga.com

This post was originally published here

Economist Justin Wolfers on Thursday weighed in on the evolving dynamics of the Iran war, arguing the strategic landscape has fundamentally shifted—not just because of what Iran can do, but because those capabilities are now widely understood.

Wolfers Highlights Impact of ‘Revealed Vulnerability’

Wolfers wrote on X, “Bottom line: the issue isn’t only what Iran can do. It’s that everyone now knows what Iran can do. Revealed vulnerability changes bargaining power,” underscoring how transparency in military or strategic capability can alter negotiations.

data-variant=”card”
data-news-mode=”manual”

>


Read Also:

Justin Wolfers Talks Gold And Oil, Says Only One Is An ‘Essential …

This post was originally published here

Shares of United Rentals Inc (NYSE:URI) rose sharply in pre-market trading after the company reported better-than-expected first-quarter financial results and raised its FY26 sales guidance.

United Rentals reported quarterly earnings of $9.71 per share which beat the analyst consensus estimate of $8.97 per share. The company reported quarterly sales of $3.985 billion which beat the analyst consensus estimate of $3.877 billion.

United Rentals shares jumped 14.6% to $920.05 in pre-market trading.

Here are some other stocks moving in pre-market trading.

Gainers

  • Pineapple Financial Inc (NYSE:PAPL) gained 55% to $0.93 in pre-market trading after the company announced it expanded its share buyback program to $15 million.
  • Akanda Corp (NASDAQ:AKAN) gained 44% to $14.70 in pre-market trading after jumping 214% on Wednesday.
  • cbdMD Inc (NYSE:YCBD) rose 30.1% to $1.21 in pre-market trading after gaining 10% on Wednesday.
  • System1 Inc (NYSE:SST) jumped 23.6% to $3.46 in pre-market trading after gaining 7% on Wednesday.
  • Functional Brands Inc (NASDAQ:MEHA) rose 21.2% to $0.16 in pre-market trading after the Oregon-based company announced a strategic partnership with artificial intelligence platform partnrup.ai for its digital health unit Tru2u.health.
  • Quantumscape Corp (NASDAQ:QS) …

Full story available on Benzinga.com

This post was originally published here

Tesla Inc.‘s (NASDAQ:TSLA) ties to Elon Musk-led SpaceX just got deeper with a new investment in the commercial space flight company amid Terafab collaboration.

$2 Billion Investment

In its quarterly earnings report released on Wednesday, the EV giant shared its investment in SpaceX. The EV giant’s report showed a $2 billion charge due to its “SpaceX equity investment.” The company also expanded on why its collaboration with the company mattered.

data-variant=”card”
data-news-mode=”manual”

>


Read Also:

Intel Needed A Lifeline. It Just Got One — And It’s Got Elon Musk’s Name On It

This post was originally published here

Former Canadian Prime Minister Justin Trudeau on Thursday revealed that economic pressure from Western allies had risked pushing Canada closer to China.

Speaking at the CNBC CONVERGE LIVE event in Singapore, Trudeau said the U.S. and Europe had “almost driven” Canada “into China’s arms” during a period of intense competition in the aerospace sector.

‘Dump Truck Full Of Money’ On The Table

He pointed to the struggles of Canadian aircraft maker Bombardier (OTC:BDRPF) and its C Series aircraft program, launched in 2008. According to Trudeau, pressure from rivals Airbus (OTC:EADSF) and Boeing (NYSE:BA) made it difficult for Bombardier to secure airline buyers, opening the door for Chinese investors to step in with what he described as a “dump truck full of money.”

Canada ultimately avoided a Chinese deal after Airbus took a majority stake in the program in 2018, later rebranded as the A220. But Trudeau framed the episode as a …

Full story available on Benzinga.com

This post was originally published here

In today’s rapidly changing and highly competitive business world, it is vital for investors and industry enthusiasts to carefully assess companies. In this article, we will perform a comprehensive industry comparison, evaluating Microsoft (NASDAQ:MSFT) against its key competitors in the Software industry. By analyzing important financial metrics, market position, and growth prospects, we aim to provide valuable insights for investors and shed light on company’s performance within the industry.

Microsoft Background

Microsoft develops and licenses consumer and enterprise software. It is known for its Windows operating systems and Office productivity suite. The company is organized into three equally sized broad segments: productivity and business processes (legacy Microsoft Office, cloud-based Office 365, Exchange, SharePoint, Skype, LinkedIn, Dynamics), intelligence cloud (infrastructure- and platform-as-a-service offerings Azure, Windows Server OS, SQL Server), and more personal computing (Windows Client, Xbox, Bing search, display advertising, and Surface laptops, tablets, and desktops).

Company P/E P/B P/S ROE EBITDA (in billions) Gross Profit (in billions) Revenue Growth
Microsoft Corp 27.09 8.22 10.58 10.2% $58.18 $55.3 16.72%
Oracle Corp 33.66 16.08 8.49 11.65% $8.16 $11.1 21.66%
Palo Alto Networks Inc 100.67 15.64 13.03 4.78% $0.64 $1.91 14.93%
ServiceNow Inc 61.72 8.24 8.12 3.31% $0.76 $2.73 20.66%
Fortinet Inc 35.99 52.07 9.79 51.3% $0.69 $1.52 14.75%
Nebius Group NV 1362.28 8.56 74.57 -5.3% $0.01 $0.1 55.85%
Check Point Software Technologies Ltd 14.73 5.12 5.71 10.21% $0.37 $0.65 5.85%
Gen Digital Inc 20.61 5.19 2.63 8.02% $0.57 $0.97 25.76%
Dolby Laboratories Inc 26.29 2.39 4.72 2.04% $0.1 $0.3 -2.88%
UiPath Inc 20.94 2.74 3.68 5.21% $0.09 $0.41 13.56%
CommVault Systems Inc 49.79 19.40 3.76 8.33% $0.03 $0.25 19.5%
Monday.Com Ltd 31.13 2.86 3.01 6.1% $0.01 $0.3 24.59%
BlackBerry Ltd 60.33 4.28 5.91 3.27% $0.04 $0.12 10.09%
Qualys Inc 16.31 5.64 4.83 9.75% $0.06 $0.15 10.11%
Teradata Corp 20.36 11.29 1.60 16.48% $0.08 $0.26 2.93%
A10 Networks Inc 48.51 9.37 7 4.72% $0.03 $0.06 8.29%
Average 126.89 11.26 10.46 9.32% $0.78 $1.39 16.38%

Full story available on Benzinga.com

This post was originally published here

The CNN Money Fear and Greed index showed an increase in the overall market sentiment, while the index remained in the “Greed” zone on Wednesday.

U.S. stocks settled higher on Wednesday, with the S&P 500 and Nasdaq Composite closing at record levels during the session after President Trump extended the ceasefire with Iran.

In earnings, AT&T Inc. (NYSE:T)announced upbeat financial results for its fiscal first quarter of 2026 on Wednesday. Boeing Co. (NYSE:BA) reported better-than-expected results for the first quarter on Wednesday. Calix Inc. (NYSE:CALX) shares dropped 14% on Wednesday following first-quarter results

On the economic data front, U.S. mortgage applications surged 7.8% from the …

Full story available on Benzinga.com

This post was originally published here

On Wednesday, Freddie Mac (OTC:FMCC) and Fannie Mae (OTC:FNMA) announced their acceptance of mortgages evaluated using VantageScore 4.0 to reduce costs for American homebuyers and stimulate competition in the mortgage credit-scoring market.

The mortgage housing behemoths will initiate a limited roll-out to approved lenders. VantageScore is a credit score modeling and analytics firm co-owned by Equifax (NYSE:EFX), Experian (OTC:EXPGF), and TransUnion (NYSE:TRU).

Scott Turner, Secretary of the Department of Housing and Urban Development (HUD), said that adopting new credit-scoring models will expand access to homeownership, especially for borrowers overlooked by older systems.

Bill Pulte, the Federal Housing Finance Agency’s (FHFA) director, proposed allowing Fannie Mae and Freddie Mac to use VantageScore 4.0 in July, marking the first major update to mortgage credit scoring …

Full story available on Benzinga.com

This post was originally published here

The Pentagon announced the departure of Navy Secretary John Phelan on Wednesday, after just over a year in the role.

Chief Pentagon spokesperson Sean Parnell stated on X that Phelan was “departing the administration, effective immediately.” The reason behind this sudden decision was not disclosed. 

Navy Undersecretary Hung Cao is set to take over the role in an interim capacity.

Full story available on Benzinga.com

This post was originally published here

Pegasystems (NASDAQ:PEGA) reported first-quarter financial results on Wednesday. The transcript from the company’s first-quarter earnings call has been provided below.

Benzinga APIs provide real-time access to earnings call transcripts and financial data. Visit https://www.benzinga.com/apis/ to learn more.

Access the full call at https://events.q4inc.com/attendee/156449953

Summary

Pegasystems Inc reported a 30% year-over-year increase in Pega Cloud revenue, with ACV nearing $1 billion, highlighting strong cloud adoption.

The company emphasized its strategic focus on AI, specifically through Pega Blueprint, which is driving pipeline growth and accelerating time to value for clients.

Management commented on geopolitical challenges impacting Q1 performance, but remained optimistic about demand durability and ACV growth acceleration in the second half of 2026 due to renewal cycles and AI-driven initiatives.

Pegasystems Inc’s free cash flow reached $207 million, with over 80% returned to shareholders through share buybacks and dividends.

The company plans to leverage AI strategically, focusing on its role as a harness for enterprise operations rather than relying on AI for all processes, which aligns with its outcome-based pricing model.

Full Transcript

OPERATOR

Thank you for holding. My name is Carli and I will be your conference operator today. At this time I would like to welcome everyone to Pegasystems Inc Q1 2026 earnings call and Webcast. All lines have been placed on mute to prevent any background noise. After the speaker’s remarks, there will be a question and answer session. If you would like to ask a question during this time, simply press STAR followed by the number one on your telephone keypad. If you would like to withdraw your question, press STAR one again. Thank you. I would now like to turn the call over to Peter Welburn, Vice President of Corporate Development and Investor Relations. Please go ahead. Thank you.

Peter Welburn (Vice President of Corporate Development and Investor Relations)

Good morning everyone and welcome to Pegasystems Q1 2026 earnings call. Before we begin, I’d like to read our Safe Harbor Statement. Certain statements contained in this presentation may be construed as forward looking statements as defined in the Private Securities Litigation Reform act of 1995. Words such as expects, anticipates, intends, plans, believes, will, could, should, estimates, may, forecast and similar expressions are intended to identify these forward looking statements. These statements speak only as of the date the statement was made and are based on current expectations and assumptions. Because these statements relate to future events, they’re subject to certain risks and uncertainties that could cause actual results to differ materially from our current expectations for fiscal year 2026 and beyond. Factors that could cause such differences are described in the Company’s press Release announcing our Q1 2026 results and our filings with the securities and Exchange Commission, including our annual report on Form 10K for the year ended December 31, 2025, as well as other recent SEC filings. Investors are cautioned not to place undue reliance on these forward looking statements as there can be no assurances that the results contemplated will be realized except as required by law. We undertake no obligation to update or revise any forward looking statements to reflect subsequent events or circumstances. In addition, non GAAP financial measures discussed on this call should be considered in conjunction with and not a substitute for our consolidated financial statements prepared in accordance with GAAP. Constant currency measures are calculated by applying the March 31, 2025 foreign exchange rates to all periods presented. Reconciliations of GAAP to non GAAP measures can be found in our earnings press release. And with that, I’ll turn the call over to Alan Treffler, Founder and CEO of Pegasystems.

Alan Treffler (Founder and CEO)

Thank you very much, Peter. I’ve just gotten back from a few weeks on the road across MEA and The US and including an AI conference last week. And it’s interesting because I think we’re pretty practiced at separating hype from what’s real. But there is a lot of confusion out there nonetheless. I’m hearing consistent themes from leaders and clients and prospects and partners. In a world of constant disruption, clients want and need innovation without sacrificing reliability. They want solutions to reimagine how their businesses work while still running them predictably and delivering measurable results. This means platforms architected for scale, interoperability and continuous change, where AI is governed, explainable and harnessed in workflows rather than bolted on. That’s what PEGA provides a harness for enterprise AI blueprint to help reimagine how work should run and have people rethink their businesses. And then the PEGA platform to operationalize it with confidence and evolve it as regulatory demand evolve. There’s a lot of noise about the future of the software industry itself and it’s creating some real confusion and some real moments of doubt and bias. Some investors I’ve met unsure what the future looks like and are even questioning the long term viability of enterprise software vendors. Well, we think AI will be good for some and bad for others. And for pega it will be good. The reality is that enterprises don’t succeed based on the alternative of coding past using AI. They succeed based on whether they can design the right outcomes, execute them predictably and evolve safely over time. The assumption that AI generated code can replace architecture is backwards. In mission critical enterprises, AI increases the value of platforms that are architected for predictability, governance, interoperability and continuous change. And that’s us. When outcomes matter with customers, regulators and systems that must evolve from decades, AI generated code still needs structure certainly for the types of things we do. Yeah, very small things, you can just five code them together. But AI doesn’t replace the need to have a business system. Alternatively, if people are using AI to just dynamically reason each process over and over, what we’re seeing, that’s now running of costs and giving non deterministic outcomes at the moment you weaken your enterprise platform, you make your whole business weak. Putting AI in the middle in an ungoverned way, well that’s I think just a recipe for disaster. So whether you use AI to generate code that you want to be able to orchestrate and pull together, whether you use AI to be able to run or handle certain parts of your business where you want the creativity of agent to agent interactions, or whether you want pega, whether you want to use AI to be able to pull together and orchestrate multiple business functions with a harness like PEGA driving that. In all of those cases, Pega adds tremendous value. So let’s talk about how mission critical enterprise software really gets built. Enterprise applications has always been around a continuous life cycle regardless of technology. There’s not a single build moment you need to design and rely on on what the software must do and how it must perform. And that design really can involve collaboration for many parties and having a collaborative environment like Blueprint that brings the power of the Internet, the power of AGA best practices and the power of a customer and or partner’s thinking all together in a way that they can understand, experience and improve is absolutely central. To get it to a great outcome, you got to build it. And there are lots of ways to build it. But the great news about something you’ve done in Blueprint is it’s basically built. You need to be able to execute or operate it, to run it at scale secure, make sure that it’s performant that’s being watched and managed and with tenacloud, which you’ll see is really, really continuing to grow beautifully. We give our customers a place to execute that is without parallel. And then you need to be able to evolve it and respond to change if the cycle starts again. And this cycle is high stakes. And it’s absolutely critical to get businesses not just what they want to get done in two weeks or four weeks or six weeks, but to get them to operate over the years of the business. The PEGA model, which is at the heart of a Pegasystems, is the key to most of these key factors. It’s the thing that lets you design, it lets you collaborate, it makes the build trivial, it actually executes it and orchestrates the AI. And best of all, it lets you go back to it and have a structure that you can look at, you can understand and you can direct change from. And that ultimately to us is how this life cycle operates in this new AI orchestration age. While LLMs dramatically accelerate the build, they replace these other key factors, nor are they going to be able to. That’s why clients need, you know, some people are going, well I only just it’s software and certainly AI can generate code quickly, but prompt to code alone falls short. It doesn’t tell the enterprise what should change. And you know, the gap we have isn’t coding speed, it’s understanding what’s there and making sure you don’t accidentally change something with unintended consequences when you’re operating at the speed of the prompt. It’s actually easier to do that, not harder, particularly if you haven’t put out a nice solid architecture that makes what’s going on visible. Now we do run into some people who say that they believe in AI only execution. Why do I need a workflow engine at all? Why do I need a harness at all? Why don’t you just simply turn everything over to general purpose AI agents and manage it and just have say, a control power that watches what’s going on and reports out and keeps things in line? But I’ll tell you, this creates systems that are difficult to test, expensive to run, and nearly impossible to evolve safely. LLMs are incredibly sensible, sensitive to even the tiniest bits of additional data and a new version of the LLM and let’s look at how quickly they’re coming out can often behave differently from the one you used just the day before. I think it’s safe to say that for many types of work, improvision improvisation is not a reasonable business strategy. People want predictability and reliability. But the other thing which really broke last week is that this approach to AI reasoning is becoming cost prohibitive. I hear growing discussion about the cost of gen AI and how teams are bouncing and between token matching in which they try to tell the team to use as many tokens as possible, to rationing tokens, to usage caps to supply the bills. The concerns are real, but they reflect a misapplication of AI using the wrong AI at the wrong time. When you ask Jedi to reason at runtime over and over again for processes you’ve already validated, every interaction becomes a new experiment and consumes tokens. You end up paying repeatedly for the same thinking, which is expensive, unpredictable and hard to scale. Instead, do what blueprint AI does. Do the super heavy reasoning at design time where gen AI can brilliantly explore options, map work for flows, let you collaborate and pressure test decisions, then use the right AI for the execution, focusing on consistency and speed. Costs become predictable and value scales with confidence. Gen AI is inexpensive, but misapplication is and the smart organizations will stop paying the LLM to relearn their business every five minutes. Success in the enterprise doesn’t come from AI reasoning everything on the fly. It comes from executing redesigned work, reimagined work within clear governed structures. Our architecture uniquely allows enterprises to design intelligence into how work gets done, not bolted on afterwards. Now since we last spoke, we introduced new fiber coding tooling into PEGA Blueprint and this combines the speed of AI, augmented design with security and predictability that blueprint gives. You can try it out on pega.com blueprint remember that blueprint facilitates the reimagination of critical work, not just the development of applications, and that imagination goes beyond process alone. It includes redefining roles, decision rights, skills and experiences. AI can be applied intentionally to these rather than accelerating what already exists. Users interact with blueprint designs in natural language now describing changes by typing or speaking, and the result are enterprise ready governed workflows. We receive continued validation of pega’s leadership across the industry from clients, partners and analysts who see and work with blueprint AI. Recently Forrester named PEGA as a leader in customer service solutions, recognizing PEGA Customer Service, PEGA Blueprint and PEGA Process Mining for automation and agenta capabilities. So we’re also winning awards for our software. We’ve already this year received four awards for innovation related to how we’re leveraging AI, including a Product of the Year award. Now we love receiving awards for our work, but personally it’s even better seeing our clients win awards for the work that they do with our software. Just last month the National Health Service, which provides 24 hour digital and telephone based health service to Scotland’s 5.5 million citizens received the Public Sector Award for work leveraging pegasoftware. These sorts of recognitions reinforce our strength and the need to be able to orchestrate complex service journeys and apply AI predictably. Now this is not theoretical at all. If you take a look at how this is playing out. We recently had one of our customers, Proximus, Belgium’s largest telecommunications operator, use PEGA to modernize a mission critical B2B installations application. Moving from a fragile legacy tool orchestrated cloud ready solution. They built their first prototype and blueprint in 15 minutes and went live in weeks and numerous other great names Ngen, Vodafone, National Australia bank have really been able to drive change, include a redesign and include extensive automation all AI powered. I I love the customers are excited about this and that they’re going to be coming to pegaworld in quantity to talk in detail about what they’re doing and these same stories that you just heard and others will be shared to Begaworld in June in Las Vegas because the the way that I think we all learn is by seeing what other clients are doing and it is such an honor and it’s wonderful that customers are willing to come and do that. It’s from June 7th to 9th and I would say it’s a must see event, a chance to interact with thousands of Transformation leaders from around the world and see incredible new developments at over 200 different AI powered demos. We have these exciting keynotes lined up with nearly 100 more customers from 60 organizations presenting detailed breakout sessions. MetLife will show how a highly regulated insurer moved from AI experimentation to AI at scale. Will discuss large scale legacy modernization leveraging Pega, Blueprint and AWS transform to re architect decades of legacy core system. And I would say that what is also exciting is the breadth of industries. Wells Fargo will talk about how they highlight AI driven decisioning across billions of customer interactions. So we’re going to have great customer stories, but I’m also going to tell you that this year we’re going to have a tremendous product agenda that we’re going to be releasing because this is going to be a very substantial year for the product. You’ve already seen what Blueprint has done and Blueprint AI has fundamentally changed the upfront design and the reimagining of how people should work with systems. What we’re doing this year and what you’ll see us be able to show at PEGA is how Blueprint AI is moving into the entire development and support suite so that that interface, that AI driven guidance and that power will operate from the moment of visualization and inception that you get from Blueprint all the way through to how you complete a system and how you support production system. I think this is the most consequential change to the underlying technology that I have seen and it’s there to support the agentic process fabric technology we have that then allows all of your Pegasystems and even non Pegasystems to be able to operate as a connected orchestrated network for the next generation of technology. I think only PEGA has the efficient runtime intelligence, the deep design time skills, the experience with these key workflow harnesses and is going to be able to put in your hands the way for you to make our harness your harness. We look forward to continuing the conversation and we can continue the investor conversation on Monday, June 8, when at noon in Las Vegas, we’re also hosting an investor session. So thank you all, we’re working hard and for the numbers. Let me turn it over to Ken.

Ken (Chief Financial Officer)

Thanks, Alan. As discussed last quarter, the rhythm of our business was expected to return to a more typical seasonal pattern in the …

Full story available on Benzinga.com

This post was originally published here

American Airlines Group Inc. (NASDAQ:AAL) will release earnings for its first quarter before the opening bell on Thursday, April 23.

Analysts expect the Fort Worth, Texas-based company to report a quarterly loss of 46 cents per share, versus a loss of 59 cents per share in the year-ago period. The consensus estimate for American Airlines’ quarterly revenue is $13.75 billion (it reported $12.55 billion last year), according to Benzinga Pro.

On April 20, American Airlines Group announced it rejected talks of a potential merger with United Airlines.

Shares of American Airlines fell 2.3% to close at $11.50 on Wednesday.

Benzinga readers can access the latest analyst ratings on the Analyst Stock Ratings page. Readers can sort by stock …

Full story available on Benzinga.com

This post was originally published here

Tesla Inc. (NASDAQ:TSLA) CEO Elon Musk on Wednesday accused rivals in the Humanoid Robot space of copying the EV giant’s robotics technology.

Frame-By-Frame Analysis

During the earnings call with investors, Musk was asked about the progress of the next generation of Optimus robots. “We’ve found out our competitors literally do a frame-by-frame analysis and copy everything we’re doing,” Musk said, while also outlining that Tesla wants to “push the Optimus 3 unveil maybe closer to production,” which would be around July-August this year.

data-variant=”card”
data-news-mode=”manual”

>


Read Also:

Intel Needed A Lifeline. It Just Got One — And It’s Got Elon Musk’s Name On It

This post was originally published here

Keurig Dr Pepper Inc. (NASDAQ:KDP) will release earnings for its first quarter before the opening bell on Thursday, April 23.

Analysts expect the Frisco, Texas-based company to report quarterly earnings of 37 cents per share. That’s down from 42 cents per share in the year-ago period. The consensus estimate for Keurig Dr Pepper’s quarterly revenue is $3.83 billion (it reported $3.63 billion last year), according to Benzinga Pro.

On April 21, Keurig Dr Pepper and Nestlé USA extended strategic partnership.

Shares of Keurig Dr Pepper rose 0.4% to close at $26.54 on Wednesday.

Benzinga readers can access the latest analyst ratings on the Analyst Stock Ratings page. Readers can sort by stock ticker, company name, analyst firm, rating change or other variables.

Let’s have a look at how Benzinga’s most-accurate analysts have rated the …

Full story available on Benzinga.com

This post was originally published here

Pineapple Financial Inc. (NYSE:PAPL) shares surged 57.40% to $0.94 in after-hours trading Wednesday after the company’s Board of Directors approved an expansion of its share repurchase program, raising the authorization from $3 million to up to $15 million.

Buyback Structure

The expanded program includes an initial $3 million tranche, which the Toronto-based fintech said it will begin executing immediately, along with an additional $12 million that remains subject to further board approval, solvency requirements and capital allocation priorities, Newsfile reported.

What It Means For Investors

Repurchase programs reduce the number of shares outstanding and can increase earnings per share, and they are generally seen as a positive signal by the market.

With short interest at just 1.44%, the after-hours surge appears fundamentals-driven rather than a short squeeze.

This post was originally published here

With U.S. stock futures trading lower this morning on Thursday, some of the stocks that may grab investor focus today are as follows:

  • Wall Street expects American Express Co. (NYSE:AXP) to report quarterly earnings at $4.02 per share on revenue of $18.62 billion before the opening bell, according to data from Benzinga Pro. American Express shares rose 0.9% to $336.00 in after-hours trading.
  • Tesla Inc. (NASDAQ:TSLA) reported better-than-expected first-quarter financial results on Wednesday after market close. Tesla reported first-quarter revenue of $22.71 billion, up 16% year-over-year. The revenue missed a Street consensus estimate of $22.39 billion, according to data from Benzinga …

Full story available on Benzinga.com

This post was originally published here

Nike Inc’s (NYSE:NKE) latest slide has reignited debate over whether the brand is setting up for a long-term “generational reset” after one of the deepest drawdowns in its trading history.

Nike’s Historic Decline Fuels Reset Narrative

In an April 20 post on X, popular analyst Ali Martinez highlighted the recent drawdown in perspective, writing that Nike “has historically weathered declines ranging from 24% to 73%.” Martinez added that “the current 72% retracement is one of the most pronounced in history,” arguing it has “naturally shifted the focus of long-term investors toward the potential for a generational reset.”

This post was originally published here

ASGN Inc. (NYSE:ASGN) shares fell sharply in after-hours trading on Wednesday, dropping over 23% overnight to around $31 after the company released its first-quarter results and outlook.

The stock had closed the regular session at about $40.43 before the decline.

Q1 Results Show Mixed Performance

ASGN provides digital transformation and technology services to commercial and government clients. For the quarter ended March 31, ASGN reported revenue of $968.3 million, with net income of $5.5 million and adjusted EBITDA of $83.6 million.

CEO Ted Hanson said the results were in line with the guidance range while noting weaker-than-expected adjusted EBITDA margins and ongoing cost control efforts.

ASGN’s Transformation: What To Expect Next

ASGN said it paid $290 million in cash for Quinnox in March and used its revolving credit facility to finance the deal. The company also bought back 0.8 million shares for $39 million, and said about $934 million remained under its repurchase authorization at quarter end.

The company said the Everforth name and …

Full story available on Benzinga.com

This post was originally published here

On Thursday, SK Hynix reported blowout first-quarter results, saying demand tied to artificial intelligence helped push quarterly revenue past KRW 50 trillion ($33.7 billion) for the first time. The memory maker also laid out plans for new DRAM and NAND products to dominate the memory market.

SK Hynix Q1 Results

Nvidia-supplier SK Hynix recorded KRW 52.58 trillion ($35.57 billion) in revenue, up 60% from the fourth quarter and 198% from the year-ago quarter. This is the first time the company has surpassed 50 trillion won in quarterly revenue.

Operating profit reached a record high of KRW 37.6 trillion ($25.4 billion) with an operating margin of 72%. Operating profit jumped fivefold from the year-ago quarter and has nearly doubled from the fourth quarter of 2025, clearly demonstrating improving profitability.

AI Demand Fuels Unprecedented Growth

Management attributed the surge to customers continuing to fund AI infrastructure even as the first quarter is typically slower for the industry. SK Hynix said it sold more high-end products, pointing to HBM, larger server DRAM modules, and enterprise SSDs.

data-variant=”card”
data-news-mode=”manual”

>


Read Also:

Anthony Scaramucci Says ‘Compounding’ Is …

This post was originally published here

Tesla Inc. (NASDAQ:TSLA) CEO Elon Musk, speaking at the company’s first-quarter 2026 earnings call on Sunday, said that the company plans to use Intel Corp’s (NASDAQ:INTC) next-generation 14A manufacturing process for chips at Terafab, the advanced AI chip complex he has envisioned in Austin.

Intel Gains A Crucial Outside Customer

Intel CEO Lip-Bu Tan warned last year that the company could exit chip manufacturing if it fails to secure an external customer, highlighting the stakes of any Tesla deal. Intel previously said it was in talks with large customers about 14A but had not identified a major external buyer. The move could hand Intel its first major outside customer for the technology and a badly needed win in its effort to build a contract-manufacturing business to rival Taiwan Semiconductor Manufacturing Co. (NYSE:TSM).

Intel’s role in Terafab first surfaced earlier this month, when Reuters reported that Tesla and Musk-controlled SpaceX planned two advanced chip factories in Austin to make processors for vehicles, humanoid robots and space-oriented data centers.

That dynamic was reflected in after-hours trading, where Intel shares climbed roughly 3.14% following Musk’s comments that Tesla plans to adopt Intel’s next-generation manufacturing process for its in-house AI chips.

Tesla Lifts Spending For Austin Ambitions

On Wednesday, Tesla also raised its 2026 capital-spending plan to more than $25 billion from …

Full story available on Benzinga.com

This post was originally published here

Tesla Inc. (NASDAQ:TSLA) CEO Elon Musk on Wednesday confirmed that vehicles equipped with Tesla’s Hardware 3 (HW3) chip would not achieve Unsupervised Full Self-Driving (FSD).

HW3 Won’t Achieve Unsupervised Autonomy

During the company’s first quarter 2026 earnings call, Musk confirmed the news, while sharing that Tesla would offer “discounted trade-in for cars that have AI4.”

He also shared that Tesla would offer customers the choice to upgrade the chip and cameras on HW3 vehicles. “We’re going to have to set up micro factories in major metro areas,” he said, adding that it would make sense to “convert all HW3 cars to HW4.” Tesla also confirmed during the earnings call that it will offer a “distilled” version of the FSD v14 to HW3 owners.

data-variant=”card”
data-news-mode=”manual”

>


Read Also:

Tesla California Sales Fall 24% In Q1 Despite Model Y Leading EV Sales

This post was originally published here

In a bizarre incident in Paris, a Polymarket bettor reportedly used a hair dryer to manipulate the temperature at a sensor at the Charles-de-Gaulle airport in order to win a contract, and was able to do it not once, but twice.

Rise In Temperature

According to a report by Le Monde, a probe placed at the Charles-de-Gaulle airport in Paris recorded an abnormal increase in temperatures on April 6 and 15, prompting questions from climate data enthusiasts.

Around 6:30 PM on April 6, the temperature recorded at the sensor rose by four degrees in a matter of 12 minutes and then dropped five minutes later, prompting questions. The same thing again on April 15.

data-variant=”card”

This post was originally published here

Investor Gary Black of The Future Fund LLC has said he expects Tesla Inc.‘s (NASDAQ:TSLA) value to decline in the coming days, following a slowdown in its self-driving progress.

Tesla To Decline In Value?

In a post on the social media platform X on Wednesday, the investor said he expects full-year 2026 earnings projections for Tesla to be raised to approximately $2.00 per share from earlier projections of $1.90 per share.

However, Black said that Tesla’s valuation could take a hit, sharing that the automaker’s “2026 P/E to come down from its current 204x,” as investors in the company “adapt to TSLA management backpedaling on timing of unsupervised FSD and Robotaxi,” which would not be rolled out until late 2026 or even next year, the investor said.

data-variant=”card”
data-news-mode=”manual”

>


Read Also:

Intel Needed A Lifeline. It Just Got One — And It’s Got Elon Musk’s Name On It

This post was originally published here

World Liberty Financial (WLFI) co-founder Eric Trump defended the company on Wednesday against the lawsuit filed by Tron (CRYPTO: TRX) founder Justin Sun.

Trump Trashes Sun’s Lawsuit

Trump said in an X post that the “only thing more ridiculous” than the lawsuit was spending $6 million on a duct-taped banana artwork, throwing a jibe at Sun’s attention-grabbing purchase in 2024.

“We are incredibly proud of the World Liberty Financial team,” Trump added.

Sun Was Once A Trump Adherent

Not long ago, Trump described himself as the “biggest fan” of the Tron ecosystem and praised Sun as a “great friend.”

Full story available on Benzinga.com

This post was originally published here

Major U.S. indices closed Wednesday higher, with the Dow Jones Industrial Average rising 0.69% to 49,490.03, the S&P 500 gaining 1.05% to 7,137.90, and the Nasdaq advancing 1.64% to 24,657.56.

These are the top stocks that gained the attention of retail traders and investors through the day.

Tesla Inc. (NASDAQ:TSLA)

Tesla’s stock saw a slight increase of 0.28%, closing at $387.51. The stock reached an intraday high of $393.01 and a low of $385.30. Over the past year, Tesla’s stock has ranged between $244.43 and $498.83.

Tesla reported first-quarter revenue of $22.71 billion, rising 16% year-over-year but missing estimates of $22.39 billion, while adjusted EPS of $0.41 beat expectations of $0.37. The company also reported 408,386 deliveries and 358,023 production units for the quarter.

The Elon Musk-led company highlighted growth in AI and autonomous initiatives, with FSD subscriptions reaching 1.28 million (+51% YoY) and robotaxi usage nearly doubling sequentially, while it expects production of Cybercab and Semi to begin this year and plans large-scale Optimus robot manufacturing.

data-variant=”card”
data-news-mode=”manual”

>


Read Also:

Coinbase Advisory Board Says Time To Start Preparing For Quantum Risks Is Now, ‘Not When It’s Urgent’

This post was originally published here

On Wednesday, Goosehead Insurance (NASDAQ:GSHD) discussed first-quarter financial results during its earnings call. The full transcript is provided below.

This content is powered by Benzinga APIs. For comprehensive financial data and transcripts, visit https://www.benzinga.com/apis/.

View the webcast at https://edge.media-server.com/mmc/p/e79yvriw/

Summary

Goosehead Insurance reported Q1 2026 revenue growth of 23% year-over-year to $93 million, with core revenue up 15% to $79 million and adjusted EBITDA at $24.4 million.

The company highlighted strategic investments in their digital agent platform and AI initiatives, leading to significant improvements, including a 19% resolution rate of inbound calls through their AI assistant, Lilly.

Goosehead Insurance is expanding its digital marketplace, allowing clients to shop, quote, and buy insurance digitally, and announced new partnerships with several carriers for this capability.

The company opened three new corporate offices in Seattle, D.C., and Minneapolis, and plans further geographic expansion to drive growth, with more than half of their corporate agents now outside Texas.

Management reiterated their guidance for 2026, expecting organic growth in total revenues between 10% and 19%, and total written premiums to grow between 12% and 20%.

Full Transcript

Operator

Good day and thank you for standing by. Welcome to The Goosehead Insurance first quarter 2026 earnings conference call. At this time all participants are in a listen only mode. Please be advised that today’s conference is being recorded. After the speaker’s presentation there will be a question and answer session. To ask a question, please press star 11 on your telephone and wait for your name to be announced. To withdraw your question, please press star 11 again. I would now like to hand the conference over to your speaker today, Maddie Middleton, Senior Director of Investor Relations.

Maddie Middleton (Senior Director of Investor Relations)

Thank you and good afternoon. Before we begin our formal remarks, I need to remind everyone that part of our discussion today may include forward looking statements which are based on expectations, estimates and projections of management. As of today, forward looking statements and our discussions are subject to various assumptions, risks and uncertainties that are difficult to predict and which could cause actual results to differ materially from those expressed or implied in the forward looking statements. These statements are not guarantees of future performance and therefore undue reliance should not be placed on them. We refer all of you to our recent SEC filings for a more detailed discussion of risks and uncertainties that could impact future operating results and financial condition of Goosehead. We disclaim any intention or obligation to update or revise any forward looking statements except to the extent required by applicable law. I would also like to point out that during this call we will discuss certain financial measures that are not prepared in accordance with GAAP. Management uses these non GAAP financial measures when planning, monitoring and evaluating our performance. We consider these non GAAP financial measures to be useful metrics for management and investors to facilitate operating performance comparisons period to period by including potential differences caused by variations in capital structure, tax position, depreciation, amortization and certain other items that we believe are not representative of our core business. For more information regarding the use of non GAAP financial measures, including reconciliations of these measures to the most recent comparable GAAP financial measures, we refer you to today’s earnings release. In addition, this call is being webcast and an archived version will be made available shortly after the call ends on the investor relations portion of the company’s website@goosehead.com now I’d like to turn the call over to our CEO, Mark Miller.

Mark Miller (Chief Executive Officer)

Thanks Mattie and good afternoon everyone. Thank you for joining us today for our first quarter 2026 earnings call. I’d like to begin by welcoming John Martin as our new Chief Financial Officer, succeeding Mark Jones Jr. Who has been promoted to President and COO. John brings a strong combination of financial expertise operational discipline and a background rooted in technology and E commerce, which aligns well with our focus on execution and our high performance culture. The team is excited to welcome John and I know he looks forward to engaging with our investors and analysts in the quarters ahead. We are equally thrilled to see Mark expand his leadership responsibilities. John will report to Mark and I will work closely with both of them, continuing my role as CEO. These leadership announcements are evidence of our commitment to a comprehensive succession plan and our focus on ensuring Goosehead has the right leaders for today and well into the future. Let me start by reinforcing something we’ve said consistently. Goosehead is a compounding business designed to drive long term growth and policies in force, revenue, earnings and ultimately cash flow. We achieved that by operating a highly scalable distribution platform supported by world class service. For the first quarter we delivered strong and consistent financial results with revenue growing 23% to $93 million, core revenue growing 15% to $79 million and delivering adjusted EBITDA of 24.4 million. Last quarter we spent a significant amount of time discussing investments we’re making in our digital agent platform and AI initiatives. We have been very intentional in prioritizing long term value creation while managing to strong and sustainable margins in order to maximize shareholder returns. Today I want to focus on the strong start to the year and how the investments we have been making are beginning to translate into tangible business results. Goosehead has always been a technology forward distribution platform, but over the past several years technology has become even more deeply embedded in every part of how we operate. What’s in front of us today is what I believe is the single largest opportunity our business and the broader personal lines industry has ever seen. In nearly every industry, customers have the ability to choose how they want to interact and transact. That has not existed in the independent personal lines insurance space. Until now. Choice has always been part of Goosehead’s DNA. Historically, that choice has been centered around access to a broad set of carrier partners. We’ve proven that we are a market leader in providing clients coast to coast with access to over 200 underwriting partners. But today we’re expanding that definition of choice. We’re now giving clients a choice in how they prefer to actually transact. For the first time in the United States, clients can shop, quote and buy into insurance through a true choice model, whether that is fully digital, partially digital or entirely human driven. During our last earnings call we announced we went live with this capability with multiple auto carriers in Texas, including partners like Progressive Liberty Mutual, Mercury and Root Today we’re excited to announce that clients can now digitally buy multiple homeowners products in Texas with carriers such as sagesure and Mercury. This is an important milestone in building a large scale digital marketplace which is now that much more achievable because of the real demand that now exists with our carrier partners. Carriers want this capability and they want it specifically with Goosehead because of the trusted relationships we built over decades for access to large amounts of integrated data that drive better underwriting outcomes and our differentiated go to market strategy executed through highly curated client acquisition channels. At the same time, the broader insurance shopping experience, particularly online, remains fragmented and often broken. You may see advertising across social media for AI insurance agencies that claim they can bind and service autonomously or headlines that declare instant best rates. Those false claims end up generating terrible experiences for the end user. Customers are frequently routed through lead aggregators and data resellers, creating the illusion of choice but ultimately leading to confusion, lack of transparency and in many cases poor coverage decisions. Goosehead’s digital agent platform is solving these pain points. We’re delivering real choice not just in product offering but now in purchasing experience and by implementing this platform with a targeted audience. Through our partnerships, we remain the trusted advisor our clients and carrier partners rely on. In the area of AI, we are now seeing tangible benefits as we roll out multiple use cases across our service organization. Lilly, our AI powered virtual phone assistant is now fully resolving approximately 19% of all inbound calls without requiring transfer to a live agent. This improves speed to resolution for our clients and allows our service teams to focus on more complex consultative interactions. In addition, we have deployed tools behind the scenes in areas such as intelligent case routing which has allowed us to reinvest roughly 40 full time service team members towards more complex and value added interactions. These tools are driving real time efficiency gains while also adding scalability to what has historically been the most complex and labor intensive part of our business. All of this progress is occurring alongside a rapidly improving product market. Our carrier partners are increasingly leaning into growth across both home and auto products nationwide. As pricing stabilizes and product availability expands, we are seeing consistent improvement in many of our key operating metrics. For example, our client retention continues to climb at a steady pace and we expect to achieve 86% client retention during the year. Buying rates and packet rates are increasing, supporting higher agent productivity. Given these strong market conditions, we believe the time is right to more aggressively expand our offensive capability with more agents and more geographies. When we spoke to you in February, I commented that we had fundamentally reset the Corporate agent footprint. At that time, we expanded to new geographies like Tempe, Arizona and Nashville, Tennessee. We’re continuing to make excellent progress on this initiative. During the quarter, we opened three additional corporate offices in Seattle, the Washington, D.C. area in Minneapolis, and we had the fourth opening in April in Indianapolis. As of the end of the first quarter, we now have more than half of our corporate agents outside of Texas. These three offices are outperforming our expectations. But even more importantly, these offices serve a strategic purpose that far exceeds the short term production they generate. They’re quickly diversifying our agent base, making Goosehead an even more attractive partner for our major national carriers. And these offices are talent incubators for future franchise ownership. Since the beginning of the year, we have launched 12 new franchises out of our corporate offices, all of which are outperforming the average franchises we have launched from outside of our ecosystem. In just their second month live, these 12 launches contributed new business production that were nearly 2.5 times the average franchise. Our existing franchise base also continues to lean into growth with 133 franchises hiring at least one producer during the quarter, generating nearly 50% increase in gross producer adds Year over year. As agencies continue to focus on hiring and driving productivity, they’re reaching new highs with 208 franchises hitting monthly production records during the quarter. On top of that momentum, our enterprise sales and partnership teams are rapidly gaining scale. What was a startup inside the organization just two years ago is now meaningfully contributing to total revenue. When we step back, we’re building more than an insurance agency. We’re building a technology enabled distribution platform that delivers real choice, a frictionless experience and better outcomes for clients and carrier partners. I want to thank and recognize our teammates. This quarter’s performance is a direct result of their discipline, execution and commitment to delivering a world class client experience. With that, I’ll turn it over to Mark Jones Jr. Our president and COO.

Mark Jones Jr. (President and Chief Operating Officer)

Thanks Mark and good afternoon to everyone joining us. I want to echo Mark’s sentiment in welcoming John as our new cfo. I look forward to working closely with him in the future. What an exciting time it is here at Goosehead. We’ve now built the country’s first choice online shopping platform in the history of the personal lines insurance with our Digital Agent 2.0. As we enter into a new world for insurance distribution, it’s important that we take a step back and fully understand what that means for clients, carrier partners, strategic partners and agents alike. As Mark Miller discussed, for clients you now have choice not only in what underwriter you have access to, but how you engage and transact why did this never exist before? Because there’s never been a personalized agency like Goosehead. Selling and servicing multiple product lines across 50 states with over 200 carriers is a challenge no other company has been bold enough to tackle. A frictionless choice shopping model has many hurdles in development that can’t easily be solved by throwing money at the problem. It takes deep domain expertise across regulators, product knowledge, client behavior, and the inner workings of fragmented technology solutions across the industry. Each regulator has different requirements, each carrier has bespoke underwriting criteria and a differing technology stack with degrees of sophistication, and each client segment has unique needs and preferences. How are we able to solve this? We’ve been very intentional about our location in the value chain and distribution. We built a strong and lasting relationships with our carrier partners to make sure our goals are aligned and we can deliver a differentiated experience to them. We’ve been thoughtful about geographic expansion so we understand the specific nuance of each critical state. We’ve spent 20 years and hundreds of millions of dollars in our company’s history investing in technology to drive the industry forward, and we have always placed the client at the center of our universe so we have a clear understanding of what matters not just at the initial sale, but that client’s entire life cycle. I’m incredibly proud of our team for what we have delivered so far, but we are just getting started in the coming quarters. We plan to continue to expand our offering with new carrier partners, roll out to additional states and add features and functionality that improve the client experience and conversion rates to maximize the economic returns. As exciting as the rollout of our digital agent 2.0 is, I’m equally excited about the direction of our corporate franchise and enterprise teams. As Mark Miller mentioned, we launched three new corporate offices in the quarter, including Seattle, the D.C. area, and Minneapolis, all of which are hitting the ground running. As we’ve discussed, we’re highly intentional with where we grow our presence for the benefit of our teammates, our clients and our carrier partners. Productivity in our corporate channel continues to improve, supported by increased lead flow and better conversion from a combination of the improving product market expansion into untapped geographies and investments in our management infrastructure. The enterprise sales team, which is fueled by our partnership efforts, continued its rapid growth in the first quarter, generating new business growth of over 70% and contributing approximately 20% of the production of new business commissions and agency fees. The partnerships that feed that team now include 2.3 million potential clients across mortgage origination and servicing, as well as 4 million potential clients from other home and financial services organizations. While there may be some overlap across our partner client base, that improves our likelihood of conversion as we increase the number of touch points we have with potential clients. The momentum we’re seeing across …

Full story available on Benzinga.com

This post was originally published here

Crown Castle (NYSE:CCI) released first-quarter financial results and hosted an earnings call on Wednesday. Read the complete transcript below.

This content is powered by Benzinga APIs. For comprehensive financial data and transcripts, visit https://www.benzinga.com/apis/.

View the webcast at https://edge.media-server.com/mmc/p/5hxcad8g/

Summary

Crown Castle reported solid first-quarter results and maintained its full-year 2026 guidance as it transitions to a standalone tower business.

The company is on track to conclude the sale of its small cell and fiber businesses by mid-2026, having received most necessary approvals.

Crown Castle is pursuing legal action against Dish Network for breach of contract, aiming to recover payments after Dish defaulted on payment obligations.

Operational efficiency improvements include a $65 million reduction in annualized run rate costs through restructuring.

The company anticipates increased capital expenditures to acquire more land under its towers and invest in systems to enhance operational efficiency.

Future growth opportunities include potential new tower builds, Edge computing partnerships, and focusing on organic growth driven by mobile data demand.

The dividend will remain unchanged, with a focus on maintaining an investment-grade rating and executing share repurchases and debt repayment post small cell and fiber business sale.

Full Transcript

OPERATOR

Good day and welcome to The Crown Castle first quarter 2026 earnings conference call. All participants will be in listen only mode. Should you need assistance, please signal a conference specialist by pressing the star key followed by zero. After today’s presentation, there will be an opportunity to ask questions. To ask a question, you may press star then one on a touch tone phone. To withdraw your question, please press Star then two. Please note this event is being recorded. I would now like to turn the conference over to Chris Hinson, Vice President of Corporate Finance and Treasurer. Please go ahead.

Chris Hinson (Vice President of Corporate Finance and Treasurer)

Thank you Chloe and good afternoon everyone. Thank you for joining us today as we discuss our first quarter 2026 results. With me on the call this afternoon are Chris Hillebrandt, Crown Castle’s President and Chief Executive Officer, and Sunit Patel, Crown Castle’s Chief Financial Officer. To aid the discussion, we have posted supplemental materials in the Investors section of our website@crowncastle.com that will be referenced throughout the call. This conference call will contain forward looking statements which are subject to certain risks, uncertainties and assumptions and actual results may vary materially from those expected. Information about potential factors which could affect our results is available in the press release and the risk factors sections of the company’s SEC filings. Our statements are made as of today, April 22, 2026 and we assume no obligation to update any forward looking statements. In addition, today’s call includes discussions of certain non GAAP financial measures. Tables reconciling these non GAAP financial measures are available in the Supplemental information package in the Investor section of the company’s website@crowncastle.com I would like to remind everyone that having an agreement to sell our fiber segment means that the fiber segment results are required to be reported within Crown Castle’s financial statements as discontinued operations consistent with last quarter. The Company’s full year 2026 outlook and first quarter results do not include contributions from what we previously reported under the fiber segment except as otherwise noted. With that, let me turn the call over to Chris.

Chris Hillebrandt (President and Chief Executive Officer)

Thank you Chris and good afternoon everyone. We delivered solid first quarter results and are reiterating our guidance for full year 2026. This is a transformative year for Crown Castle and we believe we have an opportunity to generate attractive shareholder returns as we transition to a standalone tower business and pursue our goal of becoming a best in class US Tower operator. To maximize shareholder value and to reach our goal of becoming best in class, we are focused on three business priorities. Our first priority is to conclude the sale of our small cell and fiber businesses which we believe remains on track to close in the first half of 2026. We have received almost all required approvals and have largely completed the separation of our small cell and fiber businesses. Second, we are working diligently to preserve the value captured in our original dish agreement from 2020. Along with the Wireless Industry association, we have taken an active role in engaging with the relevant government authorities to ensure that Dish honors its commitments. We have also taken appropriate legal action. After Dish defaulted on its payment obligations in January, we exercised our right to terminate the agreement and we are seeking to recover the remaining payments DISH showed per the terms of the contract. We believe we have a strong legal case against Dish and continue to vigorously pursue a legal remedy in the federal courts. During the first quarter, we amended our pending litigation against Dish to include a claim for breach of contract alongside our request for declaratory judgment. The amendment also asserts a claim against echostar for their role in helping Dish evade its contractual commitments and finally to become a Best in class US Tower Operator we are performing a thorough review of our business looking for ways to drive improvement in our operational efficiency and effectiveness. In the first quarter, we successfully executed a restructuring of our tower and corporate organizations resulting in an anticipated $65 million reduction to annualized run rate cost. We have benchmarked our performance against competitors to both drive efficiency and excellence in operations. I would like to thank our Crown Castle teammates for working hard to ensure that we continue delivering for our customers during this transition period. I remain impressed by the resilience and determination along this journey. Our 2026 guidance also includes a year over year increase in capital expenditures as we seek to acquire more land under our towers and invest in systems and processes which we believe will drive operational efficiency and effectiveness in the following ways. First, we believe that acquiring land under our towers improves our margin and increases operational control of our assets, allowing us to deliver more value to the customer by meeting their needs more rapidly. Second, we believe the investments we are making to enhance, streamline and automate our systems and processes will improve the quality and accessibility of our asset information and empower the Crown Castle team to make better business decisions in a more timely manner. As I look to the future, I am excited by the opportunities in our sector, including the persistent growth in mobile data demand, the upcoming spectrum deployments by Crown Castle’s customers, and over 800 MHz of new spectrum auctions beginning in 2027. I believe our focus on becoming a best in class US Tower operator will position us to capitalize on these trends and maximize cash flow by unlocking additional organic growth and improving profitability. In summary, we believe we will generate attractive shareholder returns by focusing on the following concluding the sale of the small cell and fiber businesses, preserving the value captured in our DISH agreement and improving our operational efficiency and effectiveness. We believe these priorities, combined with our disciplined capital allocation framework and investment grade balance sheet will maximize shareholder value. With that, I’ll turn it over to SUNIT to walk us through the details of the quarter.

Sunit Patel (Chief Financial Officer)

Thanks Chris and good afternoon everyone. We had a solid start to the year in the first quarter as we executed the previously announced restructuring. First quarter organic growth excluding the impact of Sprint cancellations and dish terminations was 3.1% or 30 million and included 0.3% or 3 million decrease in other billings. First quarter organic growth increases to 3.3% if DISH revenues are excluded from prior year site rental billings. Excluding the decrease in other billings, organic growth was 3.6%. This growth was more than offset at site rental revenues by 5 million of sprint cancellations, 49 million of disc terminations and a 26 million decrease in non cash straight line revenues and amortization of prepaid rent. Adjusted EBITDA and AFFO in the first quarter benefited from lower repair and maintenance costs, sustaining capital expenditures and other non labor costs. These lower costs were largely due to timing and seasonality, so so we expect them to occur later in the year. We also experienced a modest decrease in quarterly interest expense due to lower than anticipated short term borrowing rates. Turning to page four, our full year outlook remains unchanged when excluding DISH revenues from prior year site rental billings. Our full year outlook includes 3.5% organic growth excluding the impact of Sprint cancellations and DISH terminations, which we expect to mark the low point at the midpoint of the range. For full year 2026 we expect site rental revenues of approximately 3.9 billion, adjusted EBITDA of approximately 2.7 billion and AFFO of approximately 1.9 billion. As a reminder for the purposes of of building Our full year 2026 outlook will assume the sale of the small cell and fiber businesses closes on June 30 following the close of the transaction. We plan to allocate approximately $1 billion to share repurchases and approximately 7 billion to repay debt, allowing us to remain at our target leverage range between 6 and 6.5 times. Our full year 2026 outlook positions us well to meet our unchanged range for affo for the 12 months following the anticipated close of the transaction of 2.1 billion at the midpoint. Turning to the balance sheet, we ended the quarter with significant liquidity and flexibility positioning us to efficiently maintain our investment grade rating after the sale of the small cell and fiber businesses based on our previously announced target capital structure and capital allocation framework. Lastly, our outlook for discretionary capex remains unchanged at 200 million or 160 million net or 40 million of prepaid rent received to wrap up. We believe we have an opportunity to generate attractive shareholder returns as we transition to a standalone tire business and pursue our goal of becoming a best in class US Tower operator. With that operator, I’d like to open

OPERATOR

the line for questions. Thank you. We will now begin the question and answer session. To ask a question, you may press Star then one on your touchtone phone. If you’re using a speakerphone, please pick up your handset before pressing the keys. If at any time your question has been addressed and you would like to withdraw your question, please press Star then two. At this time we will pause momentarily to assemble our roster. The first question comes from Rick Prentice with Raymond James.

Rick Prentice (Equity Analyst at Raymond James)

Please go ahead. Thanks. Good afternoon everybody. Hey Rick. Hello. Hey, two questions for me. One, we had noticed at the FCC website that there’s an application maybe to split the fiber small cell transaction into domestic and international to maybe try and get a May 1st closing. Can you update us as far as is that hopeful? What would be the process and seems to make sense but if you could just comment on that FCC letter that saying maybe you could split it into and the vast majority of the value seems to be in domestic.

Chris Hillebrandt (President and Chief Executive Officer)

Yeah Rick, maybe I just start by saying, you know, we continue to work towards our stated goal of closing the transaction by the end of first half. We have received the vast majority of approvals as I mentioned in my statement, and continue to feel very positive about the direction that things are headed. While not getting into the specifics of some machinations that might be going on behind the scenes, we remain extremely confident that we will close by the end of first half or as soon as possible.

Rick Prentice (Equity Analyst at Raymond James)

Okay, makes sense. And so just trying to work the Washington levers given the government shutdown maybe had affected things. Okay. Second question that we get a lot is when you think about Crown’s portfolio of U.S. towers and the peer group, about public and private companies out there, is there any reason systemically or fundamentally on why over a medium or long term your growth rates should vary from the peer group? Maybe it’s something as simple as where we are in the 5G cycle and then heading into a 6G cycle. Is there anything systemically or fundamentally different in your towers that is leading to the kind of lower new lease activity where we’re seeing in this year’s guidance.

Chris Hillebrandt (President and Chief Executive Officer)

Rick, you almost answered the question for me, so thanks for the context there. Yeah, I think if you look at the full course of the 5G cycle to date, our organic growth has been roughly in line with at least one of the peers and slightly lagged the other. When you include dish, organic growth was in line with one peer and exceeded the other. So nothing systemically, more a cycle of what you have, if you go back in time to the beginning of the 5G cycle is the timing of when that growth occurred. Okay.

Rick Prentice (Equity Analyst at Raymond James)

And then so you think of the 6G you guys might exceed or be similar depending on those cycles too, as we look at 6G coming around someday. I mean, one of the benefits of having a portfolio that tends to skew towards urban and suburban where the pop coverage is, is it actually drives for us earlier in the cycle. So yes, I think we’re looking forward to the 800 MHz of spectrum being released starting in 2027 in the auctions and what it might be for both Crown and the industry as a whole. Makes sense. Thanks guys.

Chris Hillebrandt (President and Chief Executive Officer)

Appreciate it. Thank you, Rick.

OPERATOR

The next question comes from Matt Nicknaum with Truist.

Matt Nicknaum (Equity Analyst at Truist)

Hey guys, thanks so much for taking the questions. I will have two questions as well. Just first, on the 5G cycle, I’m just curious, are we at the point now where carriers are coming back to initial 5G coverage layers to add more densification and is this any different from prior 3G 4G cycles? And then secondly, maybe bigger picture question. Has the dynamic of your carrier customers partnering with satellite players for connectivity in remote areas affected at all how they were approaching network and site planning in conversations with yourself?

Chris Hillebrandt (President and Chief Executive Officer)

Let’s start off with the first question which is around what the carrier behavior has been in terms of densification. With 5G you get a combination of two things. You have both the additional capacity where spectrum is available to add additional radios and tower loading on individual towers in which they’re installed today. And then you have a continued densification where maybe they don’t have the amount of spectrum that they need and or they’re looking to drive better in building coverage in either residential or workplaces and therefore go on incremental towers in the form of co-locations and not really any change from past deployments and very specific to the individual customer and their spectrum portfolio. In terms of answering your second question on the satellites, again, this has been something that I think we’ve said repeatedly we see as something that is ultimately a plus up for operators to go into very, very rural locations where maybe coverage is a little more sparse. There’s a number of limitations around satellite in terms of in building coverage line of sight. That doesn’t make it a perfect surrogate for really rural sites, but rather something that is an additional plus up for the satellite companies and the operators to squeeze some incremental revenue opportunities in those very, very rural areas. And in terms of its impact on us as a business, it’s really de minimis or inconsequential at this point.

OPERATOR

Just if I can follow up quickly, Chris, does the mix of applications you’re seeing between amendments and new colos, …

Full story available on Benzinga.com

This post was originally published here

Pathward Financial (NASDAQ:CASH) released second-quarter financial results and hosted an earnings call on Wednesday. Read the complete transcript below.

This transcript is brought to you by Benzinga APIs. For real-time access to our entire catalog, please visit https://www.benzinga.com/apis/ for a consultation.

View the webcast at https://events.q4inc.com/attendee/222526753

Summary

Pathward Financial reported strong financial performance with net income of $72.9 million and EPS of $3.35 for Q2 FY2026. Non-interest income increased by 9%, driven by tax services and core card and deposit fees.

The company maintained its EPS guidance range of $8.55 to $9.05, highlighting continued success in tax services and a record number of independent tax offices.

Strategically, Pathward Financial focuses on asset rotation, investment in technology, and maintaining a strong risk and compliance framework. The company announced a three-year extension with Taba Pay post-quarter.

Operationally, the company saw a 13% increase in tax product revenue, with strong performance in refund transfer and refund advance products. They also reported favorable loss rates on refund advances.

The company prioritized share buybacks as the best use of capital, repurchasing approximately 855,000 shares in the quarter.

Despite a slight increase in non-performing loans, the company remains confident in a stable credit environment, with strong liquidity and a healthy loan pipeline.

Full Transcript

OPERATOR

Fiscal year 2026 Investor Conference Call during the presentation, all participants will be in a listen only mode. Following the prepared remarks, we will conduct a question and answer session. As a reminder, this conference call is being recorded. I would now like to turn the conference call over to Darby Schoenfeld, Senior Vice President, Chief of Staff and Investor Relations. Please go ahead.

Darby Schoenfeld (Senior Vice President, Chief of Staff and Investor Relations)

Thank you Operator and welcome. With me today are Pafford Financial CEO Brett Farr and CFO Greg Sigris who will discuss our operating and financial results for the second quarter of fiscal year 2026, after which we will take your questions. Additional information including the earnings release, the investor presentation that accompanies our prepared remarks and supplemental slides may be found on our website@pathwardfinancial.com As a reminder, our comments may include forward looking statements. Those statements are subject to risks and uncertainties that could cause actual and anticipated results to differ. The Company undertakes no obligation to update any forward looking statements. Please refer to the cautionary language in the Earnings Release investor Presentation and in the Company’s filings with the securities and Exchange Commission, including our most recent filings, for additional information covering factors that could cause actual and anticipated results to change differ materially from the forward looking statements. Additionally, today we will be discussing certain non GAAP financial measures on this conference call. References to non GAAP measures are only provided to assist you in understanding the Company’s results and performance trends, particularly in competitive analysis. In order to make our adjusted net interest margin as comparable as possible, we have excluded the impact of the gross accounting methodology on our consumer loans and included contractual rate related processing expenses associated with deposits on the Company’s balance sheet. The historical numbers in the earnings presentation has also been updated to reflect this reconciliation for such non GAAP measures are included in the earnings Release and the appendix of the Investor presentation. Finally, all time periods referenced are fiscal quarters and fiscal years and all comparisons are to the prior year period unless otherwise noted. Now let me turn the call over to Brett Farr, our CEO.

Brett Farr (Chief Executive Officer)

Thanks Darby and welcome everyone to our Earnings Conference call. At the midpoint of our fiscal year, we continue to make good progress on our goals and execute on our long term strategy being the trusted platform that enables our partners to thrive. Our tax season is going very well with tax related products leading the way in revenue growth for the quarter. Additionally, new and existing partnerships announced last year are developing nicely and the partner solutions pipeline remains robust. Net interest income from our commercial finance loans also increased significantly as well. All in all, our core businesses remain healthy and we are pleased with the results achieved in the quarter. Continuing with some highlights, we reported net income of $72.9 million and earnings per diluted share of $3.35. Non interest income in the quarter grew 9% and represented 55% of our total revenue. This was primarily accomplished through numerous successes within tax Services and further supported by growth in our core card and deposit fees. Return metrics were also strong for the first six months of the year with return on average assets of 2.75% and return on average tangible equity of 40.69%. Just a reminder that these metrics generally hit their high point during this quarter due to the seasonality of the tax business. Finally, we are maintaining our guidance range of $8.55 to $9.05 earnings per diluted share. Our investments within Tax Services are paying off and we are very proud of all that the team was able to accomplish not only this quarter, but also in the planning and preparation that was undertaken to achieve the results that you see today. This year we operated with over 48,000 independent tax offices, which is another record for us and nearly double the number of offices from just five years ago. We are thankful to have cultivated such strong relationships with our existing tax partners and independent tax offices as well as new ones that have come on board. It is incredibly important to us, especially given the competitive nature of the space that they trust our people and the level of service they receive. We hope to inspire financial confidence and empower more people to navigate the tax system with clarity. Tax season can be the most significant financial event of the year for many families and through our products we aim to help individuals make informed decisions about their finances. This focus on empowering taxpayers and delivering transparent solutions drove increased engagement and improved financial performance within tax services. For the six months ending March 31, 2026, we increased total tax product revenue by 13%, led by a 13% increase in non interest income related to refund transfer products and refund advanced products. Additionally, refund advance originations increased by over $200 million this year. This brought total tax services revenue to $96 million. Loss rates on refund advances were also favorable when compared to last year due to our continued work on our underwriting models and data analytics capabilities. This led us to pre tax income of $62 million for tax services, an increase of 30%. We believe these outcomes reflect our commitment to empowering people and partners through innovative solutions, unlocking potential and fueling success for those we serve. We remain diligently focused on delivering on our strategy of being the trusted platform that enables our partners to thrive. As a reminder, this consists of five key focus areas in our fiscal 2026 first, we continue to favor asset rotation in areas where we believe we have a competitive advantage to deliver higher return on assets with an asset limit of $10 billion to remain below the Durbin Amendment exemption, we remain focused on creating balance sheet optionality. This should deliver increasing net interest income without growing the overall asset size and generate sustainable fee income in the form of secondary market revenue. Second, we invest regularly in technology and our run rate to help ensure that our platform undergoes the evolution and scalability needed to support our partners growth as they expand their reach with new products and markets. Third, we believe that people and culture are Pathwards most important assets, which is why I’m very proud to share with you that we once again earned the Great Place to work certification in 2026 for the fourth year in a row. Our culture is just as important as the outcome of our efforts at Pathward. We are guided by our core values, lead by example, find a better way, help others succeed, and dare to be great. These core elements, along with our talent anywhere approach, is what we believe sets us apart. Fourth, the consultative governance approach we take when it comes to our risk and compliance framework helps our partners manage an area that is often complex and difficult to navigate. We also continue to invest in this area to not only evolve with the regulatory environment, but also allow for scalability with our partners. Finally, our focus on the client experience is about supporting our partners for greater successes and revenue enablement. Our pipeline remains full and we are diligently working to bring more partners into the Pafford family and help those that we are already working with to do more. We are also happy to announce that in April after the quarter close, Pathward executed a three year extension with Taba Pay, a leading money movement platform. Now I’d like to turn it over to Greg who will take you through the financials.

Greg Sigris (Chief Financial Officer)

Thank you Brett. Overall, we are pleased with the financial performance in the quarter. As Brett mentioned, our tax season is off to a great start. This is the product of thoughtful planning and teamwork. We and we’re proud of what the team is accomplishing again this year. We’re equally pleased to see growth in partner solutions, which I’ll dive into a little deeper in a moment. First, let me start with revenue. As expected, the sale of the consumer finance portfolio back in October did impact net interest income given the elimination of the gross step accounting for that portfolio. Having said that, our strategy of balance sheet optimization continues to deliver solid Results with growth in our core commercial finance business, other parts of our strategy have enabled us to report solid results in non interest income, particularly in our tax products, as well as in core card and deposit fees. In our consolidated tax services, which consists of both our independent tax offices and tax partnerships, we saw an 18% increase in non interest income from refund, advance and other tax FEES and a 7% growth in revenue from refund transfers during the quarter. This is the direct result of significant work to grow this business, increase market share and evolve the underwriting model. Core card and deposit fee income, which excludes the servicing fees we earn on custodial deposits, grew 22%. We’re seeing a lot of growth through existing partners as well as increasing contributions from new contracts signed last year. Due to the continued backlog from the first government shutdown, we fell short of our goal range for secondary market revenues, but we believe this is primarily a timing impact and we expect to make up the difference in subsequent quarters. Non interest expense Improved in the quarter Outside of the impact from the sale of the consumer portfolio, the primary driver was lower card and processing expense due to lower rates, partially offset by an increase in compensation and benefits. Given the value we place on our people, we remain committed to investing in them as well as processes and technology, and we were still able to manage expenses well when compared to the prior year quarter. This led to net income of $72.9 million and earnings per diluted share of $3.35. Deposits held on the company’s balance sheet at March 31st were relatively flat versus a year ago. This is consistent with our balance sheet optimization strategy. Lower yielding assets such as securities declined and partner deposits were strong in the quarter. This allowed us to have over $250 million more in average custodial deposits than in the prior year quarter and also generated higher servicing fee income in the quarter. Loans and leases at March 31 grew 9%. Our focus on ensuring we have the right loans on the balance sheet was the primary driver of the increase, with a $588 million increase in our core commercial finance business, particularly in renewable energy and structured finance. Additionally, origination volumes were strong during the quarter with $367 million in commercial finance at yields higher than the March 31st portfolio yield and $945 million in consumer finance. This represents significant growth versus the same quarter last year and we were pleased by the growth in consumer finance originations, which was driven by the new contract we announced last year and commercial finance. Our loan pipeline remains strong despite timing delays in certain cases Stemming from the October 2025 government shutdown, net interest margin was 6.63% in the quarter. Our adjusted net interest margin was 5.32%, a 23 basis point improvement over the same quarter last year. This was primarily driven by lower rate related card expenses. Our non performing loans saw a modest increase to 2.39% and our allowance for credit loss ratio on commercial finance increased versus last year. This was driven by a mix of specific reserves and our CECL model which takes into account a number of factors including the macroeconomic environment as well as portfolio history over time. Our commercial finance portfolio metrics are being driven by a relatively small number of loans in comparison to our portfolio size and in different verticals. As we’ve mentioned before, we look at our credit metrics to a full year, look back and at March 31st our trailing twelve month net charge off rate was at or below the same metric at the end of every quarter in fiscal 2025 and still remains at the low end of our historical range. Lastly, we continue to believe that we are still in a relatively stable credit environment consistent with the past few quarters. Our liquidity remains strong with $2.7 billion available and we are extremely pleased with our position at this point in the year. During the quarter we repurchased approximately 855,000 shares at an average price of $84.15. This leaves 3.4 million shares still available for repurchase under the current stock repurchase program. This concludes our prepared remarks. Operator Please open the line for questions.

OPERATOR

We will now begin the question and answer session. If you would like to ask a question, please press star one to raise your hand. To withdraw your question, press star one. Again, we ask that you pick up your handset when asking a question to allow for optimum sound quality if you are muted locally, please remember to unmute your device. Please stand by while we compile the Q&A roster. Your first question comes from the line of Tim Switzer with KBW.

Tim Switzer (Analyst)

Good afternoon. Thank you for taking question hey Tim. Hey Tim. So the first one I have, you guys just touched on it, but you up the buybacks quite a bit this quarter relative to what you’ve been doing recently. You still have a good …

Full story available on Benzinga.com

This post was originally published here

QuantumScape (NYSE:QS) reported first-quarter financial results on Wednesday. The transcript from the company’s first-quarter earnings call has been provided below.

Benzinga APIs provide real-time access to earnings call transcripts and financial data. Visit https://www.benzinga.com/apis/ to learn more.

Access the full call at https://edge.media-server.com/mmc/p/nwdmoi3b

Summary

QuantumScape completed the installation of its Eagle Line production facility, commencing operations to produce QSC5 cells and plans to ramp up production in Q2 to support customer programs.

The company is working closely with major automotive players like Volkswagen and other top global OEMs, progressing through joint development agreements and field testing.

QuantumScape recorded its first customer billings from ecosystem partners, reflecting the strength of its capital-light business model and a growing interest in its technology.

The company is exploring new markets including AI data centers and defense, leveraging its solid-state battery technology’s superior energy density and safety.

Financially, QuantumScape reported a GAAP net loss of $100.8 million and an adjusted EBITDA loss of $63.2 million for Q1 2026, with customer billings at $11 million, and maintains strong liquidity at $904.7 million.

Management reiterated full-year guidance for adjusted EBITDA loss between $250 million and $275 million and capital expenditures between $40 million and $60 million.

Full Transcript

OPERATOR

Good day and welcome to QuantumScape’s first quarter 2026 earnings conference call. At this time, all participants are in listen only mode. After the speaker’s presentation, there will be a question and answer session. To ask a question during this session, you’ll need to press Star one on your telephone. If your question has been answered and you’d like to remove yourself from the queue, simply press star 11 again. As a reminder, today’s program is being recorded. And now I’d like to introduce your host for today’s program, Sam Kamara, QuantumScape senior director Investor Relations. Please go ahead, sir.

Sam Kamara (Senior Director in Investor Relations)

Thank you operator. Good afternoon and thank you to everyone for joining QuantumScape’s first quarter 2026 earnings call. To supplement today’s discussion, please go to our Investor relations website at ir.quantumscape.com to view our shareholder letter. Before we begin, I want to call your attention to the safe harbor provision for Forward looking Statements that is posted on our website as part of our quarterly update. Forward looking statements generally relate to future events, future technology progress, or future financial or operating performance. Our expectations and beliefs regarding these matters may not materialize. Actual results and financial periods are subject to risks and uncertainties that could cause actual results to differ materially from those projected. There are risk factors that may cause actual results to differ materially from the content of our forward looking statements for the reasons that we cite in our share of the letter form 10K and other SEC filings, including uncertainties posed by the difficulty in predicting future outcomes. Joining us today will be QuantumScape CEO Dr. Seva Sivaram and our CFO Kevin Hetrick. With that, I’d like to turn the call over to Siva.

Siva Sivaram

Thank you, Sam. First, an update on our Eagle Line. This is our highly automated pilot production line to demonstrate scalable production of our solid state lithium metal battery technology. In Q1, we completed installation of the Eagle Line and commenced startup operations. We are producing initial volumes of QSC5 cells and we have been working to continuously improve all aspects of Eagle Line functionality such as equipment, uptime line, throughput control systems and process stability. We’ve been integrating advanced AI models into the Eagle Line and we have seen substantive progress on cell quality and reliability. We believe that the increased production capacity of the Eagle Line will help drive a virtuous cycle of higher data volume, more rapid learning cycles and enhanced quality. In Q2, we plan to ramp QSC5 cell production to support customer programs across automotive and other applications. Development work for EV applications remains our core focus and our largest source of customer billings. We continue to work closely with the Volkswagen Group’s PowerCo as we advance through the phases of our automotive commercialization roadmap. The next phase is field testing. Cells from the Eagle line will be put through a demanding set of real world test conditions and that customer feedback will be used to learn and iterate. Beyond our work With Volkswagen in Q1 we shipped cells to an automotive Joint Development Agreement (JDA) partner for testing. We continue to work through our two Joint Development Agreement (JDA)’s with top 10 global automotive OEMs to bring our solid state lithium metal technology into their vehicle programs. In addition, this quarter we successfully completed our technology evaluation with another top 10 global automotive OEM customer. Their engineers performed hands on testing of our technology and ran competitive benchmarks against other solid state technology approaches. With the success of this effort, we are moving into the next phase of this engagement joint development activities with the ultimate goal of deploying QS technology in their automotive and other applications. Next, an update on our QS ecosystem. This is the cornerstone of our capital light business model. By teaming up with world class companies across the value chain, we can bring our technology to global scale faster and more efficiently. These alliances are a force multiplier for our commercialization efforts as we distribute our technology know how to trusted partners. We continue to work closely with both Maratha Manufacturing and Corning on scaling up production of our solid ceramic separator using our groundbreaking COBRA process to build a new global value chain necessary for GWh scale production of QS technology. Our ecosystem partners are also investing in QS proprietary hardware and systems to produce our ceramic separator. We see this as a clear sign of their commitment to our ecosystem as well as a source of customer billings. In Q1 we recorded our first customer billings from our ecosystem. Next, a word on new markets. We believe our high performance solid state design has compelling attributes to address the evolving energy storage needs of AI data centers. Where conventional lithium ion technology faces safety and performance limitations driven by massive compute demand. Data centers are transitioning to 800 volt DC designs and adopting power systems architecture and technology from the electric vehicle industry. We see this as a natural fit for our no compromise solid state battery in rack. Energy storage and power delivery is a large and fast growing market and the higher energy density of our battery technology can enable increased compute density for AI factories. In addition, we have seen strong customer interest in our battery technology from global players in the military, aerospace and government sectors. Our battery technology unlocks step change improvements in both energy density and power simultaneously. Combined with the superior safety of our solid state design. This is a highly attractive combination for these advanced applications. Our anode free architecture also has supply chain benefits for these customers. Conventional lithium ion batteries require graphite that is almost exclusively sourced from China. In contrast, our battery design is graphite free, eliminating a major pain point for defense applications. To conclude, I want to take a moment to look at the big picture. The world’s energy system is experiencing rapid change. The way we produce, store and use energy is undergoing a once in a century transformation from electric vehicles and AI data centers to grid storage, drones and aerospace, the future of the world economy is being built on electrification. Electrotech. To give just one example, the speed of change and growth in the AI data center market is breathtaking. The technology of the past is struggling to keep up and innovations in energy storage are essential to this transformational change. Thanks to our years of careful planning, consistent execution and constancy of vision, QS is in the middle of this electrotech story. From geopolitical disruptions to the energy system and supply chain risks for critical materials to the explosive growth of electrification across the world economy, the tailwinds for our technology have never been stronger. We believe we have the differentiated technology, world class team, ecosystem partners and customer relationships to capitalize on this revolution even as we tackle the challenges still ahead. Our dedicated team is motivated by a market opportunity that is global in scale and growing every day. We look forward to updating you on our progress over the months to come. With that, I’ll turn things over to Kevin for a word on our financial outlook.

Kevin Hetrick (Chief Financial Officer)

Thank you. Siva GAAP operating expenses and GAAP net loss in Q1 were 109.2 million and 100.8 million respectively. Adjusted EBITDA loss was 63.2 million in Q1 in line with expectations for full year 2026. We reiterate our adjusted EBITDA loss guidance of between 250 million and 275 million. A table reconciling GAAP …

Full story available on Benzinga.com

This post was originally published here

Anduril Industries partnered with Kraken Technology Group to bring “small, high-performance, mass-producible” unmanned surface vessels (USVs) to the U.S. Navy.

The partnership is designed to pair Kraken’s autonomous boats with Anduril’s defense stack.

“This partnership reflects Kraken’s commitment to supporting global maritime challenges with hardened operational capabilities at a critical point in history. Under this agreement, Kraken will deliver low-cost, scalable and modular systems that are both reliable and effective,” said Mal Crease, founder and CEO of Kraken Technology Group.

“Recent conflicts have rewritten the rules of naval warfare. Affordable, scalable unmanned systems now decide outcomes — and the U.S. Navy needs small USVs that carry flexible payloads exceeding 1,000 lbs, sustain extended operations, and …

Full story available on Benzinga.com

This post was originally published here

On Wednesday, ASGN (NYSE:ASGN) discussed first-quarter financial results during its earnings call. The full transcript is provided below.

This content is powered by Benzinga APIs. For comprehensive financial data and transcripts, visit https://www.benzinga.com/apis/.

Access the full call at https://viavid.webcasts.com/starthere.jsp?ei=1752404&tp_key=9e787f2747

Summary

ASGN Inc reported Q1 2026 revenues of $968.3 million, consistent with the prior year and within guidance.

The company is transitioning to operate as Everforth, aligning with its integrated operating model and next wave growth strategy.

Commercial segment revenues grew slightly, driven by demand in AI, data, cloud, and infrastructure, though the adjusted EBITDA margin of 8.6% was below expectations.

New leadership appointments and the acquisition of Quinox are aimed at enhancing solution capabilities and supporting strategic priorities.

Guidance for Q2 2026 includes revenues of $970 million to $1 billion and an adjusted EBITDA margin of 8.8% to 9.5%.

Full Transcript

OPERATOR

Greetings and welcome to the ASGN Inc first quarter 2026 earnings call. At this time, all participants are in a listen only mode. A question and answer session will follow the formal presentation. If anyone should require operating assistance, please press 0 on your telephone keypad. It is now my pleasure to introduce your host, Kim Esterkin, Vice President of Investor Relations. Thank you.

Kim Esterkin (Vice President of Investor Relations)

Good afternoon. Thank you for joining us today for ASGN’s first quarter 2026 conference call. With me are Ted Hanson, Chief Executive Officer, Shiv Iyer, President and Marie Perry, Chief Financial Officer. Before we get started, I would like to remind everyone that our commentary contains forward looking statements. Although we believe these statements are reasonable, they are subject to risks and uncertainties and as such our actual results could differ materially from those statements. Certain of these risks and uncertainties are described in today’s press release and in our SEC filings. We do not assume any obligation to update statements made on this call. For your convenience, our prepared remarks and supplemental materials can be found in the Investor Relations section of our website@investors.asgn.com Please also note that on this call we will be referencing certain non GAAP measures such as adjusted EBITDA, Adjusted Net Income and free Cash Flow. These non GAAP measures are intended to supplement the comparable GAAP measures. Reconciliations between GAAP and non GAAP measures are included in today’s press release. I will now turn the call over to Ted Hanson, Chief Executive Officer.

Ted Hanson (Chief Executive Officer)

Thank you Kim and thank you for joining our first quarter 2026 earnings call. Today marks an important milestone for our company. This will be our final earnings call under the ASGN name and on Friday we will officially begin operating as Everforth and trading under our new stock ticker EFORE. This transition reflects the continued transformation of our business, bringing our capabilities together under the Everforth brand to support a more integrated operating model focused on higher value solutions and deeper client relationships. By pursuing this path we will unlock further scale and increase our cross selling opportunities. As part of this evolution, we are also updating our commercial segment reporting to more clearly reflect how we are evolving the business which is by industry rather than mode of delivery. This change is intentional and aligns with our next wave growth strategy and industry led approach which we previewed at our Investor Day this past November. Ultimately, the delivery structure of our engagements is much less meaningful than the outcomes we drive and the strong value we create for our clients. We will therefore provide color through the lenses that matter most to how we compete in the commercial space. Our five industries and our six solution capabilities. In addition to help track demand for our higher value work and our ability to win in the marketplace, we will disclose our commercial consulting book to Bill consistent with what we’ve shared in prior quarters. With that as background, let’s discuss our first quarter results. Revenues for the first quarter were $968.3 million in line with the prior year and our guidance, Commercial segment revenues were driven by demand in AI and data, cloud infrastructure and application engineering and modernization. Our AI and data and cloud and infrastructure pipelines continue to build reinforcing momentum in these areas of our business. Commercial consulting book to bill was 1.1 times on a trailing twelve month basis. Federal segment new contract awards totaled 151.3 million or a book to bill of 0.7 times on a trailing twelve month basis. Federal contract backlog was approximately 2.8 billion at quarter end or a coverage ratio of 2.4 times the segment’s trailing twelve month revenues. Similar to the commercial segment, AI and data work was a solid contributor to revenues, bookings and pipeline within our federal business. Cybersecurity contracts also nicely contributed to revenue and bookings in a quarter. We are beginning to see award activity at many government agencies pick up following the passage of the federal budget in early February. That said, we experienced some funding delays at the Department of Homeland Security which is navigating both a shutdown and a leadership transition. Importantly, we have not seen any disruption to award funding related to the conflict in Iran. Instead, we are seeing evolving requirements of partner collaboration particularly around cyber threat analysis and data management and analytics as agencies seek to strengthen decision making expertise. While our revenues were within guidance, adjusted EBITDA margin of 8.6% was below our expectations for the quarter. This miss was driven largely by business mix related to lower than expected contribution of some of our higher margin solutions within the commercial segment. Nevertheless, we continue to closely manage our expenses. As discussed during our investor day, we are making strategic pivots in our business that will position us well for the long term. Those changes are being shaped by how our clients themselves are evolving and and the expectations they have for partners that can support them through that change. Our clients are navigating a very volatile macro environment with continued uncertainty around how technologies such as AI and enterprise software will ultimately impact the technology landscape influence their IT spending. While this dynamic can create some near term variability, we are focused on strengthening our foundation by building a more unified brand, enhancing our go to market approach and maintaining disciplined expense management and capital allocation. These actions give us conviction that we are building a stronger, more resilient platform aligned with client demand and positioned to drive top line growth and margin expansion. Against this backdrop, I want to step back and revisit our next wave growth strategy. We continue to make progress executing our long term initiatives and during the first quarter we took several important actions that reinforced our strategic priorities. First, we announced key leadership appointments across both our commercial and federal government segments to support our next phase of growth. We welcome Ashish Jandial as President of Commercial North America, Sanjita Singh as President of Indian International and Donnie Scott as President of our Federal government segment. Each leader brings deep experience scaling global services organizations, driving AI enabled digital transformations and building delivery platforms designed for long term value creation. Collectively, this team enhances our ability to execute our strategy while building on the solid foundation already in place. We also successfully closed the acquisition of Quinox, marking another important milestone in advancing our strategy toward enhancing our solutions capabilities and margins. Quinox meaningfully expands our ability to deliver technical end to end application engineering and modernization solutions for our commercial clients while establishing a strong foundation for our offshore delivery platform in India. Although still early integration is progressing well and we are already co selling their services. Ultimately these actions enhance our ability to support growing client demand for AI led transformation, scalable delivery and outcomes based solutions across industries. We remain focused on executing with discipline and building a higher value more integrated everforth. With that, I’ll turn the call over to Shiv.

Shiv Iyer (President)

Thanks Ted and good afternoon everyone. As TED noted, we go to market through a combination of industry and solutions expertise. We believe industry is the most meaningful lens for understanding where client demand is emerging and how our customers are prioritizing their IT investments. With that in mind, I will begin with our industry performance for the first quarter within our commercial segment, we delivered year on year growth in the healthcare, consumer and industrial and TMT industry reflecting broad based demand for AI and data, cloud and infrastructure, application engineering and modernization and enterprise platforms. Healthcare grew at a high single digit rate driven by increased engagement from healthcare peers. While the consumer and industrial and TMT industry achieved mid single digit growth supported by software, utilities and industrial customers, leveraging our capabilities across AI and data cloud experience in cybersecurity. Though the financial services industry, one of the biggest spenders in it, declined mid single digits year over year, we saw high single digit growth amongst insurance customers where application, engineering and AI engagements continued to gain traction. Consistent with the typical first quarter seasonality in which certain projects conclude at year end, most industries softened sequentially with TMT relatively flat. That said, we saw pockets of strength within several industries in consumer and industrial. For example, utilities delivered low single digit growth supported by demand in application engineering, cloud and infrastructure, and AI and data. Turning to our federal segment, we track our federal revenues across four customer types including defense and Intelligence, national Security, civilian and other clients. Defense, intelligence and national security customers continue to comprise approximately 70% of our total federal revenues, the remaining balance coming from civilian agencies, government sponsored entities, state and local agencies and select commercial customers. National security customers delivered the strongest growth for the segment both year over year and sequentially. This was primarily driven by cybersecurity work supporting the Continuous Diagnostics and Mitigation or CDM Service program within dhs. We also saw mid single digit growth in our other clients year over year led by the USPS where we deployed a purpose built AI application designed to significantly reduce undeliverable mail and improve operational efficiency. Building on the industry discussion, I’d like to transition to our solutions performance which provides a clear view of where the client demand is strongest today and how it is evolving. AI and data remain a significant driver of demand across our portfolio. Our clients are increasingly focused on modernizing data foundations to support analytics, AI enabled decision making and operational agility. Let me provide a few examples. In the consumer industry, we partnered with a leading global athletic apparel and footwear company to design and deploy a unified analytics platform powered by Databricks genie, an agentic AI interface that enables secure access to governed data. By consolidating product assortment, planning, demand bookings and sales into a single governed experience, our client improved product creation, decisioning and speed to market while also establishing a reusable foundation to scale across broader demand planning and supply chain use cases. Databricks is one of our core strategic partners and during the quarter our commercial business was recognized as a Databricks Silver Tier partner. Leveraging that partnership, our industrial team supported a Fortune 100 energy and utilities company in migrating from legacy architectures to a databricks based integration. This effort aligned the client to its enterprise data strategy while also reducing long term risk and strengthening governance. Following the success of this project, our client is engaging our teams to support legacy migrations into databricks across other areas of the organization. We’re also helping customers unlock the full value of modern hyperscaler AI services in the cloud. In the TMT vertical. For example, our AI and cloud teams partnered with AWS to support a Fortune 50 media company in building a digital twin of its streaming platform. This solution combines advanced cloud engineering with AI powered simulations to help our client proactively identify performance risks ahead of some of the largest global streaming sporting events that commonly draw over 100 million viewers. A successful project, we now have a repeatable use case that can be extended across TNT clients with similar streaming and gaming environments. As AI adoption and data volumes accelerate, cybersecurity has become an increasingly integral component of nearly every client engagement in the healthcare industry. We secured an extension with a large national insurance pair to modernize their identity governance using SailPoint. This work established a central identity framework that supports regulatory compliance while safeguarding sensitive patient and member data. Alongside this modernization work, we continue to provide ongoing SailPoint platform support, reinforcing our long term client relationship in the federal market. We’re supporting the Cybersecurity and Infrastructure Security Agency, or CISA through the aforementioned CDM program by delivering security information and event management as a service. This capability standardizes security data collection across federal agencies and enables real time threat detection and rapid response. We also delivered a first of its kind ATO accredited development environment for the US Navy, a secure government approved workspace where teams can safely build, test and manage software and data. By combining our Dev Labs and software factory with Elastics cloud infrastructure and AI enabled automation, we created a development environment that aligns with the DoD’s zero …

Full story available on Benzinga.com

This post was originally published here