Redfin Economists’ Weekly Take: Rates Likely to Hold Steady–Unless Fed Meeting or Iran War Rattle Markets
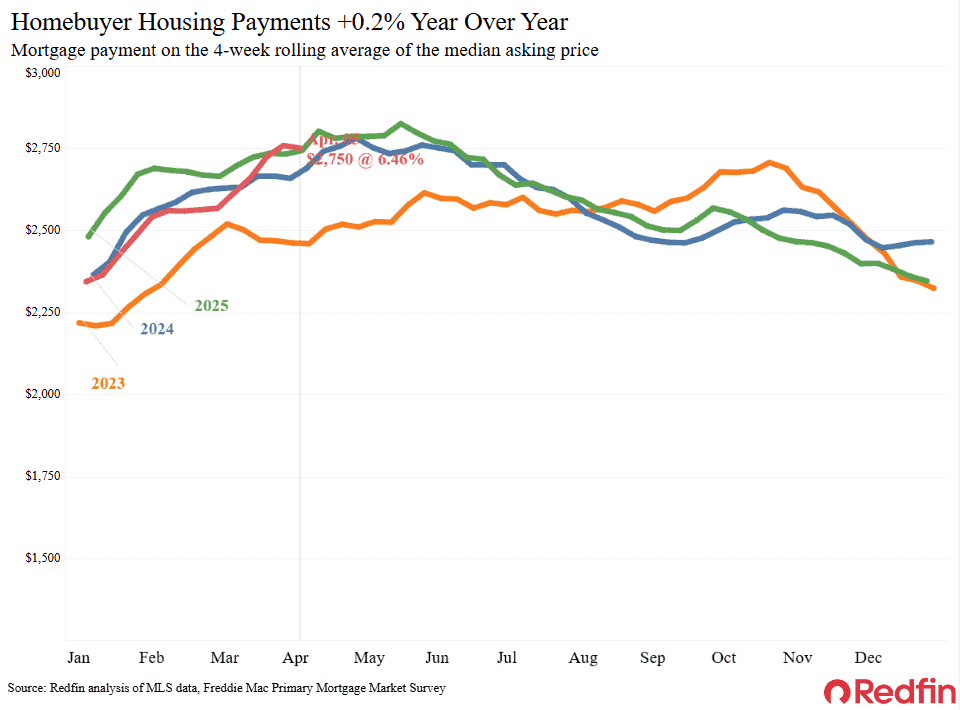
This Week In A Nutshell: Mortgage rates are likely to remain fairly steady this week.
Upcoming Attractions
The key event on the docket this week is Wednesday’s Fed meeting, which is likely to be Chair Jerome Powell’s last before his term ends May 15. It looks very likely that Kevin Warsh will be in place before the June 17 meeting. The Fed is all but certain to hold rates steady and signal no cuts in the near future. One question will be how they talk about the possibility of cuts later in the year. But much of the focus will be on whether Powell says he will leave the Board when his chairmanship ends. More on that below.
The most important data points this week will be the first read of Q1 GDP on Thursday and March PCE inflation. GDP growth is expected to increase to just over 2% from 0.5% in Q4 while core inflation is expected to accelerate in March to a 3.2% annual rate from 3.0% previously. And, of course, a breakthrough in the negotiations between the US and Iran has the potential to move markets, despite the story fading from the headlines.
Last Week’s Highlights
Geopolitical events continued to dominate last week. The Strait of Hormuz remained essentially closed as peace negotiations dragged on. Kevin Warsh had his confirmation hearing before the Senate, but the real breakthrough came on Friday when Jeanine Pirro closed her office’s criminal investigation of the Fed, which had been holding up Warsh’s confirmation. It now seems likely Warsh will be ready to assume the chairmanship on May 15 when Powell’s term ends.
Finally, March retail sales data was strong, even after stripping out gas spending. It appears larger tax refunds have been a tailwind for consumers, but Chase’s credit card data suggests it’s a temporary phenomenon that won’t last into April.
Diving a Little Deeper
Most of the time, the Fed succession process focuses on policy differences between the outgoing and incoming chair (of which there are plenty, though it’s unlikely to affect rates in the foreseeable future). This time, there’s been an unusual amount of palace intrigue. With Jeanine Pirro’s investigation closed, the remaining question is whether Powell stays on the Board of Governors, which he may address on Wednesday.
- While Powell’s term of Fed chair ends May 15, his term on the Board of Governors ends January 2028 because while chair terms are 4 years, governor terms at 14 years.
- The Federal Open Markets Committee (FOMC), which makes interest rate decisions, consists of twelve voting members, seven governors from the Board and twelve regional bank presidents (five of whom vote at each meeting).
- Only one Fed chair in history has stayed on the Board after stepping down and that was at then President Truman’s request. Powell has not committed to following tradition, mostly because he needed leverage as the White House pursued a criminal investigation. With that investigation over, it seems likely Powell will announce a full retirement this Wednesday. But he has said previously that he would make a decision based on “what I think is best for the institution and the people we serve.”
- If he does not leave, the White House can still install Warsh as Chair. When Fed governor Adriana Kugler abruptly resigned in August, the White House had anticipated this potential issue and placed CEA chair Stephen Miran in her seat with the understanding that he was warming a seat for the eventual chair. So if Powell stays, then the President only has Warsh’s seat, but if Powell goes, then the President can nominate another member of the Board.
- In either case, Powell’s decision should not have a huge impact on rates in the near terms. Staying would increase the strain between the White House and the Fed, but it’s not clear how that should affect rates. Leaving would give the President four seats out of seven on the Board, but it’s not clear any of the individuals in those seats would want to alter the institutional structure of the Fed.
Redfin Housing Market Reports
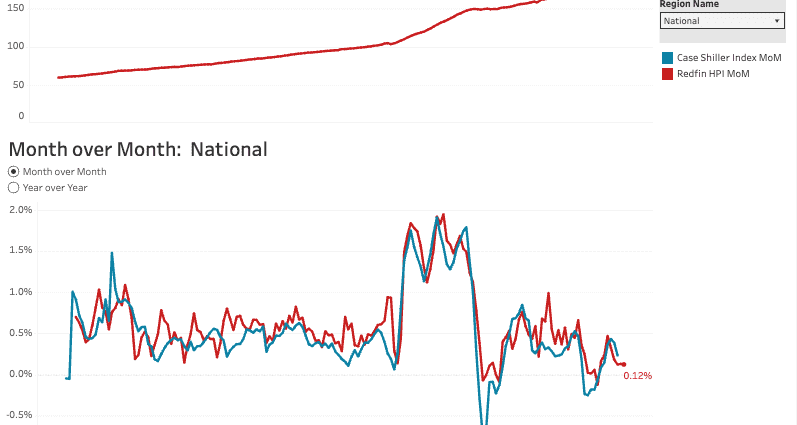
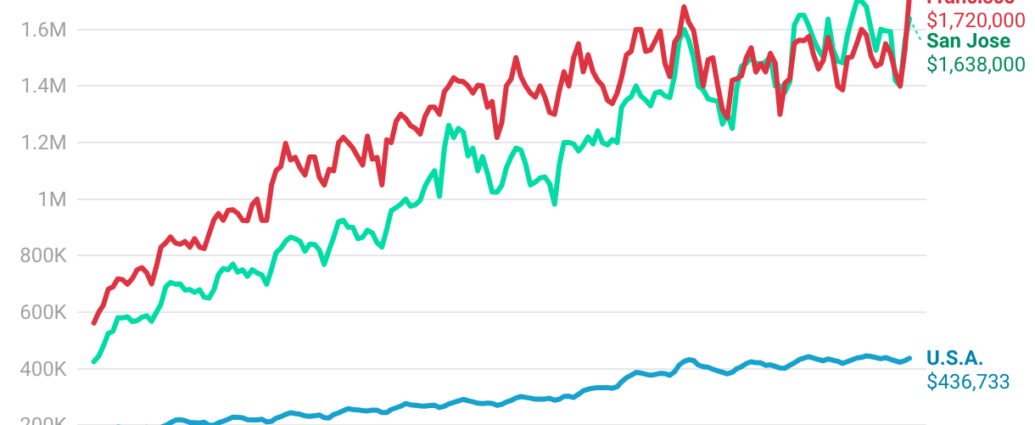
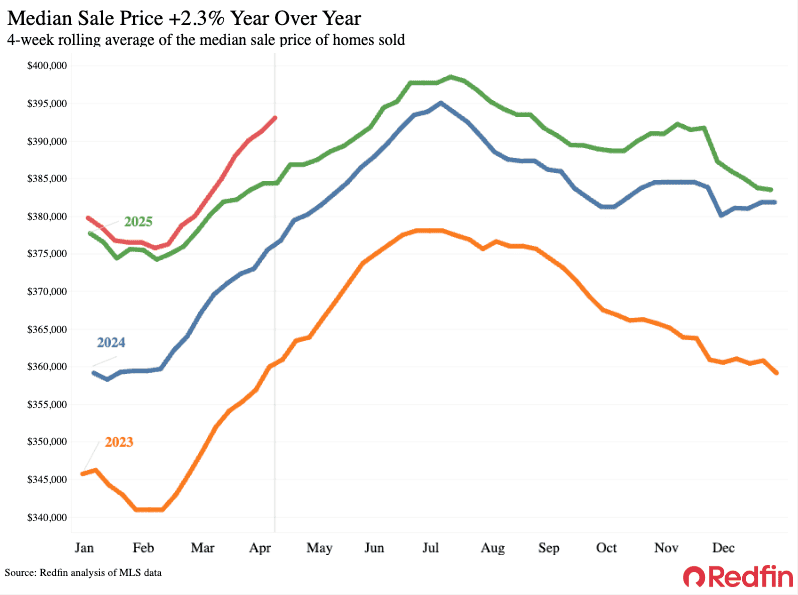
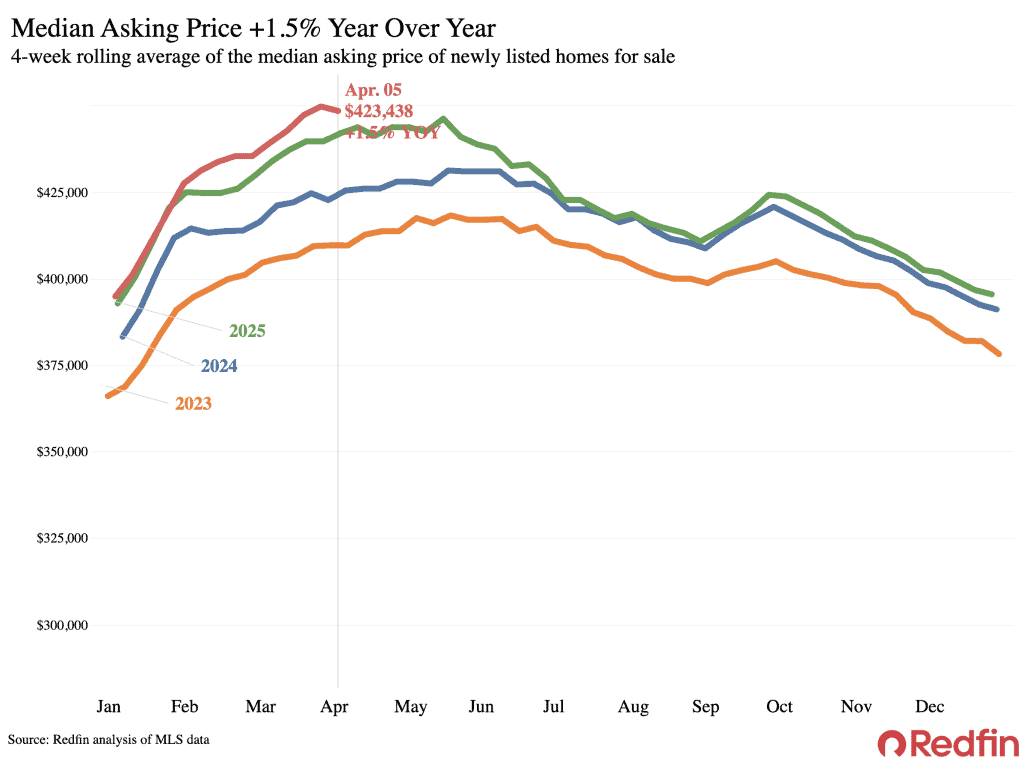
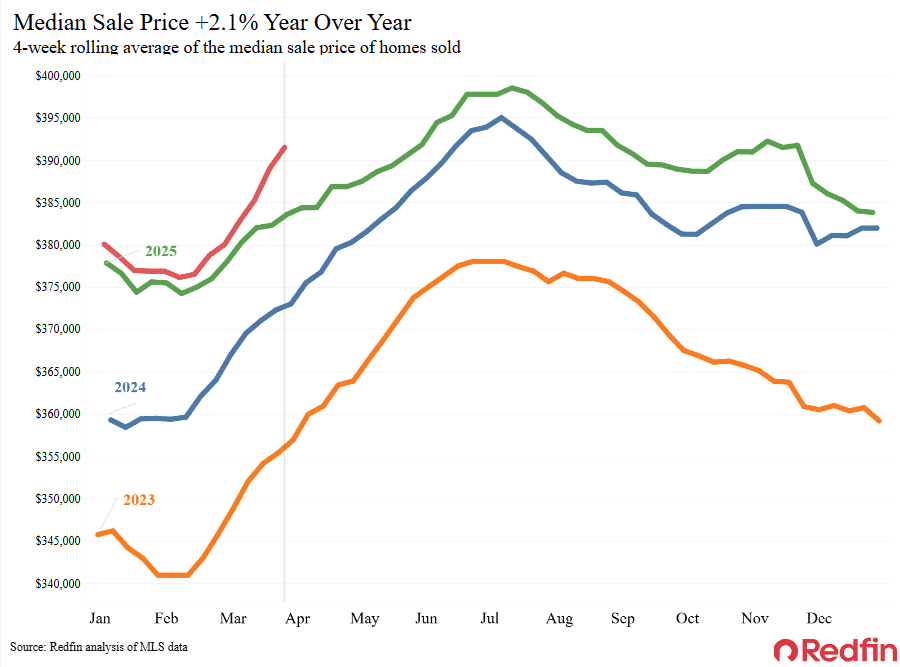
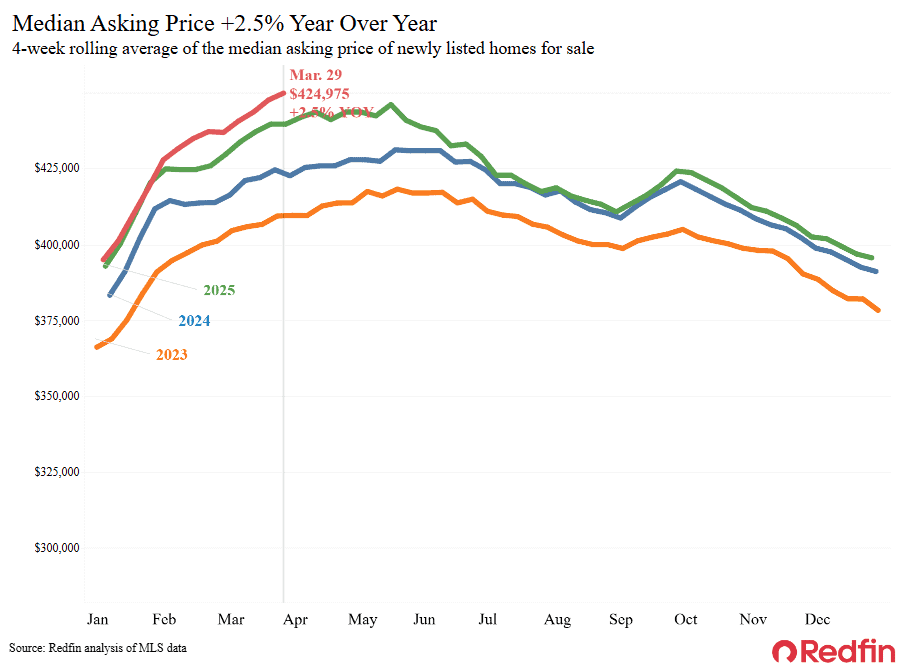
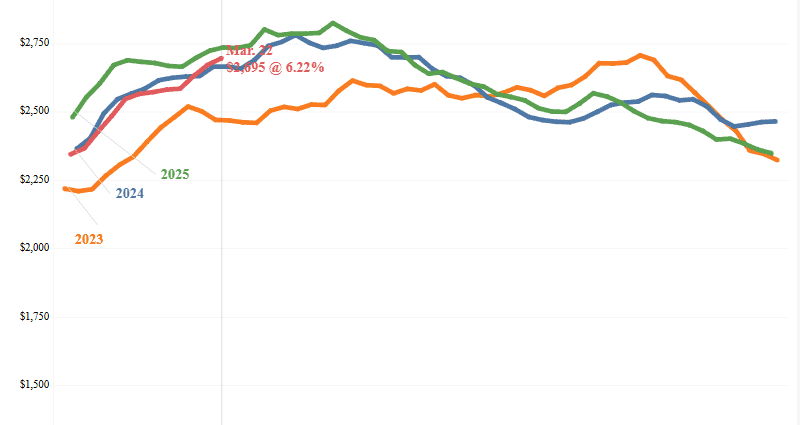
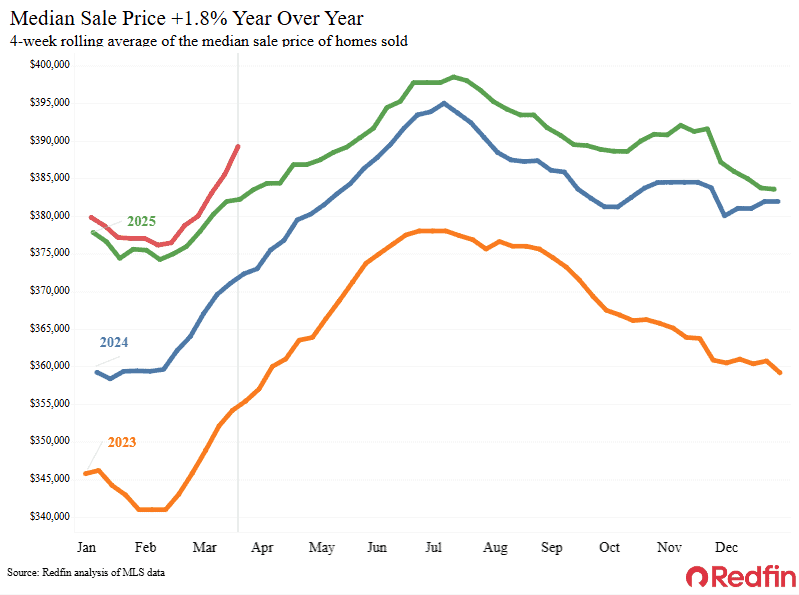
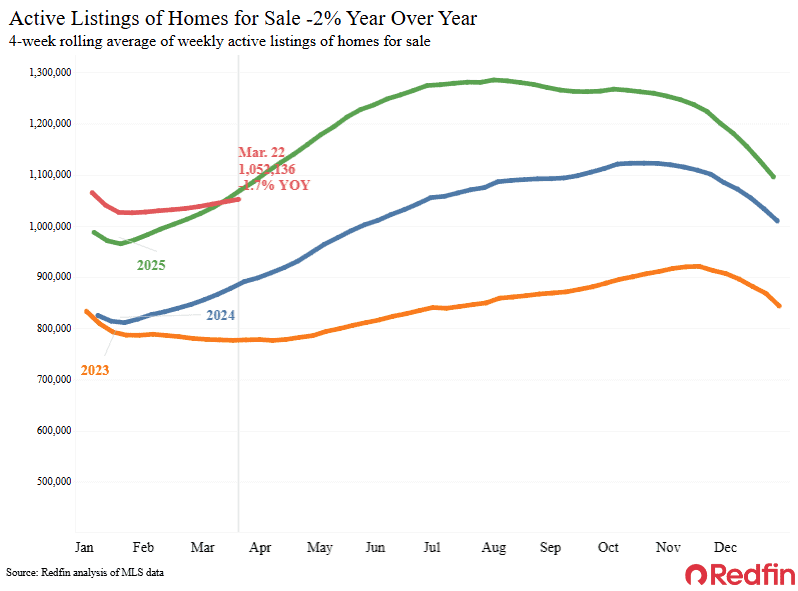
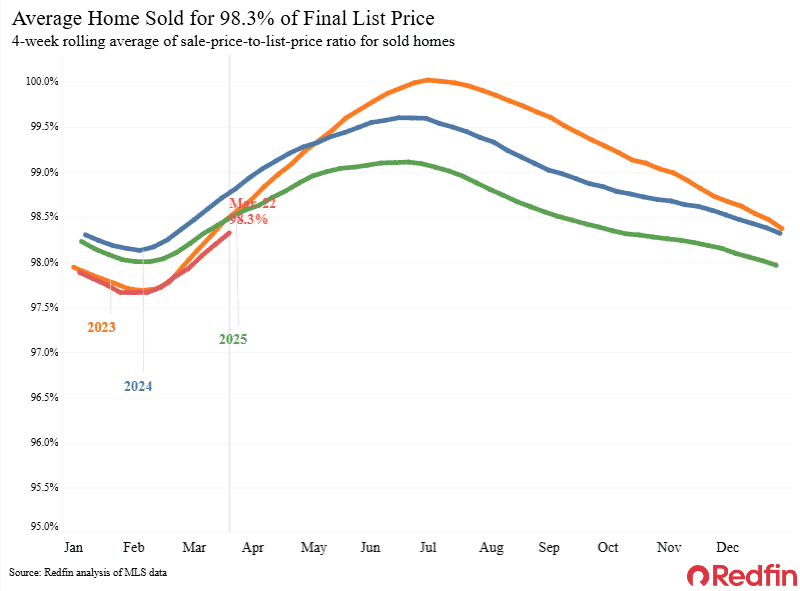
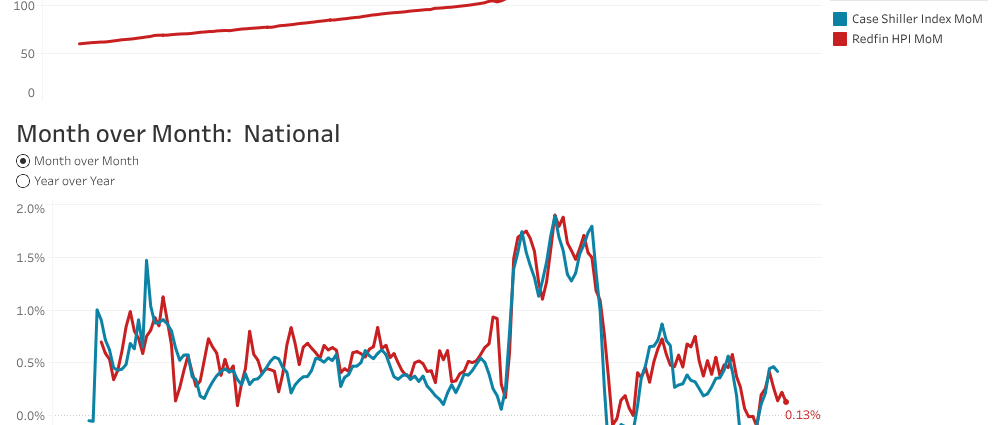
U.S. Home Prices Inched Up 0.1% in March
- Home prices ticked up 0.1% month over month on a seasonally adjusted basis.
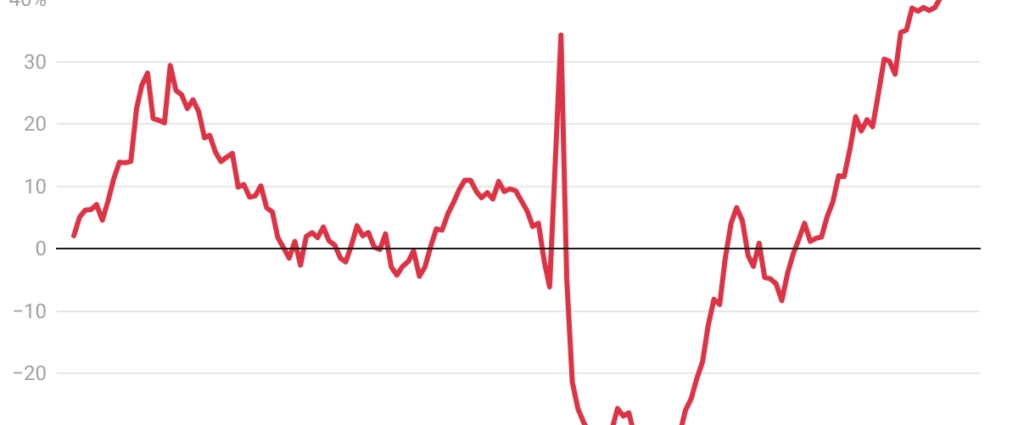
- Prices rose 1.7% on a year-over-year basis–the slowest growth rate on record.
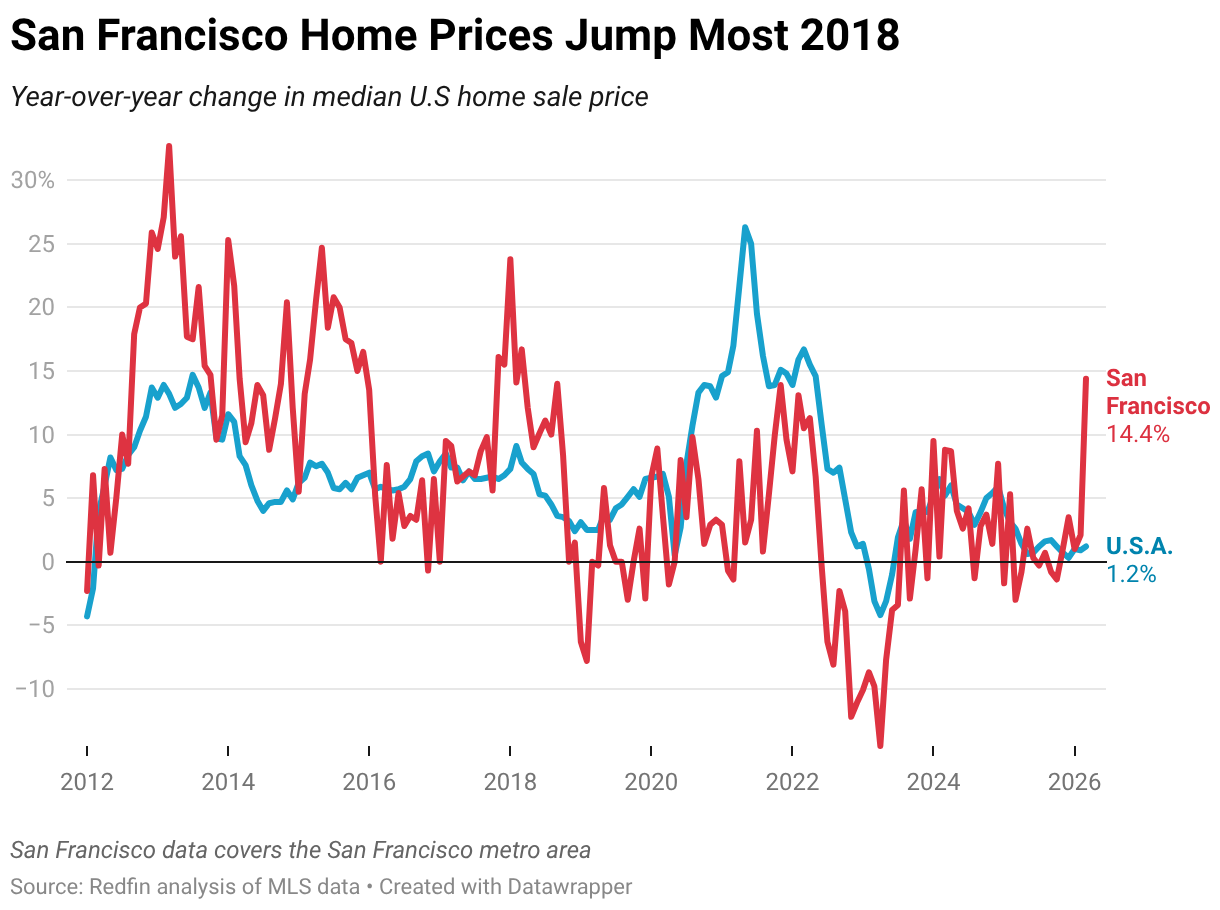
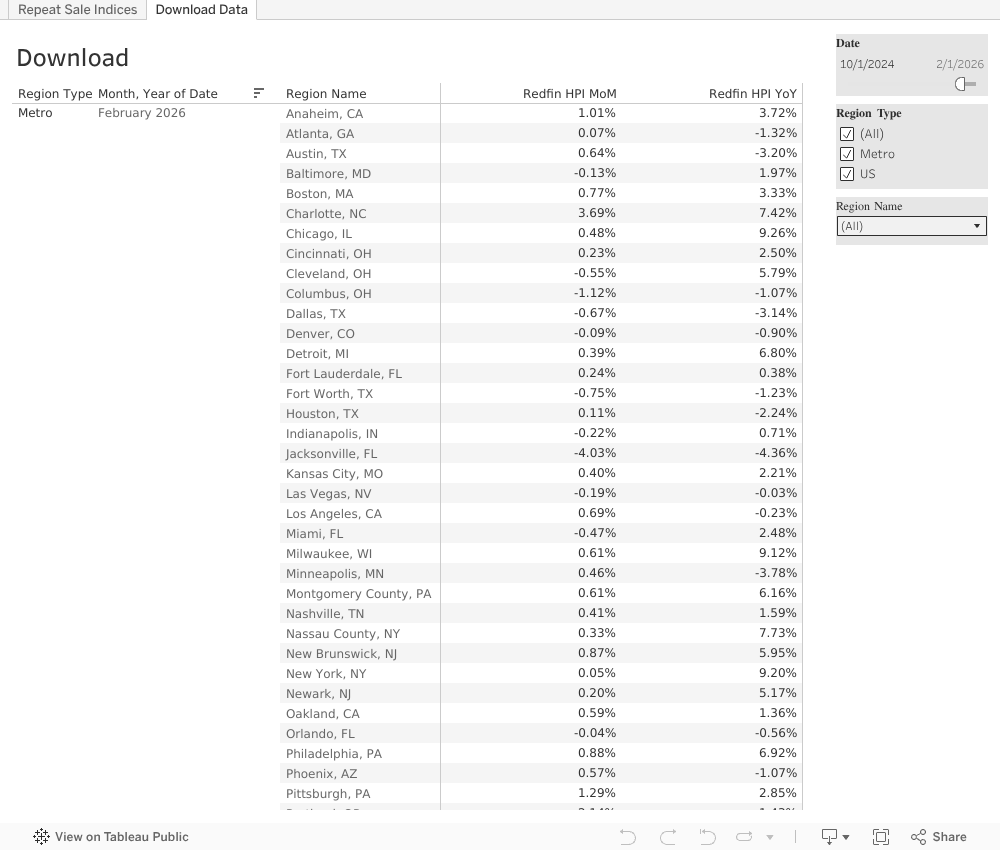
- On a local level, prices fell in 13 major metros month over month, with the biggest declines in Texas and the biggest increase in San Francisco.
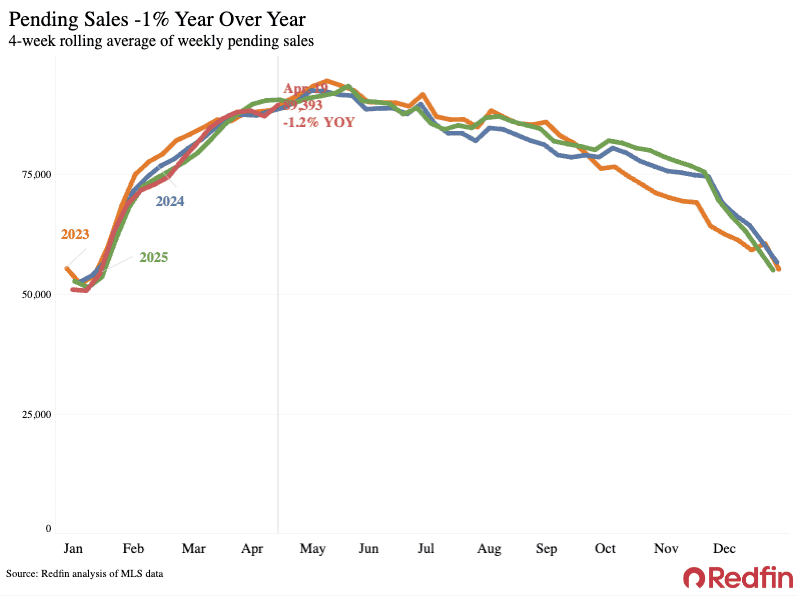
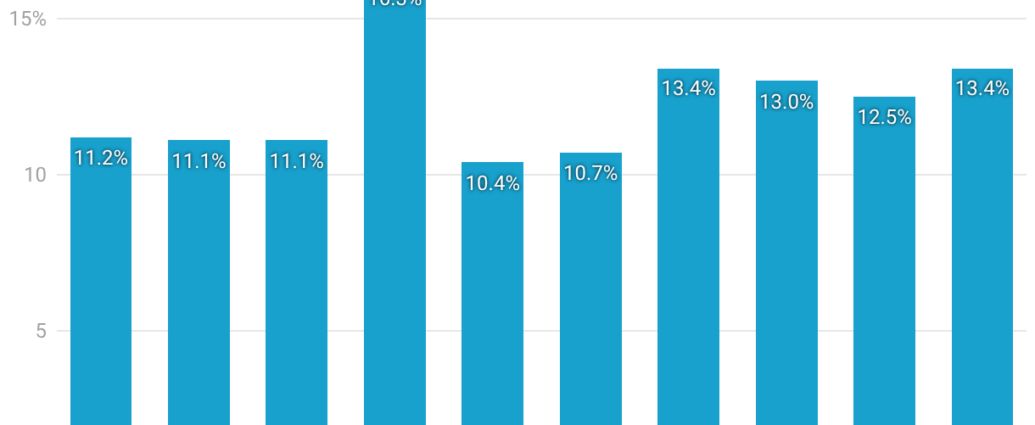
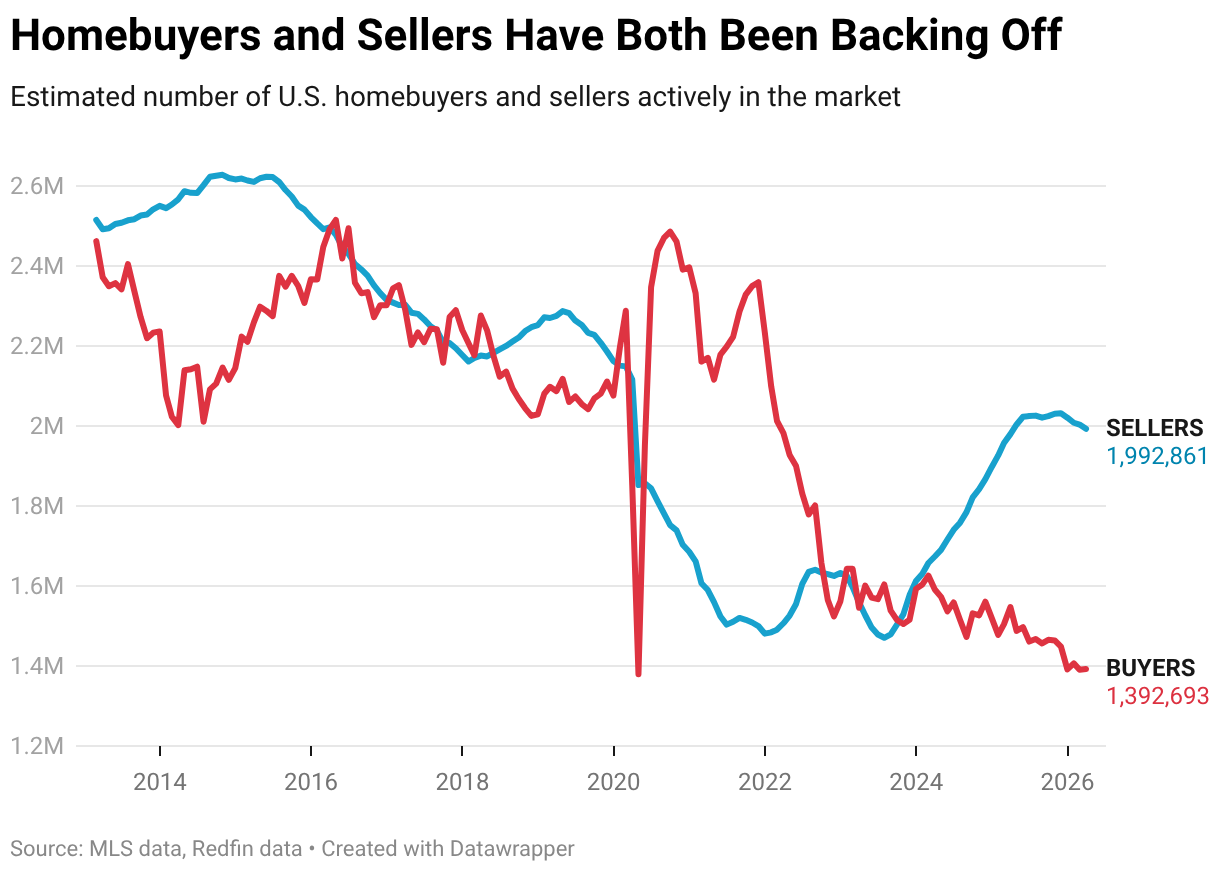
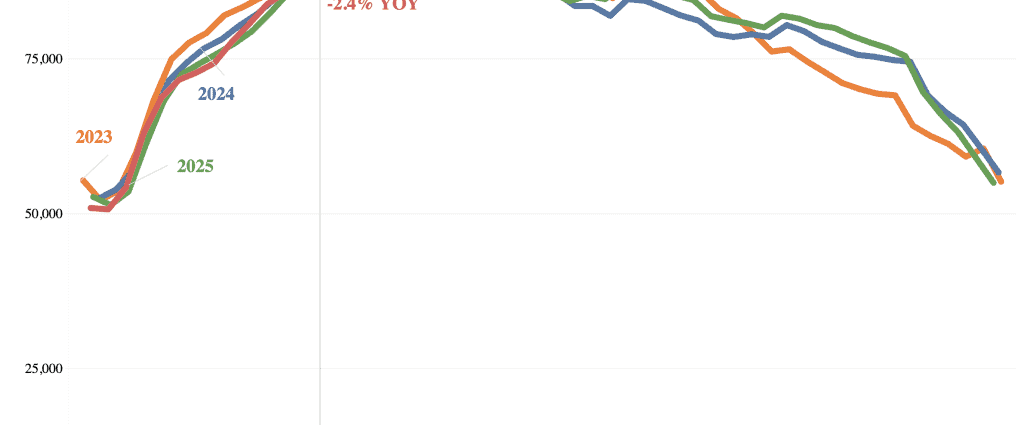
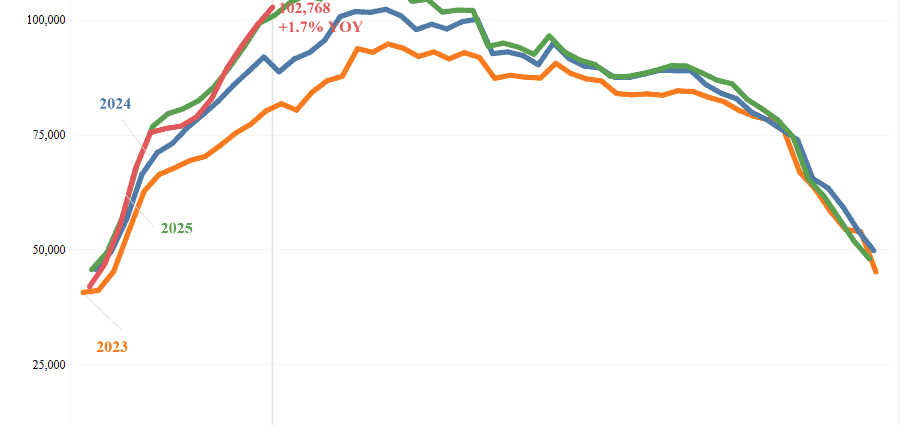
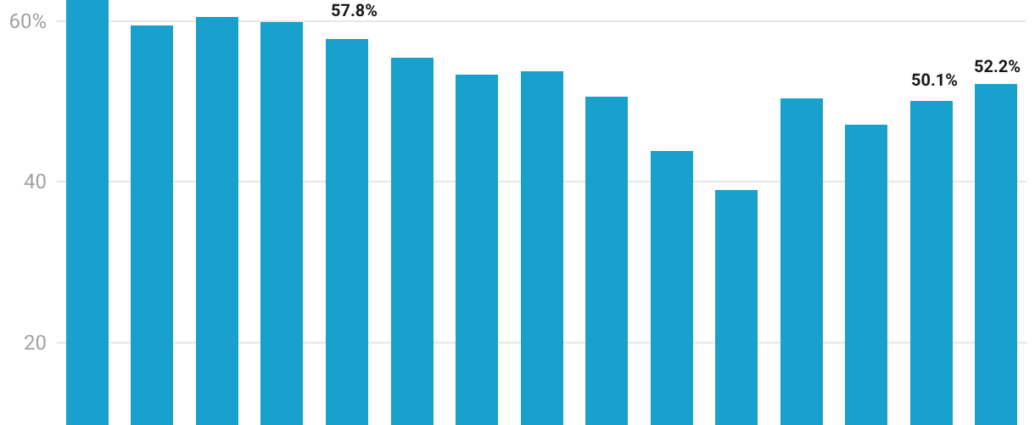
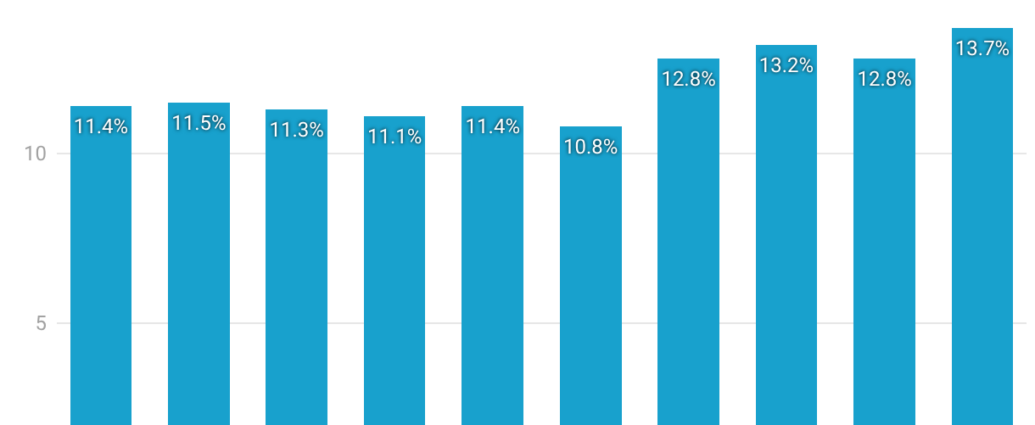
More Than 50,000 Home-Purchase Contracts Fell Through in March
- 13.4% of home-sale agreements that went under contract in March were canceled. House hunters are getting cold feet as costs stay high and economic uncertainty is in the air.
- Contract cancellations are most common in big-time buyer’s markets like San Antonio and Orlando, where home searchers have a lot of options.
- They’re least common in Nassau County, Montgomery County and Milwaukee–three of just five seller’s markets in the U.S.
The post Redfin Economists’ Weekly Take: Rates Likely to Hold Steady–Unless Fed Meeting or Iran War Rattle Markets appeared first on Redfin Real Estate News.