
Ryman Hospitality Props (NYSE:RHP) reported first-quarter financial results on Friday. The transcript from the company’s first-quarter earnings call has been provided below.

Benzinga APIs provide real-time access to earnings call transcripts and financial data. Visit https://www.benzinga.com/apis/ to learn more.

View the webcast at https://edge.media-server.com/mmc/p/3vwjb846/

Summary

Ryman Hospitality Props reported a strong start to the year with first-quarter results exceeding expectations despite a complex geopolitical backdrop.

The company’s hospitality segment saw revenue and market share growth, with notable record performances from Gaylord Opryland, Gaylord Rockies, and Gaylord Palms.

Ryman Hospitality Props announced a development partnership in Indianapolis, indicating strategic growth in the entertainment sector with plans to expand the All Red brand.

Future outlook remains positive, with the company on track to meet its 2027 financial targets, supported by robust group booking trends and strategic capital investments.

The company raised its full-year guidance midpoints due to strong first-quarter performance, maintaining a measured confidence amidst potential external economic headwinds.

Full Transcript

OPERATOR

Welcome to the Ryman Hospitality Properties first quarter 2026 earnings conference call. Hosting the call today from Ryman hospitality properties are Mr. Colin Reed, Executive Chairman, Mr. Mark Fioravanti, President and Chief Executive Officer, Ms. Jennifer Hutchison, Chief Financial Officer, Mr. Patrick Chaffin, Chief Operating Officer and Patrick Moore, Chief Executive Officer, Opry Entertainment Group. This call will be available for digital replay. The number is 800-723-0607 with no conference ID required at this time. All participants have been placed on listen only mode. It is now my pleasure to turn the floor over to Ms. Jennifer Hutchison. Ma’am, you may begin.

Jennifer Hutchison (Chief Financial Officer)

Good morning. Thank you for joining us today. This call may contain forward looking statements as defined in the Private Securities Litigation Reform Act of 1995, including statements about the company’s expected financial performance. Any statements we make today that are not statements of historical fact may be deemed to be forward looking statements. Words such as believes or expects are intended to identify these statements which may be affected by many factors, including those listed in the Company’s SEC filings and in today’s release. The Company’s actual results may differ materially from the results we discuss or project today. We will not update any forward looking statements, whether as a result of new information, future events or any other reason. We will also discuss non GAAP (Generally Accepted Accounting Principles) financial measures today. We reconcile each non GAAP (Generally Accepted Accounting Principles) measure to the most comparable GAAP (Generally Accepted Accounting Principles) measure in exhibits to today’s release. I’ll now turn the call over to Colin.

Colin Reed (Executive Chairman)

Thanks, Jen. Good morning everyone and thank you for joining us today. We delivered a strong start to the year with results that exceeded our expectations. Despite the complex geopolitical backdrop. Our first quarter performance reinforces what we’ve long believed about this company. The quality of our assets, the durability of our business model and the way we allocate capital delivers superior outcomes for our customers and attractive, sustainable returns for our shareholders. In our same store hospitality business, we grew revenue and market share and expanded margin on slightly fewer room nights, a clear demonstration of pricing discipline, mix management towards higher value customers and enhanced monetization of on site demand. Results were particularly strong for the assets that we have that have recently benefited from the capital investments. Gaylord Opryland delivered record first quarter revenue and adjusted EBITDAre (Earnings Before Interest, Taxes, Depreciation, Amortization, and Rent expenses), Gaylord Rockies delivered record first quarter revenue and Gaylord Palms delivered record revenue and adjusted EBITDAre (Earnings Before Interest, Taxes, Depreciation, Amortization, and Rent expenses) of any quarter in its history. The JW Marriott Desert Ridge also delivered strong first quarter results which, given the seasonality of that market, is especially meaningful for the full year profitability. Though we’ve owned this hotel for less than a year, the benefits of our ownership are already evident. A group focus yield strategy resulted in meaningfully higher group volumes which supported strong outside of the room spending and margin outcomes. Together, this property and the JW Hill Country which is now undergoing the capital investment that we identified at the acquisition, create a tangible Runway for growth over the medium term and I couldn’t be more excited about their role in our future. On the entertainment side, demand for live entertainment remains incredibly healthy. Our All Red brand continues to resonate in a meaningful way, particularly in markets like Nashville and Las Vegas. And soon, we believe, Indianapolis. Indianapolis has long been on our radar as a vibrant convention and leisure market with strong economic and demographic drivers and a deep base of country music fans. To that end, we were excited to announce just this week a development partnership with the organization behind the NBA Pacers and the WNBA Fever. This All Red development will contribute to the broader revitalization of the downtown corridor between the convention center and the Pacers Arena. This announcement marks our third development update this year and our team remains active in evaluating both organic and inorganic growth opportunities toward expanding our platform and enhancing the value proposition for artists and consumers alike. Looking ahead, the future looks very bright for both of our businesses. Over the last two years, we’ve meaningfully improved the growth profile and pipeline for each, while continuing to build customer satisfaction and loyalty through consistent execution and focused capital investment. We remain on track to achieve the 2027 financial targets we set in early 2024 and we look forward to updating you on our continued progress. Now, before I hand over to Mark, let me go off script and say just a couple of things about our team. Our asset management team led by Patrick Chapman I believe is the best in the industry and our team at OEG led by Patrick Moore is firing on all cylinders. Mark, Jen and Scott and their teams are showing tremendous leadership and our company couldn’t be in better hands. So Mark, what have you got to tell us?

Mark Fioravanti (President and Chief Executive Officer)

Thanks Colin and good morning everyone. I’ll provide more color on our operating performance and business momentum before discussing our updated outlook. From an expectation standpoint, we entered the quarter assuming relatively flattish revenue and some margin pressure in our same store hospitality business along with softer profitability trends in entertainment due in part to mix driven seasonality and a challenging year over year comparison. Entertainment performance finished in line with our expectations. While the hospitality business delivered meaningful outperformance. Same store ADR (Average Daily Rate) increased just over 5% year over year, more than offsetting lower group occupancy. As you’ll recall, the timing of Easter last year resulted in unusually strong group demand in the first quarter, creating a challenging year over year comp. High quality corporate group demand proved far more resilient than lower contribution segments resulting in higher ADR (Average Daily Rate) and higher levels of outside the room spending. Compared to both our expectations and last year banquet NAV (Net Asset Value) revenue contribution per group room night increased more than 6% year over year with gains at nearly every property in the portfolio. Our leisure business, while a smaller contributor to the first quarter results, also surprised to the upside. Both demand and rate increased compared to last year supported by seasonal spring break travel with particular strength at the JW Marriott Hill country and Gaylord Rockies. Higher flow through from growth in room rate and catering business together with ongoing efficiency initiatives drove adjusted ebitdare margin expansion in the quarter. Looking forward, the leading indicators of group demand remain resilient. The elevated attrition and cancellation activity we experienced last year has largely normalized. Excluding January which was impacted by Winter Storm Fern attrition improved year over year and cancellations for the year were essentially flat. On the heels of record monthly production in December, group bookings activity continued at very strong levels in the first quarter. Gross group room nights booked in the first quarter for all periods increased nearly 27% year over year, representing the strongest first quarter production since 2018. Reflecting our continued focus on premium corporate groups. Corporate bookings comprised approximately two thirds of production. Association bookings were also strong, surpassing pre Covid first quarter levels for the first time, setting aside pandemic related rebooking activity. As a result, growth in same store group rooms revenue on the books for all future periods compared to the same time last year accelerated sequentially from 6.5% as of December 31 to 7.6% as of March 31. Across the portfolio and most notably at Gaylord Opryland, we’ve invested in food and beverage offerings and carpeted meeting space to attract and serve the premium corporate group segment. In support of our capital deployment strategy and the increasing corporate demand for our hotels, we’ve refined our inventory management approach to make more sellable inventory available through the entire 24 month corporate booking window. Enhancing the corporate mix of our hotels drives higher room rates outside the room spending and profitability. However, these changes in our inventory management approach create challenging year over year comparisons as we move into the prime corporate booking window for 2027 and 2028. For 2027, same store group rooms revenue on the books is up over 3% compared to the same time last year and down 1% for 2028. Importantly, ADR (Average Daily Rate) growth for both periods is pacing up mid single digits and corporate meeting planner feedback and lead volumes are strong. Given this interest, we’re confident that we are well positioned to achieve the booking goals required to enter 2027 and 2028 with our targeted 50 points of occupancy on the books and strong rate growth. Now I’ll turn to JW Marriott Desert Ridge which also delivered a terrific first quarter. Prior to our ownership, the property prioritized higher rated leisure demand during the peak first quarter period. Under our group first sales and revenue management strategy, Group mix increased by nearly 200 basis points and group demand grew more than 9% while maintaining ADR (Average Daily Rate) discipline. In fact, total ADR (Average Daily Rate) for the Property increased nearly 8% year over year with growth across group and leisure segments and banquet and AV revenue up 25%. We expect these trends to build over the next several years as the property grows its share of the meetings market under our group strategy. Supporting this strategy, we completed the 5,000 square foot meeting space conversion in April which we believe will further enhance the hotel’s ability to attract high quality corporate groups. Turning to entertainment, first quarter results declined year over year due to a challenging comparison seasonality associated with our new business line and the impact of Winter Storm Fern. Overall business performance was in line with our expectations and we continue to be encouraged by the underlying trends. Both old red and category 10 exceeded our expectations with particular strength in Nashville in Las Vegas in the back half of the quarter, March represented a new high watermark for Old Red Las Vegas with the venue generating the highest monthly revenue and adjusted EBITDA re in its operating history. Finally, I want to spend a few minutes on our outlook. As we noted in the press release, we’re raising the midpoints of our guidance ranges to reflect the first quarter hospitality outperformance. Our outlook for the rest of the year is essentially unchanged from our prior expectations, reflecting measured confidence in our business. We continue to feel good about the areas of the business within our control sales, production, pricing, discipline, margin initiatives and execution of the capital projects we have underway. And so far, meeting planner sentiment and the leisure guest willingness to visit our properties has remained resilient. What gets us to the high end of the range is continued strong near term group business trends including normalized levels of attrition and cancellations, healthy in the year for the year production and strong on property spending as well as continued momentum in leisure. The low end of the range assumes some hesitation in near term meeting planner decision making, a potential pullback in …

Full story available on Benzinga.com

This post was originally published here

Encompass Health (NYSE:EHC) held its first-quarter earnings conference call on Friday. Below is the complete transcript from the call.

This transcript is brought to you by Benzinga APIs. For real-time access to our entire catalog, please visit https://www.benzinga.com/apis/ for a consultation.

Access the full call at https://events.q4inc.com/attendee/918380473

Summary

Encompass Health reported a 9% increase in first quarter revenue and an 11.2% rise in adjusted EBITDA, leading to a raised guidance for 2026.

The company highlighted improvements in patient discharge rates and staff turnover, with RN turnover reaching its lowest since 2012.

Encompass Health is expanding capacity with new hospitals and bed additions, planning to open seven more hospitals and add 100-150 beds to existing facilities this year.

The company is exploring small format hospitals to complement its existing strategy and address occupancy challenges.

Management noted the strong demand for inpatient rehabilitation services and discussed strategic investments in clinical staff development programs.

Guidance for 2026 includes revenue between $6.375 and $6.470 billion, adjusted EBITDA of $1.35 to $1.38 billion, and EPS of $5.89 to $6.11.

The company is maintaining a strong pipeline of joint venture projects and is confident in its ability to secure new partnerships.

Operational efficiency has improved, with premium labor costs declining and a focus on reducing clinical staff turnover.

Encompass Health is seeing favorable results from its admit and appeal strategy for Medicare Advantage patients, aiming to expand this initiative.

Full Transcript

OPERATOR

Good morning everyone and welcome to the Encompass Health first quarter 2026 earnings conference call. At this time I would like to inform all participants that their lines will be in a listen only mode. After the speaker’s remarks, there will be a question and answer period. If you’d like to ask a question during this time, please press star1 on your telephone keypad. You’ll be limited to one question and one follow up question. Today’s conference call is being recorded. If you have any objections, you may disconnect at this time. I will now turn the call over to Mark Miller, Encompass Health’s Chief Investment Relations Officer. Please go ahead.

Mark Miller (Chief Investment Relations Officer)

Thank you Operator and good morning everyone. Thank you for joining Encompass Health’s first quarter 2026 earnings call. Before we begin, if you do not already have a copy, the first quarter earnings release supplemental information and related Form 8K filed with the SEC are available on our website@encompasshealth.com on page two of the supplemental information you will find the safe harbor statements which are also set forth in greater detail on the last page of the earnings release. During the call we will make forward looking statements such as guidance and growth projections which include which are subject to risks and uncertainties, many of which are beyond our control. Certain risks and uncertainties like those relating to regulatory developments as well as volume, bad debt and cost trends that could cause actual results to differ materially from our projections, estimates and expectations are discussed in the company’s SEC filings including the earnings Release and related Form 8K, the Form 10K for the year ended December 31, 2025 and the Form 10Q for the quarter ended March 31, 2026. When filed, we encourage you to read them. You are cautioned not to place undue reliance on the estimates, projections, guidance and other forward looking information presented which are based on current estimates of future events and speak only as of today. We do not undertake a duty to update these forward looking statements. Our supplemental information and discussion on this call will include certain non GAAP financial measures for such measures. Reconciliation to the most directly comparable GAAP measure is available at the end of the supplemental information. At the end of the earnings release and as part of the Form 8K filed yesterday with the SEC, all of which are available on our website. I would like to remind everyone that we would adhere to the one Question and one follow up question rule to allow everyone to submit a question. If you have additional questions, please feel free to put yourself back in the queue. With that, I’ll turn the call over to President and Chief Executive Officer Mark Tarr.

Mark Tarr (President and Chief Executive Officer)

Thank you Mark, and good morning everyone. We are pleased with our start to 2026 as first quarter revenue increased 9% and adjusted EBITDA increased 11.2%. Based primarily on our Q1 results, we are raising our guidance for 2026. Doug will review the details in his comments. We achieved these strong results while once again delivering outstanding patient outcomes. Compared to Q1 of 25, our discharge community rate improved 50 basis points to 84.5%, our discharge acute rate improved 30 basis points to 8.6% and our discharge to SNF rate improved 20 basis points to 6.2%. Our performance on each of these quality metrics exceeds the industry average. We continue to invest in our clinical staff by providing professional growth and development programs such as our Career Ladder programs, providing nurses with support to attain certified rehabilitation RN certifications, and offering in house continuing education opportunities. We’ve seen increased participation in and benefits from these development programs. We believe our success in these programs contributes to the continuing improvement in our clinical staff turnover trends. Q1 to 26 annualized RN turnover was 17.8%, down from fiscal year 25’s 20.2%, and annualized therapist turnover was 6.4%, down from last year’s 7.8%. This represents our lowest RN turnover rate since at least 2012 and helped drive a 9.4% decline in premium labor spend compared to Q1 2025. We also believe that our clinical advancement programs and reduced clinical staff turnover further enhance our abilities to serve high acuity medically complex patients and increased patient satisfaction scores. Demand for IRF services remains strong and we are continuing to invest in capacity additions to meet the needs of patients requiring inpatient rehabilitation services. In Q1, we opened a new 49 bed hospital in Irmo, South Carolina, our 11th hospital in that state. We also added 44 beds to existing hospitals. Over the balance of the year. We plan to open seven more hospitals with a total of 340 beds and add an incremental 100 to 150 beds to existing hospitals. We continue to build and maintain an active pipeline of new hospital development projects, both wholly owned and joint ventures while also executing on bed expansion opportunities as dictated by occupancy trends and market dynamics. Our pipeline of announced new hospital projects with opening dates beyond 2026 currently consists of 11 hospitals with 520 beds and we anticipate additional projects including small format hospitals will be announced over the balance of the year. We have previously discussed the innovation of our small format hospital which will serve to facilitate a hub and spoke strategy in large and growing markets. We are confident we will open at least one small format hospital in 2027 with the potential to add more depending on the timing of pending real estate transactions. The small format hospitals will operate as remote locations under the same Medicare provider number as an existing in market hospital and will share certain administrative services with that hospital. Small format hospitals will complement our existing development de novo and bed expansion strategies. This is a particularly active year on the regulatory front with implementation of TEAM beginning on January 1st and the expansion of RCD into Texas effective March 1st and California beginning today. We will work to address these developments as we have the numerous other regulatory challenges which we have successfully navigated in the past through extensive preparation and proactive refinements of our operations. This is not to say that we will be immune from short term transitory impacts to our business. Nonetheless, the fact remains that demand for inpatient rehabilitation services remains considerably underserved and and is growing as the US Population continues to age. We are uniquely positioned to address this important societal need. On April 2nd of this year, CMS released the 2027 IRF proposed rule. The proposed rule included a net market basket update of 2.4%, which we estimate would result in a 2.4% pricing increase for our Medicare patients beginning October 1, 2026. We expect the IRF final rule to be released in late July or early August. With that, I’ll turn it over to Doug.

Doug

Thank you Mark and Good morning everyone. Q1 revenue increased 9% to 1.59 billion and adjusted EBITDA increased 11.2% to 348.8 million. The revenue increase was comprised of 4.3% discharge growth inclusive of 1.6% same store discharge growth and a 3.7% increase in net revenue per discharge. Net revenue per discharge growth benefited both from patient mix and a favorable year over year comparison and in the annual Medicare SSI adjustment, bad Debt expense increased 20 basis points to 2.2%, primarily as a result of writing off claims from 2013 associated with a legacy audit appeal. As a reminder, since the end of Q2 2025, we have closed three IRF units hosted within acute care hospitals as well as our loan SNF unit hosted within one of our freestanding hospitals. Together, these four units were essentially break even in terms of adjusted ebitda. The unit closures impacted total and same store discharge growth in the quarter by approximately 85 basis points. The impact on future period discharge growth will diminish as we consolidate this volume into other proximate hospitals and as we anniversary the unit closure dates. We expect to add 66 beds to our existing hospitals in these markets. We previously announced the closure of our 18 bed unit hosted within our Acute Care Hospital JV partner in Evansville, Indiana. This closure will occur in early 2027 and and represents another market consolidation opportunity. We are in the process of adding 40 beds to our existing freestanding hospital in this market to support the consolidation and future growth. These incremental beds are expected to be operational in late 2026 following the Evansville unit closure, we will have nine remaining hospital and hospital locations with no further closures currently planned. The hospital and hospital format remains a viable strategy to capitalize on market opportunities. Over the next two years we expect to open three additional hospital and hospital locations in existing markets. These three projects are already in our bed addition assumptions and will address needed capacity in these markets. Q1 SWB per FTE increased 3.7% driven in part by the increased participation in our career ladder programs Mark discussed earlier. Greater participation in career ladder programs leads to more of our clinical staff obtaining higher licensing and compensation levels over time. We believe this drives financial and operational benefits primarily in the form of reducing turnover and premium labor costs. Premium labor costs comprised of contract labor and sign on and shift bonuses declined 2.7 million from Q1.25 to 25.9 million. Contract labor FTEs as a percent of total FTEs was 1.2% in Q1 down 10 basis points from Q1.25. Net preopening and ramp up costs were $4 million. We continue to expect net preopening and ramp up cost of 18 to 22 million for the full year 2026. We continue to generate significant free cash flow. Q1 adjusted free cash flow was 194 million. Our primary use of free cash flow can continues to be capacity expansions. During Q1 we repurchased approximately 708,000 shares of our common stock for a total of $71.6 million. We paid a 19 cent per share cash dividend and declared another 19 per share cash dividend that was paid in April. Our leverage and liquidity remained well positioned. Net leverage at quarter end was 1.9 times. Based primarily on our Q1 results, we have raised our 2026 guidance as follows. We now expect net operating revenue of 6.375 to 6.470 billion, adjusted EBITDA of 1.35 to 1.38 billion, and adjusted earnings per share of $5.89 to $6.11. The considerations underlying our guidance can be found on page 11 of the supplemental slides and with that, operator will open the line to Q and A.

OPERATOR

Thank you. If you’d like to ask a question, press Star one on your keypad to leave the queue at any time, press Star two. Once again, press Star one to ask a question. In the interest of time we ask you, please limit yourself to one question and one follow up and we’ll pause for just a moment to allow questioners a chance to enter the queue. And we’ll take our first question from Ann Hines with Mizuho Securities. Please go ahead. Your line is open.

Ann Hines (Equity Analyst)

Morning, Ann. Morning, Ann. Hi, good morning. Yep, thanks for the question. So I know your organic volume of discharge growth was impacted by closures. Do you have a number of what that would have been if you exclude the closures?

Doug

Yeah. As I mentioned in my comments, the impact of the closures was approximately 85 basis points and that would be the same for both total and same store. And again, we would anticipate that that impact will diminish through the course of the year because we’re going to be consolidating some of that volume and in certain instances adding beds to those markets, the existing hospital in those markets. And then we’ll also be anniversarying the closure date. And then just a reminder as well, there’s no impact on ebitda. That was discharges only.

Ann Hines (Equity Analyst)

And then juicy comments around nursing. You have the lowest nursing turnover in 2012, which is very impressive. What do you think is driving that? I’m sure there’s internal factors and external factors like inflation, but any observations you can provide on why you think that’s so low?

Pat Tuhr

Ann, I’m going to ask Pat Tuhr to weigh in on that. So Ann, the a couple things on that we talked about our centralized talent acquisition team before and they have done a great job bringing talent into our organization. Net hiring for the quarter was higher, in fact, than the first two quarters combined last year on the same store basis. And on the turnover front, you know, our ladders are really starting to take hold. So we have about 35% of our nursing staff is now, on clinical ladders, that’s up about 300 basis points from last quarter turnover. If we can get a nurse on the ladder in Q1, the turnover for that group was a little over 2%. It was 2.6% compared to 20.7% for non laddered nurses. So really, our hospital teams are doing a great job engaging our staff to become more organizationally rooted and get into these latter programs and as a result earn more compensation. I would say more broadly, the dynamics around the labor environment can be unpredictable, but we have seen a lot of positive momentum from a hiring and retention standpoint.

Doug

And as Pat noted, having that centralized talent acquisition here in Birmingham frees up the local hospital staff then to do nothing but really focus more on retention. So there’s a lot of other programs involved. Certainly clinical ladders are, are an important part of the tools they’ve added in the last couple years.

OPERATOR

Great. Thank you. Thank you. We’ll take our next question from Matthew Gilmore with KeyBank. Please go ahead. Your line is open.

Matthew Gilmore (Equity Analyst)

Morning, Matt. Hey, thanks for the question. Good morning. Maybe following up on Anne’s line of questioning on the same store volumes, the 2.6 number, if you adjust out the 85 bits, is still still a pretty healthy number, but slightly moderated from the trends you saw in 2025. Curious if there were any other sort of puts and takes to think about and how you’re sort of thinking about same store volume performance for the balance of 2026.

Doug

Yeah. And Matt, we don’t want to make it sound like a litany of excuses, but since you’ve asked for further insight on volume, I think we would cite four factors in the first quarter. The first was the unit closures, which we’ve already covered. The second is occupancy levels, and I’ll go through that in more detail in just a moment. The third is something that you’ve heard from the acute care hospitals reporting, which was it was a relatively light, meaning low severity, flu and respiratory season. And the fourth is some continuation of the MA trends that we experienced in Q4. To dive a little bit deeper on the occupancy story. Our Q1 average occupancy of 78.7% was essentially flat with our record high levels in Q1 of 25. And that was up 200 basis points from Q1 of 24 and up over 500 basis points from Q1 of 23. And that’s reflective of our strong growth and as Mark pointed out, the underlying demand for inpatient rehabilitation services to meet that demand. We’ve obviously been adding beds via de novos and bed additions, and we’ve been seeking opportunities to convert semi private rooms to private rooms. That’s something we’ve talked about quite a bit before. At the end of the first quarter, 58% of our beds were private, and that compares to 41% being private at year end 2020. But in spite of those efforts, occupancy has become a bit of a constraint in certain markets. In Q1, approximately 35% of our hospitals had occupancy in excess of 90%, with that cohort having an average occupancy of 95%. A subset of that group is comprised of relatively recent de novos that have been growing quickly and they crossed the 90% threshold in Q1. More than half of our hospitals within Q1 that had occupancy in excess of 90% are slated for bed additions between 2026 and 2028. And we anticipate adding more of those hospitals to the list as well as introducing small format hospitals per March discussion in certain of those markets. So, you know, we probably fell a little bit behind because the growth was faster than we anticipated. But we’ve got a plan to address that just a little bit more Commentary on the flu in respiratory season Debility for us is a proxy for the severity of the flu season and also for respiratory illness. And as you know, as you’ve heard from, the acute Q126 was relatively light in that regard. Debility is approximately 11% of our patient mix and it only grew by 70 basis points in total for the quarter and actually declined 1.5% on a same store basis. That’s purely a seasonal item and it’s going to fluctuate from year to year. And then again, MA continued to be a bit of a struggle as we moved into the quarter. You know, I’d probably there point to some things on a longer trend. We can talk about, obviously the success that we’re having with regard to the admit and appeal strategy that we began implementing at the end of February. That’s very early on. …

Full story available on Benzinga.com

This post was originally published here

On CNBC’s “Mad Money Lightning Round,” Jim Cramer said he likes AST SpaceMobile, Inc (NASDAQ:ASTS). “I think there’s a lot to recommend for speculating on space, and that’s what I’ve been recommending,” he added.

According to recent news, the FCC granted AST SpaceMobile authorization on April 22 to deploy and operate a constellation of up to 248 satellites. It will enable direct-to-device cellular broadband coverage using low-band spectrum.

Oklo (NASDAQ:OKLO) is “really speculative. I think you have enough. I …

Full story available on Benzinga.com

This post was originally published here
For the first time in 60 years, Warren Buffett will not be the main attraction at Berkshire Hathaway Inc.‘s (NYSE:BRK) (NYSE:BRK) annual meeting. As new CEO Greg Abel takes the reins this weekend, he faces mounting pressure to address a historic $373 billion cash pile and a lagging stock.

The Post-Buffett Reality

While thousands of investors are making the pilgrimage to Omaha for its annual shareholders meeting, the mood is noticeably different. Berkshire shares have severely underperformed since Buffett unexpectedly announced his departure last year on May 3.

Largely on a year-over-year basis, BRK’s stock fell 11.19%, while the S&P 500 was up 29.5% in the same period.

Some investors may want to see Greg “prove himself in his job” before they decide to buy more, Lawrence Cunningham, a University of Delaware governance professor, told Reuters. Cunningham was confident, but the market is “expressing caution.”

After pausing the repurchase program since May 2024, Abel resumed stock buybacks in March—Berkshire’s first since May 2024.

This post was originally published here

Esperion Therapeutics (NASDAQ:ESPR) shares are up during Friday’s premarket session as the company has announced a definitive agreement to be acquired by ARCHIMED.

The deal will provide Esperion shareholders with $3.16 per share in cash at closing, plus potential milestone payments, which is contributing to the stock’s upward movement while broader markets experienced mixed results on Thursday.

Under the terms of the agreement, Esperion shareholders will receive $3.16 per share in cash at closing, along with the opportunity to participate in up to $100 million in contingent milestone payments based on future sales performance.

This acquisition represents a total equity value of approximately $1.1 billion, marking a significant premium of 58% over Esperion’s closing price on Apr. 30, 2026.

As of Dec. 31, 2025, cash and cash equivalents totaled $167.9 million compared to $144.8 million as of Dec. 31, 2024. Esperion ended the quarter with approximately 245.2 million shares of common stock outstanding, excluding 2.0 million treasury shares. 

“With ARCHIMED’s support, we believe Esperion will be well positioned to advance our Vision 2040 strategy and continue addressing the global burden of cardiometabolic disease,” said CEO Sheldon Koenig.

Last month, Esperion announced the closing of its acquisition of Corstasis Therapeutics …

Full story available on Benzinga.com

This post was originally published here

Newell Brands (NASDAQ:NWL) reported first-quarter financial results on Friday. The transcript from the company’s first-quarter earnings call has been provided below.

This transcript is brought to you by Benzinga APIs. For real-time access to our entire catalog, please visit https://www.benzinga.com/apis/ for a consultation.

Access the full call at https://edge.media-server.com/mmc/p/96sxe8tv/

Summary

Newell Brands reported better-than-expected Q1 results across all key financial metrics, with core sales at -3.5% driven by improved consumer demand and market share gains.

The company plans to launch 25 new innovations this year, up from 18 last year, aiming to enhance consumer engagement and expand market presence.

Despite a dynamic cost environment, the company raised its full-year guidance for net sales, core sales, and normalized EPS, driven by strong Q1 performance and future growth prospects.

Operational highlights include successful cost management and improved deduction management, contributing to a higher-than-expected operating margin.

Management expressed confidence in the turnaround strategy and noted significant improvements in consumer engagement, innovation pipeline, and retail activation.

Full Transcript

OPERATOR

Good morning and welcome to Newell Brands’ first quarter 2026 earnings conference call. At this time, all participants are in a listen only mode. After a brief discussion by management, we will open up the call for questions. In order to stay within the time schedule for the call, please limit yourself to one question during the Q and A session. Today’s conference call is being recorded. A live webcast of this call is available at ir.newellbrands.com. I will now turn the call over to Joanne Friberger, SVP of Investor Relations and Chief Communications Officer. Ms. Friberger. You may begin.

Joanne Friberger (SVP of Investor Relations and Chief Communications Officer)

Thank you. Good morning everyone and welcome to Newell Brands’ 2026 earnings call. On the call with me today are Chris Peterson, our President and CEO, and Mark Erceg, our CFO. Before we begin, I’d like to inform you that during today’s call we will be making forward looking statements which involve risks and uncertainties. Actual results and outcomes may differ materially and we undertake no obligation to update forward looking statements. I refer you to the cautionary language and risk factors available in our earnings release, our Form 10K, Form 10Q and other SEC filings available on our Investor Relations website for a further discussion of the factors affecting forward looking statements. Today’s remarks will also refer to non GAAP financial measures, including those referred to as normalized measures. We believe these non GAAP measures are useful to investors, although they should not be considered superior to the measures presented in accordance with gaap. Explanations of these non GAAP measures and reconciliations between GAAP and non GAAP measures can be found in today’s earnings release and tables that were furnished to the SEC. Thank you. And with that, I’ll turn the call over to Chris.

Chris Peterson (President and CEO)

Thank you Joanne. Good morning everyone and welcome to our first quarter earnings call. We had a strong start to the year with Q1 results ahead of expectations across all key financial metrics. All three segments delivered core sales growth above plan with the learning and development segment returning to core sales growth. Core sales at -3.5% improved both sequentially and versus year ago for two primary reasons. First, we experienced better than expected consumer demand for our products driven by improving point of sale and market share trends, which we believe is directly related to our focus on innovation and higher levels of advertising and promotion support. Stronger consumer demand was most pronounced across the U.S. brand portfolio where six of our top 10 brands gained market share in the first quarter. In addition, for the first time in over four years, six of our top 10 brands delivered year over year point of sale growth and seven top ten brands improved their sequential trajectory versus the fourth quarter. These notable proof points provide clear evidence that our new innovation strategy and heightened levels of advertising and promotion investments are having the desired effect, namely allowing Newell to once again engage and delight consumers with high quality products that deliver real solutions and benefits to with strong consumer value. As we discussed at CAGNY, 2026 is the first year since we initiated our turnaround strategy that we have a robust consumer relevant innovation pipeline supported by competitive AMP levels and strong retail activation plans. During the course of the year we Plan to launch 25 Tier 1 and Tier 2 innovations up from 18 last year and those innovations span every one of our businesses. Importantly, we are now bringing to market fully vetted consumer preferred ideas that are designed to improve value, expand usage occasions and give retailers more reasons to support our brands. Those efforts are translating into better point of sale results, improved share trends and stronger distribution opportunities. The SECond reason first quarter core sales came in better than expected was a net pricing benefit related to customer programs due to better claims experience and improved deduction management. Our focus on improving the return on investment of our customer spending and improving operational discipline in spend management is paying off. These two items which led to top line over delivery drove normalized operating margin above our outlook even after increasing AP investment. Compared to prior year, normalized earnings per share came in $0.03 better than the upper end of our guidance range due to higher than expected core sales, better than expected normalized operating margin and a lower than expected first quarter effective tax rate. From a segment perspective, learning and development was the strongest part of the portfolio in the quarter. The segment returned to core sales growth led by baby, which grew 4.9% in the first quarter supported by strong consumer demand, positive POS trends, innovation and share gains both home and commercial and outdoor and recreation exceeded plan and improved sequentially. Based on these solid first quarter results, we remain confident that Newell’s strategy is working. At the same time, the external environment remains dynamic, particularly as it relates to petro based cost inputs and tariffs. So let’s spend some time on each of those two important areas. Currently we see an additional approximately $50 million of commodity and transportation inflation versus our original plan, with higher resin costs accounting for about 60% of the total increase. That said, unfortunately, resin is now a much smaller part of Newell’s overall cost structure. For perspective, direct resin purchases represent roughly 5% of 2025’s total cost of goods sold, which is down materially from about double that level historically and our sourcing and supply chain teams manage our resin exposure through established contract structures rather than spot market purchases. This provides better visibility, reduces exposure to short term spot market volatility, and creates some lag time in how costs flow through the P&L, which gives the business more time to respond. Moving to Tariffs the framework has shifted materially since our last call. IP tariffs were invalidated, new tariffs under SECtion 122 were put in place at a temporary 10% replacement rate, existing tariffs under SECtion 232 were revised and new SECtion 301 investigations are now underway for potential new tariffs. The tariff environment clearly remains very fluid with a few important things to note. First, our initial outlook assumed a higher tariff baseline, so the current tariff regime is actually a help versus our going in expectations. In fact, we believe tariff help will offset about 50% of the previously mentioned incremental commodity hurt, with the remainder being offset by higher levels of productivity savings and targeted price and promotion adjustments where necessary. Second, the best in class sourcing manufacturing and trade capabilities we have built over the past several years have positioned us well on a relative basis versus competition. For example, we have reduced China sourced finished goods from a peak of roughly 35% of global cost of goods sold to under 10% and our remaining China exposure principally in baby gear, is an industry wide challenge, not one unique to Newell. In addition, our highly automated domestic manufacturing footprint creates what we believe is is a structural tariff cost advantage across 19 product categories. Third, and before moving on, I want to recognize Newell’s Trade Expertise Center. TEC, as we call it,, is a highly professionalized centralized capability that brings together trade compliance, policy, intelligence, analytics and operational execution to ensure Newell stays compliant, keeps goods moving seamlessly across borders, and responds quickly and efficiently as trade policy changes. To close out this SECtion, please note that we will actively pursue tariff refunds related to approximately $120 million of IP tariffs paid in 2025 and neither our Q1 actuals nor our outlook include any benefit from these potential refunds. Having touched on first quarter performance and what we are seeing and expect relative to commodity cost and tariff impacts, I want to turn to the overall consumer and category environment and how we see our top line growth prospects for the balance of the year. Consumer spending in the categories in which Newell competes came in slightly better than we expected in the first quarter. At down 1%, we continue to see category growth from high income consumer cohort being slightly more than offset by declines from low income consumers. Additionally, it appears the tax refund stimulus boost is largely offsetting higher fuel and energy costs so far. Importantly consumers are still responding when the value proposition is clear, when innovation solves a need, trusted brands are well supported, price and value are appropriately balanced, and retail execution is strong. Coming into the year, we assumed our categories in aggregate would decline about 2%. However, based on what we saw in the first quarter, we’re now assuming a 1.5% category decline for the full year. This slight improvement in underlying consumer and category dynamics, when coupled with better than expected first quarter results and what we know about the strength of our innovation, marketing and distribution plans for the balance of the year, puts us in a position to predict a return to top line growth in the SECond quarter. Additionally, given the stronger than expected first quarter results and our SECond quarter outlook for core sales growth, we are also raising our full year outlook for net sales, core sales and normalized earnings per share. Before closing, I want to thank all of the Newell employees for their dedication to the turnaround effort and their agility and resilience in dealing with a dynamic operating environment. With that, I’ll turn the call over to Mark to walk through the financials and outlook in more detail.

Mark Erceg (Chief Financial Officer)

Thanks Chris Good morning everyone. First quarter 2026 net n core sales declined versus year ago by 1.1 and 3.5% respectively, with 2.7 points of favorable foreign exchange and 0.3 points of exits and other impacts Accounting for the difference between net and core normalized gross margin in the first quarter expanded by 70 basis points to 33.2%. Gross productivity and favorable net pricing actions, more than offset cost inflation tariff costs and lower volume normalized overhead dollars were slightly lower year over year as we continue to execute against the previously announced Global productivity plan. During Q1 we recorded $6 million of restructuring charges, bringing cumulative charges under the plan to $46 million. We continue to expect total restructuring and restructuring related charges associated with the plan of approximately 75 to $90 million, the rest of which should be largely incurred by the end of 2026. As expected, a and P as a percentage of sales was just north of 5%, which was about 30 basis points higher than a year ago as we continue to invest behind the strongest innovation program Newell has fielded since at least the Jarden acquisition. All of this brought Newell’s normalized operating margin in at 4.8%, which was 30 basis points above year ago and ahead of our expectations. As Chris indicated, we did …

Full story available on Benzinga.com

This post was originally published here
LyondellBasell Industries NV (NYSE:LYB) released its quarterly financial results Friday morning. The petrochemical giant exceeded profit expectations despite a slight miss on the top line.

Earnings Outperform While Sales Lag

The company reported quarterly earnings of 49 cents per share. This figure beat the analyst consensus estimate of 20 cents per share. It also marks an increase from 33 cents per share during the same period last year.

Quarterly sales reached $7.197 billion. This missed the analyst consensus estimate of $7.323 billion, according to Benzinga Pro data. It represents a decline from $7.677 billion in the prior year’s quarter.

Middle East Conflict Impacts Global Supply

CEO Peter Vanacker highlighted how regional instability is reshaping the industry. He noted the Middle East war has steepened the global cost curve for petrochemicals.

“The global cost curve for petrochemicals has materially steepened …

Full story available on Benzinga.com

This post was originally published here

On CNBC’s “Halftime Report Final Trades,” Jim Lebenthal, partner at Cerity Partners, named Cisco Systems, Inc. (NASDAQ:CSCO) as his final trade.

Supporting his view, J.P. Morgan analyst Samik Chatterjee, on April 16, maintained Cisco with an Overweight rating and raised the price target from $95 to $96.

Jason Snipe, founder and chief investment officer of Odyssey Capital Advisors, said he likes AbbVie Inc. (NYSE:ABBV), which reported upbeat quarterly results.

AbbVie on Wednesday reported first-quarter 2026 sales of $15.00 billion, beating the consensus of $14.72 billion. The company reported adjusted earnings of $2.65 per …

Full story available on Benzinga.com

This post was originally published here
U.S. stock futures were mixed this morning, with the Dow futures gaining around 0.1% on Friday.

Shares of SanDisk Corp (NASDAQ:SNDK) fell sharply in pre-market trading following third-quarter results.

SanDisk reported quarterly earnings of $23.41 per share, which beat the analyst consensus estimate of $14.43 by 62.23%, according to Benzinga Pro data. Quarterly revenue came in at $5.95 billion, which beat the Street estimate of $4.68 billion by 27.03% and was up from $1.7 billion in the same period last year.

SanDisk is looking for fourth quarter adjusted EPS of $30 to $33, versus the $22.01 analyst estimate, and revenue of $7.75 billion to $8.25 billion, versus the $6.35 billion analyst estimate.

SanDisk shares dipped 5.6% to $1,034.67 in pre-market trading.

Here are some other …

Full story available on Benzinga.com

This post was originally published here
Magna International, Inc. (NYSE:MGA) reported first-quarter financial results Friday, delivering a significant earnings beat while adjusting its full-year revenue expectations.

Magna International operates as an automotive supplier in North America, Europe, the Asia Pacific, and internationally. 

Earnings Beat On Margin Expansion

Magna reported quarterly earnings of $1.38 per share. This figure comfortably beat the analyst consensus estimate of $1.01. It also marks a sharp increase from the 78 cents per share reported in the same period last year.

Quarterly sales reached $10.381 billion, surpassing the projected $10.255 billion. This represents a steady climb from the $10.069 billion in sales during the prior-year quarter, according to Benzinga Pro data.

Full story available on Benzinga.com

This post was originally published here

During times of turbulence and uncertainty in the markets, many investors turn to dividend-yielding stocks. These are often companies that have high free cash flows and reward shareholders with a high dividend payout.

Benzinga readers can review the latest analyst takes on their favorite stocks by visiting Analyst Stock Ratings page. Traders can sort through Benzinga’s extensive database of analyst ratings, including by analyst accuracy.

Below are the ratings of the most accurate analysts for three high-yielding stocks in the industrials sector.

ManpowerGroup Inc (NYSE:MAN)

  • Dividend Yield: 4.76%
  • UBS analyst Joshua Chan maintained a Neutral rating and raised the price target from $29 to $33 on April 17, 2026. This analyst has an accuracy rate of 58%
  • Truist Securities analyst Tobey Sommer maintained a Hold rating and cut the price target from $38 to $34 on April 17, 2026. This analyst has an accuracy rate of 67%.
  • Recent News: On April 30, ManpowerGroup announced the sale of its Jefferson Wells U.S. business …

Full story available on Benzinga.com

This post was originally published here
Tyson Foods, Inc. (NYSE:TSN) will release earnings for its second quarter before the opening bell on Monday, May 4.

Analysts expect the company to report quarterly earnings of 78 cents per share, down from 92 cents per share in the year-ago period. The consensus estimate for Tyson Foods’ quarterly revenue is $13.61 billion (it reported $13.07 billion last year), according to Benzinga Pro.

Ahead of quarterly earnings, Piper Sandler analyst Michael Lavery, on April 6, upgraded Tyson Foods from Neutral to Overweight and raised the price target from $61 to $75.

With the recent buzz around Tyson Foods, some investors may be eyeing potential gains from the company’s dividends too. As of now, Tyson Foods has an annual dividend yield of 3.18%, with a quarterly dividend of 51 cents per share ($2.04 per year).  

So, how can investors exploit its …

Full story available on Benzinga.com

This post was originally published here
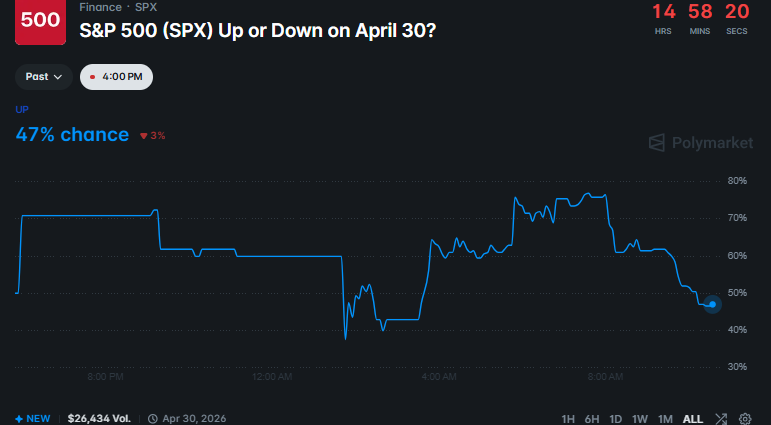
The S&P 500 surged 1.02% on Thursday to close at a record 7,209.01, marking its first-ever close above the 7,200 level and capping its strongest monthly performance since 2020.

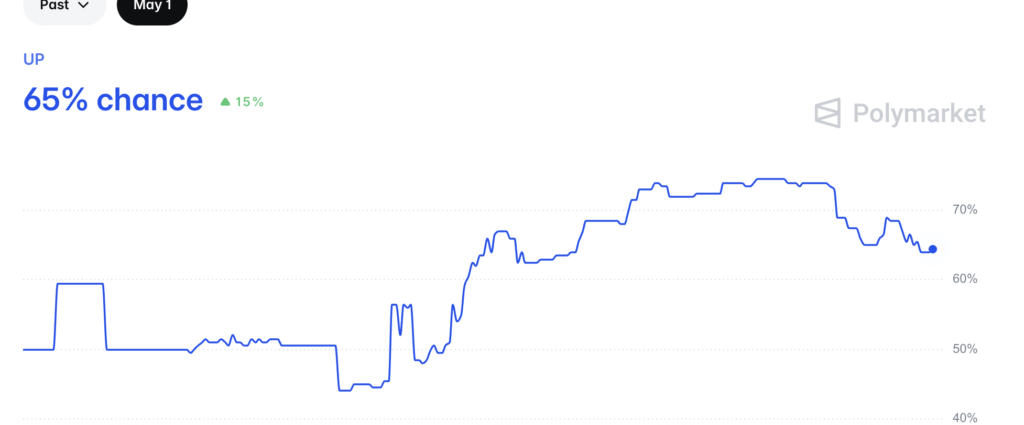
The Polygon-based (CRYPTO: POL) Polymarket crowd remains bullish heading into Friday. The May 1 market shows about 65% of traders betting “Up,” as momentum from April’s rally carries into the new month.

Why That Number Matters

April marked a major turning point for equities.

The S&P 500 gained 10.4% for the month, its best performance since November 2020, as markets rebounded sharply from earlier geopolitical shocks tied to the Iran war. The …

Full story available on Benzinga.com

This post was originally published here

As billionaire investor Bill Ackman launches his new retail-friendly closed-end fund, Pershing Square USA, he is making a bold case against standard index investing: deep research into a handful of exceptional companies vastly outpaces the broader market.

The Math Behind The Outperformance

For retail investors wondering why they shouldn’t just park their cash in an S&P 500 index fund, Ackman points directly to his two-decade track record.

“In January of 2004… you invested $10,000… at the end of last year, you would have had $90,000” in the broader market, Ackman explained in a comversation with TheStreet. “But had you invested in… our strategy… you would have had $460,000.”

Ackman attributes this massive wealth generation—achieved net of all fees—to actively picking the absolute best the index has to offer rather than blindly buying the entire basket.

Betting Big On ‘Concentrated Conviction’

Rather than holding hundreds of equities, Pershing Square targets just a dozen to 15 “super durable growth companies.” During a rapid-fire exchange, Ackman definitively chose “concentrated conviction” over diversified safety.

“We are a very concentrated investor,” Ackman noted. “The top three, the top four can be half the portfolio.” By deeply researching and often stepping in to help these businesses succeed, Ackman is confident he can generate …

Full story available on Benzinga.com

This post was originally published here

Seaport Therapeutics Inc. set its initial public offering (IPO) terms on Thursday, detailing the deal in a pricing of its upsized IPO that values shares at $18 each.

The clinical-stage biotech firm said the IPO covers 14.16 million shares, with all shares being offered by the company.

Seaport said the $18 price is at the high end of the expected range and implies gross proceeds of about $254.9 million before underwriting fees and other offering costs.

The company also provided underwriters a 30-day window to purchase up to 2,124,000 additional shares at the IPO price, minus discounts and commissions.

A Strategic Market Move

The company said its shares are slated to start trading on the Nasdaq Global Select Market on Friday under the symbol SPTX. Seaport also expects the transaction to settle on Monday, May 4, assuming customary closing requirements are met.

Seaport described itself as focused on creating and advancing treatments aimed at neuropsychiatric conditions. The company is based in Boston.

data-variant=”card”

Full story available on Benzinga.com

This post was originally published here

U.S. stocks settled higher on Thursday, with the S&P 500 recording its first settlement above the 7,200 level.

The S&P 500 jumped 10.4% in April, recording its best month since November 2020, while the Nasdaq climbed 15.3% to record its strongest monthly performance since April 2020. The Dow climbed 7.1% last month, notching its best month since November 2024.

Wall Street analysts make new stock picks on a daily basis. Unfortunately for investors, not all analysts have particularly impressive track records at predicting market movements. Even when it comes to one single stock, analyst ratings and price targets can vary widely, leaving investors confused about which analyst’s opinion to trust.

Benzinga’s Analyst Ratings API is a collection of the highest-quality stock ratings curated by the Benzinga news desk via direct partnerships with major sell-side banks. Benzinga displays overnight ratings changes on a daily basis three hours prior to the U.S. equity market opening. Data specialists at investment dashboard provider Toggle.ai recently uncovered that the analyst insights Benzinga Pro subscribers and Benzinga readers regularly receive can successfully be used as trading indicators to outperform the stock market.

Top Analyst Picks: Fortunately, any Benzinga reader …

Full story available on Benzinga.com

This post was originally published here

In the dynamic and cutthroat world of business, conducting thorough company analysis is essential for investors and industry experts. In this article, we will undertake a comprehensive industry comparison, evaluating NVIDIA (NASDAQ:NVDA) and its primary competitors in the Semiconductors & Semiconductor Equipment industry. By closely examining key financial metrics, market position, and growth prospects, our aim is to provide valuable insights for investors and shed light on company’s performance within the industry.

NVIDIA Background

Nvidia is a leading developer of graphics processing units. Traditionally, GPUs were used to enhance the experience on computing platforms, most notably in gaming applications on PCs. GPU use cases have since emerged as important semiconductors used in artificial intelligence to run large language models. Nvidia not only offers AI GPUs, but also a software platform, Cuda, used for AI model development and training. Nvidia is also expanding its data center networking solutions, helping to tie GPUs together to handle complex workloads.

Company P/E P/B P/S ROE EBITDA (in billions) Gross Profit (in billions) Revenue Growth
NVIDIA Corp 40.73 30.83 22.66 31.11% $51.28 $51.09 73.21%
Broadcom Inc 81.37 24.74 29.75 9.12% $11.15 $13.16 29.47%
Micron Technology Inc 24.41 8.05 10.09 21.0% $18.48 $17.75 196.29%
Advanced Micro Devices Inc 135.82 9.17 16.74 2.44% $2.86 $5.58 34.11%
Texas Instruments Inc 48.05 15.25 13.91 9.35% $2.42 $2.8 18.58%
Analog Devices Inc 73.54 5.81 16.93 2.46% $1.52 $2.04 30.42%
Qualcomm Inc 19.31 6.94 4.37 13.57% $2.82 $5.7 5.0%
Marvell Technology Inc 53.79 10.09 17.53 2.79% $0.75 $1.15 22.08%
Monolithic Power Systems Inc 125.54 22.45 27.95 4.95% $0.21 $0.41 20.83%
NXP Semiconductors NV 28.07 6.78 5.91 10.69% $1.7 $1.79 12.2%
ON Semiconductor Corp 347.62 5.17 6.92 2.33% $0.45 $0.55 -11.17%
GLOBALFOUNDRIES Inc 40.63 2.97 5.31 1.68% $0.73 $0.51 0.0%
Astera Labs Inc 159.62 24.46 41.01 3.41% $0.07 $0.2 91.77%
Credo Technology Group Holding Ltd 95.61 17.36 30.26 10.03% $0.16 $0.28 201.49%
Tower Semiconductor Ltd 113.94 8.54 16.03 2.78% $0.2 $0.12 13.69%
First Solar Inc 13.04 2.20 4.01 5.62% $0.7 $0.67 11.15%
MACOM Technology Solutions Holdings Inc 127.43 15.61 20.68 3.64% $0.07 $0.15 24.52%
Lattice Semiconductor Corp 6115.50 23.44 32.31 -1.08% $0.01 $0.1 24.16%
Average 447.25 12.3 17.63 6.16% $2.61 $3.12 42.62%

Full story available on Benzinga.com

This post was originally published here

In today’s fast-paced and competitive business landscape, it is essential for investors and industry enthusiasts to thoroughly analyze companies before making investment decisions. In this article, we will conduct a comprehensive industry comparison, evaluating Tesla (NASDAQ:TSLA) against its key competitors in the Automobiles industry. By examining key financial metrics, market position, and growth prospects, we aim to provide valuable insights for investors and shed light on company’s performance within the industry.

Tesla Background

Tesla is a vertically integrated battery electric vehicle automaker and developer of real world artificial intelligence software, which includes autonomous driving and humanoid robots. The company has multiple vehicles in its fleet, which include luxury and midsize sedans, crossover SUVs, a light truck, and a semi truck. Tesla also plans to begin selling a sports car and offer a robotaxi service. Global deliveries in 2025 were nearly 1.64 million vehicles. The company sells batteries for stationary storage for residential and commercial properties including utilities and solar panels and solar roofs for energy generation. Tesla also owns a fast-charging network and an auto insurance business.

Company P/E P/B P/S ROE EBITDA (in billions) Gross Profit (in billions) Revenue Growth
Tesla Inc 350.12 17.04 13.77 0.57% $2.43 $4.72 15.78%
General Motors Co 28.06 1.11 0.40 4.22% $6.54 $5.0 -0.9%
Ferrari NV 33.08 13.38 7.40 9.89% $0.69 $0.93 3.79%
Thor Industries Inc 14.04 0.96 0.42 0.41% $0.1 $0.25 5.34%
Winnebago Industries Inc 22.18 0.75 0.32 0.39% $0.03 $0.09 6.0%
Average 24.34 4.05 2.14 3.73% $1.84 $1.57 3.56%

Full story available on Benzinga.com

This post was originally published here

The most oversold stocks in the consumer staples sector presents an opportunity to buy into undervalued companies.

The RSI is a momentum indicator, which compares a stock’s strength on days when prices go up to its strength on days when prices go down. When compared to a stock’s price action, it can give traders a better sense of how a stock may perform in the short term. An asset is typically considered oversold when the RSI is below 30, according to Benzinga Pro.

Here’s the latest list of major oversold players in this sector, having an RSI near or below 30.

Clorox Co (NYSE:CLX)

  • On April 30, Clorox reported third-quarter revenue of $1.67 billion, flat versus the same period year-over-year. Organic sales were down 1% year-over-year in the quarter. “Our third-quarter results were mixed, with continued momentum in some parts of our portfolio and slower-than-anticipated market share recovery …

Full story available on Benzinga.com

This post was originally published here

OpenAI President Greg Brockman said AI coding tools leaped from writing 20% to 80% of developer code in a single month, marking a fundamental shift from productivity aid to primary software development driver.

“We went from these agentic coding tools writing 20% of your code to writing 80% of your code,” Brockman said at a Sequoia Capital event, describing the change seen within December alone.

“They go from being kind of a sideshow to being the main thing that you’re doing,” he told Sequoia partner Alfred Lin.

Big Tech Is Already Living This Reality

Alphabet (NASDAQ:GOOG) (NASDAQ:GOOGL) CEO Sundar Pichai wrote in a blog post last week that 75% of all new code at Google is now AI-generated and approved by engineers, up from 50% last …

Full story available on Benzinga.com

This post was originally published here

Demand for newer EVs may be shrinking in the U.S. market, but Tesla Inc.‘s (NASDAQ:TSLA) vehicles are among the quickest to sell on the used market.

Tesla Sells Quickly, Depreciates Less

According to a study released by Iseecars.com on Thursday that analyzed one to five-year-old vehicles on the used market, demand for Tesla vehicles, as well as hybrids, saw an uptick in the first quarter of 2026. iSeeCars Executive Analyst Karl Brauer shared that the “real benefactor of rising fuel costs” seems to be the hybrid vehicles.

data-variant=”card”
data-news-mode=”manual”

>


Read Also:

Bill Gates Once Called Tesla’s Semi Truck Impractical, But Gavin Newsom May Need Elon Musk’s All-Electric Hauler To Bolster Clean Energy Bid

This post was originally published here

The average 30-year fixed-rate mortgage rose to 6.30% for the week ending April 30, 2026, up from 6.23% the prior week, Freddie Mac (OTC:FMCC)  said Thursday.

The 15-year fixed rate also rose, averaging 5.64%, compared with 5.58% last week. Both rates remain below year-ago levels.

“As rates had modestly declined the last few weeks, purchase demand has accelerated with purchase applications rising to over 20% above a year ago,” said Sam Khater, Freddie Mac’s chief economist. 

“It is clear that purchase demand continues to hold up as prospective buyers react to both modestly lower rates and more inventory to choose from than the last few years.”

Affordability Still A Barrier

The pickup in demand comes against a difficult affordability backdrop.

A WalletHub analysis showed Hawaii homeowners spend over 50% of their median monthly income on housing. California follows at 43%. At the national level, the average 30-year fixed rate stood at 6.18% in March, yet existing home sales still fell 3.6% from February to an annual pace of 3.98 million units — the slowest in nine …

Full story available on Benzinga.com

This post was originally published here
Shares of Twilio Inc (NYSE:TWLO) rose sharply in pre-market trading after the company reported better-than-expected first-quarter financial results and issued second-quarter guidance above estimates. Also, the company raised its FY26 sales guidance above estimates.

Twilio turned in first-quarter revenue of $1.41 billion, beating analyst estimates of $1.34 billion, according to Benzinga Pro. The company reported adjusted earnings of $1.50 per share for the quarter, beating estimates of $1.27 per share.

Twilio shares jumped 20.6% to $178.70 in pre-market trading.

Here are some other stocks moving in pre-market trading.

Gainers

  • Cue Biopharma Inc (NASDAQ:CUE) gained 56.2% to $23.04 in pre-market trading after the company simultaneously announced a $30 million private investment in public equity financing, an exclusive Phase 2 anti-IgE antibody license and a CEO appointment.
  • System1 Inc (NYSE:SST) gained 50% to $4.86 in pre-market trading.
  • Akanda Corp (NASDAQ:AKAN) rose 41.2% to $69.18 in pre-market trading after jumping 88% on Thursday.
  • AIOS Tech Inc (NASDAQ:AIOS) rose 39.2% to $12.99 in pre-market trading after the Hong Kong-based company filed a Securities and Exchange Commission filing announcing an extraordinary general meeting scheduled for May 29.         
  • 22nd Century …

Full story available on Benzinga.com

This post was originally published here
SanDisk Corporation (NASDAQ:SNDK) on Thursday laid out a plan to lean harder on multi-year customer supply deals after posting better-than-expected fiscal third-quarter 2026 results.

In the earnings call, CEO David Goeckeler said the memory chip maker has signed five long-term supply agreements (referred to as new business models (NBMs), with three signed in the fiscal third quarter and two more added early in the fiscal fourth quarter.

The agreements, tailored to customer needs, vary in duration, with the longest extending up to five years.

How Multi-Year Contracts Transform Revenue Forecasts?

Chief financial officer Luis Felipe Visoso said the three third-quarter agreements imply “minimum contractual revenue of approximately $42 billion,” and added that the five deals together carry financial guarantees above $11 billion.

Those protections include prepayments and other tools arranged through outside financial institutions, and Visoso said $0.4 billion of prepayments appeared on the third-quarter …

Full story available on Benzinga.com

This post was originally published here

Elon Musk‘s orbital datacenter goals may have gotten a boost following Alphabet Inc. (NASDAQ:GOOGL) (NASDAQ:GOOG) CEO Sundar Pichai‘s comments about space-based AI compute earlier this month.

AI Compute Satellites

In a post on the social media platform X, influencer Peter Diamandis shared that Pichai had predicted that space-based AI datacenters would be the “normal” way of building out AI compute within a decade, referring to Pichai’s comments from an April interview with Fortune, adding that Musk had been saying this “for years.”

data-variant=”card”
data-news-mode=”manual”

>


Read Also:

AI Memory Crunch Sends Storage Stocks Higher — But Big Tech Must Pay Up

This post was originally published here

On Thursday, Apple Inc. (NASDAQ:AAPL) shares drew mixed investor reaction after the company posted stronger-than-expected fiscal second-quarter results and issued upbeat forward guidance. Wall Street analysts argue that the market is underappreciating the outlook.

Apple Beats Q2 Estimates With Broad-Based Strength

Apple reported revenue growth of about 17% for the quarter, surpassing expectations, with solid performance in Services, Mac and iPad segments.

Gross margins also came in above estimates at 49.3%, signaling strong profitability despite rising component costs.

However, iPhone revenue slightly missed forecasts and Apple flagged ongoing global memory chip shortages as a key constraint on supply.

Strong Guidance Signals Continued Momentum

Looking ahead, Apple said it expects June-quarter revenue to rise between 14% and 17% year over year, describing the forecast as its “best view of constrained supply.”

The company also noted that tariff assumptions and macroeconomic conditions remain unchanged in its outlook.

data-variant=”card”
data-news-mode=”manual”

>


Read Also:

Tim Cook Says Apple Is Pursuing Tariff Refunds, Will Reinvest Any Windfall Into New US Innovation, Manufacturing Projects

This post was originally published here

Lip-Bu Tan, the CEO of Intel Corporation (NASDAQ:INTC), has taken on a new role as a board member of quantum computing firm PsiQuantum, which is currently valued at $7 billion.

“Their focus on fault-tolerant systems that can be manufactured at scale using the semiconductor industry sets them apart,” Tan told Semafor on Thursday, as he commended PsiQuantum’s unique approach.

PsiQuantum is strengthening ties with the semiconductor industry as it advances scalable, error-tolerant quantum computers using photonic qubits. The company is expanding chip manufacturing and building facilities in Brisbane and Chicago, aiming to launch its Brisbane site next year ahead of many rivals.

The company is backed by big tech like Microsoft Corp. (NASDAQ:MSFT) and Nvidia Corp. (NASDAQ:NVDA), among others.

data-variant=”card”
data-news-mode=”manual”

>


Read Also:

Cardano Founder Warns Quantum Threat ‘Coming Faster Than Expected’

This post was originally published here

Skyline Builders Group Holding Ltd. (NASDAQ:SKBL) surged over 12% during Thursday’s regular session before dropping more than 18% in after-hours trading after the company announced a proposed business combination agreement with Cove Kaz Capital Group and related entities.

Transaction Agreement

Skyline Builders Group announced it has entered into a Transaction Agreement with SKBL Merger Sub Inc., Cove Kaz Capital Group LLC, and Kaz Resources LLC to pursue a complex business combination.

As part of the deal, a new entity will be formed in the Astana International Financial Centre, and Kaz Critical Minerals LLP will be merged into this new entity. The transaction also includes restructuring steps such as Cove Kaz converting into a Delaware corporation and being renamed “Kaz Resources Inc.”

Upon closing, SKBL will merge with SKBL Merger Sub, with Skyline continuing as the surviving entity. Existing Skyline shares will be converted into shares of the new public company, while preferred shares and equity awards will …

Full story available on Benzinga.com

This post was originally published here

SOBR Safe, Inc. (NASDAQ:SOBR) shares jumped 33.7% to $0.73 in after-hours trading on Thursday, after the Denver-based alcohol monitoring company announced a definitive agreement to merge with Clean World Ventures, Inc., a zero-carbon green energy technology firm.

CWV designs modular green hydrogen and clean electricity systems deployable on-site, targeting AI data centers, critical materials mining, and heavy industry.

Pivot To Clean Energy

Under the proposed transaction, CWV is expected to hold about 98% ownership of the combined public company once the deal closes, which is targeted for the third quarter.

The deal requires approximately $5.5 million in pre-close third-party financing committed to SOBRsafe, with $2 million to be deployed by the SOBRsafe operating company at closing.

SOBR also plans to continue evaluating monetization opportunities for its alcohol monitoring …

Full story available on Benzinga.com

This post was originally published here

Oil prices maintained their upward momentum on Friday as the White House leveraged the recently announced ceasefire to avoid a congressional 60-day deadline, under the 1973 law, for the Iran war. This pushed the crude oil futures higher amid tight supply fears.

Geopolitics Keep Markets On Edge

The Donald Trump administration argued that a three-week-old ceasefire effectively “terminated” hostilities, halting the 60-day clock under the War Powers Resolution.

By avoiding the looming May 1 deadline for troop withdrawal or congressional approval, the White House introduced a new layer of uncertainty. Despite this technical pause, geopolitical risks persist.

July Brent futures climbed to $111.13, while U.S. West Texas Intermediate (WTI) for June reached $105.25. Tensions remain elevated as the U.S. blockade on Iran holds, and Tehran continues to refuse to reopen the crucial Strait of Hormuz.

A ‘Higher-For-Longer’ Reality

While the potential reopening of the Strait of Hormuz could eventually pressure prices lower, market experts note that underlying supply conditions remain exceptionally tight.

Adam Turnquist, Chief Technical Strategist for LPL Financial, told Benzinga that a striking divergence …

Full story available on Benzinga.com

This post was originally published here

The stock market’s biggest winners share a common thread—exposure to the rapidly expanding data center ecosystem—according to CNBC’s “Mad Money” host Jim Cramer.

On Thursday, Cramer said the current market can be divided into two sectors – the data center stocks and everything else. He said the surge in artificial intelligence infrastructure is spilling into far more than big tech, pulling in industrial, power, cooling, networking and even real estate names.

Data Centers Move Into The Mainstream

“The data center, the data center, the data center,” Cramer emphasized, noting that what was once a niche trade has now gone mainstream.

The S&P 500 soared to a new all-time high, topping 7200 for the first time as investors bought a wide range of businesses linked to the expansion of computing capacity. Cramer framed the rally as a connected set of winners, with data centers acting as the common thread.

Infrastructure And Power Names Surge

Companies tied to building and powering data centers are among the biggest beneficiaries. Quanta Services (NYSE:PWR), which develops power grids, is seeing strong demand as utilities race to meet rising electricity consumption.

Cramer described data centers as “giant …

Full story available on Benzinga.com

This post was originally published here

ProPetro Holding (NYSE:PUMP) reported first-quarter financial results on Thursday. The transcript from the company’s first-quarter earnings call has been provided below.

This content is powered by Benzinga APIs. For comprehensive financial data and transcripts, visit https://www.benzinga.com/apis/.

Access the full call at https://app.webinar.net/vxyQ2l78Kd6

Summary

ProPetro Holding Corp reported a 7% decrease in revenue for Q1 2026 to $271 million, with a net loss of $4 million, primarily due to weather disruptions impacting the completions business.

The company is leveraging strategic initiatives such as the expansion of ProPower, with a new framework agreement with Caterpillar to secure up to 2.1 gigawatts of power generation capacity over the next five years.

ProPetro Holding Corp anticipates significant growth in ProPower, targeting data centers and industrial sectors, while maintaining financial flexibility through cash flow and strategic financing arrangements.

The completions market is seeing early pricing and activity tailwinds with limited capacity and disciplined capital investments, positioning the company well for future opportunities.

Management expressed confidence in their operational model and strategic positioning, despite external uncertainties like the Iran war, focusing on disciplined execution and long-term growth.

Full Transcript

OPERATOR

Hello everyone. Thank you for joining us and welcome to the ProPetro Holding Corp first quarter 2026 conference call. After today’s prepared remarks, we will host a question and answer session. If you would like to ask a question, please press Star one to raise your hand. To withdraw your question, press Star one again. I will now hand the conference over to Matt Augustine,, Pro Petro’s Vice President of Finance and Investor Relations. Please go ahead.

Matt Augustine (Vice President of Finance and Investor Relations)

Thank you and good morning. We appreciate your participation in today’s call. With me are Chief Executive Officer Stam Sledge, Chief Financial Officer Caleb Weatherall, President and Chief Operating Officer Adam Munoz, President of Pro Power, Travis Emery this morning we released our earnings results for the first quarter of 2026. Please note that any comments we make on today’s call regarding projections or our expectations for future events or are forward looking statements covered by the Private Securities Litigation Reform Act. Forward looking statements are subject to several risks and uncertainties, many of which are beyond our control. These risks and uncertainties can cause actual results to differ materially from our current expectations. We advise listeners to review our earnings release and risk factors discussed in our filings with the SEC. Also, during today’s call we will reference certain non-GAAP, financial measures. Reconciliations of these non-GAAP, measures to the most directly comparable GAAP, measures are included in our earnings release. Finally, after our prepared remarks, we will hold a question and answer session. With that I would like to turn the call over to Stam.

Stam Sledge (Chief Executive Officer)

Thanks Matt and good morning everyone. The results we generated in the first quarter of 2026 demonstrate the resilience of our business model. Despite weather related disruptions that significantly impacted revenue and profitability. During the quarter we delivered positive financial results in our completions business, particularly when measured by adjusted EBITDA less incurred capital expenditures. These results highlight the strength or industrialized model which is the result of strategic investments, disciplined asset deployment and rigorous cost management. The strategic actions we implemented throughout 2025 to protect our assets and right size our cost structure are now delivering measurable benefits, positioning us for success in the current market environment. We’ll continue to leverage the industrialized nature of our completions business to drive expansion of ProPower,, which we expect to fuel future earnings growth and further strengthen our value proposition with respect to the broader environment. We’re still in the early stages of assessing the global and domestic implications of the Iran War. While uncertainty remains, we’re starting to see signs of recovery across a broader North American oilfield services sector given a strengthening commodity backdrop that is driving early pricing and activity tailwinds across our completions business. Importantly, structural tightening in the completions market continues to intensify driven by ongoing attrition, particularly amongst smaller and less disciplined competitors. This trend was already emerging prior to the onset of the Iran War and has since accelerated with the recent increase in demand for US frac activity. Notably, there was already very little spare frac equipment capacity even before the conflict began, further amplifying current market constraints. These dynamics, combined with ongoing capital investment discipline and pricing discipline have tempered any plans to expand capacity both within ProPetro and among our close peers in the completion space. Collectively, these factors have created a more constructive supply and demand environment for our business over time. We do recognize the impact that the Iran War has created for our business. However, the market remains volatile and we expect this uncertainty to persist until there is more clarity on the disruptions in the Middle east and the subsequent impacts on global supply and demand dynamics. While external conditions are beyond our influence, we remain focused on what we can control our commitment to operational excellence, exercising rigorous cost discipline and deploying capital strategically.

Stam Sledge (Chief Executive Officer)

Our stable and industrialized business model ensures our positioning not only to navigate this volatility, but also to maximize opportunities and emerge stronger as conditions fatalize. Turning briefly to our fleet Due to the significant diesel to natural gas price to scale currently at play in the Permian Basin, we’ve seen enoughtic in demand for next generation natural gas burning fleet. Currently approximately 75% of our fleet is next generation spanning our Tier 4 BGB dual fuel and Force electric fleet.

Stam Sledge (Chief Executive Officer)

Recently we’ve also added a small number of 100% natural gas burning direct drive unit that operate at the highest performance standard and complement our existing fleet. These additions are measured and are not intended to expand our overall capacity in this environment, but rather to further enhance our portfolio. We anticipate adding a few more units later this year to capture targeted demand as it advises. As we look ahead, early indications suggest that the floor for crude prices has risen and is becoming more stable which is constructed for our business due to the strong demand for next generation natural gas burning fleet. We’re currently sold out across our Tier 4 DGB, dual fuel and Force electric fleet and accordingly expect to run approximately 12 fleets in the second quarter up from the approximately 11 in the first quarter. Importantly, we do have a few additional Tier 2 diesel fleets available which we will deploy only if opportunities meet our economic return threshold. Given disciplined deployments and limited capacity in the completions market, we’re well positioned to quickly capitalize on new opportunities as they emerge.

Stam Sledge (Chief Executive Officer)

Now moving over to Propower, we’ve made significant progress across several key initiatives this past quarter, highlighted by our recent announcement of a new strategic framework agreement with Caterpillar. This agreement enables ProPower, to acquire up to approximately 2.1 gigawatts of additional power generation capacity over the next five years. When combined with the approximate 550 megawatts previously ordered and upon successful delivery of assets under this agreement, ProPower, is positioned to have approximately 2.6 gigawatts of power generation capacity delivered by year end 2031 and fully deployed in 2032.

Stam Sledge (Chief Executive Officer)

Our nearly 20 year strategic partnership with Caterpillar has been instrumental in shaping our long term growth plan for ProPower,. This collaboration enables us to pursue shared success while providing ProPower, with reliable access to high quality assets even amidst the challenges of an exceptionally constrained supply chain. Together, we’re well positioned to capture the future opportunities and drive mutual value. This agreement underscores ProPower,’s leadership in deploying innovative energy solutions and we’re excited about the transformative potential it brings to our company.

Stam Sledge (Chief Executive Officer)

To support our upsized order backlog, we have built a robust commercial pipeline. Demand for reliable and low emission power solutions remains very strong, fueling continued growth across the data center industrial and oil and gas sectors. Notably, we’re pleased to report major advancements representing several hundred megawatts of high potential data center opportunity in a select portion of our data center commercial pipeline. While specific details are contingent on finalizing agreements, these developments highlight our expanding leadership and and strategic positioning in the digital infrastructure market.

Stam Sledge (Chief Executive Officer)

Additionally, we’re engaged in advanced contract negotiations for approximately 100 megawatts to support oil and gas microgrid projects. With deployment expected later this year. These commercial developments will rapidly expand our total committed capacity beyond the approximately 240 megawatts currently committed under contract. We are confident in ProPower,’s future growth and expect to secure additional contracts throughout 2026 as we extend and deepen relationships with both new and existing partners. The majority of future megawatts are anticipated to be contracted within the data center and industrial sectors, driven by their larger load requirements and long term strategic commitment. Importantly, our near term focus also remains on disciplined execution, deploying and scaling ProPower, across our contracted customers, with a strong emphasis on de risking deployment and building a resilient operational foundation to support sustainable long term growth and profitability.

Stam Sledge (Chief Executive Officer)

As we continue to deploy capital to grow ProPower,, we remain committed to maintaining financial flexibility and a strong balance sheet. Our preferred source of funding continues to be free cash flow generated from our completions. This is supplemented by our strong balance sheet proceeds from our recent equity offering and access to flexible financing arrangements including our Caterpillar financing facility and lease financing structures that we already have in place.

Stam Sledge (Chief Executive Officer)

Given the recent increased orders, we will continue to actively pursue low cost capital and flexible financing solutions to support ProPower,’s growth. Looking ahead While we’re still in the early days for ProPower,, we’ve already made significant progress to secure customer commitments and have real momentum and real operation that allow us to negotiate additional contracts from a position of strength and proven service quality. As the demand for reliable low emissions power solutions continues to grow, we expect Pro Power to continue to scale and deliver increasing returns over time.

Stam Sledge (Chief Executive Officer)

Our approach remains consistent. We’re staying nimble and disciplined while continuing to lean into the opportunity we see in Power. Stepping Back the strategy we’ve been executing over the past several years is now working. Our completions business continues to generate resilient financial results and provides the foundation to fund growth, while ProPower, represents a high growth and high return on investment vehicle that we are just beginning to scale. Importantly, ProPetro is a strong company pursuing value enhancing growth opportunities from a position of strength. We maintain a healthy balance sheet that provides us with the flexibility to invest in Pro Power. At the same time, we’re beginning to see tailwinds emerge in our completions business with early signs of tightening supply and improving pricing dynamics. We have a strong balance sheet, first class customers and a first class team that continue to execute at a high level while operating safely, efficiently and productively.

Stam Sledge (Chief Executive Officer)

Taken together, we believe we’re well positioned to execute through the current environment and create meaningful long term value.

Caleb Weatherall (Chief Financial Officer)

Thanks Sam and good morning everyone. As Sam mentioned, ProPetro,’s first quarter performance once again demonstrated the industrialized and resilient nature of our business. Despite lower revenue, we generated positive financial results in our completion setting which continues to highlight the durability of our company. At the same time, we have made meaningful Recent progress in ProPower including advancing equipment orders and securing additional capital. These efforts position ProPower to become an increasingly important contributor to the company’s future earnings profile. During the first quarter, ProPetro, generated total revenue of $271 million, a decrease of 7% as compared to the prior quarter. Net loss totaled $4 million or $0.03 loss per diluted share compared to net income of $1 million for $0.01 income per diluted share. For the fourth quarter of 2025, adjusted EBITDA totaled $36 million with 13% of revenue and decreased 29% compared to the prior quarter.

Caleb Weatherall (Chief Financial Officer)

This includes the lease expense related to our electric fleets of $16 million. As Sam mentioned, the decrease in adjusted EBITDA this quarter was primarily driven by reduced utilization in the completions business, which was significantly impacted by adverse weather conditions. Net cash provided by operating activities was $3 million as compared to $81 million in the prior quarter. The decrease is primarily attributable to lower adjusted EBITDA and working capital headwinds in the first quarter, which consumed approximately $32 million in cash and working capital tailwinds of the prior quarter, which were an approximately $35 million source of

Caleb Weatherall (Chief Financial Officer)

cash. During the first quarter, capital expenditures paid were $43 million and capital expenditures incurred were $85 million, including approximately $14 million primarily supporting maintenance in our completions business and approximately $71 million supporting pro power orders. Notably, the difference between incurred and paid capital expenditures is primarily comprised of Pro Power related capital expenditures that have been financed and paid directly by our financing partners and unpaid capital expenditures included in accounts payable and accrued liabilities.

Caleb Weatherall (Chief Financial Officer)

Net cash used in investing activities as shown on the Statement of Cash flow during the first quarter of 2026 was $41 million, which included capital expenditures paid of $43 million, offset by $2 million in proceeds from certain asset sales. We currently anticipate full year 2026 capital expenditures incurred to be between $540 million and $610 million, up from the $390 million to $435 million range highlighted in our fourth quarter earnings report of this the completions business is expected to account for approximately $140 million to $160 million, including approximately $40 to $50 million related to planned lease buyouts for a portion of our Force Electric Fleet portfolio. As a reminder, the five Force Electric Fleet leases were secured with an initial three year term and include options to either buy out or extend leases at the end of that period. The intent behind these leases was to defer upfront capital expenditures while securing the equipment at an attractive cost of capital supported by the earnings from the Force Electric fleets. The strategy proved successful, enabling PERPETRA to rapidly transform our fleet and still generate accretive cash flow.

Caleb Weatherall (Chief Financial Officer)

Our current intent to exercise the upcoming lease buyouts reflects the completion of a deliberate and strategic capital allocation decision. By exercising these options, we will take full ownership of the four suites. Each buyout will immediately reduce our lease …

Full story available on Benzinga.com

This post was originally published here

West Fraser Timber (NYSE:WFG) released first-quarter financial results and hosted an earnings call on Thursday. Read the complete transcript below.

This transcript is brought to you by Benzinga APIs. For real-time access to our entire catalog, please visit https://www.benzinga.com/apis/ for a consultation.

The full earnings call is available at https://app.webinar.net/xqBRYkZrl6P

Summary

West Fraser Timber Co Ltd reported a negative $66 million adjusted EBITDA for Q1 2026, largely due to $114 million in non-cash duty adjustments; without these, the underlying business generated $48 million.

The company saw a significant improvement in financial performance from Q4 to Q1, with all segments contributing positively, particularly due to stronger lumber pricing and operational progress.

West Fraser Timber Co Ltd continues its strategic optimization of the US Lumber portfolio, closing five mills and modernizing others to reduce costs, with liquidity near $900 million providing financial flexibility.

Operational highlights include the ramp-up at the new Henderson Lumber mill in Texas and the completion of the OSB mill curtailment in Alberta, with ongoing improvements at other facilities to boost efficiency.

Management remains cautiously optimistic about future market conditions, focusing on cost controls and strategic investments to maintain competitiveness amid uncertain demand and cost pressures.

Full Transcript

OPERATOR

Good morning ladies and gentlemen and welcome to The West Fraser Q1 2026 results Conference Call at this time all lines are in listen only mode. Following the presentation, we will conduct a question and answer session. If at any time during this call you require immediate assistance, please press Star zero for the operator. This call is being recorded on Thursday, April 30, 2026. During this conference call, West Fraser Timber Co Ltd’s representatives will be making certain statements about West Fraser’s future financial and operational performance, business outlook and capital plans. These statements may constitute forward looking information or forward looking statements within the meaning of Canadian and United States securities laws. Such statements involve certain risks, uncertainties and assumptions which may cause West Fraser’s actual or future results and performance to be materially different from those expressed or implied in these statements. Additional information about these risk factors and assumptions is included both in accompanying webcast presentation and in our 2025 annual MD&A and Annual Information form as updated in our quarterly MDA which can be accessed on West Fraser’s website or through SEDAR for Canadian Investors and EDGAR for United States Investors. I would now like to turn the conference over to Sean McLaren. Please go ahead.

Sean McLaren (President and CEO)

Thank you and good morning everyone and thank you for joining our first quarter 2026 earnings call. I am Sean McLaren, President CEO of West Fraser and joining me on the call today are Chris Farostic, Executive Vice President and Chief Financial Officer, Matt Tobin, Senior Vice President of Sales and Marketing and other members of our leadership team. On the earnings call this morning, I will begin with a brief overview of West Fraser’s first quarter and then pass the call to Chris for additional comments before I share some thoughts on our outlook and offer concluding remarks. As we entered 2026, we saw seasonal improvement in the lumber market. Southern yellow pine in particular saw better balance between available supply and seasonal demand. While underlying demand for new residential construction and repair and remodel remained subdued, we experienced healthier market conditions compared with the second half of 2025. In OSB Q1, market conditions remained challenging, though modest signs of improvement began to appear toward the end of the quarter and as seasonal demand increased. Against this backdrop, West Fraser saw a positive sequential turnaround in first quarter results led by stronger lumber pricing and operational Progress. We generated negative 66 million of adjusted EBITDA, but this result includes 114 million of prior period duty adjustments which Chris will get into shortly. Removing the impact of these adjustments. The underlying business generated $48 million with all three of our segments Lumber, North American, Engineered Wood Products and Europe contributing to the positive results. This reflects a significant improvement from the 79 million loss in the fourth quarter representing a turnaround of over $120 million. We continued to upgrade our portfolio during the quarter. We have completed production activities at our high level OSB mill in Alberta and are four months into the production ramp up at our new Henderson Lumber mill in Texas. Our US Lumber portfolio optimization continues to lower our cost structure with five mill closures and two brownfield modernizations over the past five years. Our balance sheet remains strong providing us with the flexibility through the cycle and optionality for the future. We ended the quarter with liquidity close to 900 million. The change in Q1 reflects the normal seasonal buildup of log inventory in Western Canada which is consistent with our typical working capital cycle. We expect this inventory investment to reduce in the second and third quarters as as our mills work through their log inventories. We continue to operate with a strong balance sheet allowing us to execute our capital allocation strategy. Our financial position also provides optionality for value creating opportunities should they arise. As always, we will be disciplined on execution and returns with that high level overview. I’ll now turn the call to Chris for additional detail and comments.

Chris Farostic (Executive Vice President and Chief Financial Officer)

Thank you Sean and good morning everyone. A reminder that we report in US dollars and all my references are to US dollar amounts unless otherwise indicated. In Q1 we generated negative $66 million of adjusted EBITDA. As Sean discussed, we had two large softwood lumber duty related adjustments in Q1 totaling $114 million. Both adjustments are non cash in nature. The first is based on preliminary rates released by the US Department of Commerce for the 2024 calendar year and the second due to a change in our estimate of amounts recoverable and payable as a result of the liquidation process covering the last half of 2017.

Chris Farostic (Executive Vice President and Chief Financial Officer)

I would point you to our news release of April 16th and our first quarter MDA and financials for further detail. The lumber segment posted adjusted EBITDA of negative 84 million in the first quarter, but removing the duties impact results in positive 30 million compared to negative 57 million in the fourth quarter, an improvement of 87 million. This improvement is largely a result of higher SYP and SPF pricing. North America EWP segment delivered 11 million of adjusted EBITDA in the first quarter, an improvement from the prior quarter’s negative 24 million.

Chris Farostic (Executive Vice President and Chief Financial Officer)

This 35 million improvement is due largely to better OSB pricing in the quarter. In Europe we generated 10 million of adjusted EBITDA in the first quarter, more than doubling the 4 million we generated in the fourth quarter and we’ve seen an improvement improved environment in Europe with better demand and higher prices. This marks the highest level of adjusted EBITDA in Europe since the second quarter of 2023. We have moved our previously named pulp and paper segment to other in the first quarter as the business has become a less significant part of our total operations and will no longer be specifically addressing the results of that segment.

Chris Farostic (Executive Vice President and Chief Financial Officer)

Bridging Our results from Q4 to Q1. A majority of the improvement came from higher prices in lumber in North American ewp. In addition, higher volumes in US Lumber in Europe and a favorable inventory adjustment represented the biggest variances. Costs were Flat relative to Q4. Lower SIP costs were offset by repair costs due to the fire at Blue Ridge and in North America and OSB we saw higher costs from resin and energy related inputs. Resin plays a significant role in our panel cost structure and the recent rise in methanol based resin pricing is a factor we anticipate will be more visible in our Q2 results. Our US lumber business continues to show improved operating efficiency stemming from the actions we have taken. The US south total cost per thousand board feet have reduced by approximately 6% in the last two years. During this period we have closed five lumber mills, completed a full brownfield modernization and successfully completed a number of smaller but significant capital projects and cost reduction initiatives. This better enables us to react to changes in the external environment and improves our ability to compete more effectively and help provide low cost supply to our customers.

Chris Farostic (Executive Vice President and Chief Financial Officer)

In Q1, our SYP shipments were 4% higher than Q4 on better operating efficiencies including the impact of the downtime at Blue Ridge. In Q1 our overall shipment volumes remained consistent with expectations. We saw higher shipments in both OSB and in both North American OSB and European osb. North American volumes increased due to the normal seasonal patterns and in Europe we increased shipments to meet higher demand. Cash flow from operations was impacted by the seasonal build in working capital resulting in negative $170 million in the first quarter and a net debt position of 457 million.

Chris Farostic (Executive Vice President and Chief Financial Officer)

We expect this working capital position to reverse in the second and third quarters. Net debt was influenced by two dividend payments made during the quarter which occurred as a result of our fiscal quarter ending on April 3rd rather than March 31st. Our net debt to capital ratio remains in single digits and our balance sheet is robust with respect to share repurchases. We did not repurchase shares in the first quarter. As we prioritize liquidity through the cycle, our commitment to returning capital to shareholders through a combination of both dividends and tactical share repurchases has not changed.

Chris Farostic (Executive Vice President and Chief Financial Officer)

Regarding our operational outlook for 2026, we have made no changes to our shipment guidance across our main products as well as our capital expenditure range. Transportation and resin costs have been influenced by evolving geopolitical dynamics, and we expect these factors to be more fully reflected in our second quarter results as we manage through the current environment. Due to the fluidity of the situation, it is hard to quantify what that impact may be, but we are actively managing where we can.

Chris Farostic (Executive Vice President and Chief Financial Officer)

With that overview, I’ll pass the call back to Sean.

Sean McLaren (President and CEO)

Thank you Chris. I’ll now …

Full story available on Benzinga.com

This post was originally published here
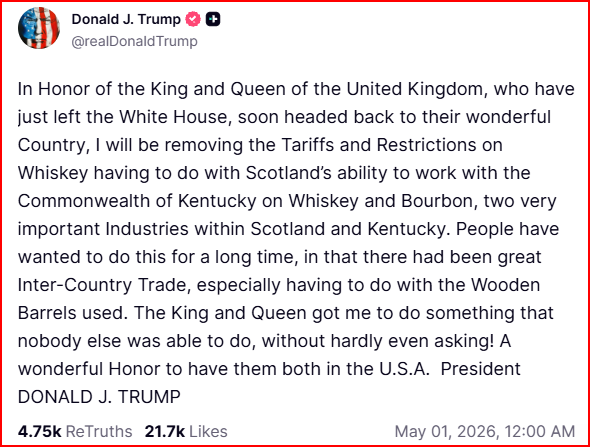
West Fraser Timber (TSX:WFG) released first-quarter financial results and hosted an earnings call on Thursday. Read the complete transcript below.

This content is powered by Benzinga APIs. For comprehensive financial data and transcripts, visit https://www.benzinga.com/apis/.

The full earnings call is available at https://app.webinar.net/xqBRYkZrl6P

Summary

West Fraser Timber Co Ltd reported a negative $66 million adjusted EBITDA for Q1 2026, impacted by $114 million in non-cash duty adjustments. Excluding these, the underlying business generated $48 million.

The company experienced a $120 million improvement from Q4 2025, driven by stronger lumber pricing and operational progress across all segments.

Strategic initiatives include completing production at the high level OSB mill in Alberta and ramping up production at the new Henderson Lumber mill in Texas.

The company maintains a strong balance sheet with liquidity close to $900 million and continues to focus on operational improvements and cost reduction initiatives.

Management highlighted cost pressures from resin, energy, and transportation, with ongoing efforts to navigate these challenges.

The outlook remains cautious due to uncertainties in housing demand and geopolitical influences, but the company expresses confidence in long-term demand drivers and market positioning.

Full Transcript

OPERATOR

Good morning ladies and gentlemen and welcome to The West Fraser Q1 2026 results Conference Call at this time all lines are in listen only mode. Following the presentation, we will conduct a question and answer session. If at any time during this call you require immediate assistance, please press Star zero for the operator. This call is being recorded on Thursday, April 30, 2026. During this conference call, West Fraser Timber Co Ltd’s representatives will be making certain statements about West Fraser’s future financial and operational performance, business outlook and capital plans. These statements may constitute forward-looking information or forward-looking statements within the meaning of Canadian and United States securities laws. Such statements involve certain risks, uncertainties and assumptions which may cause West Fraser’s actual or future results and performance to be materially different from those expressed or implied in these statements. Additional information about these risk factors and assumptions is included both in accompanying webcast presentation and in our 2025 annual MD&A and Annual Information form as updated in our quarterly MDA which can be accessed on West Fraser’s website or through SEDAR Plus for Canadian Investors and EDGAR for United States Investors. I would now like to turn the conference over to Sean McLaren. Please go ahead.

Sean McLaren (President and CEO)

Thank you and good morning everyone and thank you for joining our first quarter 2026 earnings call. I am Sean McLaren, President CEO of West Fraser and joining me on the call today are Chris Farostic, Executive Vice President and Chief Financial Officer, Matt Tobin, Senior Vice President of Sales and Marketing and other members of our leadership team. On the earnings call this morning, I will begin with a brief overview of West Fraser’s first quarter and then pass the call to Chris for additional comments before I share some thoughts on our outlook and offer concluding remarks. As we entered 2026, we saw seasonal improvement in the lumber market. Southern yellow pine in particular saw better balance between available supply and seasonal demand. While underlying demand for new residential construction and repair and remodel remained subdued, we experienced healthier market conditions compared with the second half of 2025. In OSB Q1, market conditions remained challenging, though modest signs of improvement began to appear toward the end of the quarter and as seasonal demand increased. Against this backdrop, West Fraser saw a positive sequential turnaround in first quarter results led by stronger lumber pricing and operational Progress. We generated negative 66 million of adjusted EBITDA, but this result includes 114 million of prior period duty adjustments which Chris will get into shortly. Removing the impact of these adjustments. The underlying business generated $48 million with all three of our segments Lumber, North American, Engineered Wood Products and Europe contributing to the positive results. This reflects a significant improvement from the 79 million loss in the fourth quarter representing a turnaround of over $120 million. We continued to high grade our portfolio during the quarter. We have completed production activities at our high level OSB mill in Alberta and are four months into the production ramp up at our new Henderson Lumber mill in Texas. Our US Lumber portfolio optimization continues to lower our cost structure with five mill closures and two brownfield modernizations over the past five years. Our balance sheet remains strong providing us with the flexibility through the cycle and optionality for the future. We ended the quarter with liquidity close to 900 million. The change in Q1 reflects the normal seasonal buildup of log inventory in Western Canada which is consistent with our typical working capital cycle. We expect this inventory investment to reduce in the second and third quarters as our mills work through their log inventories. We continue to operate with a strong balance sheet allowing us to execute our capital allocation strategy. Our financial position also provides optionality for value creating opportunities should they arise. As always, we will be disciplined on execution and returns with that high level overview. I’ll now turn the call to Chris for additional detail and comments.

Chris Farostic (Executive Vice President and Chief Financial Officer)

Thank you Sean and good morning everyone. A reminder that we report in US dollars and all my references are to US dollar amounts unless otherwise indicated. In Q1 we generated negative $66 million of adjusted EBITDA. As Sean discussed, we had two large softwood lumber duty related adjustments in Q1 totaling $114 million. Both adjustments are non cash in nature. The first is based on preliminary rates released by the US Department of Commerce for the 2024 calendar year and the second due to a change in our estimate of amounts recoverable and payable as a result of the liquidation process covering the last half of 2017.

Chris Farostic (Executive Vice President and Chief Financial Officer)

I would point you to our news release of April 16th and our first quarter MDA and financials for further detail. The lumber segment posted adjusted EBITDA of negative 84 million in the first quarter, but removing the duties impact results in positive 30 million compared to negative 57 million in the fourth quarter, an improvement of 87 million. This improvement is largely a result of higher SYP and SPF pricing. North America EWP segment delivered 11 million of adjusted EBITDA in the first quarter, an improvement from the prior quarter’s negative 24 million.

Chris Farostic (Executive Vice President and Chief Financial Officer)

This 35 million improvement is due largely to better OSB pricing in the quarter. In Europe we generated 10 million of adjusted EBITDA in the first quarter, more than doubling the 4 million we generated in the fourth quarter and we’ve seen an improvement improved environment in Europe with better demand and higher prices. This marks the highest level of adjusted EBITDA in Europe since the second quarter of 2023. We have moved our previously named pulp and paper segment to other in the first quarter as the business has become a less significant part of our total operations and will no longer be specifically addressing the results of that segment.

Chris Farostic (Executive Vice President and Chief Financial Officer)

Bridging Our results from Q4 to Q1. A majority of the improvement came from higher prices in lumber in North American EWP. In addition, higher volumes in US Lumber in Europe and a favorable inventory adjustment represented the biggest variances. Costs were Flat relative to Q4. Lower SIP costs were offset by repair costs due to the fire at Blue Ridge and in North America and OSB we saw higher costs from resin and energy related inputs. Resin plays a significant role in our panel cost structure and the recent rise in methanol based resin pricing is a factor we anticipate will be more visible in our Q2 results.

Chris Farostic (Executive Vice President and Chief Financial Officer)

Our US lumber business continues to show improved operating efficiency stemming from the actions we have taken. The US south total cost per thousand board feet have reduced by approximately 6% in the last two years. During this period we have closed five lumber mills, completed a full brownfield modernization and successfully completed a number of smaller but significant capital projects and cost reduction initiatives. This better enables us to react to changes in the external environment and improves our ability to compete more effectively and help provide low cost supply to our customers. In Q1, our SYP shipments were 4% higher than Q4 on better operating efficiencies including the impact of the downtime at Blue Ridge. In Q1 our overall shipment volumes remained consistent with expectations. We saw higher shipments in both OSB and in both North American OSB and European osb. North American volumes increased due to the normal seasonal patterns and in Europe we increased shipments to meet higher demand. Cash flow from operations was impacted by the seasonal build in working capital resulting in negative $170 million in the first quarter and a net debt position of 457 million.

Chris Farostic (Executive Vice President and Chief Financial Officer)

We expect this working capital position to reverse in the second and third quarters. Net debt was influenced by two dividend payments made during the quarter which occurred as a result of our fiscal quarter ending on April 3rd rather than March 31st. Our net debt to capital ratio remains in single digits and our balance sheet is robust with respect to share repurchases. We did not repurchase shares in the first quarter. As we prioritize liquidity through the cycle, our commitment to returning capital to shareholders through a combination of both dividends and tactical share repurchases has not changed.

Chris Farostic (Executive Vice President and Chief Financial Officer)

Regarding our operational outlook for 2026, we have made no changes to our shipment guidance across our main products as well as our capital expenditure range. Transportation and resin costs have been influenced by evolving geopolitical dynamics and we expect these factors to be more fully reflected in our second quarter results as we manage through the current environment. Due to the fluidity of the situation, it is hard to quantify what that impact may be, but we are actively managing where we can.

Chris Farostic (Executive Vice President and Chief Financial Officer)

With that overview, I’ll pass the call back to Sean.

Sean McLaren (President and CEO)

Thank you Chris. I’ll now shift to our general outlook and offer some …

Full story available on Benzinga.com

This post was originally published here

UFP Industries (NASDAQ:UFPI) held its first-quarter earnings conference call on Thursday. Below is the complete transcript from the call.

Benzinga APIs provide real-time access to earnings call transcripts and financial data. Visit https://www.benzinga.com/apis/ to learn more.

The full earnings call is available at https://edge.media-server.com/mmc/p/7czr42fo/

Summary

UFP Industries Inc reported Q1 2026 net sales of $1.46 billion, an 8% decrease from the previous year, influenced by a 7% decrease in units and a 1% decrease in price.

The company’s adjusted EBITDA margin for the quarter was 7.6%, with earnings per share at $0.89, impacted by higher medical and transportation costs and adverse weather conditions.

Strategically, UFP Industries Inc announced two acquisitions: Moisture Shield and Berry Pallets, to expand capacity and geographic reach, and introduced new products like True Frame Joist and Arris trim.

Despite macroeconomic headwinds, the company remains focused on cost control, opportunistic M&A, and maintaining a strong financial position with $2 billion in liquidity.

Future guidance is cautious, with expectations of flat to slightly down unit volumes for the year, but with strategic investments aimed at achieving long-term growth targets.

Full Transcript

OPERATOR

Good day and welcome to UFP Industries Inc Q1 2026 earnings conference call and webcast. At this time all participants are in a listen only mode. After the speaker presentation there will be a question and answer session. To ask a question during the session you will need to press star 11 on your telephone. You will then hear an automated message advising your hand is raised to withdraw your question. Press star 11 again. Please be advised that today’s conference is being recorded. I would now like to hand the conference over to your speaker, Mr. Stanley Elliott, Director of Investor Relations. Please go ahead. Good morning everyone. Thank you for joining us to discuss UFP Industries first quarter 2026 results.

Stanley Elliott (Director of Investor Relations)

Joining me on our call are Will Schwartz, our President and Chief Executive Officer, and Mike Cole, our Chief Financial Officer. Following our prepared remarks, we will open the call for questions. Before I turn the call over, let me remind you that yesterday’s press release and presentation include forward looking statements as defined in the Private Securities Litigation Reform Act of 1995. These statements are subject to risks and uncertainties that could cause actual results to differ materially from expectations. These risks and uncertainties include, but are not limited to, the factors identified in this release, in our most recent annual report on Form 10K and in our other filings with the Securities and Exchange Commission. Today’s presentation will also include certain non GAAP measures. For a reconciliation of these non GAAP measures to the corresponding GAAP measures, please refer to our earnings press release and our website ufpi.com I will now turn

Will Schwartz (President and Chief Executive Officer)

the call over to Will Good morning, everyone, and thank you for joining today’s call to discuss our financial results for the first quarter of fiscal year 2026. We’ll start by sharing our thoughts on the quarter, what we are seeing in the marketplace, and provide some thoughts on how we see the business performing for the balance of the year before opening the call for questions. the call for questions. Many of these same dynamics that we saw through much of 2025 continued into our first quarter. After seeing some stabilization through much of the quarter, macro headwinds and competitive pressures increased volatility as the quarter progressed. We were also adversely affected this quarter by a longer than normal winter season and so the normal seasonal uplift during the month of March failed to materialize. In addition to the impacts of softer demand, our results were impacted by higher medical costs than the previous year. This abnormal activity throughout March contributed to roughly 60% of the year over year decline in profitability in the quarter. Business conditions have since leveled out, but given the ongoing geopolitical uncertainty and broadening inflation, particularly around higher transportation costs. We are approaching the remainder of the year with a slightly more cautious outlook. Our Q1 results are reflective of the current operating environment. Net sales of $1.46 billion were down 8% from Q1 of 2025, representing a 7% decrease in units and a 1% decrease in price. Our adjusted EBITDA margin for the quarter was 7.6% and earnings per share for quarter was $0.89. Despite the temporarily challenged environment, we will continue to be focused on refining and growing our core business. We will focus on controlling costs and we plan to use this period of uncertainty to be more opportunistic and leverage our strong financial position. With approximately $2 billion in liquidity, we intend to pursue meaningful MA while returning our free cash flow to shareholders through opportunistic share repurchase and dividends. As we’ve said before, we continue to target above market growth with an emphasis on returns and we continue to make strategyic investments that contribute to the long term success of our business. In the immediate term, new product sales remain consistent at 7.5% of sales on a trailing 12 month basis. We also have a sharp eye towards strengthening our core business for the long term, deploying capital for greenfield investments in Matt, introducing innovative products and structurally lowering our cost base. On the cost side, we are actively mitigating higher costs and remain on track to deliver the remaining 25 million of our $60 million cost out program by year end with the potential to capture incremental savings beyond our initial targets. While Mike will share additional color on the results, we were also pleased to announce two post quarter end acquisitions that align with our disciplined strategy to deploy capital toward high quality strategyic fits. Before I get into the details, I’d like to start by welcoming the employees of Moisture Shield and Berry Pallets into the UFP family. These companies were a strategyic financial fit, but equally important they aligned well with our future. In our Decorators business unit, we announced the acquisition of Moisture Shield Decking Operations from Old Castle APG. The acquisition adds a wood plastic composite plant in Springdale, Arkansas which meaningfully expands our capacity, adds redundancy to our operation and enhances our ability to bring unique products to market. Additionally, this acquisition eliminates the need to spend capital on a new green field as demand for our product has outpaced capacity. We anticipate that this acquisition gives us the needed footprint to double our wood plastic composite decking manufacturing capacity by 20. Additionally, the acquisition also brings the rights to Moisture Shield’s Cool Deck technology, a proprietary heat mitigating technology which reduces heat transfer by up to 35%. We believe this would fit alongside our Decorators decking line, including integration into our surestone technology boards in our packaging segment. We also welcome to the UFP Family Berry Pallets, a new pallet manufacturer in the upper Midwest that expands our geographic reach and strengthens the density of our pallet network. These opportunities to increase the scale and synergy of our business only create value if we integrate it well. And that’s exactly why earlier this month we announced Patrick Benton will transition from his role as President of UFP Industries Construction segment path to the newly created Executive Vice President of Operations Integration position. Patrick has spent his career running some of our most profitable plants and business units and he knows firsthand what it takes to drive efficiency, reduce cost and accelerate the path to strong returns. In his new role, Patrick will apply that operational discipline across our growing portfolio of acquisitions, ensuring we move faster from close to contribution and that every business we bring into the UFP family performs to its full potential. Now moving on to segment highlights beginning with retail, our largest business unit, Prowood continues to make progress on lowering our cost positions and improving our manufacturing process. Some of this progress was overshadowed by the levels of inflation we saw in the quarter as well as the later than usual winter conditions. Prowood is an industry leading brand and we continue to add more value across our portfolio. A great example of this is our True Frame Joist product launched last month at jlc. As a reminder, this is the business unit’s first proprietary product designed specifically for use in deck substructures. The value we add on the front end eases several common pain points for contractors saving time and money. We have expanded production into four manufacturing plants and increased our sales efforts to capitalize on the demand pull. While still relatively small, this is a compelling product line extension in our core pressure treating and decking products. Similarly, we are pleased with the repositioning of our edge business and prospects for profitable growth. Our new Arris trim, made with Sheerstone technology, will begin shipping to customers late this quarter. Early demand indicators look quite favorable as contractors are gravitating to the same product features that has made our surestone decking offering so compelling. Turning to deckorators, we continue to see strong momentum from last year carryover into our first quarter. Our Shearstone decking sales increased 27% and our traditional wood plastic composite decking increased by 4%, both from the same quarter a year ago. We believe both metrics remain ahead of the broader industry. We were pleased with the results of our efforts last year to enhance Deckorator’s brand and intend to maintain that effort in 2026. In addition to our elevated sales volumes, our measures of consumer interest have more than doubled over the past year. These metrics include where to find a contractor, where to buy decorators and sample requests both at big box retailers and through our website. The outperforming demand stated earlier combined with the measurable customer feedback gives us confidence in our stated plan to double market share over the next five years. We remain excited about the progress we are making within both our surestone and Wood plastic manufacturing facilities to increase capacity and meet growing consumer demand. Our first truck left Buffalo in mid April and we continue to ramp up production at both our surestone production locations. We look forward to being fully operational in Q2, which will help us continue to work through the sales backlogs that we were not able to realize in the first quarter. Coupled with the recent Moisture Shield acquisition, we are well positioned to capture growth entering 2026 and beyond. Despite near term macro uncertainty, our confidence in the business remains strong and we continue to expect 100 million of incremental decorators growth this year. Our packaging segment continues to make progress despite an uneven macro backdrop. We are positioning the business for longer term success by introducing new value add products to our customers, investing in automation and investing in new and lower cost manufacturing Quoting activity has remained strong, but customer takeaway remained mixed which is reflective of the uncertainty across many end markets. The combination of higher commodity prices and a competitive market remain an overhang on profitability. That said, we are encouraged that our margins continue to stabilize sequentially and supports our view that we are closer to the bottom of the cycle. We continue to believe that our national footprint gives us geographic expansion opportunities and and our design and engineering capabilities separate us from many of our smaller, more regional competitors who lack the manufacturing scale and financial position to compete with national customers. With the improvements we made to the business, we can deliver above market growth in a recovery. Moving on to Construction the macro story in our construction segment has been fairly consistent for the past several quarters, but we continue to actively reposition our portfolio. A challenging new residential construction environment continues to weigh on, results overshadowing improvements across our other businesses. Residential builders remain cautious managing home inventories carefully ahead of the spring selling season. While consumer confidence and affordability headwinds persist. We continue to make investments in automation and other initiatives to improve our cost, position and throughput. One of these initiatives is the Frame Forward Systems brand that we launched in February at the International Builder Show. Frame Forward Systems positions our site built business unit to move our wood framing business beyond commodity component sale to capture increased margin through a system selling approach and to drive greater customer loyalty. While early Frame Forward Systems has been very well received by the construction trademark as we continue to raise the bar on off site manufacturing to address the on site challenges in the construction industry. Similarly in our factory built business, this business unit continues to actively add more value to our customers through partnerships, expansion of distribution capabilities and by facilitating cross selling with other parts of our business. Our concrete forming business continues to expand our product and services offerings to capture more of our customers wallets while helping them address labor challenges on the job site. Finally, our commercial business continues to build on new products, new customer relationships …

Full story available on Benzinga.com

This post was originally published here
Secure Waste Infr (TSX:SES) reported first-quarter financial results on Thursday. The transcript from the company’s first-quarter earnings call has been provided below.

This transcript is brought to you by Benzinga APIs. For real-time access to our entire catalog, please visit https://www.benzinga.com/apis/ for a consultation.

The full earnings call is available at https://app.webinar.net/Z2prKwqGmen

Summary

SES AI Corp reported a strong financial performance with an adjusted EBITDA of $137 million, reflecting a 13% year-over-year increase, and a revenue of $383 million, resulting in a 36% margin.

The company announced a strategic transaction with GFL Environmental, emphasizing immediate value to shareholders and potential future upside through equity ownership in the combined company.

SES AI Corp raised its 2026 adjusted EBITDA guidance and increased growth capital expenditure to $100 million to support high-return infrastructure projects.

Operational highlights included the commissioning of produce water infrastructure in the Montney and progressing the reopening of a waste processing facility in Alberta.

Management emphasized the stability of cash flows driven by long-cycle drivers and steady volumes, with a focus on disciplined pricing and cost control.

Full Transcript

OPERATOR

Good morning ladies and gentlemen and welcome to the SecureWaste Infrastructure Corp. Q1 2026 results conference call. At this time, all lines are in listen-only mode. Following the presentation, we will conduct a question and answer session. If at any time during the call you require immediate assistance, please press star zero for the operator. This call is being recorded on Thursday, April 30, 2026. I would now like to turn the conference over to Chad Mangus. Please go ahead.

Chad Mangus (Chief Financial Officer)

Thank you and good morning to everyone who is listening to the call. Welcome to Secure Waste Infrastructure Corp’s conference call to discuss our first quarter 2026 results. I’m Chad Mangus, Chief Financial Officer and joining me on the call today are Alan Granch, our President and Chief Executive Officer, and Corey Hyam, our Chief Operating Officer. During the call we will make forward looking statements related to future performance and refer to certain non GAAP financial measures that do not have standardized meanings under IFRS and may not be comparable to similar measures disclosed by other companies. Forward looking statements reflect management’s current expectations and are based on assumptions that we believe are reasonable. However, actual results may differ materially due to a number of risks and uncertainties. Please refer to our disclosure documents available on SEDAR for further details of these risks and for definitions and reconciliations of non GAAP measures. Today we will focus on three areas the GFL transaction and shareholder meeting, an overview of Q1 performance and key financial highlights, and an outlook for the remainder of 2026 and beyond. I will now turn the call over to Alan.

Alan Granch (President and Chief Executive Officer)

Thanks, Chad. Good morning and thank you for joining the call today. I’d like to start with our recently announced transaction with GFL Environmental and the materials filed this week in connection with the upcoming shareholder meeting. This transaction delivers immediate and certain value to shareholders at an attractive valuation, including a meaningful premium to our recent trading levels, while also providing continued participation in future upside through equity ownership in the combined company. The Board unanimously recommends that shareholders vote in favor of the transaction following a comprehensive review of strategic alternatives. In making this recommendation, the Board considered the opportunity to crystallize the value created at Secure, the ability to participate in future value creation through GFL equity, alignment with a proven entrepreneurial management team as well as limited number of alternative transactions available and the relative risk adjusted value of continuing as a standalone business. The Board also considered that GFL shares are currently trading below historical levels and in its view do not fully reflect the underlying value of the business, providing a potential for future re-rating over time. Over the past several years, Secure has built a high quality infrastructure backed waste platform with strong fundamentals and a clear path to continue growth. However, realizing that value on a standalone basis requires ongoing execution and capital deployment. This transaction enables shareholders to crystallize that value today and reduces execution risk and preserves meaningful upside through the combined platform. None of this would be possible without our people. Over 2000 employees have built secure into what it is today, grounded in a culture of safety, operational excellence and doing the right thing. These values are strongly aligned with GFL and our team will play a critical role in the combined company going forward. We encourage all shareholders to review the materials and vote in favor of the transaction on May 27. Turning briefly to the quarter, we delivered a strong start to 2026, generating $137 million of adjusted EBITDA, up 13% year over year and 21% per share. This performance reflects continued strength across volumes, pricing, capital projects and acquisitions despite lower oil prices for the majority of the quarter prior to the recent strengthening in commodity prices. Operationally, we continue to advance our growth projects including commissioning our produced water infrastructure in the Montney and progressing the reopening of suspended industrial waste processing facility in Alberta’s industrial heartland, which remains on track for completion by the end of the second quarter. Overall, the quarter reinforces what we consistently see in our business stable volumes, disciplined pricing and incremental growth from capital deployment. We now expect results to trend toward the high end of our 2026 adjusted EBITDA guidance range and we are increasing our growth capital to approximately 100 million from 75 million to support the acceleration of high return infrastructure projects. I’ll now turn the call over to Chad.

Chad Mangus (Chief Financial Officer)

Thanks Alan. In the first quarter we generated 137 million of adjusted EBITDA on 383 million of revenue, resulting in a margin of 36%. While revenue growth was modest, EBITDA growth was stronger reflecting a continued shift toward higher margin waste streams, disciplined pricing and cost control. This is consistent with our strategy of prioritizing quality of earnings over top line growth. We also generated 101 million of funds flow from operations in the quarter, supporting both our capital program and returns to shareholders on the balance sheet. Let me walk through a few more items in more detail than usual. We reported restricted cash of 31 million reflecting margin posted on hedging positions. This was driven by the sharp move in oil prices during March which created temporary margin requirements. These positions were fully offset by physical positions that have either been or are expected to be realized at a higher price. We also reported a higher than normal cash balance of 59 million reflecting the large payment received on the last day of the quarter. As of today, a revolver balance has been paid down by 76 million since end of Q1 to approximately 350 million. From a capital allocation perspective, we continue to execute on our priorities. During the quarter, we increased the dividend by 5% to 10 and a half cents per share paid quarterly, we repurchased nearly 1 million shares at a weighted average price of just over $17. And we continue to invest in high return projects, spending 22 million to advance previously announced plans. Our priorities remain unchanged. Invest in the business, maintain a strong balance sheet and return capital to shareholders. I’ll turn the call over to Corey now to discuss the business outlook for the remainder of 2026 and beyond.

Corey Hyam (Chief Operating Officer)

Thanks, Chad. To start, I want to provide an overview of the underlying cash flow profile of the business. One of Secure’s key strengths is that our cash flow is generally not tied to short term commodity prices. Our business is driven by ongoing production, industrial demand and mandated environmental spending. These are long cycle drivers resulting in stable volumes and predictable cash flow across cycles. What we typically see is limited near term upside when prices rise and moderated downside when prices fall. That stability under pins our performance now, tying that to our outlook. The move toward the high end of our guidance range primarily reflects oil prices that are approximately 20% stronger than our original assumptions. That said, given our limited direct exposure to commodity prices, the impact to our business remains modest and confined within a relatively narrow range. Importantly, this is not what is driving the underlying growth of the business. The year over year increase relative to 2025 is being driven by the same factors that have consistently underpinned our first, the strength and resilience of our base business supported by steady volumes and disciplined pricing. Second, the full contribution from infrastructure projects and acquisitions commissioned through 2025 and early 2026, which are now contributing incremental EBITDA and third, improved performance of metals recycling supported by higher volumes, better pricing and the logistics improvements we made last year. So when you step back, the move within the guidance range reflects macro tailwinds with the growth of the business itself or while the growth of the business itself continues to be driven by execution, capital deployment and the strength of our underlying platform. Looking longer term, the fundamentals remain strong. Western Canadian production is expected to grow approximately 3% annually through 2030, supported by improved market access through TMX and LNG developments, resilient producer economics and a continued focus on efficient long life resource development. Additionally, increasing reclamation and remediation requirements are driving non discretionary demand for our infrastructure. Produced water volumes are also increasingly increasing with higher intensity development and as water handling becomes more complex and capital intensive, we continue to see a structural shift towards outsourcing. When you combine these factors, it creates a long duration, highly visible demand profile for our business. I’ll now turn it over to Alan to conclude our prepared remarks.

Alan Granch (President and Chief Executive Officer)

Thanks Corey. To close Secure continues to deliver stable recurring earnings, strong free cash flow and visible long term growth core attributes that underpin the intrinsic value of our business. The transaction with GFL captures that value today, reduces the risks associated with realizing it independently, and positions shareholders to participate in the next phase of growth through a larger, more scaled platform. The transaction has the full support of our board, including a special committee of independent directors.

Alan Granch (President and Chief Executive Officer)

Additionally, certain of our largest shareholders, together with our directors and executive officers, have entered into voting support agreements representing approximately 21% of our outstanding shares. We encourage all shareholders to review the materials and vote in favor of the upcoming meeting. I also want to recognize our employees for their continued commitment, their focus on safety and execution as what built this business and we continue to drive success going forward.

Alan Granch (President and Chief Executive Officer)

With that, we’ll open the line for questions.

OPERATOR

Thank you ladies and gentlemen. We will now begin the question and answer session. Should you have a question, please press the star followed by the one. On your touchtone phone you will hear a prompt that your hand has been raised. Should you wish to decline from the polling process, please press the star followed by the two. If you are using a speakerphone, please lift the handset before pressing any keys. One moment please for your first question. Your first question comes from Konark Gupta with Scotiabank. Please go ahead.

Konark Gupta (Equity Analyst)

Thanks. Good morning team. I think maybe the first one on the volume side, it seems like you guys have changed the disclosures around volumes. So just trying to understand, you know, the volumes seem to be up on the liquid side on the waste segment and maybe down a little bit on the solid waste side, which I think includes now the scrap metal. If you can help us parse out the key underlying drivers in these volumes. I mean I think seems like produced water seems still more positive than other commodities.

Konark Gupta (Equity Analyst)

But what were the sort of puts and takes in the quarter on different commodities? Thanks.

Corey Hyam (Chief Operating Officer)

Good morning Konark, It’s Corey. Yeah, I think, I think you kind of nailed it there in terms of the macro pieces. You know, it’s kind of the same themes as we exited Q3 and Q4 where, you know, activity was a little softer in the field. But you know, I think Q1 showed stability in Our liquids volumes, which it was driven by the produced water volumes. As you mentioned, when you look at the solids processing side, we had outperformance in our metals group which offset some of the softness in the landfill volumes.

Corey Hyam (Chief Operating Officer)

So you know, when I look at this, it just, it really just emphasizes the performance and the stability in those two solids and liquids processing pieces of our business.

Alan Granch (President and Chief Executive Officer)

I think to add here, Konark. I think too as we think about the activity levels here in 2026 and obviously we just raised our guidance to the upper end of that range. You …

Full story available on Benzinga.com

This post was originally published here
President Donald Trump declared the elimination of tariffs on Scottish whisky as a mark of respect for Britain’s King Charles III and Queen Camilla, following their state visit.
Shortly after bidding adieu to the British royals at the White House on Thursday, Trump announced on his Truth Social, saying, “The King and Queen got me to do something that nobody else was able to do, without hardly even asking!” 

He further explained that the removal of tariffs and restrictions applies specifically to Scotland’s trade with Kentucky, a state renowned for its bourbon production, especially in relation to wooden barrels.

The British Royal visit to the U.S. was officially meant to celebrate transatlantic ties ahead of America’s 250th Independence Day anniversary. However, it also focused on resetting the strained relationship between the nations amid Trump’s dissatisfaction with UK Prime Minister Kier Starmer over the lack of co-operation on several issues.

This post was originally published here

Microsoft Corp (NASDAQ:MSFT) co-founder Bill Gates deemed Elon Musk‘s vision of producing the Tesla Inc. (NASDAQ:TSLA) Semi Truck as impractical, but the saleable version of the all-electric truck just entered mass production.

Bill Gates On Tesla Semi

On Thursday, influencer Sawyer Merritt posted on the social media platform, recounting how Gates had been bearish about the Tesla Semi. “Welp, today Tesla officially started mass production of their Semi truck, and it very much works lol,” Merritt said in the post.

Notably, relations between Gates and Musk soured after it was revealed in 2022 that the philanthropist held a short position against the automaker. Musk had, in 2024, shared that

Full story available on Benzinga.com

This post was originally published here

AutoNation, Inc. (NYSE:AN) will release earnings for its first quarter before the opening bell on Friday, May 1.

Analysts expect the Fort Lauderdale, Florida-based company to report quarterly earnings of $4.61 per share, down from $4.68 per share in the year-ago period. The consensus estimate for AutoNation’s quarterly revenue is $6.65 billion (it reported $6.69 billion last year), according to Benzinga Pro.

On Feb. 6, AutoNation reported better-than-expected fourth-quarter EPS results.

AutoNation shares gained 3.3% to close at $212.38 on Thursday.

Benzinga readers can access the latest analyst ratings on the Analyst Stock Ratings page. Readers can sort by stock ticker, company name, analyst firm, rating change or other variables.

Let’s have a look at how Benzinga’s most-accurate analysts have rated the company in the recent period.

  • Wells Fargo …

Full story available on Benzinga.com

This post was originally published here

Veeva Systems Inc. (NYSE:VEEV) is poised to join the S&P 500 Index, a change announced Thursday that puts the life sciences software provider into one of the market’s most closely tracked benchmarks.

According to a release by S&P Global, Veeva will enter the index before trading begins on May 7, replacing Coterra Energy Inc. (NYSE:CTRA), which is being bought by Devon Energy Corp. (NYSE:DVN) in a deal expected to close soon.

Expected Boost From Passive Flows

Veeva’s addition is likely to drive up demand for its shares, as index funds and exchange-traded funds (ETFs) tracking the S&P 500 adjust their holdings. Such inclusions typically result in short-term buying pressure, driven by passive investment inflows.

Some of the most popular ETFs, like SPDR S&P 500 ETF Trust (NYSE:SPY), iShares Core S&P 500 ETF (NYSE:

Full story available on Benzinga.com

This post was originally published here

The CNN Money Fear and Greed index showed an improvement in the overall market sentiment, while the index remained in the “Greed” zone on Thursday.

U.S. stocks settled higher on Thursday, with the S&P 500 recording its first settlement above the 7,200 level.

In earnings, Caterpillar (NYSE:CAT) shares jumped around 10% on Thursday after the company reported stronger-than-expected quarterly results. Shares of Alphabet Inc. (NASDAQ:GOOG) (NASDAQ:GOOGL) jumped 10% following strong first-quarter revenue. However, Meta Platforms Inc. (NASDAQ:META) and Microsoft Corp. (NASDAQ:MSFT) shares lost 8.6% and 3.9%, respectively, following quarterly results.

President Donald Trump kept the Iran story front and center, saying that European leaders should stop “interfering with those that are getting rid of the Iran Nuclear threat” and doubling …

Full story available on Benzinga.com

This post was originally published here

The S&P 500, managed by S&P Global Dow Jones Indices, on Thursday, announced it was beginning consultation on rule changes that could potentially help Elon Musk-led SpaceX gain an expedited entry into the index.

S&P 500 Rule Changes

The rule changes include letting IPOs enter the index six months after their debut on an eligible index instead of a 12-month period, according to current rules.

The index also proposed eliminating a minimum Investable Weight Factor (IWF) of 0.10 for megacap companies. The IWF is a methodology used to calculate the number of shares of a company available to trade on the market.

data-variant=”card”
data-news-mode=”manual”

>


Read Also:

Elon Musk Takes A Swipe At Gavin Newsom Amid Billionaire Wealth Tax Row: ‘…And You Decide To Leave The Planet’

This post was originally published here

Chevron Corporation (NYSE:CVX) will release earnings for its first quarter before the opening bell on Friday, May 1.

Analysts expect the Houston, Texas-based company to report quarterly earnings of 97 cents per share. That’s down from $2.18 per share in the year-ago period. The consensus estimate for Chevron’s quarterly revenue is $52.7 billion (it reported $47.61 billion last year), according to Benzinga Pro.

On April 9, Chevron confirmed an oil discovery at the Bandit prospect in the Gulf of America.

Shares of Chevron gained 0.6% to close at $193.31 on Thursday.

Benzinga readers can access the latest analyst ratings on the Analyst Stock Ratings page. Readers can sort by stock ticker, company name, analyst firm, rating change or other variables.

Let’s have a look at how Benzinga’s most-accurate analysts have rated the …

Full story available on Benzinga.com

This post was originally published here

Reddit Inc. (NYSE:RDDT) CEO Steve Huffman argued Thursday that the platform’s years of user discussions have become a key ingredient for artificial intelligence systems. He called the platform “the fuel” behind the rapidly expanding technology.

Speaking on Mad Money with Jim Cramer, Huffman emphasized that AI systems depend heavily on real-world human knowledge, much of which is found in Reddit’s user-generated discussions. “There’s no artificial intelligence without actual intelligence,” Huffman said, noting that Reddit serves as a key source of authentic data that both AI systems and users increasingly rely on.

Reddit’s Unique Role In AI Development

Huffman highlighted Reddit’s “lightweight” operating model as a key differentiator in the AI landscape. Unlike major cloud and AI infrastructure providers, the company does not invest heavily in data centers or compute capacity.

Capital expenditures were about $1 million for the first quarter, far below what major cloud and AI infrastructure companies typically commit.

“We’re a lightweight company,” he said. “We’re not building data centers … we’re building a consumer product for people.” He argued that …

Full story available on Benzinga.com

This post was originally published here

Blockbuster sales of its flagship GLP-1 treatments have propelled Eli Lilly And Co.‘s (NYSE:LLY) first-quarter earnings, prompting a prominent Wall Street analyst to defend the stock’s valuation and highlight the disruptive potential of its new oral weight-loss drug.

Fueling The ‘Love Affair’

Eli Lilly’s revenue skyrocketed 56% year-over-year to $19.8 billion during its first-quarter 2026, driven primarily by the astronomical volume demand for its metabolic and weight-management medications.

Following the earnings release, Gary Black, Managing Partner of The Future Fund, noted on X that Eli Lilly continues to heavily capitalize on consumers’ ongoing “love affair” with GLP-1 drugs.

The financial results reflect this devotion: worldwide revenue for the diabetes drug Mounjaro surged over 120% year-over-year to $8.7 billion, while the obesity treatment Zepbound brought in nearly $4.2 billion, an 80% year-over-year increase.

data-variant=”card”
data-news-mode=”manual”

>


Read Also:

Eli Lilly Raises 2026 Outlook On Strong Mounjaro And Zepbound Demand

This post was originally published here

Colgate-Palmolive Company (NYSE:CL) will release earnings for its first quarter before the opening bell on Friday, May 1.

Analysts expect the New York-based company to report quarterly earnings of 94 cents per share, up from 91 cents per share in the year-ago period. The consensus estimate for Colgate-Palmolive’s quarterly revenue is $5.22 billion (it reported $4.91 billion last year), according to Benzinga Pro.

On March 12, Colgate-Palmolive increased its quarterly cash dividend from 52 cents to 53 cents per share.

Colgate-Palmolive shares gained 1% to close at $85.36 on Thursday.

Benzinga readers can access the latest analyst ratings on the Analyst Stock Ratings page. Readers can sort by stock ticker, company name, analyst firm, rating change or other variables.

Let’s have a look at how Benzinga’s most-accurate analysts have rated the company

Full story available on Benzinga.com

This post was originally published here

The Nasdaq Composite Index capped a breakout April, logging its strongest monthly advance since the early-pandemic rally as a wave of strong earnings and renewed confidence in artificial intelligence lifted technology shares.

Big tech earnings were a major catalyst, with several names topping Wall Street’s expectations for sales and cloud momentum, according to a report by CNBC.

Nasdaq’s April Surge

The index rallied 15.3% in April, marking a sharp turnaround for the tech-heavy index, which had struggled earlier in 2026 amid concerns that rapid advances in AI could disrupt existing business models.

The latest surge pushed the Nasdaq index into positive territory, now up about 7% since the start of the year. The index had been down roughly 7% at the end of March before the rebound took hold.

Big Tech & Semiconductors Lead The Charge

Mega-cap technology companies and semiconductors were at the forefront of the rebound. Alphabet Inc. (NASDAQ:GOOGL) (NASDAQ:GOOG) popped 10% after its report and ended April up 34%, marking its best month since October 2004. Amazon.com Inc. (NASDAQ:AMZN) added 27% in April, while Microsoft Corp. (NASDAQ:MSFT) was also cited among the large cloud players that exceeded expectations.

Meta Platforms Inc. (NASDAQ:META) slid 9% Thursday after announcing increased capital expenditures, but still ended April up nearly 7%.

Intel Corp.

Full story available on Benzinga.com

This post was originally published here

Cue Biopharma Inc. (NASDAQ:CUE) shares surged 67.57% overnight to $24.70 on Thursday after the company simultaneously announced a $30 million private investment in public equity financing, an exclusive Phase 2 anti-IgE antibody license and a CEO appointment.

$30 Million Raise Funds Pipeline Expansion

The PIPE, expected to close around May 4, involves pre-funded warrants for up to 2.72 million shares at an effective price of $11. Net proceeds will be used to support the acquisition and development of Ascendant-221, a humanized anti-IgE monoclonal antibody designed to neutralize free IgE and reduce the production of new IgE, targeting major pathways involved in allergic disease.

The funds will also be allocated toward general corporate purposes and working capital needs.

Phase 2 Anti-IgE Asset

Separately, CUE licensed Ascendant-221 …

Full story available on Benzinga.com

This post was originally published here

Amazon.com Inc. (NASDAQ:AMZN) made up over 50% of Rivian Automotive Inc.‘s (NASDAQ:RIVN) revenue in the first quarter of 2026, according to earnings data shared on Thursday.

Very Proud Of Our Relationship, Says RJ Scaringe

During the earnings call, Rivian CEO RJ Scaringe was asked to comment on interest from non-Amazon customers for Rivian’s commercial vehicles. “Our relationship with Amazon continues to be something that we are very proud of,” Scaringe said, sharing that vans would continue to ramp up with the e-commerce company.

data-variant=”card”
data-news-mode=”manual”

>


Read Also:

Ross Gerber Thinks Elon Musk’s SpaceX, Tesla Could Create ‘Berkshire Hathaway Of AI’

This post was originally published here

Exxon Mobil Corporation (NYSE:XOM) will release earnings for its first quarter before the opening bell on Friday, May 1.

Analysts expect the Spring, Texas-based company to report quarterly earnings of $1.01 per share. That’s down from $1.76 per share in the year-ago period. The consensus estimate for Exxon Mobil’s quarterly revenue is $85.29 billion (it reported $83.13 billion last year), according to Benzinga Pro.

The oil and gas behemoth recently said in an exchange filing that it expects Middle East disruptions to reduce first-quarter upstream earnings by $300 million to $500 million.

Shares of Exxon Mobil fell 0.2% to close at $154.33 on Thursday.

Benzinga readers can access the latest analyst ratings on the Analyst Stock Ratings page. Readers can sort by stock ticker, company name, analyst firm, rating change or other variables.

Let’s have a look …

Full story available on Benzinga.com

This post was originally published here

With U.S. stock futures trading higher this morning on Friday, some of the stocks that may grab investor focus today are as follows:

  • Wall Street expects Exxon Mobil Corp. (NYSE:XOM) to report quarterly earnings at $1.15 per share on revenue of $82.18 billion before the opening bell, according to data from Benzinga Pro. Exxon Mobil shares rose 0.6% to $155.25 in after-hours trading.
  • Apple Inc. (NASDAQ:AAPL) posted better-than-expected results for its second quarter and issued strong June-quarter guidance. The company reported revenue of $111.18 billion, up 17% year over year and above analyst estimates of …

Full story available on Benzinga.com

This post was originally published here

Beyond Meat Inc. (NASDAQ:BYND) shares are trending on Thursday night.

BYND shares jumped 2.63% to $1.01 in overnight trading on Thursday.

The surge in the late trading session follows an intraday rally of 20.70%, which closed the plant-based protein company’s stock at $0.98, according to Benzinga Pro data.

Earnings Catalyst On The Horizon

On Wednesday, Beyond Meat announced it will release its first-quarter 2026 financial results for the quarter ended Mar. 28 after market close on May 6. Analysts estimate a first-quarter loss of 11 cents per share, with revenue of $58.01 million.

The upcoming quarterly data follows a difficult fourth quarter of 2025, reported in March, when BYND missed analysts’ EPS estimates by 163.64%, posting a loss of 29 cents per share versus a consensus estimate of an 11-cent loss.

Full story available on Benzinga.com

This post was originally published here

Meta Platforms Inc. (NASDAQ:META) CEO Mark Zuckerberg told employees on Thursday that the company’s aggressive artificial intelligence spending is directly contributing to planned layoffs.

Meta’s AI Investment Reshapes Workforce Priorities

During a company town hall, Zuckerberg said Meta’s expanding AI infrastructure budget is forcing difficult financial trade-offs between funding advanced compute systems and maintaining headcount, Reuters reported.

Zuckerberg explained that Meta’s two primary expenses are infrastructure and personnel and increasing spending in one area means reducing available resources in another.

As the company accelerates investments in AI, he said it needs to “take down” workforce size to balance those costs.

Meta is expected to cut roughly 10% of its workforce beginning May 20, with additional layoffs reportedly coming later this year.

data-variant=”card”
data-news-mode=”manual”

>


Read Also:

Meta’s Drop Is Historic: Is The Buy Opportunity Even Bigger?

This post was originally published here

SmartWealth Asset Management CEO Miro Mitev stated that recent volatility in the private markets space has once again exposed a fundamental weakness in human decision-making.

“What we have learned again in recent months is that humans do not manage risk particularly well at pace,” Mitev said, pointing to mounting liquidity pressures in private equity markets.

“Markets move quickly, but human behaviour often swings between panic and delay, particularly during periods of geopolitical stress, such as the recent tensions surrounding Iran and renewed concerns over global supply chains,” Mitev added.

SmartWealth, which specializes in both liquid securities (equities, bones, currencies, crypto-assets, ETFs) and non-liquid private assets (private equity, real estate, art collections and other luxury goods) has been leaning into artificial intelligence to counter those behavioral shortcomings. According to Mitev, the firm’s AI-driven strategy has recently outperformed its benchmark relative to peers.

“Our AI model remained objective throughout the …

Full story available on Benzinga.com

This post was originally published here

Dolby Laboratories (NYSE:DLB) reported second-quarter financial results on Thursday. The transcript from the company’s second-quarter earnings call has been provided below.

This transcript is brought to you by Benzinga APIs. For real-time access to our entire catalog, please visit https://www.benzinga.com/apis/ for a consultation.

The full earnings call is available at https://events.q4inc.com/analyst/949487944?pwd=KtjHn6mz

Summary

Dolby Laboratories Inc reported Q2 fiscal 2026 revenue of $396 million and non-GAAP EPS of $1.37, both within prior guidance.

The company is maintaining full-year guidance with expected revenue between $1.4 billion and $1.45 billion, and non-GAAP EPS between $4.30 and $4.45.

Strategic initiatives include expanding Dolby Vision and Dolby Atmos across media platforms and automotive markets, with significant adoption by companies like Meta and BMW.

Notable operational highlights include Dolby’s strong presence in high-profile events like the Super Bowl and the Winter Olympics, and expanding into mass market TVs with partners like Hisense and TCL.

Management emphasized the growth of consumption-based revenue streams, targeting 10% of revenue in three years, and highlighted the potential of Dolby Optiview in live sports streaming.

The company generated a $93 million operating cash flow, repurchased $65 million in stock, and declared a 36-cent dividend, reflecting a 9% increase from the previous year.

Full Transcript

OPERATOR

Ladies and Gentlemen, thank you for standing by. Welcome to the Dolby Laboratories conference call discussing second quarter fiscal year 2026 results. During the presentation, all participants will be in a listen-only mode. Afterwards, you will be invited to participate in a question and answer session. If you would like to ask a question, please press Star one to raise your hand. To withdraw your question, press Star one again. As a reminder, this call is being recorded. I would now like to turn the conference over to Mr. Peter Goldmacher, Vice President of Investor Relations. Peter, please go ahead.

Peter Goldmacher (Vice President of Investor Relations)

Good afternoon. Welcome to Dolby Laboratory’s second quarter fiscal year 2026 earnings conference call. Joining me today are Kevin Yaman, Dolby Laboratory CEO, and Robert park, our cfo. As a reminder, today’s discussion will include forward looking statements including our fiscal 2026, third quarter and full year outlook and our assumptions underlying that outlook. These statements are subject to risks and uncertainties that may cause actual results to differ materially from the statements made today, including, among other things, the impact of macroeconomic events, supply chain issues, inflation rates, changes in consumer spending and geopolitical instability on our business. A discussion of these and additional risks and uncertainties can be found in the earnings press release that we issued today under the section captioned Forward looking Statements as well as in the Risk Factors section of our most recent annual report on Form 10-K. Dolby assumes no obligation and does not intend to update any forward looking statements made during this call as a result of new information or future events. During today’s call we will discuss non-GAAP financial measures. A reconciliation between GAAP and non-GAAP financial measures is available in our earnings press release and in the Interactive Analyst center on the Investor Relations section of our website. With that, I’d like to turn the call over to Kevin.

Kevin Yaman (Chief Executive Officer)

Thanks Peter, and thanks to everyone joining us on the call today. Revenue and non GAAP earnings for the quarter came in consistent with the expectations we provided on the call last quarter and we are maintaining our full year guidance. Robert will share more details on the financials in a few minutes. Dolby occupies a unique position across the creator content platform device ecosystem. We continue to strengthen our position creating growth opportunities across existing and new business areas. Over the last few quarters we have made great progress bringing more Dolby content to more content platforms. Top tier social media companies are increasingly recognizing the value of streaming content in Dolby Vision™. Meta has adopted Dolby Vision™ for content streamed on iOS for both Instagram and Facebook and Douyin in China has enabled Dolby Vision™ for content on both iOS and Android in music. Over 90% of the artists featured on Billboard’s year end top 100 artists for the last three years are creating music in Dolby Atmos®. At the Grammys. Dolby Atmos® was well represented in all major categories including all nominees for Best New Artist in Sports. More and more content is available in Dolby. Just this quarter the super bowl and the Winter Olympics were available in Dolby Vision™ and Dolby Atmos®. The T20 Cricket World cup in India and the 2026 Formula One season streaming on Apple are available in Dolby Vision™. HBO Max is streaming a wide variety of sports content in Dolby Atmos® and Dolby Vision™ and while not exactly sports, they also stream NASA’s Artemis 2 mission in Dolby Vision™ and Peacock is also streaming sports in Dolby Atmos® with plans to begin streaming in Dolby Vision™. We also continue to expand further into mass market tv. Amazon recently announced that it has added support for Dolby Vision™ to its ad supported tier and Azteca TV TV, the second largest mass media company in Mexico, announced that it will bring Dolby Atmos® to free to air, broadcast and finally in the cinema. All of the top 30 grossing films domestically for calendar 2025 were in Dolby Atmos® and Dolby Vision™ and all major category winners at the Academy Awards in March and the baftas in February were in Dolby Atmos® and Dolby Vision™, including Formula 1, the movie Sinners and One Battle After Another (fictional titles, assuming they are correct). All of this is simply to say high quality content matters and more content in Dolby means more reasons to adopt Dolby Atmos® and Dolby Vision™ across end markets and devices. And it was another big quarter for automotive. At the Beijing Auto show last week, BMW announced Dolby Atmos® support in the 7 Series globally and the iX3 in China. Just two weeks before that, at the Paris Auto Show, BYD launched its Denzel line with Dolby Atmos®, BYD’s first car with Dolby Atmos® in the European market. Also this quarter, Lexus announced their first Dolby Atmos® enabled cars and Nio expanded its Dolby Atmos® adoption to the Firefly, a compact EV sub brand for Singapore and Thailand. There is a broader shift across the automotive industry where the vehicle is now a place for high quality entertainment and we continue to benefit from this trend. Turning to mobile the progress we are making in music and with social media platforms continues to strengthen our value proposition across mobile devices. Dolby Vision™ Capture and Playback and Dolby Atmos® are included across Apple’s lineup including the 17e, their latest iPhone. Starting at $599 that was launched this quarter. Xiaomi announced its flagship Redmi Note 15 Pro series with Dolby Vision™, Dolby Vision™ Capture and Dolby Atmos®. Vivo released the X300 Ultra with Dolby Vision™ as well as their iQoo 1500 Ultra, a gaming focused sub brand that has both Dolby Atmos® and Dolby Vision™. We continue to perform well in high end phones and we’re excited that daoyin is now fully supporting Dolby Vision™ on Android which should help us continue to work our way further into mid range Android phones. Moving on to the Living Room As I mentioned earlier, our momentum in sports content is an important driver for new TV sales. In addition, we’re excited about the First Dolby Vision™ 2 TVs coming to market by the end of this fiscal year. Hisense, TCL and Philips have announced plans …

Full story available on Benzinga.com

This post was originally published here

Rimini Street (NASDAQ:RMNI) held its first-quarter earnings conference call on Thursday. Below is the complete transcript from the call.

This content is powered by Benzinga APIs. For comprehensive financial data and transcripts, visit https://www.benzinga.com/apis/.

Access the full call at https://app.webinar.net/wzEqdoVDKJY

Summary

Rimini Street Inc reported a Q1 2026 revenue of $105.5 million, a 1.2% increase year-over-year, with a 5.2% increase excluding PeopleSoft products.

The company closed 11 new client transactions with over $1 million in TCV, totaling $33 million, significantly higher than the previous year’s $5.6 million.

Rimini Street Inc is investing in its agentic AI ERP solutions and expanding its sales team, which has grown to over 80 sellers.

The company has a positive outlook with a revenue growth guidance of 4-6% for 2026 and adjusted EBITDA margins in the 12.5-15.5% range.

CEO Seth Raven highlighted a shift towards longer-term contracts and a strategic focus on helping clients modernize existing systems with AI solutions, avoiding vendor upgrades.

Net income for the first quarter was $1.4 million, with adjusted EBITDA at $8.9 million, reflecting a decrease from the prior year due to increased investments.

The company reported a strong cash position with $132.2 million as of March 31, 2026, and made a $10 million voluntary debt prepayment.

Rimini Street Inc continues to wind down its support for Oracle’s PeopleSoft software, with related revenue decreasing from 8% to 3% of total revenue.

Full Transcript

OPERATOR

Good afternoon ladies and gentlemen and welcome to the Rimini Street Q1 2026 earnings conference call. At this time, all lines are in a listen only mode. Following the presentation, we will conduct a question and answer session. If at any time during this call you require immediate assistance, please press star zero for the operator. This call is being recorded on Thursday, April 30, 2026. I will now turn the call over to Dean Paul, Vice President, Treasurer, and Head of Investor Relations. Please go ahead.

Dean Paul (Vice President, Treasurer and Head of Investor Relations)

Thank you operator. I’d like to welcome everyone to Rimini Street’s fiscal first quarter 2026 earnings conference call. On the call with me today is Seth Ravin, our CEO and President and Michael Perica, our CFO. Today we issued our earnings press release for the first quarter ending March 31, 2026, copy of which can be found on our website under the Investor Relations section. A reconciliation of GAAP to non GAAP financial measures has been provided in the tables following the financial statements in the press release. An explanation of these measures and why we believe they are meaningful is also included in the press release and our website under the heading about non GAAP Financial Measures and certain Key Metrics. As a reminder, today’s discussion will include forward looking statements about our operations that reflect our current outlook. These forward looking statements are subject to risks and uncertainties that may cause results to differ materially from statements made today. We encourage you to review our most recent SEC filings, including our Form 10Q filed today for a discussion of risks that may affect our future results or stock price. Now, before taking questions, we will begin with prepared remarks. With that, I’d like to turn the call over to Seth.

Seth Ravin

Thank you Dean and thank you everyone for joining us. First Quarter Results Our first quarter results reflect continued growth and accelerating momentum. A growing number of organizations are leveraging Rimini support and our proven Rimini smart path to execute their global ERP and operational transaction processes Faster, better and cheaper with more agility and speed to value all within existing budgets. Rimini street can help just about any organization lower its total operating costs and improve competitive advantage or improve return for government constituents. Using technology we delivered strong growth in adjusted calculated billings and adjusted ARR and expanded remaining performance obligations year over year adjusted for the Oracle PeopleSoft support and services wind down and which includes new logo and renewal subscription sales. We also continued to make additional strategic investments in our next generation. our Rimini Agentic AI ERP solutions that can be quickly deployed over existing ERP software without the cost or risk of unnecessary upgrades, migrations or replatforming during the quarter, we closed 11 new client transactions with a total contract value (TCV) of over $1 million and totaling $33 million, compared to five transactions totaling $5.6 million during the same period. We added 50 new logos that included household, global and regional Brand wins. The combined strength of the second half of 2025 and first quarter 2026 results give us continued confidence in delivering growth in fiscal 2026, positioning the company for increased growth and profitability. We are continuing our evolution beyond our position as the premier third party enterprise software support provider to a leader in also helping clients modernize their existing business transaction systems in the AI era. We are now the software support and agentic AI ERP company Today, more than 1900 Rimini street employees in 22 countries, helping organizations avoid unnecessary, costly and risky ERP and other enterprise software upgrades, migrations and replatformings that often deliver low ROI and offer little competitive advantage. Instead, organizations can invest in modernization of their existing systems, leveraging Next Generation Rimini AgentIQ AI ERP Solutions and that can be quickly and economically deployed over their current ERP and other enterprise software and deliver real competitive advantage. We believe we can help organizations achieve significant IT operating cost savings, improve profitability, enhance competitive advantage and accelerate growth. Our clients have already realized over $10 billion in operational savings. Rimini street leads in the Gentiq AI erp. We are helping clients set a new vision, technical and functional path forward from their current vendor ERP software release. A path does not require any return to the vendor for a future upgrade or migration to their current ERP software release in order to achieve innovation and modernization. The client can innovate and modernize their existing ERP software and other enterprise software using agentic AI ERP solutions deployed easily economically right over the top of their existing software releases. The Rimini Smart Path is our proprietary, proven three-step methodology that clients can use to self fund and accelerate innovation, especially AI and automation without undergoing costly, risky or unnecessary ERP upgrades or rip and replace migrations by leveraging and modernizing existing IT environments, all without operational disruption.

Seth Ravin

Rimini AgentIQ UX is our AI driven experience and automation layer that is deployed right over existing client ERP software and turns their ERP software from a static system of record into an autonomous system of action, delivering innovation and modernization in weeks, not years and at a fraction of the cost of a major upgrade, migration or replatforming project. Client Success Stories Rimini street is helping clients across many industries, geographies and software protect and optimize their core ERP systems while funding innovation and modernization, including fixing broken processes, automating workflows and functions, and using AI to solve

Seth Ravin

specific business challenges without disruptive, costly or risky ERP software upgrade, migrations or replatforming. Here are a few examples of how Rimini street solutions for SAP, Oracle and VMware software enabling innovation, transforming and improved competitive advantage for clients Cubic Corporation, a US Defense and transportation technology company, said that partnering with Rimini street allowed them to gain full control of their SAP roadmap, avoid a costly S4 HANA upgrade and reallocate savings in internal capacity towards automation, AI and broader modernization initiatives.

Seth Ravin

Flexitec, a French automotive products company, said that they chose Rimini Support to help reduce risk and operational disruption in its SAP environment, strengthening cybersecurity posture and accelerating compliance readiness while enabling the reallocation of savings towards R and D and modernization programs. Clean Era, a South Korean paper and hygiene products company, said they were able to cut SAP and Oracle vendor maintenance costs by approximately 50% with Rimini street stabilizing their core ERP environment and freeing budget and talent to accelerate AI analytics, filed expansion and IOT driven operational improvements. Elmort, a Brazilian industrial company, said that unifying support across VMware and SAP with Rimini street created the opportunity to increase operational stability and security while redirecting budget internal resources from maintenance to sustainability and growth initiatives, Partners, Alliances and Channels we continued strengthening and maturing our indirect sales ecosystem including adding new partner managers for strategic technology services and channel relationships.

Seth Ravin

During the quarter we closed accretive sales transactions globally that we do not believe we would have otherwise closed without partners. These partnerships extend our reach, bring complementary expertise and help clients execute modernization strategies that combine Rimini street support with world class platforms, cloud services and AI tooling. The ecosystem is becoming a strategic multiplier for us, accelerating adoption, expanding influence and enabling shared go to market opportunities. Summary we are focused on accelerating growth, improving profitability and delivering shareholder return. We plan to leverage Rimini Street’s proprietary, unique and proven smart path methodology, service portfolio and capabilities to help a growing list of clients take back control of their technology roadmap and spending and successfully navigate business and technical complexity in the age of AI. Now over to you Michael.

Michael Perica

Thank you Seth and thank you for joining us everyone. Q1 results Our first quarter results reflect solid execution and continued signs of momentum highlighted by remaining performance obligations, RPO and billings growth along with a return to top line growth. Despite the headwinds from the wind down of support and services for Oracle’s PeopleSoft software, our strong operating cash flow and cash position enabled us to comfortably make $10 million of additional voluntary principal prepayments that reduced our debt balance to $58.4 million and increased our net cash position to $73.8 million at the end of the …

Full story available on Benzinga.com

This post was originally published here

Columbia Sportswear (NASDAQ:COLM) reported first-quarter financial results on Thursday. The transcript from the company’s first-quarter earnings call has been provided below.

Benzinga APIs provide real-time access to earnings call transcripts and financial data. Visit https://www.benzinga.com/apis/ to learn more.

The full earnings call is available at https://investor.columbia.com/news-events/ir-calendar/detail/5842/columbia-sportswear-1st-quarter-2026-earnings-release

Summary

Columbia Sportswear Co reported first-quarter net sales of $779 million, roughly flat year-over-year, with international business growing 16% and US sales declining by 10%.

The company highlighted the success of its Accelerate Growth strategy, leading to increased fall 2026 orders and strong international performance, particularly in Europe and EMEA distributor markets.

Gross margin contracted by 20 basis points to 50.7%, influenced by a 310 basis point impact from unmitigated tariffs, although there were some price increases to offset this.

The company’s marketing efforts, including partnerships and campaigns, have been focused on engaging younger consumers, with notable success in social media reach.

Columbia Sportswear Co maintained its full-year outlook for net sales growth of 1-3% and revised its gross margin guidance to 50.3-50.5%, expecting operating margin to be between 6.7% and 7.5%.

Full Transcript

OPERATOR

Greetings. Welcome to The Columbia Sportswear First Quarter 2026 Financial Results Conference call. At this time, all participants are in a listen only mode. A question and answer session will follow the formal presentation. If anyone should require operator assistance during the conference, please press Star0 on your telephone keypad. Please note this conference is being recorded. I will now turn the conference over to your host, Matt Tucker. You may begin.

Matt Tucker (Moderator)

Good afternoon and thanks for joining us to discuss Columbia Sportswear Company’s first quarter results. In addition to the earnings release, we furnished an 8-K containing a detailed CFO commentary and financial review presentation explaining our results. This document is also available on our investor relations website, investor.columbia.com with me today on the call are Chairman and Chief Executive Officer Tim Boyle, Co Presidents Joe Boyle and Peter Bragdon, Executive Vice President and Chief Financial Officer Jim Swanson and Executive Vice President, Chief Administrative Officer and General Counsel Rochelle Luther. This conference call will contain forward looking statements regarding Columbia’s expectations, anticipations or beliefs about the future. These statements are expressed in good faith and are believed to have reasonable basis. However, each forward looking statement is subject to many risks and uncertainties and actual results may differ materially from what is projected. Many of these risks and uncertainties are described in Columbia’s SEC filings. We caution the forward looking statements are inherently less reliable than historical information. We do not undertake any duty to update any of the forward looking statements after the date of this conference call to conform the forward looking statements to actual results or to changes in our expectations. I’d also like to point out that during the call we may reference certain non GAAP financial measures including constant currency net sales. For further information about non GAAP financial measures and results, including a reconciliation of GAAP to non GAAP measures and an explanation of management’s rationale for referencing these non GAAP measures, please refer to the Supplemental Financial Information section and financial tables included in our earnings release and the appendix of our CFO commentary and financial review. Following our prepared remarks, we will host a Q and A period during which we will limit each caller to two questions so we can get to everyone by the end of the hour. Now I’ll turn the call over to Tim.

Tim Boyle (Chairman and Chief Executive Officer)

Thanks Matt and good afternoon. In the first quarter we’re pleased to have again delivered net sales and profitability exceeding our quarterly guidance driven by early spring 202026 wholesale shipments and better than expected demand in Europe and the US as well as disciplined expense management. Our international business, which represents over 40% of our sales, continues to lead our growth up 16% year over year, while our U.S. business remained challenged this quarter and declined 10%. The decrease was largely anticipated based on a decline in our advanced spring 2026 wholesale orders. This also reflected our decision last year to reduce the supply of certain winter products as a precautionary measure in response to US Tariff announcements. Cleaner inventories also drove less clearance sales. That said, I’m encouraged by signs of growing momentum in the U.S. including an increased fall 2026 order book, which we expect to enable the wholesale business to return to growth in the second half. It’s increasingly clear to me that the Columbia accelerate growth strategy is resonating with consumers. A major highlight for the Columbia brand in Q1 was the Winter Olympics, where the US curling team thrilled fans at home and around the world, capturing a historic silver medal in mixed doubles, all while competing in distinctive and iconic Columbia kits. This generated billions of views around the world for one of the most watched Olympic events, along with more than 25 million views of Columbia’s US curling jerseys on social media. Additionally, longtime Columbia and Team USA freestyle skiing athlete Alex Ferreira reached the pinnacle of his sport, claiming the gold medal in the men’s halfpipe. Alex’s performance and victory further demonstrate that Columbia’s products meet the highest standards of elite winter athletes, and he has continued to inspire fans and drive energy for the Columbia brand since returning home. He’s been celebrating at events such as the recent US Ski and Snowboard Nationals in Aspen, Colorado. The Columbia brand also garnered outsized attention at another sporting event of major importance in Q1, crashing the tailgate party at the Big Game in Santa Clara with Nature Calls, the only beer that uses bear scat in the brewing process. Columbia sent two bear ambassadors to the game and they made their presence known, appearing four times on the stadium’s Jumbotron and even making it on the live TV broadcast. This impact was enhanced by influencer partnerships with sports personalities around the event. Social media content from the game itself generated over 9 million views on social media alongside hundreds of news articles. We’re excited that the return to our irreverent roots also continues to see recognition from the media and outdoor community. The Engineered for Whatever campaign was recently awarded a Gold Clio Award, one of the most respected international awards in advertising, marketing and communication for the launch of our Expedition Impossible Challenge, the that we spoke to you about last quarter, which has generated over 10 million organic views on social media. Congrats to the team and stay tuned for more exciting things ahead. Our engineering excellence was also reinforced in Q1 with several product awards from multiple media outlets among many examples, a highlight included our women’s Arcadia 2 jacket and our men’s watertight 2 jacket, both being featured in the New York Times Wirecutter Guide for Best Everyday Rain Jackets, a testament to the durability, performance and value we build into every design. Our newer product collections and marketing activations launched under the Accelerate Growth strategy and engineered for Whatever campaign, are increasingly resonating with consumers. This is evidenced by improvements in organic search interest, direct site traffic and customer acquisition rate for the first quarter. Another first quarter highlight for the Columbia brand is the momentum we see building in PFG performance fishing gear. As a reminder, we have a long and deep heritage with PFG as pioneers of the fishing, apparel and footwear category. As a brand known for high performance, authenticity and fun, PFG is inspiring the next generation of anglers, supported by investments in sales and marketing, including an always on social media strategy, a refreshing ground game and the addition of new fishing athletes and ambassadors to the PFG roster. A key product highlight in the quarter was the Bahama Shirt, long known for keeping anglers cool and comfortable and also widely known as the unofficial uniform of country music superstar Luke Combs. This year we’re celebrating the Bahamas 30th anniversary and expect sales of the Bahamas to grow by double digit percent for the spring 2026 season. The celebration will continue beyond Q1 with additional marketing investments and and collaborations with authentic artists and influencers to drive energy for this iconic style. Another PFG highlight on the footwear side is the Dry Tortuga Boot which saw sales more than triple in Q1. We believe it’s the most rugged, durable and comfortable fishing boot on the market and delivers attractive styling that’s a standout in the fishing category. Looking ahead, we’re excited about the potential for PFG to build on this recent momentum and take share in this growing market, particularly with younger consumers who are increasingly adopting the sport and lifestyle of fishing. Now I’ll provide an update on our fall 2026 order book, which is another indicator of the traction we’re gaining with our Accelerate strategy. Since our last update, the order book continued to trend positively, reinforcing our expectations for mid single digit percent wholesale growth globally in the second half. While the overall growth is encouraging, the dimensions of that growth provide further signals of progress under the Accelerate strategy. As a reminder, we launched Accelerate roughly two years ago and given product development timelines, we’re now increasingly seeing the new products created under this strategy hit the market, driving growth in the order book and representing an increasing share of Columbia brand Sales in addition to US growth in the fall 2026 order book, we’re excited to see double digit percent sales growth in Columbia’s women’s business and in footwear at a product level. On a global basis, we’re seeing outsized growth in our most premium and innovative products and platforms, including double digit percent growth or better in our Titanium product and our Omniheat Arctic technology, as well as meaningfully scaling of our new mtr fleece. Our two major product launches from fall 25, the Amaze and ROC lines will continue to scale with orders up more than double versus the prior year. We’re also thrilled to have a maze featured in triple the number of Dick’s sporting his location this fall as compared to last year Turning to the Current Operating Environment While we remain focused on execution and what we can control, the operating environment remains highly dynamic with major external events affecting our business and since we last spoke three months ago, particularly involving tariffs in the US and the conflict in the Middle East. First let me address the tariff situation. Following the US Supreme Court’s tariff ruling in late February, the US administration implemented a 10% universal tariff under Section 122, which is set to expire in July. Our prior full year Guide Year Outlook, which was issued prior to the Court’s ruling, included unmitigated incremental tariff impacts of approximately 300 basis points on our gross margin. We are now expecting a slight improvement based on the 10% universal tariffs extending through July and the assumption that the US Administration will implement new tariffs at or near IPA tariff rates following the expiration of the section 122 rates. We now expect an approximate 200 basis point unmitigated headwind from tariffs to our full year gross margin outlook. As a reminder, we made the decision last year to absorb nearly all of the fall 25 impact of incremental tariffs and not raise prices. The Court’s ruling also required the refund that is the tariffs already paid. As of the date they were terminated, we had paid a total of approximately $80 million in IEEPA tariffs, approximately 55 million of which has been recognized through cost of sales, with the remainder residing in inventory on our balance sheet as of the end of the first quarter. We have already taken action by submitting our refund claims, and we fully intend to pursue every avenue available to secure the refunds that we are owed. We have not yet recognized any benefit of refunds in our financial statements, nor have we updated our financial outlook for such refunds. Turning now to the ongoing conflict of the Middle east which broke out in late February. First, my thoughts go out to any of our customers, employees, business partners and their loved ones who may be directly impacted by this conflict. Their safety and security is always our first and primary concern. As far as our business is concerned, this conflict has already triggered order cancellations and forecasted order reductions for certain Middle east distributor markets. While these impacts have not meaningfully changed our full year financial outlook to date, the prolonged nature of the conflict poses further risks. Macroeconomic and supply chain risks are among the areas that could have a more profound effect. These risks, including the potential softening of consumer demand driven by the ongoing surge in energy prices and the resulting inflationary pressures on consumers wallets. Increased oil prices are expected to put pressure on our product input costs with the exposure beginning and in our spring 27 season. Further, the conflict’s impact on global supply chains could result in late arriving inventory, increased freight and logistics costs and potential order cancellations. Due to the high degree of uncertainty associated with the ongoing conflict and resulting impact on the global economy and supply chains, we are not able to incorporate these risks and into our updated 202026 financial outlook. Despite these external factors, I am confident in our ability to navigate these risks given our highly experienced leadership team, flexible and resilient global supply chain fortress balance sheet and high quality products that provide a strong value proposition to the consumer. Turning back to our first quarter financial performance, net sales were roughly flat year over year at 779 million reflecting a balanced performance across channels with both DTC and wholesale coming in flat to the prior year. Gross margin contracted 20 basis points to 50.7% driven by 310 basis points in incremental unmitigated tariff costs partly offset by mitigation actions including targeted price increases. SGA expenses increased nearly 1% reflecting higher DTC expenses, partially offset by lower enterprise technology and supply chain personnel expenses, reflecting cost reductions actions which were taken last year. This overall performance resulted in diluted earnings per share above our guidance range. Inventories remain healthy and are relatively flat versus the prior year in dollar terms, with units down approximately 11% year over year. We remain steadfast in our commitment to driving shareholder value returning meaningful cash to shareholders, including $150 million in share repurchases during the first quarter which resulted in the retirement of 2.5 million shares, an opportunistic acceleration of activity related relative to recent periods. We continue to maintain our fortress balance sheet, exiting the quarter with 535 million in cash and short term investments and no debt. Looking at net sales by geography. US net sales decreased 10% but performed better …

Full story available on Benzinga.com

This post was originally published here

Apple (NASDAQ:AAPL) released second-quarter financial results and hosted an earnings call on Thursday. Read the complete transcript below.

This content is powered by Benzinga APIs. For comprehensive financial data and transcripts, visit https://www.benzinga.com/apis/.

View the webcast at https://www.apple.com/investor/earnings-call/

Summary

Apple Inc reported $111.2 billion in revenue for the March quarter, a 17% increase year over year, with strong performance across all geographic segments.

The company announced a CEO transition, with John Ternus set to take over as CEO, and Tim Cook transitioning to the role of executive chairman.

Despite supply constraints, Apple Inc experienced double-digit growth across its product lines, particularly with the iPhone 17 family, and set March quarter records in revenue for iPhones, Macs, and services.

Apple Inc is making significant investments in AI and agentic tools, while maintaining a focus on privacy and integration of AI across their platforms.

The company continues to expand its environmental initiatives, aiming for 100% recycled materials in its products by 2025, and is bolstering its American manufacturing efforts.

Future guidance includes expected revenue growth of 14-17% for the June quarter, with continued supply constraints anticipated for certain Mac models.

Full Transcript

Tim

On our users’ lives and I can’t begin to express how grateful I am for our amazing teams. It’s because of them that there is no company like Apple and I truly believe there never will be. This moment for the transition is the right one for a number of reasons. First, our business has been performing extremely well. The first half of this year was very strong, growing double digits year over year. Second, our roadmap is incredible and most importantly, we have the right leader ready to step into the role. As I have said, there is no one on this planet I trust more to lead Apple Inc into the future than John Ternus. John is a brilliant engineer, a deep thinker, a person of remarkable character and a born leader. I know he will push us to go further than we think is possible in order to deliver the greatest products and services for our users. I have been so proud to call him a colleague and a friend and I will be even more proud to call him Apple’s CEO over the coming months. John and I will be working closely together to make sure this transition is perfectly smooth. I very much look forward to stepping into the role of executive chairman on September 1st. As I’ve told John, I will be here to support him in any way he needs and in any way I can. I am incredibly optimistic about Apple’s future and I know we have the right team in place to deliver on the promise of this company. I also want to take just a moment to share my profound gratitude for our shareholders, especially our long term shareholders, for believing in Apple Inc and for your support over the years. It means a great deal to all of us. With that, I’d like to bring John on the call for a moment to say a few words.

John

John, thanks Tim and thanks to everyone on the call. In my view, Tim is one of the greatest business leaders of all time. Stepping into the role of CEO is an incredible honor and it means a great deal to me to have Tim’s trust and confidence. I want to echo Tim’s sentiment about our shareholders, especially those who have been with us for many years. Thank you so much for your confidence in our company. As you know, one of the hallmarks of Tim’s tenure has been a deep thoughtfulness, deliberateness and discipline when it comes to the financial decision making of the company. And I want you to know that is something Kevin and I intend to continue when I transition into the role in September. This is an especially exciting moment for Apple. As Tim mentioned, we have an incredible roadmap ahead and while you’re not going to get me to talk about the details details of that roadmap. Suffice it to say this is the most exciting time in my 25 year career at Apple and to be building products and services. There are so many opportunities before us and I couldn’t be more optimistic about what’s to come. For now, let me simply say I am deeply grateful to Tim, to the executive team and to everyone at Apple and I look forward to all of the important work ahead. And with that, let me turn it back over to Tim.

Tim

Thanks, John. Now let me turn to the quarter. Today, Apple is proud to report 111.2 billion in revenue, up 17% from a year ago, and a March quarter record which was above the high end of our guidance range. Despite supply constraints, Customer enthusiasm for iPhone has been extraordinary with revenue growing 22% year over year to achieve a March quarter record, services reached an all time revenue record growing 16% from a year ago, while EPS set a March quarter record of $2.01, up 22% year over year. We set March quarter revenue records and grew double digits in every geographic segment, including strong double digit growth in Greater China and the rest of Asia Pacific. We also achieved March quarter revenue records in both developed and emerging markets, and saw double digit growth in nearly every emerging market we track, including India. We recently marked Apple’s 50th anniversary with celebrations in our retail stores and with users around the world. It was a special moment for us to reflect on the incredible journey we’ve shared with our users, to thank everyone who’s been a part of it, and to look forward to writing the next chapter in our story of innovation. We have always believed that people who think different can change the world and we have been proud to build tools and technologies that allow them to do just that. In March, we put an amazing showcase of human creativity and ingenuity in action with Updates across iPhone, iPad and Mac. Through an unforgettable week of innovation, we also unveiled MacBook Neo, giving us an opportunity to bring the power of Mac to more people than ever before. I’ll have more to say on that and all the incredible things we delivered for our customers over the last few months. Now let’s take a closer look at results from across our product line, beginning with iPhone. As I mentioned earlier, iPhone had an excellent quarter with $57 billion in revenue. A March quarter record despite supply constraints during the quarter, we welcomed iPhone 17e, the newest addition to what is already the strongest iPhone lineup we’ve ever had. It brings outstanding performance and core iPhone experiences at a remarkable value for everyone from enterprise teams to consumers across the lineup. This is the most powerful, capable and versatile iPhone family we’ve ever created. That starts with the latest in Apple silicon for iPhone A19 and A19 Pro, which include neural accelerators in the GPU to deliver a huge boost to AI performance. With incredible performance and battery life and deep integration of Apple Intelligence, iPhone continues to set the standard for what a smartphone can be. Customers are capturing stunning photos and videos with our most advanced camera System ever on iPhone 17 Pro and Pro Max, including an 8x optical quality zoom and the all new Center Stage front camera, unlocking entirely new ways to frame, create and share their moments. In fact, during their recent mission, Artemis 2 astronauts captured some truly otherworldly images of earth and space in using iPhone 17 Pro Max. Meanwhile, iPhone Air users are tapping into the pro level performance in our slimmest iPhone ever. And with iPhone 17 we’re seeing a strong response not only from customers upgrading from previous generations, but also from people choosing iPhone for the very first time. We’ve been enormously pleased with how the entire lineup has been received. In fact, the iPhone 17 family is now the most popular lineup in our history. When looking at the launch through the March quarter and according to idc, we gained market share during the quarter. Mac revenue was $8.4 billion for the March quarter, up 6% from a year ago. Despite supply constraints driven by higher than expected levels of demand, we’re delighted with the reception of what is the most advanced Mac lineup in our history. We set March quarter records for upgraders and customers new to Mac, and according to idc, we gained market share in the quarter. From Mac mini to MacBook Pro and everything in between, Mac is the best platform for AI, with Apple Silicon delivering exceptional performance and industry leading efficiency and the ability to run advanced models locally in ways that simply weren’t possible before. It’s so exciting to see how strongly users are embracing Mac for these capabilities. There’s tremendous enthusiasm for MacBook Neo, which made its debut during the March quarter, opening up an entirely new way to experience Mac at a breakthrough price. We’ve also further improved MacBook Air, already the world’s most popular laptop, with M5 making everyday tasks faster and more responsive than ever. MacBook Pro reaches new heights with M5 Pro and M5 Max, delivering extraordinary performance and dramatically advancing what users can do with AI on a portable system and for desktop users. Studio Display pairs beautifully with Mac, while the all new Studio Display XDR takes things even further, bringing unmatched image quality and an extraordinarily immersive experience to pro workflows. Turning to iPad revenue was $6.9 billion, up 8% from a year ago. IPad continues to be a great choice for students, small business owners, artists and so many others because it empowers entirely new ways to work, learn, create and connect. It’s not just about mobility, it’s about versatility, delivering a uniquely flexible experience that adapts to whatever users want to accomplish. Today, our iPad lineup is stronger than ever, led by the arrival of the M4 powered iPad Air with a remarkable leap in performance. It raises the bar for what users can do on iPad, from advanced creative workflows to powerful productivity and immersive learning. And with the addition of our latest Apple Silicon along with the N1 wireless networking chip and C1X modem, users can stay seamlessly connected with wherever they are across wearables, home and accessories. Revenue for the March quarter came in at $7.9 billion, up 5% from a year ago. Apple Watch Ultra 3, Apple Watch Series 11 and Apple Watch SE continue to play an essential role in users lives, going far beyond fitness tracking to deliver meaningful insights and support for their health and well being. From helping users stay active and reach their fitness goals to delivering powerful science backed health insights that can prompt meaningful conversations with care providers, Apple Watch is with them every step of the way. It’s tremendously meaningful to see how Apple Watch continues to empower users to better understand their health, make more informed decisions and in many cases change and even save lives. During the quarter, we introduced customers to a new level of audio experience with AirPods Max 2, delivering stunning sound quality and our most advanced active noise cancellation yet. At the same time, AirPods Pro 3 combine an incredibly immersive listening experience with intelligent features that adapt to how users move, train and live. And whether it’s a call across town or a conversation across continents, AirPods make it effortless to stay connected. AirPods can bridge languages too, thanks to Live Translation Powered by Apple Intelligence in addition to Live Translation, Apple Intelligence brings together dozens of powerful capabilities, from visual intelligence to cleanup in photos and that are seamlessly integrated into the moments that matter most to our users every day. And we look forward to bringing a more personalized Siri to users coming this year. What truly sets Apple apart is how Apple Intelligence is woven into the core of our platforms. Powered by Apple Silicon and designed from the ground up to deliver intelligence that is fast, personal and private. This is not AI as a standalone feature, but AI as an essential intuitive part of the experience across our devices. It builds on years of innovation from the neural engine to advanced on device processing, enabling capabilities that are not only incredibly powerful, but also respectful of user privacy. Increasingly, that same foundation is drawing developers and researchers to our products as powerful platforms for building and running agentic AI, thanks to the unique combination of performance, efficiency and on device capabilities. When you combine this level of integration with our relentless focus on the customer experience, it becomes clear why Apple platforms are the best place to experience AI. Now let’s turn to services, which set an all time revenue record with $31 billion. We saw double digit growth in both developed and emerging markets and set new all time revenue records across most of the services categories. There’s no better place to find celebrated storytellers than Apple tv. Audiences are applauding the return of shows like your Friends and neighbors shrinking and for all mankind while discovering new favorites like Widow’s Bay. Apple TV has also earned its place among the most decorated names in entertainment, with more than 800 wins and more than 3,400 nominations in the six years since launch. This is a great time for sports fans on Apple TV too. Formula one season kicked off in March and Apple TV subscribers in the US have one of the best views of the track. The new MLS season is also well underway and subscribers in more than 100 countries and regions can watch every match with no blackouts. And Friday Night Baseball returned for its fifth year on Apple TV with a full season of marquee matchups. In retail, we had a March quarter revenue record and saw very high levels of store traffic throughout the quarter. From New York to Chengdu to Paris, it was wonderful to see stores around the world at the center of Apple’s 50th anniversary celebrations. We were also thrilled to open the doors to our sixth store in India. It has been wonderful to see how we’ve continued to grow in India in recent years, part of our larger efforts to connect with even more customers in emerging markets all over the world. At Apple, we believe powerful innovation and uncompromising quality can go hand in hand with sustainability. Over the last year, we’ve reached new milestones in the environment, including the use of recycled content in 30% of the materials and all of our products shipped in 2025, the most we’ve ever had. That includes the use of 100% recycled cobalt in all Apple design batteries and 100% recycled rare earth elements in all magnets. We’ve also achieved our goal of removing plastic from packaging with every Apple product now shipping in fiber based packaging. All of this is A testament to the outstanding forward thinking and innovative work of our teams. We’re also making great progress in advancing American supply chain innovation. As part of our $600 billion commitment to the U.S. we were pleased to share recently that Mac Mini production is coming to America later this year, expanding our factory operations in Houston with a brand new facility. In March, we were thrilled to welcome four new companies to our American manufacturing program and to help manufacture essential materials and components for Apple products sold worldwide. These include sensors that support key iPhone, features like camera stabilization and integrated circuits essential for features like crash detection and activity tracking. These efforts build on the progress we’ve made in the American manufacturing program, including the work we’re doing to advance an end to end silicon supply chain with across the US at TSMC’s Arizona facility, for example, Apple is on track to purchase well over 100 million advanced chips. As we’re accelerating our long standing support for US innovation, we’re also investing in America’s workforce. We’re looking forward to opening the …

Full story available on Benzinga.com

This post was originally published here

A 6x EV/EBITDA multiple. A chip business worth $9 to $13 billion that’s currently valued at zero. A revenue mix flip happening at next Q1 earnings. The math doesn’t reconcile.

This week’s Wolf Pick: Baidu

There’s a $43 billion company trading at roughly 6x EV/EBITDA, a multiple normally reserved for dying businesses. It also owns a soon-to-be publicly listed AI chip subsidiary that one major Wall Street bank values at $9 to $13 billion on its own. Q1 earnings drop May 18. A research briefing reviewed by our editorial team argues this is one of the cleanest mispricing setups in global tech right now.

The Setup the Market Is Missing

Baidu (NASDAQ:BIDU) is the company most Western investors still think of as “the Google of China.” Search bar. Ad revenue. Slow grower. Trapped in a regulatory environment nobody wants to underwrite.

That mental model is about to get destroyed by two events happening within weeks of each other.

The first is the Kunlunxin spinoff. The second is a revenue mix milestone that will mathematically reclassify what Baidu actually is. Neither is reflected in the stock at $127, and neither requires Baidu to grow faster than already projected. Both are functions of recognition, not execution.

Catalyst One: The Kunlunxin Spinoff Is Already in Motion

Most investors who follow Baidu know the company has been quietly building its own AI chips for over a decade. Very few understand what is actually happening inside that program right now.

Kunlunxin is Baidu’s AI semiconductor subsidiary. On January 1, Kunlunxin confidentially filed a listing application with the Hong Kong Stock Exchange to spin off as a standalone public company, with Baidu retaining a controlling stake. Baidu jumped 12% on the news that day.

Here is where it gets interesting. According to research circulated to institutional desks, Kunlunxin in 2024 was largely a captive supplier. Roughly 80% of its output went directly to Baidu’s own infrastructure. That model is being deliberately dismantled. Management is targeting an 80% external sales mix by 2030, with the transition already underway. External clients now include China Mobile, Tencent, and a growing list of Chinese state-owned enterprises and telecoms.

This post was originally published here

Bio-Rad Laboratories (NYSE:BIO) held its first-quarter earnings conference call on Thursday. Below is the complete transcript from the call.

This content is powered by Benzinga APIs. For comprehensive financial data and transcripts, visit https://www.benzinga.com/apis/.

The full earnings call is available at https://events.q4inc.com/attendee/969966609

Summary

Bio-Rad Laboratories reported a 1.1% increase in net sales for Q1 2026, but a 4.2% decrease on a currency-neutral basis, with significant headwinds from geopolitical conflicts in the Middle East impacting revenues.

The company is focusing on accelerating innovation and improving operational efficiencies, with a strategic emphasis on its digital PCR product line which saw a 24% revenue growth in instruments.

Bio-Rad Laboratories adjusted its 2026 guidance to a range of -3% to +0.5% currency-neutral revenue growth, citing challenges from the Middle East conflict and continued issues in the academic funding environment.

Operational highlights include manufacturing select life science instruments in China to meet local demand and reduce tariff exposure, and the successful integration of the QX700 platform in their digital PCR lineup.

Despite current challenges, management remains committed to achieving mid-teens operating margins in the near term, with a focus on disciplined M&A and operational agility to drive long-term growth.

Full Transcript

Regina (Operator)

Ladies and gentlemen, thank you for standing by. My name is Regina and I will be your conference operator today. At this time I would like to welcome everyone to Bio-Rad Laboratories’ first quarter 2026 results, conference call and webcast. All lines have been placed on mute to prevent any background noise. After the speaker’s remarks, there will be a question and answer session. I would now like to turn the conference over to Ruben Argeta, Bio Rad’s Head of Investor Relations. You may begin.

Ruben Argeta

Thank you, Regina. Good afternoon everyone and thank you for joining us. My name is Ruben Argeta, Bio Rad’s new head of Investor Relations. It’s a pleasure to join the team and be with you here today. We will review the financial results for the first quarter ended March 31, 2026 and provide an update on key business trends for Bio-Rad. With me on the call today are Norman Schwartz, our Chief executive officer, John DiVincenzo, president and chief Operating Officer and Roop Lakaraju, Executive Vice President and Chief Financial Officer. Before we begin our review, I would like to remind everyone that we will be making forward looking statements about management’s goals, plans and expectations, our future financial performance and other matters. These statements are based on assumptions and expectations of future events that are subject to risks and uncertainties. Our actual results may differ materially from these plans, goals and expectations. You should not place undue reliance on these forward looking statements and I encourage you to review our filings with the SEC where we discuss in detail the risk factors in our business. The company does not intend to update any forward looking statements made during the call today. Finally, our remarks today will include references to non GAAP financials including net income and diluted earnings per share, which are financial measures that are not defined generally under Generally Accepted Accounting Principles. In addition to excluding certain atypical and non recurring items or non GAAP financial measures, exclude changes in the equity value of our stake in Sartorius AG. In order to provide investors with a better understanding of Bio Rad’s underlying operational performance, investors should review the reconciliation of these non GAAP measures to the comparable GAAP results contained in our earnings release. We have also posted a supplemental earnings presentation in the Investor Relations section of our website for your reference. With that, I will now turn the call over to our Chief operating officer, John DiVincenzo.

John DiVincenzo (President and Chief Operating Officer)

Thanks Ruben and welcome to the team. Good to have you here and good afternoon everyone. Thank you for joining us. In the first quarter, our teams executed within a dynamic operating environment. We reported Q1 results within our revenue guidance as we navigated several external pressures, most notably associated with the ongoing conflict. The Middle east this region has been one of Bio-Rad’s fastest growing markets for several years. We haven’t highlighted this in the past, but in 2025 the region represented over 9% of our diagnostics segment, primarily driven by our blood typing franchise. The conflict substantially reduced our first quarter 2026 revenues and depending upon the timing of resolution, will be a significant headwind for revenue and margin for full year 2026. Despite the macro headwinds, our teams remain focused on executing our strategic initiatives, accelerating innovation and driving further efficiencies across the organization to increase competitiveness. In life science, reported net sales were flat reflecting mix and market conditions. Academic demand remained constrained, particularly in the Americas where our customers budgets have been significantly impacted by changes in funding. While NIH funding increased modestly year over year, our Voice of Customer Pulse surveys indicate that behind the scenes there continues to be considerable disruption and we continue to see a lag between funding approvals and purchasing activity. In biopharma we are seeing early signs of stabilization. Early stage biotech remains cautious, however activity among later stage companies is more robust. We expect gradual improvement through the year. On the commercial side, ensuring we capture our fair share of demand in a constrained market requires our sales organization to work differently. We have sharpened the focus of our commercial teams on segment level prioritization, directing coverage towards customers with active funding, accelerating conversions from our existing installed base and competing aggressively where competitive displacement opportunities exist. Our digital PCR product area continues to be a strategic differentiator in the quarter. DDPCR instrument revenue grew 24% over prior year. This is an encouraging leading indicator since new customers typically drive consumable pull through within six to 12 months of purchase and installation. The new QX700 platform is driving both competitive wins and conversion from QPCR, supported by an extensive assay menu and expanding publication base and ahead of schedule, the team now has enabled over 99% of our digital PCR assays to be available on the new QX700 series which is driving instrument growth. Looking ahead, we continue to expect a measured recovery in life science led by Biopharma. In clinical diagnostics we delivered modest reported growth of just under 2%. As I mentioned earlier, performance in the quarter was impacted by geopolitical disruption in the Middle east which affected both demand and logistics. While this creates near term challenges, we expect eventual market normalization once the conflict is resolved. Outside of this region, the segment performed as planned, in particular demand for our quality systems and immunohematology franchises shows signs of strength from a margin standpoint. Diagnostics was adversely affected by a disproportionate share of supply chain cost pressures. In light of these continuing supply chain challenges, we understand the need to rationalize manufacturing capacity and network. We are also addressing these challenges through focused actions in procurement and manufacturing. Turning to our operational priorities, we are executing against a clear agenda focused on improving agility, resiliency and efficiency across the company. In our effort to become more agile, we are increasing flexibility in our manufacturing footprint. During the quarter we began manufacture of select life science instruments in China for China, improving responsiveness to local market demand and allowing us to compete in tenders while minimizing tariff exposure. This initiative is indicative of how we are using efficient capital deployment to build operational capabilities for long term business continuity. In R and D, we have re engineered our innovation engine to deliver improved return on investment. Following our portfolio prioritization decisions, we are concentrating investment in areas with the strongest commercial potential. As I mentioned earlier, one example of this prioritization is the fact that 99% of our digital assays are now supported on the new QX700 platform, again ahead of plan. As we prioritize our projects, our focus areas are expanding into high growth clinical applications, leveraging our ddPCR technology, advancing our digital PCR portfolio including our next gen system and oncology assays, and embedding AI capabilities to accelerate development and enhance platform performance. While it is early, this focus allows us to deliver more consistent, higher quality growth over time. So in closing we are executing with discipline in a challenging environment. We are making progress on the operational actions within our control, improving supply chain capability, strengthening execution and focusing investment where it matters most. We remain confident that these actions will translate into improved financial performance over time and with that I’ll turn the call over to Roop.

Roop Lakaraju (Executive Vice President and Chief Financial Officer)

Thank you John and good afternoon. I’d like to start with a review of the first quarter 2026 results. Net sales for the first quarter of 2026 were approximately 592 million, which represents a 1.1% increase on a reported basis versus 585 million in Q1 of 2025 on a currency neutral basis. This represents a 4.2% year over year decrease and was driven by lower sales in both life science and clinical diagnostics segments. Sales of the life science segment in the first quarter of 2026 were 229 million, essentially flat compared to Q1 of 2025 on a reported basis and a 4.3% decrease on currency neutral basis, primarily driven by ongoing challenges in the academic research market, particularly in the Americas. Currency neutral sales decreased in the Americas and EMEA partially offset by increased sales in Asia Pacific. Our DDPCR portfolio was essentially flat in Q1 due to softer biopharma consumables as customers shift their R and D priorities despite the instrument growth. The year over year instrument growth that John noted we believe is a strong indicator of our market share gains especially considering the current market conditions. Finally, the STILA acquisition is on track to be accretive by mid year. More importantly, the QX700 is contributing to both revenue growth and margin expansion. Life Science X Process chromatography revenue increased 1% year over year and decreased 3.1% on a currency neutral basis. Consumables revenue in academic and biopharma research was down 3.9% reflecting the challenging academic research funding environment. Our process chromatography business as expected experienced a year over year currency neutral decline of 13%. Sales of the Clinical Diagnostic segment in the first quarter of 2026 were approximately 364 million compared to 357 million in Q1 of 2025, an increase of 1.9% on a reported basis and a decrease of 4.1% on a currency neutral basis primarily driven by revenue declines from our EMEA region as a result of the regional conflicts in the Middle East. The regional conflict affected demand and execution of logistics for our diagnostics products resulting in an $11 million impact to the business in the quarter as a result of the ongoing challenges within the Middle east. This will have a continued effect on our business for the remainder of 2026. Consolidated gross margin was 52.3% for both the first quarter of 2026 and 2025 on a non GAAP basis. First quarter gross margin was 53.1% versus 53.8% in the year ago period. The lower Q1 gross margin was due to several factors including unfavorable manufacturing absorption as a result of the decreased Middle east revenue which contributed to margin pressure by 40 basis points. Higher instruments versus consumables mix which adversely affected margin by 30 basis points, higher freight fuel surcharges by 20 basis points and FX by 20 basis points. SG&A expense for the first quarter of 2026 was 212 million or 35.9% of sales compared to 209 million or 35.7% in Q1 of 2025. First quarter non GAAP SGA spend was 211 million versus 192 million in the year ago period increase in SGA expense was primarily due to foreign exchange impact resulting from a weaker US dollar on our international cost base partially offset by lower restructuring costs. Research and development expense in the first quarter of 2026 was 63 million or 10.6% of sales compared to 74 million or 12.6% of sales in Q1 of 2025. First quarter Non GAAP R&D spend was 65 million versus 60 million in the year ago period. Q1 operating income was approximately 34 million compared to …

Full story available on Benzinga.com

This post was originally published here

On Thursday, NewtekOne (NASDAQ:NEWT) discussed first-quarter financial results during its earnings call. The full transcript is provided below.

This transcript is brought to you by Benzinga APIs. For real-time access to our entire catalog, please visit https://www.benzinga.com/apis/ for a consultation.

View the webcast at https://edge.media-server.com/mmc/p/qnrg6ajt/

Summary

NewtekOne reported strong Q1 2026 financial results with EPS of $0.43, beating street consensus and reflecting growth over Q1 2025.

The company’s total assets have grown significantly, with the bank holding over $2 billion in deposits, a substantial increase since the acquisition of the National Bank of New York City.

NewtekOne emphasized its strategic focus on providing real-time payment solutions and leveraging technology to enhance client experiences.

The company achieved a record number of originated loans and demonstrated growth in both loan units and dollar terms, with a notable increase in deposit accounts.

Management reaffirmed 2026 guidance and provided an EPS range for 2027, indicating confidence in future growth and financial stability.

Technological advancements are supporting increased loan volume and deposit growth, with a focus on utilizing AI for quicker loan processing.

NewtekOne plans to continue funding loans through its bank, reducing reliance on warehouse facilities, and anticipates a securitization event in Q4 2026.

The company’s balance sheet is robust, with strong capital ratios and a focus on diversifying its loan portfolio to manage risk effectively.

Full Transcript

OPERATOR

Good day and thank you for standing by. Welcome to the NewtekOne first quarter 2026 earnings conference call. At this time, all participants are in a listen-only mode. After the speaker’s presentation, there will be a question and answer session. To ask a question during the session, you will need to press star 11 on your telephone. You will then hear an automated message advising that your hand is raised. To withdraw your question, please press star 11 again. Please be advised that today’s conference is being recorded. I would now like to hand the conference over to your first speaker today, Barry Sloan, President and CEO. Please go ahead.

Barry Sloan (President, CEO and Founder)

Thank you very much and welcome to our Q1 2026 financial results conference Call. My name is Barry Sloan, President, CEO and Founder of NewtekOne. Also presenting today is Frank DeMaria, Chief Financial Officer of NewtekOne, the financial holding company that’s publicly traded and Frank is also Chief Financial Officer of Newtek Bank National Association. For those who want to follow today’s presentation along please go to newtekone.com, n e w t e k o n e dot com go to the Investor Relations section and the presentation section. We appreciate everyone’s attending today given that this is our 25th year as a publicly traded company and our 13th quarter reporting as a bank holding company. And after acquiring National Bank of New York City, we’ve accomplished quite a lot. From $180 million of total assets in national bank of New York city to over 2 billion. The financial holding company is approximately 2.9 billion of assets and the bank is over $2 billion of deposits, up from 140 million at the time we acquired it approximately three and a quarter years ago. We want to make sure in today’s presentation one of the biggest concerns I think people have, particularly in the current mobile market, is credit quality. I want to point everyone towards slide 21 where we’re able to demonstrate that the bank clearly has stabilized credit NPLs are down as a percentage when we typically take out the government guarantees for both the numerator and the denominator. With that said, let’s go to slide number two under forward looking statements. Absorb that and then let’s go to slide number three. Important always to note when you look at newtekone as its purpose. Our mission hasn’t changed since it was founded in 1998 at 120 W. 18th St. Apartment 4B with three founders. The focus of NewtekOneech One is to provide small to medium sized businesses, small to medium sized enterprises and independent business owners all across the United States to have financial and business solutions that are state of the art. We help our clients become more successful by growing their revenues, reducing their expense and reducing their risk. More importantly, we’re very much involved in the concept of real time payments. We’ll talk about that quite a bit today. Moving money and giving businesses the analytics that they really desire and require, apart from what they typically get from the top four large financial institutions in the United States, regional banks and community banks. On slide number four how do we do this? Newtekone uses Technology to tackle its Mission Statement I think it’s important to point out that although we’ve taken many different sizes and shapes as a publicly traded company, we started off as a 1933 act company, converted in November of 2011 to a 1940s Act BDC company and then converted back into Financial Holding Company. We acquired National Bank of New York City primarily for the purpose of improving our client experiences. Historically, we believe that by using technology we have solved the three primary challenges that the banking industry needs to overcome to be able to help the customer base. 1. The high cost of infrastructure with too many branches and expensive traditional bankers. We are traditional, bankerless and branchless. Take a look at the efficiency ratio at Newtek Bank National Association. For this particular quarter it was 40% insufficient lending margins from riskless loans. We think this particular industry when they’re lending generally is avoiding risk, they’re not managing risk and we think that there’s very little margin in their business and frankly if they aren’t able to acquire deposits materially below the risk free rate, there’s not a lot of margin in their business. Lastly, from a deposit perspective, basically taking in deposits with zero interest paid or non interest bearing deposits and charging excessive fees for the business client is not in the domain of NewtekOneech one or newtek Bank National Association. We have an extremely attractive platform that pays for business clients 1% on checking, 3.5% on business savings and a true no 0 fee bank account. Important to note, we’re a major adopter of real time payments. We can announce today that we are now have FedNow for receiving payments for our client base. We’ve been approved by the Federal Reserve’s FedNow program and the Clearinghouse RTP. So we’re fully approved. This is live and we’re able to benefit our clients today with real time payments appearing in their account on slide number five. Obviously these are things I think many of you are already aware of in terms of our structure. NewtekOne is considered a bank holding company regulated by the Federal Reserve Board of Governors NewtekOneech Bank national association which used to be called National Bank of New York City. It’s a depository offering great solutions, real time payments obviously the lender to the business community through its holding company Investment in NewtekOneech Merchant Solutions provides payment processing solutions, payroll solutions and insurance solutions that support independent business owners all across the United States. We’ve utilized our own proprietary and patented technological solutions to acquire customers cost effectively. We receive 600 to 800 unique business referrals a day through our NewTracker™ client acquisition tool. And we give customers through the NewTek Advantage, a far advanced business portal to help them manage the business, move money on a real time basis, as well as get the types of historic data and analytics that they so rightly deserve. Newtekone provides a full menu of best in class on demand business and financial solutions to independent business owners. Importantly, we don’t leave clients to just software. We have staff over 300 that are available on demand on camera. So in addition to great software and great technology in a frictionless manner, they can also get somebody on camera when they need them. On slide number six, we talk about our target market. I think the relevance of our target market is the SMB SME or independent business owner market is quite large and quite lucrative. It’s estimated that there’s 36 million independent business owners in the United States that identify themselves in this category. According to the US Chamber of Commerce, it’s 43% of US GDP and frankly, we’ve been tremendously supportive of this particular asset class. And According to the SBA, we have stabilized and supported over 110,000 jobs over the last five years, the second highest amongst all SBA lenders. The independent business owner is a huge economic demographic that frankly the existing industry has taken advantage of by basically taking their deposits, not really providing them attractive lending solutions to enable them to grow their business or for that matter, the ability to move money on a real time basis. It’s important to point out that in recent SBA data, new tech1 is the largest SBA lender by units and is top two or three by loan volume. Also important to note that even though the bank’s balance sheet is a little over 2.1 billion, when we make an SBA loan, 75% is government guaranteed. We typically sell it. So even though the bank is 2 billion, we basically, when you look at the government guarantees and the fact that we’re servicing them, it’s a much bigger infrastructure. I would guess over our history, if we kept all the government guarantees in the balance sheet rather than selling them. It would be approximately $4 billion of total assets. On slide number seven, we’re going to focus on the really attractive quarter that we just reported. Really Good start to 2026 EPS of 0.43 cents beating street consensus by about a penny, reflected 19 and 23% growth over Q1, 25 basic and diluted EPS and was within our 37 to 47 cent guidance range. We want to reconfirm our 2026 guidance of 2.35 at a midpoint and establish a $2.60 midpoint for 2027. The current street consensus for 2027 235, 240, 245 and 250 from four of the six analysts to blend at $2.43. Also, for those that follow our stock closely, you’re familiar that we’ve done a very nice job in growing book value and tangible book value. So book value per share ended Q1 2026 $12.35 and tangible book at $11.84. We started off at a tangible book at $6.926.92 in Q1 2023. Quite a substantial growth over the course of time. It’s a technical logical advancements that are supporting a record number of originated loans and tremendous year over year growth in the fourth quarter. In the first quarter of 2026 we originated 961 loan units of 40% year over year with 500 loan units alone originated in March versus 287 in dollar terms 391 million of loans versus 366 millions of loans for Q1 2025. And March’s momentum has continued in April with approximately 10% year over year growth. In addition, we were able to capture the operating leverage. Q1 2026 operating expense was just over, up over 7.5% on year over year asset growth 35% and a return on average assets of 1.96. Very favorable to the industry but also important for those of you that follow the company. The first quarter is clearly our weakest from an earnings perspective. I think it’s important to note using technology on a loan under 350,000, we’re using AI to read tax returns, read lease agreements, read operating agreements as well as alternative valuation methods. So by being able to do this we’re able to really fund small business loans quite quickly. As a matter of fact, we talked about which we’ll do in future slides the seven-day loan. Once the loan application is completed, we can clearly fund that particular application under 350,000 within seven days. Slide number 8 Deposit growth extremely important for banks we had two consecutive quarters of record number of deposit accounts. We ended Q1 2026 with 37,000 deposit accounts more than doubling year over year. In 13 quarters we’ve grown deposits from 142 million to 1.9 billion. Business deposits, which come in at a lower cost, increased Q over Q year over year by 37 million 173 million respectively. Consumer deposits also climbing quarter over quarter and year over year by 392 million and 668 million. Since the acquisition of Newtek bank in 2023, 54% of our lending clients have opened up a business deposit account and Since February of 2024 when we initiated T Man Life to NewTech bank business lending clients, 25% of those clients have purchased T Man Life and do so in in an automatic frictionless basis where they apply once and they can get a bank account T Man Life they can currently get flood insurance in the menu in the very near future we’re also going to be able to offer property and casualty all automated one app frictionless and get that client their funds as quickly as possible for those who qualify Starting we just started in January originating C and I long AM loans nicknamed CI la We used to call them AOP loans and these are being originated at the bank. The CNI LA (Commercial and Industrial Loan) originations approximated 85.7 million versus 68.5 million in the same quarter a year earlier. We are now funding these obviously with bank deposits where historically in 2025 and earlier than that we funded them up at the holding company with warehouse facilities. The cost of those facilities were approximately sold for +325 but the bigger cost which I’ll describe in a second has been not using a warehouse facility but the bank funding. We have historically securitized CNI LA (Commercial and Industrial Loan) loans on a regular basis and we may do so from the bank’s balance sheet. Once again, let’s take an example of say a $500 million portfolio. So a $500 million portfolio which historically was originated at the holding company with a 70% advance rate from a street warehouse line and should note we just paid two of those down to zero one from Capital One, one from Deutsche bank had a 30% equity haircut. So on $500 million worth of loans you need 150 million of capital from the holdco. Once you securitize with a 15% OC or owner certificate meaning that you had three classes of bonds above it, Single A bond, a triple B bond and a double B bond to give you an 85% advance rate. An 85% advance rate on $500 million of collateral is $75 million. All would have to be contributed from the holding company in the event that we securitized off the bank’s balance sheet. It’s dramatically less. You’re funding it with core deposits at approximately a 10 to 1 leverage, much more efficient and much more profitable. On slide number nine, tangible book value per share. One of my favorite slides. So you know, real simple for those people that like to invest based upon tangible book value growing. If you look at this slide, it’s a little dizzy to a certain degree. 6.96 dollars 92 cents in Q1 2023, currently $11.84. Frank DeMaria will talk about where we think we’ll be at the end of the year and it’ll be $13.50 approximately. And then on top of that, you look at the dividends that we paid. So $2.43 of cumulative common dividends declared, $4.92 of tangible book value growth. Since the conversion, we delivered $7.35 of value to shareholders, more than double the Q1 tangible book value of $6.92. Something we’re really proud of. On slide number 10. We touched upon this a little earlier, the technological advances that are supporting increased loan volume. Those advances have also helped us with deposit growth. But once again, it’s important to note we had tremendous unit and dollar growth in the first quarter. We talked about the seven day business loan, we talked about our AI that we use for smaller balance loans with respect to using it to read tax returns which are very important to spreading financials and actually calculating debt service coverage. Some of our competitors in the marketplace, frankly that have been score and going, some of these loans, they can’t do it. They’ve got to change their technology. It’s creating friction. We’ve had several of our competitors in the space reporting problems with …

Full story available on Benzinga.com

This post was originally published here

On Thursday, Jakks Pacific (NASDAQ:JAKK) discussed first-quarter financial results during its earnings call. The full transcript is provided below.

Benzinga APIs provide real-time access to earnings call transcripts and financial data. Visit https://www.benzinga.com/apis/ to learn more.

Access the full call at https://edge.media-server.com/mmc/p/rx9wonkw/

Summary

Jakks Pacific is confident about achieving its goals for the year and setting up for a stronger 2027, with a significant focus on the anime product line launching in 2027 and some shipments in 2026.

The company is expanding its product lines with successful tie-ins to major movie franchises like Super Mario, Toy Story, and Paw Patrol, and is experiencing strong sales in its Disney product lines.

International growth is a priority, with significant expansion in Europe and Latin America, supported by new distribution centers.

Jakks Pacific is focused on maintaining the right price points for different markets, with a majority of products in the $10 to $30 range, while preparing for high-demand holiday products.

Management is considering capital allocation carefully, with a focus on potential acquisitions and supporting new initiatives, while maintaining cash reserves due to market uncertainties.

Full Transcript

OPERATOR

Launch expected in 2027. We are only a third of the way through the year and although it continues to be very dynamic, we feel confident we are still on track to achieve our goals for this year, inclusive of setting up for an even better and stronger 2027 and beyond. And with that we will take a couple questions. Operator, thank you very much.

Thomas Forte (Equity Analyst)

Great, thanks Steven and John, thanks for taking my questions. I’ll limit myself to three and I’ll go one at a time. So Steven, the anime product line sounds amazing. Can you give just high level comments on what success could look like, including the relative gross margin and contribution margin for that product versus your other efforts?

Steven

Good afternoon Tom, and thank you. So firstly, this initiative that we undertook has been well over two years working with many of these companies that are in Japan and the way that the companies oversee their IP is very stringent and very strict. So we went to them to various large enterprises. Aniplex, which is Demon Slayer, Viz Media, Naruto, Kodansha which is Attack on Titan and several others from KADOKAWA Corp. And Crunchyroll. It’s been a long time process of making sure that when you create products in this genre it has a very strong fan base that you got to really focus on and cannot veer from. So we had put together a plan. We hired across the board a very young passionate group in the anime manga and called Digital Marketers and we put together a plan of products from collectibles to kid adults which is very strong, to somewhat of some of the other properties to tech accessories areas that the fan base really likes. In fact, for the VTubers and digital marketers, we created light sticks for them to use at concerts, but all with the authenticity of the actual IP and directed toward the fan. So the launch itself is starting in 27. We will get some of it shipped in 26. It’s a very broad launch to various initiatives of retail basis. So think of Miniso, GameStop, independent retailers as well as venue sales. A lot of these concerts, movies and initiatives are done in venues and there’s never been real authentic merchandise at the venue. So we have structured and working with several different partners to do the Venue sales as what you would see at concerts, like at a Taylor Swift concert or a Kendrick Amar where you have the merchandise that goes straight to the consumer. So all these initiatives are all being really launched together at one time in various segmentations and with various collective initiatives with each of the IP holders, but inclusive, you will see a broad array of product of totality of all the strong anime, manga and VTube IP in one segmentation. At retail, instead of having one licensor do one IP and another one, we’ve collectively worked with these IP holders to make sure that they were present and they were present and focused together so the consumer knows where to buy them. On the part of margin enhancement, because they’re somewhat more focused on kid adult, the price points will be slightly higher and the margin in our area for Jakks Pacific will be slightly higher.

Thomas Forte (Equity Analyst)

Excellent. All right, so then, second of three. I recognize a lot of your product releases are coinciding with movie premieres, but was wondering for your other SKUs, how should we think about the timing of new product rollouts and if you’re holding anything back given the current market challenges?

Steven

First, the market challenges. As we mentioned in our prerecorded we’re used to these challenges. It happens. It’s happened. Jax has been public 30 years. We’ve been around 31 years. So you have to kind of work through them, work with manufacturers, work with container companies, work with the retailers and work very closely and very entrepreneurial to get through these different times. But with these different times there’s also very strong opportunities. So as we mentioned in our call, the Super Mario Movie itself is done phenomenally well. The product …

Full story available on Benzinga.com

This post was originally published here

Riot Platforms (NASDAQ:RIOT) held its first-quarter earnings conference call on Thursday. Below is the complete transcript from the call.

This content is powered by Benzinga APIs. For comprehensive financial data and transcripts, visit https://www.benzinga.com/apis/.

Access the full call at https://edge.media-server.com/mmc/p/2wuv9ofa/

Summary

Riot Platforms reported an EBITDA loss of $311 million, driven by non-cash accounting adjustments and depreciation expenses.

The company produced 1,473 bitcoin, reducing its direct cost to mine by 26% compared to Q4 2025.

The newly added data center segment generated $33.2 million in revenue, mainly from tenant fit-out services, with a 91% gross margin from operating lease income.

Riot Platforms holds 15,679 Bitcoin valued at approximately $1.1 billion, which will be leveraged for data center development.

Strategic initiatives include expanding data center operations, securing power access, and vertically integrating engineering capabilities.

The company is focused on securing leases with high-quality tenants like AMD and expanding its power portfolio through various avenues.

Management highlighted the importance of their experienced team and strategic execution to capitalize on the growing demand for data center capacity.

Full Transcript

OPERATOR

EBITDA loss of $311 million. This loss was driven by non cash mark to market accounting adjustments on our bitcoin holdings of $326.7 million and non cash depreciation and amortization expense of $97.7 million which do not reflect the underlying strong fundamental economics of our operations. Diving into these operations, our Bitcoin mining segment performance remained robust. Riot Platforms produced 1,473 bitcoin in the first quarter and ended the quarter with a deployed hashrate of 42.5 exahash. We generated $21 million in power curtailment credits, driving our net cost of power down to $0.03 per kilowatt hour, thereby lowering our direct cost to mine Bitcoin to $44,629 per Bitcoin, a 26% reduction compared to the fourth quarter of 2025. In our newly added data center segment, we successfully exited the quarter with 5 megawatts of critical IT capacity fully online and generated $33.2 million in total revenue consisting of $900,000 in operating lease revenue and $32.2 million in tenant fit out services revenue. Finally, we ended the quarter holding 15,679 Bitcoin on our balance sheet valued at approximately $1.1 billion which we will continue to leverage in order to finance the ongoing development of our data center business. Turning to slide 15, I’m proud to present the inaugural financial results of our data center segment. In the first quarter, this segment generated $33.2 million in total revenue. As we introduce this new reporting line, it is important to understand the composition of this revenue and how it will evolve as our footprint scales. The majority of our first quarter revenue $32.2 million was driven by tenant Fit out services. This represents the procurement and installation of customer specific equipment which is reimbursed by tenants on a cost plus basis. While this revenue naturally carries a lower margin, it requires no capital risk from Riot Platforms and accelerates our tenant’s ultimate speed to market. The fundamental value of this segment, however, is reflected in the operating lease income. We recognize roughly $900,000 in recurring lease revenue driven by the initial 5 megawatt delivery to AMD in January which generated a 91% gross margin this quarter. As AMD scales its operations, we expect associated operations and maintenance costs to naturally increase which will normalize this margin towards our previously stated run rate target of 80% plus. As we look ahead, you will see a natural evolution in this revenue mix. While tenant fit out revenue is elevated today during the development phase. As the remaining megawatts for AMD come fully online, our high margin operating lease revenue will scale dramatically. This will layer highly predictable infrastructure grade cash flows into our consolidated P&L driving significant margin expansion over time. Turning to Slide 16, our engineering segment comprised of ESS Metron and E4A Solutions serves as a key pillar of our execution strategy. The financial metrics for engineering remain exceptionally strong. Engineering backlog stood at $193.4 million during the quarter, with approximately 90% of backlog continuing to be driven by data center sector demand. Most importantly, the apparent decline in backlog for this quarter was entirely driven by our decision to strategically hold back manufacturing capacity for deployment towards our own data center business. Since acquiring ESS Metron in December 2021, Riot Platforms has realized approximately $24 million in cumulative CapEx savings from across our development footprint and these savings will continue to compound as we further scale up. While this compounding cost advantage is accretive, the true strategic value of our engineering business is control over procurement. Low and medium voltage switchgear transformers and power distribution centers are among the most severely constrained components in the data center supply chain. For developers. Relying on third party manufacturers, lead times are lengthening and these lead times have become a binding constraint on delivery schedules across the industry. Because Riot owns a dedicated switchgear and power distribution manufacturer, we can sequence, prioritize and de risk the schedule critical equipment required to bring a data center online. This vertical integration was a key factor supporting our ability to deliver Phase one of the AMD lease on an accelerated timeline. Looking ahead, we’ll continue to invest in this strategically important business. In 2026, we expect to increase ESS Metron’s total engineering capacity by approximately 25% and we will be strategically allocating that incremental capacity to support Riot’s own data center growth. Further, because we manufacture these components in house, we design them in parallel with our data center engineering team, allowing us to move faster and reducing redesign risk. Just as importantly, the same teams that manufacture this equipment also provide maintenance in the field which will drive long term operational efficiencies as our data centers are energized and stabilized. Taken together, our engineering business is a core engine of our competitive moat in a market where time to power is the single most valuable commodity. Now I’d like to turn it back over to Jason Les thank you Jason.

Jason Less

I want to frame one of our key competitive advantages in the broader data center development market. Secured Power Today, access to power is a key bottleneck to data center development globally. This makes our large portfolio of 2 GW of fully approved power a strong competitive advantage, giving us one of the most significant development pipelines in our industry. However, we are not stopping here. We recognize that the market demand for power is strong and we are aggressively pursuing growth in our power portfolio across four distinct avenues. First, through Greenfield and brownfield development, securing and developing new land assets that offer immediate or near term power capacity. Second, through behind the meter self generation, allowing us to strategically co locate our own power production directly with our critical load. Third, through Inorganic M and A actively targeting and acquiring portfolios or organizations that already possess established access to power and fourth, through strategic partnerships forming joint ventures to expand our geographic footprint, rapidly grow our pipeline and explore next generation technologies. To put the scale and rigor of this effort into perspective, our corporate development team has already evaluated over 100 distinct opportunities across these four avenues. We have the team, the capital and the strategy to continuously source the highest quality power assets required to fuel our development pipeline. However, let me be clear. While we are aggressively pursuing these opportunities, we maintain rigorous capital discipline. We will only execute on transactions that are highly accretive, financially responsible and strictly aligned with our target return thresholds. Now I want to walk through the path we have taken to get to where we are today and provide investors with a clear picture of some of the obstacles Riot Platforms has navigated in order to best position our power portfolio for maximum value creation. At the start of 2025, we engaged Altman Solon to conduct a formal feasibility study on both Corsicana and Rockdale and the conclusion was unambiguous. We had two of the most attractive data center sites in the country. But the same study also identified two very specific constraints that left unresolved, would have prevented us from leasing that power to high quality tenants at any meaningful scale. The first was land at Corsicana, where our original footprint was insufficient to ACCommodate the full 1 GW campus development we wanted to deliver. The second was our ground lease at Rockdale. Until we solved both of these constraints, we were not in a position to meaningfully advance design, development or leasing at either site. Solving these two constraints required patient, disciplined execution, and that is what we did. Over the course of 2025, we successfully navigated a series of obstacles to acquire land adjacent to our original Corsicana site, unlocking the ability to develop the full 1 GW of approved power on Riot Platforms owned land in a connected campus layout at Rockdale. We converted our interest from a long term ground lease into a fee simple acquisition of the 200 acres underlying the site. With those two transactions closed, we own the land. We took control over our own destiny at both sites and we removed the most significant barriers between our power portfolio and high quality contracted leases. Critically, we did not wait for one work stream to finish before beginning the next. In parallel with the land work, we systematically built out the organization starting in the second quarter of 2025 with veteran product design and engineering talent. With the Corsicana land situation on track, we completed the initial basis of design for our standard data center product and initial campus design for the full Corsicana build out through the end of 2025. We took those designs to market for direct technical and commercial feedback from prospective tenants, initiated core and shell development at Corsicana, and brought on senior commercial leadership to drive leasing execution. That disciplined, sequenced groundwork is exactly what allowed us to move decisively when the opportunity arrived. In January of this year, we signed our first data center lease with AMD and delivered the initial phase of capacity within the same month. Since that initial lease, we have expanded the AMD relationship to 50 megawatts, enhance our standard design to increase density and flexibility, and are now actively engaged in commercial discussions at both of our sites. Every one of the steps on this timeline was necessary in order to maximize our value creation opportunity. Every one of them has been completed on an accelerated schedule and the result is that we now have an active commercial pipeline underpinned by secured land, a proven design, committed capital and a tenant relationship that is already generating revenue today. This is an excellent position to be in and we are confident in our ability to continue to execute from here. Now I want to zoom in on part of that timeline and take a moment to elaborate on the team we have built to execute on this opportunity. Over the past year, building out a world class data center organization has been one of our highest priorities because we knew from the start that the quality of our team would be every bit as important as the quality of our assets. What you see on this slide is the depth and breadth the capabilities. We have now assembled across four pillars. Commercial sales, critical operations, project execution and design and construction. Each of these functions is led by experienced credentialed leadership with direct track records of delivering mission critical infrastructure at hyperscale grade platforms. On the commercial side, our sales organization is led by Rhea Williams Williams, our Senior Vice President of AI and Hyperscale Sales. Rhea Williams joined us following previous sales roles at Oracle, Compass Data Centers and Digital Realty and she brings both the relationships and the credibility necessary to to engage hyperscalers and other top tier tenants at the highest level, RIA directly reports to me that reporting structure is deliberate. Our leasing strategy is the single most important driver of long term shareholder value at Riot Platforms and having sales report directly to the CEO ensures that I am directly engaged in every major commercial discussion. I am also very pleased to announce today a significant addition to our leadership team. Adam is a proven infrastructure executive with more than 15 years of experience leading hyperscale and AI data center development at multi gigawatt scale. He comes to us most recently from TA Digital Group, where he served as Senior Vice President of Design and Construction …

Full story available on Benzinga.com

This post was originally published here

On Thursday, OrthoPediatrics (NASDAQ:KIDS) discussed first-quarter financial results during its earnings call. The full transcript is provided below.

This content is powered by Benzinga APIs. For comprehensive financial data and transcripts, visit https://www.benzinga.com/apis/.

View the webcast at https://edge.media-server.com/mmc/p/kbq3vk2p

Summary

OrthoPediatrics reported a 13% increase in first quarter revenue, driven by strong performance in international markets and the OPSB segment.

The company is in the early stages of a multi-year product launch super cycle, with new products like Vertiglide and 3P hip showing strong demand.

2026 revenue guidance has been raised to $263-267 million, representing 11-13% growth, with an expected $25 million in adjusted EBITDA and free cash flow breakeven.

Operational highlights include a 14% growth in the T&D business, advancements in scoliosis products, and a successful international expansion.

Management emphasized the importance of maintaining a balance between growth and achieving free cash flow breakeven, while being open to accelerating growth as the product cycle develops.

Full Transcript

OPERATOR

Good afternoon and welcome to Ortho Pediatrics Corporation’s first quarter 2026 conference call. At this time, all participants are in a listen only mode. We will be facilitating a question and answer session towards the end of today’s call. As a reminder, this call is being recorded for replay purposes. I would now like to turn the call over to Tripp Taylor from the Gilmartin Group for a few introductory comments.

Tripp Taylor (Moderator)

Thank you for joining today’s call. With me from the Company are David Bailey, President and Chief Executive Officer and Fred Hite, Chief Operating and Financial Officer. Before we begin today, let me remind you that the Company’s remarks include forward looking statements within the meaning of federal securities laws, including the safe harbor provisions of the Private Securities Litigation Reform act of 1995. These forward looking statements are subject to numerous risks and uncertainties and the Company’s actual results may differ materially. For a discussion of risk factors, I encourage you to review the Company’s most recent annual report on Form 10K, which was filed with the SEC on March 4, 2026 and its subsequent quarterly reports on Form 10Q. During the call today, management will also discuss certain non GAAP financial measures which are supplemental measures of performance. The Company believes these measures provide useful information for investors in evaluating its operations period over period. For each non GAAP financial measure referenced on this call, the Company has included a reconciliation of the non GAAP financial measures to the most directly comparable GAAP financial measures in its first quarter earnings release. Please note that the non GAAP financial measures have limitations as analytical tools and should not be considered in isolation or as a substitute for OrthoPediatrics financial results prepared in accordance with gaap. In addition, the content of this conference call contains time sensitive information that is accurate only as of the date of this live broadcast today, April 30, 2026. Except as required by law, the Company undertakes no obligation to revise or update any statements to reflect events or circumstances taking place after the date of this call. With that, I would like to turn the call over to David Bailey, President and Chief Executive Officer.

David Bailey (President and Chief Executive Officer)

Thanks, Tripp Good afternoon everyone and thank you for joining us today. We are pleased to begin 2026 by highlighting our most meaningful metric, patient impact. In the first quarter, we supported the treatment of a record number of 45,000 children, extending our cumulative impact to nearly 1.4 million kids. Helped pediatric patients have long been underserved by solutions not tailored to their needs. We at Orthopediatrics are dedicated to changing that through focused innovation and a continued commitment to this most important patient population. 2026 started strong with 13% first quarter revenue growth further highlighted by significant improvements in adjusted EBITDA and free cash flow over prior year. As we look closer at the quarter, we saw a softer start to the first quarter due to weather related shutdowns in many of our OPSP clinics in January and February, but trends rebounded in March. Since then, momentum remains strong and is carrying into the second quarter. Growth remains solid across the business with particular strength internationally and continued 20% plus expansion in OPSB driven by new products and clinic growth. Importantly, we’re at the earliest stages of a multi year innovation super cycle consisting of what we believe is the most clinically significant and technologically advanced series of product launches in our history. During the quarter we began to see small contributions from recent beta launches including three phip and vertiglide. These products are generating strong demand and we are confident that as we move into full market release and increase set deployments in the second quarter, we are positioned well for more meaningful impacts in each of the upcoming quarters. Early trends are reinforcing our expectations for higher ASPS margin expansion and improved capital efficiency as each of these products continue to scale. As we expand our portfolio and reinforce our core orthopaedic platform from this unassailable position we see a clear opportunity for continued growth. Our consistent execution underpins our confidence in sustained revenue growth, expanding profitability and achieving free cash flow breakeven in 2026. We continue to gain share across each of our businesses with our legacy product portfolio and share gain will only continue to accelerate as we execute our super cycle and further expand opsb. Our powerful competitive position is becoming increasingly dominant and will only grow stronger as we further execute our strategy and demonstrate both top and bottom line expansion in a way that is unique in our industry. We remain focused on enhancing shareholder value while advancing our cost of helping 1 million kids per year in the future. Accordingly, we are raising our 2026 revenue guidance to a range of 263 million to $267 million in revenue representing 11 to 13% growth and reaffirming our expectations for approximately $25 million in adjusted EBITDA and full year free cash flow breakeven driven by continued share gains, OPS B expansion and execution of our multi year new product launch cycle Turning to our T and D business in the first quarter of 2026 the T&D business grew by 14% driven by increased sales of our flagship trauma and deformity systems. Early returns from the beta launch of new implant and OPSB systems. We continue to see success in case volume growth as we move deeper into the launch of PMP Tibia and will pick up additional share as we launch 3P hip. We are also pleased to advance toward the beta launch of the next 3P system, 3P Small/Mini, which should kick off late in Q2. Beyond those products, we are advancing the next system within the 3P family as well as the next PMP system. PMP Retrograde looking closer at 3P, our 3P hip system has exceeded early expectations with limited set availability in Q1. We will increase supply of the 3P hip in Q2 and commence the beta launch of 3P small mini. We expect a more meaningful impact on growth in the second half of the year. We will also continue advancing additional systems over the next several years. The 3P platform is building strong momentum and we believe it will become the most advanced and comprehensive pediatric plating system in our field. Overall, TD remains a key growth driver for the business, supported by consistent execution and a pipeline that is both highly clinically relevant and increasingly robust. We believe the depth and quality of our development efforts position us well to sustain innovation, drive future revenue growth and reinforce our leadership position in the market. Looking at our specialty bracing business, OPSB remains a key growth driver for the business and delivered over 20% growth in the quarter, contributing meaningfully to both the revenue expansion and profitability. Our clinic expansion strategy continues to progress ahead of plan, supported by both greenfield openings and selective aqua hires. Same store sales growth remains strong reinforced by ongoing new product introduction and continued sales force expansion. Overall, we are on track to meet or exceed our goal of expanding to 27 territories by the end of 2027. Within OPSB, we are seeing the impact of our new product development engine. We recently advanced the Modular Hip Brace portfolio into commercial release and initiated the beta launch of the Traxio Halo Gravity Traction System. Early feedback for Traxio has been strong with initial customer engagement including multiple requests for quotes for this differentiated system. In addition, we remain on track to beta launch the OP Contracture Management Brace which is designed to integrate directly with our Orthex External Fixation platform, further enhancing synergies across our surgical and non surgical offerings. OPSP is progressing as planned toward our goal of delivering four to five new product introductions annually, reinforcing a consistent cadence of innovation. Going forward, we continue to execute effectively across our three pillar OPSB strategy which includes sales force expansion, targeted product innovation and disciplined clinic growth. Overall, we are very pleased with the performance of the business and its increasingly important role within our broader growth strategy in scoliosis we experienced 13% growth in the first quarter of 2026 driven by increased sales of response and Vertiglide systems and revenue generated from 7D technology and once again we were particularly pleased with our EOS products. During the quarter we continued our push into the EOS space with Response Ribbon, Pelvic and the Vertiglide system, which we believe provide a promising new growth friendly treatment option for young scoliosis patients. Looking more closely at this progress, we continue to see strong demand for Vertiglide despite very limited set availability. With approximately 80 surgeons now trained and additional training sessions scheduled, this success is triggering our move to full market release of this important system in the second quarter. Supported by additional SET deployment to meet the rising demand. This growing adoption along with 7D placements is driving higher utilization of our response fusion system, all ahead of the anticipated limited release of our next generation scoliosis fusion platform Veraxis. Purposely built exclusively for the treatment of pediatric spinal deformity. Designed from the ground up for growing patients and the surgeons who treat them, Veraxis represents a step change in fusion technology by combining advanced implant design, streamlined instrumentation and integrated digital planning into a single cohesive platform with first surgeries by year end. In addition, we remain on track for first inpatient procedures with elli, our third and most complex EOS product in the fourth quarter. As a reminder, ELLIE is a next generation smart electromechanical lengthening spinal implant designed to deliver consistent, reliable power through RF power transmission. We expect the first implantation of the LE device in late 2026. We are proud of how far our EOS products EOS products have come and they further bolster our belief that our EOS strategy is working. We believe that OP is continuing to establish an unmatched portfolio of pediatric scoliosis technologies, enabling clinicians to treat even the most complex and severe pediatric spinal deformities with a comprehensive set of advanced solutions. Moving to our international business, OUS had a strong first quarter with growth in excess of 20%, highlighted by great sales in EMEA and a nice performance in Brazil under our new agency structure. Continued success in EMEA is being driven by like increased sales of legacy TND products in our agency markets and a small but rapidly growing scoliosis franchise. We’re pleased to have received full EU MDR approval for our T and D portfolio scoliosis products and most recently our external fixation devices. We are now actively working to make these long anticipated products available across our European markets and we expect this expanded access to support Improved EMEA Growth 2026 LATAM is building on our structural improvement in Brazil. While we’re still cautious, we do believe an improvement is on track and over the next several quarters we expect to turn this headwind into a potential tailwind. The structural improvements we’ve made in Brazil through the purchase of one of our Brazilian distributors will improve our cash collection and over time will normalize ordering patterns and allow for additional growth and market penetration. In addition, we were once again the largest sponsor of the European Pediatric Orthopedic Society. Meeting in Seville, Spain in early April, we showcased a broad range of new products that had previously not been available in Europe under prior regulatory constraints. These offerings were well received by both surgeons and distributors and are expected to contribute to revenue growth the second half of the year. Lastly, looking beyond our traditional segments, we are building on the success of our 7D experience and are kicking off the launch of our digital preoperative interoperative workflow management platform Playbook, and expect deployment of beta launch sites at 2026. Beyond that, we’ve completed the deployment and the first cases with the IOTA Motion robot for pediatric cochlear implant placement and expect additional deployments throughout 2026. Beyond OrthopediaX is also making deliberate, focused investments in artificial intelligence to drive meaningful clinical and operational impact. We are advancing multiple AI initiatives, including embedding intelligence into our Playbook platform, leveraging AI enabled tools to support pre surgical planning and evaluating opportunities to enhance patient care and efficiency across our OPS B clinics. Earlier this year, we completed an internal AI flight school to build organizational readiness, and we have established a corporate Objective to deploy 6 to 8 targeted AI agents to drive tangible efficiencies. After prioritizing data security and foundational controls last year, our focus in 2026 is firmly on execution, moving from experimentation to scaled implementation that delivers real value to surgeons, clinicians and our teams. In summary, we believe the company is entering its most compelling phase of expansion to date, supported by a multi year product launch super cycle that will increasingly shape results over the coming years. These new technologies are meaningfully more advanced and clinically differentiated, addressing significant unmet needs, supporting higher ASPs, improved gross margins and stronger returns on invested capital. They also enhance our ability to bundle solutions across accounts, supporting broader contract opportunities in pediatric hospitals and reinforcing share gains across our legacy portfolio. At the same time, OPSV continues to scale through both new product introductions and disciplined clinic expansion via greenfield openings and AQUI hires, a trajectory we expect to sustain over the coming years. Collectively, these initiatives are expected to drive significant improvement in profitability and cash flow generation over the long term. More broadly, we believe our hospital and surgeon partners increasingly recognize the value of working with a dedicated, self sustaining pediatric platform focused exclusively on improving care for children. Together, we’re advancing innovation in a historically underserved area of healthcare and building a stronger long term outlook for patients and the business. With that, I’d like to turn the call over to Fred to provide more detail on our financial results.

Fred Hite

Fred thanks Dave. Taking a closer look at the P and l our first quarter of 2026 worldwide revenue of $59.4 million increased 13% compared to the first quarter of 2025. The increase in revenue in the quarter was driven primarily by strong performance across trauma and deformity scoliosis and OPSD. US revenue was $45.3 million, an 11% increase from the first quarter of 2025, representing 76% of total revenue. Growth in the quarter was primarily driven by trauma, deformity, scoliosis and OPSD. We generated total international revenue of $14.1 million, representing growth of 22% compared to the first quarter of 2025, or 24% of our total revenue in the first quarter of 2026. Trauma informed me global revenue of $43.0 million increased 14% compared to the prior year. Period growth was primarily driven across numerous product lines, specifically our Tron products, Xfix and OPSB. In the first quarter of 2026, scoliosis global revenue of $15.4 million increased 13% compared to the prior year. Period growth was primarily driven by increased sales of Response and Vertiglide systems and revenue generated from 7D technology. Finally, sports medicine. Other revenue in the first quarter of 2026 was $0.9 million and which stayed consistent year over year. Touching briefly on a few key Metrics, for the first quarter of 2026, gross profit margin was 73%, which is consistent year over year. Total operating expense increased $2.5 million, or 5% compared to the prior year period to $51.7 million in the first quarter of 2026. Sales and marketing expenses increased $1.9 million, or 11% compared to the PR, driven primarily by increased sales commission expense and an overall increase in volume of units sold to $18.5 million in the first quarter of 2026. General and administrative expenses increased $0.7 million, or 2% year over year to …

Full story available on Benzinga.com

This post was originally published here

NMI Holdings (NASDAQ:NMIH) reported first-quarter financial results on Thursday. The transcript from the company’s first-quarter earnings call has been provided below.

Benzinga APIs provide real-time access to earnings call transcripts and financial data. Visit https://www.benzinga.com/apis/ to learn more.

Access the full call at https://edge.media-server.com/mmc/p/odxmij93/

Summary

NMI Holdings reported a record $183.5 million in total revenue for the first quarter, with an adjusted net income of $99.4 million or $1.28 per diluted share, and a 15.2% adjusted return on equity.

The company achieved $12.3 billion in new insurance written (NIW) and ended the quarter with a record $222.3 billion in primary insurance in force, highlighting strong business performance.

Management emphasized the resilience of the housing market and the macroeconomic environment, noting that while macro risks remain, the company is well-positioned due to its disciplined approach to risk management and underwriting.

Operational highlights include a strong customer franchise, disciplined expense management, and a robust balance sheet, supported by strategic investments in people and technology.

Management indicated confidence in future performance, citing consistent growth opportunities in the MI market, driven by long-term secular trends and sustained demand for mortgage insurance.

Full Transcript

OPERATOR

Good day and welcome to the NMI Holdings Inc. First quarter 2026 earnings conference call. All participants will be in listen-only mode. Should you need assistance, please signal a conference specialist by pressing the star key followed by zero. After today’s presentation there will be an opportunity for questions. To ask a question, you may press star then one on a touch tone phone. To withdraw your question, please press star then two. Please note this event is being recorded. I would now like to turn the conference over to John Swenson of Management. Please go ahead.

John Swenson (Vice President of Investor Relations and Treasury)

Thank you, operator. Good afternoon and welcome to the 2026 first quarter conference call for National MI. I’m John Swenson, Vice President of Investor Relations and Treasury. Joining us on the call today are Brad Schuster, Executive Chairman, Adam Pollitzer, President and Chief Executive Officer and Aurora Swithenbank, our Chief Financial Officer. Financial results for the quarter were released after the close today. The press release may be accessed on NMI Holdings’s website located at nationalmi.com under the Investors tab. During the course of this call we may make comments about our expectations for the future. Actual results could differ materially from those contained in these forward looking statements. Additional information about the factors that could cause actual results or trends to differ materially from those discussed on the call can be found on our website or through our filings with the SEC. If and to the extent the company makes forward looking statements, we do not undertake any obligation to update those statements in the future in light of subsequent developments. Further, no one should rely on the fact that the guidance of such statements is current at any time other than the time of this call. Also note that on this call we may refer to certain non GAAP measures. In today’s press release and on our website, we’ve provided a reconciliation of these measures to the most comparable measures under GAAP. Now I’ll turn the call over to Brad. Thank you John and good afternoon everyone. I’m pleased to report that in the first quarter National MI again delivered standout operating performance, continued growth in our insured portfolio and strong financial results. Our lenders and their borrowers continued to turn to us for critical down payment support and in the first quarter we generated 12.3 billion of new insurance written (NIW) volume, ending the period with a record 222.3 billion of high quality, high performing primary insurance in force. In Washington, our conversations remain active and constructive. We have long noted that there is bipartisan recognition of the unique and valuable role that the private mortgage insurance industry plays. We are in the market every day with a clear mandate and purpose, offering a low cost, high value solution that helps borrowers bridge the down payment gap and meaningfully reduces the cash required at the closing table. In the process, we help to make homeownership more affordable and achievable for millions of Americans in communities across the country with coverage that works to insulate the GSEs and taxpayers from risk and loss in a downturn. National MI and the broader private MI industry have never been stronger or better positioned to provide support than we are today, and we’re looking forward to continuing to work with the administration to advance their important housing goals. With that, let me turn it over to Adam.

Brad Schuster (Executive Chairman)

Thank you Brad and good afternoon everyone. National MI continued to outperform in the first quarter, delivering significant new business production, consistent growth in our insured portfolio and strong financial Results. We generated $12.3 billion of new insurance written (NIW) volume and ended the period with a record $222.3 billion of high quality, high performing primary insurance in force. Total revenue in the first quarter was a record $183.5 million and we delivered adjusted net income of $99.4 million or $1.28 per diluted share and a …

Full story available on Benzinga.com

This post was originally published here

Merit Medical Systems (NASDAQ:MMSI) released first-quarter financial results and hosted an earnings call on Thursday. Read the complete transcript below.

This content is powered by Benzinga APIs. For comprehensive financial data and transcripts, visit https://www.benzinga.com/apis/.

Access the full call at https://edge.media-server.com/mmc/p/a7nbp34k/

Summary

Merit Medical Systems reported Q1 2026 revenue of $381.9 million, up 7% year-over-year on a GAAP basis, and exceeded expectations for constant currency revenue.

The company achieved a record non-GAAP operating margin of 19.7% in Q1, with a 9% growth in non-GAAP EPS, and generated $25 million in free cash flow.

Strategic highlights include the acquisition of Viewpoint Medical for $140 million, expanding their oncology portfolio, and the launch of the Resilience TTS esophageal stent.

Merit Medical Systems updated its 2026 guidance to reflect Viewpoint Medical’s acquisition, projecting 6.3-7.8% GAAP revenue growth and maintaining non-GAAP EPS guidance of $4.01 to $4.15, despite expected dilution from the acquisition.

The company reorganized its revenue reporting into ‘foundational’ and ‘therapeutic’ categories, aiming for clearer internal and external communication of business performance and growth drivers.

Full Transcript

Martha Aronson (President and Chief Executive Officer)

Thank you Operator and welcome everyone. I am joined on the call today by Raul Parra, our Chief Financial Officer and Treasurer, and Brian Lloyd, our Chief Legal Officer and Corporate Secretary. Brian, would you please take us through the safe harbor statements?

Brian Lloyd (Chief Legal Officer and Corporate Secretary)

Thank you, Martha this presentation contains forward looking statements that receive safe harbor protection under federal securities laws. Although we believe these forward looking statements are based upon reasonable assumptions, they are subject to risks and uncertainties. The realization of any of these risks or uncertainties, as well as extraordinary events or transactions impacting our Company, could cause actual results to differ materially from the expectations and projections expressed or implied by our forward looking statements. In addition, any forward looking statements represent our views only as of today, April 30, 2026 and should not be relied upon as representing our views as of any other date. We specifically disclaim any obligation to update such statements except as required by applicable law. Please refer to the sections entitled Cautionary Statement Regarding Forward Looking Statements in today’s press release and presentation for important information regarding such statements. For a discussion of factors that could cause actual results to differ from these forward looking statements, please also refer to our most recent filings with the sec, which are available on our website. Our financial statements are prepared in accordance with accounting principles which are generally accepted in the United States. However, we believe certain non GAAP financial measures provide investors with useful information regarding the underlying business trends and performance of our ongoing operations and can be useful for period over period comparisons of such operations. This presentation also contains certain non GAAP financial measures. A reconciliation of non GAAP financial measures to the most directly comparable US GAAP measures is included in today’s press release and presentation furnished to the SEC under Form 8K. Please refer to the sections of our press release and presentation entitled Non GAAP Financial Measures for important information regarding non GAAP financial measures discussed on this call, readers should consider non GAAP financial measures in addition to not as a substitute for financial reporting measures prepared in accordance with gaap. Please note that these calculations may not be comparable with similarly titled measures of other companies. Both today’s press release and our presentation are available on the Investors page of our website. I will now turn the call back to Martha.

Martha Aronson (President and Chief Executive Officer)

Thank you Brian. Let me start with a brief agenda of what we will cover during our prepared remarks. I will begin with a brief summary of the first quarter financial results. Then I will discuss several areas of operating and strategic progress that we have made in recent months, including an important strategic acquisition in the oncology space that we made subsequent to quarter end. Then Raoul will provide a more in depth review of the quarterly financial results as well as our financial guidance for 2026 which we updated in today’s press release. We will then open the call for your questions beginning with a review of our first quarter results. We reported total revenue of $381.9 million, up 7% year over year on a GAAP basis and up 5% year over year on a constant currency basis. Our constant currency revenue results exceeded the high end of the expectations that we outlined on the Q4 2025 earnings call. First quarter constant currency growth was driven by 2.7% organic constant currency growth and contributions from our acquisitions of BioLife and the C2 cryoballoon device, both of which exceeded the high end of our expectations. Our organic constant currency growth includes the impact of the strategic divestiture of our dual cap product line in February of 2026, which we discussed in our Q4 2025 call. Excluding divested revenue, our organic constant currency growth was 3.7% in the first quarter. With respect to the profitability performance in Q1, we delivered financial results that significantly exceeded expectations. Our non GAAP operating margin increased 47 basis points year over year to 19.7%, representing the highest first quarter operating margin in the company’s history. The team delivered 9% growth in non GAAP EPS which exceeded the high end of expectations and we generated $25 million of free cash flow, an increase of 26% year over year. We are pleased with the solid start to fiscal year 2026 and I want to thank our team members all around the world for their effort and commitment to our customers. We updated our guidance in today’s press release to include the expected financial impacts from our acquisition of viewpoint Medical on April 1st. Importantly, we remain confident in our team’s ability to drive stable constant currency growth, improving profitability and solid free cash flow. This year. Our organization is aligned around our priorities for 2026, specifically to drive strong execution around the globe and to successfully complete our Continued Growth Initiatives program which includes our previously disclosed financial targets for the three year period ending December 31, 2026. Turning now to a discussion on three key operating and strategic announcements we made since our last earnings call. First, on March 16, we announced the US commercial introduction of the Resilience through the Scope or TTS esophageal Stent. The Resilience stent is indicated for treatment of esophageal fistulas and strictures caused by malignant tumors. Resilience is designed to demonstrate the greatest migration resistance amongst currently available TTS esophageal stents and facilitates physician control and accurate placement. Resilience targets an attractive market opportunity in the United States and we expect adoption and utilization of this differentiated product to contribute nicely to the growth in Merit’s endoscopy platform in the coming years. Second, on April 1, building upon our oncology platform, we announced the acquisition of Viewpoint Medical for an aggregate transaction consideration of $140 million, of which 90 million was paid in cash at closing. Viewpoint Medical is based in Carlsbad, California and manufactures the OneMarc detection imaging system and OneMark tissue markers. This unique ultrasound enhanced technology offers an innovative solution to localize more lesions at the time of biopsy, representing an estimated 1.3 million procedures annually in the United States alone. This represents an expansion of the annual addressable procedure opportunity of approximately three times. For our oncology business, Merit has built a market leadership position in wire free non radioactive breast localization procedures. Our leadership has been built upon our SCOUT platform which utilizes the precision and accuracy of radar. The OneMark system is US FDA cleared for percutaneous placement in soft tissue tumors to mark biopsy sites or lesions and it consists of a surgical detection system and ultrasound enhanced tissue markers. After placement, the tissue markers are designed to be visible across commonly used imaging modalities and engineered to minimize interference with future imaging studies. This acquisition expands our portfolio of therapeutic oncology products dedicated to the diagnosis and localization of breast and soft tissue tumors. The combination of Scout and OneMarc provides physicians with localization options during the initial diagnostic biopsy, which may reduce the need for a separate procedure to mark the location of the tumor prior to surgery. We believe this acquisition presents multiple strategic and financial positives and importantly, this acquisition is consistent with our Continued Growth Initiatives program. This acquisition represents another example of MERIT selectively investing to expand our product portfolio in key strategic markets that leverage our existing commercial footprint. Finally, I want to highlight our new presentation of revenue which we formally introduced in a Form 8K filed on April 13. As discussed on our Q4 call, Merit’s new executive leadership team and I have been working through a comprehensive analysis of the business and it became clear during this process that we had an opportunity to streamline our internal planning and reporting processes with the goal of aligning how we think about, evaluate and plan each of our underlying businesses. We also identified an opportunity to streamline how we talk about the business externally as well. We believe there’s significant value in aligning how we talk about the business both internally and externally, and we expect these changes to help the investment community not only better understand the composition of our business today, but also the underlying growth drivers of our business going forward to that end. As disclosed in the Form 8K on April 13 and reported in our earnings press release today, we are now reporting our revenue in two product categories, foundational and therapeutic. Foundational products are used primarily for access and enabling functions in vascular and other procedures. Merit’s foundational products comprised about two thirds of our total revenue in 2025 and sales increased at a 6% compound annual growth rate over the last three years. Therapeutic products are devices and systems that treat disease in a number of very large markets that together represent significant growth potential. Merit’s therapeutic products comprised about one third of our total revenue in 2025 and sales increased at an 11% compound annual growth rate on an organic basis over the last three years. Given that we call on a wide variety of clinicians and our products are a part of so many procedures, we have solidified our new operating model internally around eight access, vascular intervention, procedural solutions, cardiac therapies, renal therapies, oncology, endoscopy and oem. The access and procedural solutions platforms are comprised entirely of foundational products. The vascular, intervention and OEM platforms are comprised of both foundational and therapeutic products and cardiac therapies. Renal therapies, oncology and endoscopy are comprised entirely of therapeutic products in the form 8K. We shared four years of historical revenue in each of these platforms. So to reiterate, going forward we plan to report revenue results by foundational and therapeutic products. In addition, we intend to continue to highlight additional color on the underlying drivers of growth within the underlying platforms. As I shared last quarter, each of our platforms is being co led by a marketing lead and a research and development lead and each team is comprised of cross functional and cross geographic members so that we have better alignment on product and commercial priorities, improved communication across functions and geographies, and a team who feels accountable for that platform globally. I am very pleased with how our teams are taking ownership, increasing communication and thinking about how best to serve our customers in each area. I truly believe that focusing our efforts in this way will enable us to drive even greater growth within each one of these platforms in the years to come. With that, I’ll turn the call over to Raul for an in depth review of our quarterly financial results and our updated financial guidance for 2026.

Raul Parra (Chief Financial Officer and Treasurer)

Raul thank you Martha. I will start with a detailed review of our revenue results in the first quarter. Note Unless otherwise stated, all growth rates are approximated and presented on both a year over year and constant currency basis. First quarter total revenue increased 18.6 million or 5%, exceeding the high end of the expectations we outlined on our fourth quarter call. Excluding sales of acquired products, our total revenue growth on an organic constant currency basis was 2.7%. At the high end of our expectations, excluding divested revenue, our organic constant currency growth was 3.7% in the first quarter. By geography, our total revenue in Q1 was primarily driven by growth in the US where sales increased 14.5 million or 6.8% and international sales increased 4.1 million or 3%, both of which modestly exceeded the high end of our expectations in Q1. Turning to a review of our revenue results by product category, first quarter total revenue was driven by a 10.1 million or 4% increase in sales of foundational products and an 8.5 million or 7% increase in sales of therapeutic products, including the contributions from acquired products of 6.6 million and 2.5 million respectively. Sales of foundational and therapeutic products increased 1.5% and 5.2% respectively, on an organic constant currency basis. Organic growth in the foundational product category was driven primarily by our vascular intervention and access platforms, which offset year over year declines in sales of OEM and procedural solution products, the later of which impacted by our divestiture of dualcap product line. Organic growth in the therapeutic product category was driven by strong growth in our cardiac therapies and endoscopy platforms and contributions from solid growth in our vascular intervention and oncology platforms, offsetting year over year sales declines in our OEM and renal therapies platforms. We were pleased with our first quarter total revenue results that exceeded the high end of our expectations, despite the notable headwinds to year over year revenue growth experienced in our OEM business in Q1. OEM sales declined 14% year over year in Q1, significantly lower than what was assumed in our guidance. Sales to OEM customers outside the US continued to see demand trends impacted by the macro environment, particularly in the APAC region, and these headwinds were largely consistent with our expectations. OEM sales to US customers were impacted by inventory destocking dynamics related to product line transfers to Tijuana, Mexico, as expected. That said, customer orders came in lower than expected, which we would characterize as transient or timing based rather than a reflection of share loss. Our OEM business remains healthy despite the quarter to quarter fluctuations in growth rates. We continue to believe the appropriate normalized growth profile of our OEM business is in the mid to high single digits annually. Turning to a review of our P and L performance for the avoidance of doubt, unless otherwise noted, my commentary will focus on the company’s non GAAP results during the first quarter of 2026 and all growth rates are approximated and presented on a year over year basis. We have included reconciliations from our GAAP reported results to the most directly comparable non GAAP item in our press release and presentation available on our website. Gross profit increased 7% in the first quarter. Our gross margin was 53.2% down 20 basis points year over year but notably stronger than our internal expectations. Q1 gross margin included a 4.6 million impact from tariffs compared to no impact in the prior year period representing 120 basis point impact to gross margin in the period. Operating expenses increased 5% in the first quarter. The increase in operating expense was driven primarily by a 5.4 million or 5% increase in SGA expense and to a lesser extent a 1.1 million or 5% increase in R and D expense compared to the prior year period. Total operating income in the first quarter increased 6.9 million or 10% from the prior year period to 75.3 million. Our operating margin was 19.7% compared to 19.3% in the prior year period, an increase of 47 basis points year over year. First quarter other expense net was 1.2 million compared to 1.7 million for the comparable period last year. The change in other expense net was driven primarily by gain loss on foreign exchange and higher interest income. First quarter net income was 56.7 million or $0.94 per share compared to 52.9 million net or $0.86 per share in the prior year period. First quarter net income and EPS exceeded the high end of our guidance range by 3.7 million and seven cents respectively. Turning to a review of our balance sheet and financial condition as of March 31, 2026 we had cash and cash equivalents of 488.1 million, total debt obligations of 747.5 million, an available borrowing capacity of approximately 697 million compared to cash and cash equivalents of 446.4 million, total debt obligations of 747.5 million and available borrowing capacity of approximately 697,000,000 as of December 31, 2025. Our net leverage ratio as of March 31 was 1.6 times on an adjusted basis. The increase in cash and cash equivalents in the first quarter was driven by a combination of strong free cash flow generation of $24.7 million and $25.5 million of proceeds from our divestiture and sale of the dual cap product line, offset partially by $6.3 million in cash used for financing activities. In the period subsequent to quarter end, we acquired Viewpoint Medical for an aggregate consideration of 140 million. Of that amount, 90 million was paid in cash at closing, and two deferred payments of 25 million each are scheduled to be paid no later than first and second anniversary of the closing date respectively. …

Full story available on Benzinga.com

This post was originally published here

First Internet (NASDAQ:INBK) held its first-quarter earnings conference call on Thursday. Below is the complete transcript from the call.

Benzinga APIs provide real-time access to earnings call transcripts and financial data. Visit https://www.benzinga.com/apis/ to learn more.

Access the full call at https://events.q4inc.com/attendee/313088060

Summary

First Internet reported a 21% year-over-year increase in total revenue for Q1 2026, reaching $43.1 million, driven by a 26% rise in net interest income.

The net interest margin expanded to 2.45%, reflecting proactive balance sheet management and strong deposit franchise performance.

The company demonstrated solid progress in credit quality, with improvements in delinquency and non-performing loans, particularly in the SBA portfolio.

First Internet’s commercial lending pipelines remain robust, and total loans increased to $3.8 billion, with strong production in specific lending areas.

Total deposits grew to $5 billion, bolstered by growth in lower-cost fintech deposits, enhancing balance sheet management flexibility.

Strategic investments in technology and AI are emphasized to enhance customer experience, operational efficiency, and long-term growth.

The company maintained its 2026 guidance but acknowledged potential macroeconomic uncertainties affecting loan growth and other financial targets.

Operational highlights include strong commercial real estate activity and ongoing progress in franchise finance problem loans.

Management expressed confidence in achieving a 1% return on assets by 2027, supported by continued improvements in financial metrics.

Full Transcript

Rebecca (Conference Operator)

Thank you for standing by. My name is Rebecca and I’ll be your conference operator today. At this time, I would like to welcome everyone to the First Internet Bancorp earnings conference call for the first quarter 2026. All lines have been placed on mute to prevent any background noise. After the speaker’s remarks, there will be a question and answer session. If you would like to ask a question during this time, simply press STAR followed by the number one on your telephone keypad. If you would like to withdraw your question, press star one again. Thank you. Please note this event is being recorded. It is now my pleasure to turn the call over to Julia Farra from ICR. You may begin your conference.

Julia Farra

Thank you, Operator. Hello everyone and thank you for joining us to discuss First Internet Bancorp’s first quarter 2026 financial results. The company issued its earnings press release earlier this afternoon and it is available on the company’s website at www.firstinternetbancorp.com. in addition, the company has included a slide presentation that you can refer to during the call. You can also access these slides on the website. Joining us from the management team today are Chairman and CEO David Becker, President and COO Nicole Lorch and Executive Vice President and CFO Ken Labick. David and Nicole will provide an overview and Ken will discuss the financial results and then we’ll open up the call for your questions. Before we begin, I’d like to remind you that this conference call contains forward looking statements with respect to the future performance and financial conditions of First Internet Bancorp that involves risk and uncertainty. Various factors could cause actual results to be materially different from any future results expressed or implied by such forward looking statements. These factors are discussed in the Company’s SEC filings which are available on the company’s website. The company disclaims any obligation to update any forward looking statements made during the call. Additionally, management may refer to non GAAP measures which are intended to supplement but not substitute for the most directly comparable GAAP measures. The press release available on the website contains the financial and other quantitative information to be discussed today, as well as the reconciliation of the GAAP to non GAAP measures. At this time, I’d like to turn the call over to David.

David Becker (Chairman and CEO)

Thank you. Julia, Good afternoon and thank you for joining us on the call. Today we delivered strong first quarter results that demonstrated the resilience and strength of our diversified business model. We generated solid revenue growth, expanded our net interest margin and continued making meaningful progress on credit quality, all the while navigating an uncertain macroeconomic environment. Let me start with some of the highlights for the quarter. Total revenue reached $43.1 million in the first quarter, up 21% year over year, driven by a 26% increase in net interest income. Our fully taxable equivalent net interest margin expanded to 2.45%, a 54 basis point improvement from a year ago and 15 basis points sequentially. This margin expansion reflects the benefits of our proactive balance sheet management strategy and the power of our deposit franchise combined with our scalable nationwide lending platforms. Pre provision net revenue grew 51% year over year to $18.1 million, underscoring our ability to generate strong operating leverage while maintaining disciplined expense management. This performance gives us confidence in our ability to drive sustainable profitability as we continue to work through our credit normalization process. On credit, our overall loan book remains solid and continues to perform in line with industry trends. In addition, we’re seeing tangible evidence that the decisive actions we’ve taken over the past several quarters are yielding favorable results on the two problem portfolios, SBA and Franchise. Our provision for credit losses for the quarter came in better than expected and we’re observing improving trends in our portfolio with delinquency and non performing loans headed in the right direction. The credit trends we’re seeing, particularly in our SBA portfolio, reflect the impact of enhanced underwriting standards, more vigorous portfolio monitoring and responsive problem loan resolution. On the growth front, our commercial lending pipelines remain robust across multiple verticals. Total loans increased to $3.8 billion with particularly strong production in single tenant lease financing and construction lending as well as in one of our emerging verticals, wealth advisory lending. While we maintain appropriately conservative underwriting standards, we’re seeing great opportunities to deploy capital into high quality commercial relationships at attractive yields. Turning to the other side of our balance sheet, total deposits reached $5 billion, up from $4.8 billion in the prior quarter. We continue to benefit from the strength and flexibility of our banking as a service initiatives. Importantly, we’re seeing continued growth in lower cost fintech deposits, which has also allowed us to let higher cost CDs and broker deposits mature without replacement. Our fintech deposit platform also provides us with significant balance sheet management flexibility. During the quarter, average Fintech deposits totaled $2.4 billion, an increase of over 186% from the first quarter of 2025. At quarter end, we had moved approximately $1.5 billion of these deposits off balance sheet, optimizing our asset size while maintaining these valuable customer relationships and the associated fee income streams. This capability is a unique competitive advantage that enhances both our profitability and our capital efficiency in our SBA business. While seasonality and tightened underwriting resulted in softer loan production for the quarter, we’re pleased with the strong foundation we’re building and how the business is positioned for long term profitable growth. To further align our strategy in SBA, we’ve strengthened the business by promoting Gary Carter to the position of National Sales Manager. Gary rejoined us a year ago as our Senior SBA Credit Officer, bringing deep industry expertise, including his role at Live Oak bank, that will help us continue building this business. From the sound foundation, our capital and liquidity position remains solid as we were able to closely manage the size of the average balance sheet while continuing to grow revenue. Regulatory capital ratios remain well above minimum requirements with a total capital ratio of 12.5% and a common equity tier 1 ratio of 8.97%, as well as substantial liquidity coverage. Moving to our strategic investments in technology and artificial intelligence, we continue to invest thoughtfully in digital capabilities that enhance the customer experience, improve operational efficiency and position us for long term growth. These technology investments aren’t just about maintaining our competitive position. They’re also about creating sustainable advantages in how we serve customers, manage risk and drive operational excellence. Looking ahead, we’re navigating an uncertain macro environment from a position of increasing strength. Our diversified business model is generating strong revenue growth. Our deposit franchise provides funding advantages and strategic flexibility. We’ve proven our ability to make difficult decisions and execute effectively. The credit challenges we’ve experienced are manageable in the context of our overall business. We’ve taken decisive action strengthening underwriting standards, enhancing risk management and addressing problem loans proactively. We see the benefits in improving trends and expect continued progress throughout 2026. We are not standing still. We’re investing in AI and technology to enhance efficiency and customer experience, strengthening our commercial banking capabilities, expanding fintech partnerships and repositioning our SBA business on a stronger foundation. We’re confident in our strategy, our team and our ability to deliver value for shareholders. I’ll now turn it over to Nicole for operational highlights including commercial lending, SBA banking as a service and credit.

Nicole Lorch (President and COO)

Thank you David. Starting with commercial real estate, we saw solid first quarter activity with particularly strong production in construction and single tenant lease financing. These businesses continue to perform well with strong credit quality and attractive risk adjusted returns on new originations. We were also pleased to see higher balances in a couple of our emerging verticals, wealth advisory, lending and equipment finance. The pipeline remains healthy with disciplined underwriting and good yields on new commitments. Turning to SBA. As David mentioned in his comments, the deliberate shift we communicated in our last call that prioritizes credit quality over volume combined with a seasonally lighter first quarter resulted in lower originations for the quarter. This translated into lower loan sale volume and lower gain on sale revenue compared to the linked quarter. Regarding gain on sale revenue, while premiums have been strong so far this year, we still expect to retain more production on our balance sheet in future periods as the pricing on certain higher quality deals will not fetch quite the same premiums. In the secondary market, we generally look at a 12 month earn back period when making decisions on whether to sell or hold loans. While this will impact gain on sale revenue for the year, it will be highly additive to net interest income and net interest margin in future periods. Nonetheless, barring any macroeconomic deterioration, we remain optimistic about the previously shared production and gain on sale targets for the full year. Importantly, while we’re being selective about growth in this portfolio, we remain committed to small business lending as a core business. This is an attractive lending vertical with good long term economics and we have the platform, expertise and relationships to compete effectively once we’ve fully worked through this current credit cycle. As to credit performance, we’ve made substantial progress over the past several quarters through proactive and prudent actions. We’ve significantly enhanced our underwriting standards, added experienced talent to our credit and portfolio management teams and implemented more robust monitoring and early warning systems. We’ve also been proactive in working with our borrowers to prevent the formation of non performing loans and we’re seeing Results. As of March 31, delinquencies in the SBA portfolio have improved 118 basis points quarter over quarter and 126 basis points year over year. As we look ahead, our focus in SBA is on durability and consistency rather than near term volume. Loans originated under our revised standards are showing more stable early behavior. While these newer vintages are still early in their life cycle, we’re encouraged by what we’re seeing in terms of borrower performance, responsiveness and overall portfolio dynamics. The operational changes we’ve made across underwriting execution and portfolio oversight are now fully embedded in the business. This enables us to remain selective today while preserving the ability to scale responsibly as conditions normalize. Our objective is an SBA portfolio with attractive long term economics and reduced volatility across cycles and we are building with that goal in mind. In franchise finance, we continue to make progress working through problem loans. Our special assets team was busy during the quarter coming to resolution on several credits. While net charge off activity remained elevated during the quarter, it more than offset non performing loan formation as non accrual franchise finance loans dropped to their lowest level in four quarters. Looking at our banking as a service operations, we continue to see strong momentum with our fintech partners. These relationships provide valuable deposit funding, generate attractive fee income and position us at the forefront of innovation in digital banking. We processed over $82 billion in payments volume during the quarter, an increase of over 260% year over year through a carefully curated partner network, a reflection of our efforts to strengthen and deepen existing relationships while cultivating new partnerships. We are constantly evaluating new partnership opportunities while ensuring we maintain the highest standards of compliance and risk management across the bank. We continue to invest strategically in AI and automation to drive efficiency and enhance customer service. Our strong data foundation, built through previous investments in our data warehouse and integrated data sources, now supports our infrastructure upgrades for AI agent processing while scoping our own proprietary agents. We’ve already deployed third party AI capabilities with measurable impact such as fraud detection agents that screen outbound transfers before processing. Additionally, our virtual customer service agent resolves approximately 45% of inquiries, significantly reducing the burden on human agents and improving response times. The effects of this are validated by the favorable results from the Net Promoter Score Framework and Customer Listening program we implemented in the first quarter. With our consumer and small business banking team out of the gate, our scores are well above industry average. We have built relationships through transparency, delivering on our promises and that loyalty delivers strong returns. The diversity of our business model is another key strength. We have multiple engines driving growth and profitability, our commercial lending is performing well, our consumer lending remains stable, …

Full story available on Benzinga.com

This post was originally published here

ResMed (NYSE:RMD) released third-quarter financial results and hosted an earnings call on Thursday. Read the complete transcript below.

This content is powered by Benzinga APIs. For comprehensive financial data and transcripts, visit https://www.benzinga.com/apis/.

The full earnings call is available at https://event.choruscall.com/mediaframe/webcast.html?webcastid=8xsuC6MA

Summary

ResMed reported an 11% increase in headline revenue for Q3 FY2026, with an 8% growth in constant currency terms, primarily driven by strong performance in device and mask sales.

Gross margin expanded by 290 basis points year-over-year, supported by component cost improvements and supply chain optimizations.

The company announced the acquisition of Noctrix Health, aiming to expand its leadership in the sleep health market with a focus on restless leg syndrome treatment.

ResMed’s strategy focuses on maintaining operational excellence, leveraging a strong balance sheet to invest in business growth, and returning capital to shareholders.

Future guidance remains optimistic with expectations for high single-digit revenue growth and earnings growth exceeding revenue growth, bolstered by ongoing investments in innovation and market expansion.

Full Transcript

OPERATOR

Welcome to the Q3 Fiscal Year 2026 ResMed Earnings Conference Call. My name is Darrell and I will be your operator for today’s call. At this time, all participants are in a listen only mode. Also, please note this conference call is being recorded. Later we will conduct a question and answer session. Let me hand the call to Sally Schwartz, ResMed’s chief investor relations Officer.

Sally Schwartz (Chief Investor Relations Officer)

Thanks Darrell. I want to welcome our listeners to ResMed’s third quarter fiscal year 2026 earnings call. We are live webcasting this call and the replay will be available on the Investor Relations section of our corporate website later today. Our earnings press release and presentation are both available online now. During today’s call we will discuss several non GAAP measures that we believe provide useful information for investors. This information is not intended to be considered in isolation or as a substitute for GAAP financial information. We encourage you to review the supporting schedules in today’s earnings press release to reconcile these non GAAP measures with the GAAP reported numbers. In addition, our discussion today will include forward looking statements including but not limited to expectations about our future financial and operating performance. We make these statements based on reasonable assumptions, however, our actual results could differ. Please review our SEC filings for a complete discussion of risk factors that could cause our actual results to differ materially from any forward looking statements made today. I’ll now turn the call over to Mick.

Mick Farrell (CEO)

Thank you Sally. And before we get into the details discussing our results for the quarter, I’m sure all of you have had an opportunity to see our press release and our announcement that Brett will be retiring and Aaron Bloomer has been appointed our next Chief Financial officer here at ResMed. On behalf of our ResMed board and over 10,000 ResMed employees in 140 countries, I’d like to thank Brett who I’ve had the privilege partner with for 26 years including the last 55 quarters. As a CEO and CFO team, Brett’s been an integral part of my executive team that has delivered growth, expanded access and improved hundreds of millions of lives over two decades. As ResMed’s CFO, Brett has built a financial foundation that has allowed us to deliver strong growth, robust free cash flow and best in class operating margins. Brett has also helped shape the company’s culture and his legacy is embedded in our impact on the lives of many millions of patients worldwide. Brett leaves ResMed in a position of strength with a very disciplined and experienced global financial team. I am tremendously grateful to Brett for his service, his leadership, his friendship and his commitment to ResMed. I’d also like to now welcome Aaron Bloomer to ResMed. Aaron brings more than 17 years of global financial leadership, most recently serving as the CFO of Exact Sciences. He has a strong track record of driving strategic growth, operational excellence, financial discipline across complex global organizations, including prior financial leadership roles at 3M and at Baxter. Aaron’s international perspective will be invaluable here at ResMed as we continue to execute on our global 2030 strategy to accelerate our business and to deliver long term value for our shareholders around the world. We look forward to introducing you to Aaron over the coming quarters. Okay, now Turning to the third quarter, we delivered another set of strong results including 11% growth in headline revenue or 8% growth on a constant currency basis. We delivered operating leverage leading to margin expansion both year on year as well as sequentially resulting in 21% growth in non GAAP earnings per share. A huge thank you to the global ResMed team for their steadfast dedication in serving patients in more than 140 countries worldwide. ResMed continues to build the world’s leading digital health ecosystem, encompassing sleep health, breathing health and healthcare technology delivered in the home. I’d like to return to the three key themes that I’ve been highlighting over the past year. 1. That ResMed is an operational excellence machine and an innovation machine 2 that ResMed’s robust free cash flow and strong balance sheet position us to both invest in the business and return capital to our shareholders and three that ResMed remains a compelling investment opportunity, especially amidst global macro uncertainty. We just continue to deliver the results. I’ll address each of these three themes in my prepared remarks here before we go to Q and A. Our gross margin expansion in the quarter was strong, 290 basis points year over year and 50 basis points of gross margin expansion sequentially. These results demonstrate the operational excellence that is a ResMed hallmark we’ve continued to execute on our pipeline of supply chain optimization initiatives. These efforts, along with our experience from past supply chain perturbations, including Covid impacts, the major recall of a competitor and semiconductor chip shortages, position us well to navigate the current geopolitical uncertainty and any other external impacts to our resilient global supply chain. ResMed also remains an innovation machine. We’ve continued the global rollout of our portfolio of novel fabric based masks. These masks are designed to deliver an elevated comfort experience for patients and they are changing the basis of competition in mask technology. The AirTouch N30i and more recently the F30i comfort as well as the F30i clear have achieved strong early adoption combined with incredibly positive patient feedback and home care provider feedback. And now we also have real world data that shows that the AirTouch N30i drives 6% higher 90 day compliance than its silicone equivalent. Those of you that truly understand the clinical and business relevance of adherence know that those 600 basis points of extra compliance will mean as what that what the 600 basis points of extra compliance will mean as this technology expands. Adherence is the single biggest driver of lifetime value for patients, for physicians, for HME providers and for resmed. Watch this space as fabric technology expands its impact in our full face category with the F30i product lines, both the F30i comfort and the F30i clear. On the device side of our business, we have made further progress with the global rollout of the AirSense 11 platform, including most recently in markets in Latin America and just this month in our fast growing China market. For our China market, as we’ve discussed before, we leverage a local digital ecosystem intentionally separated from our global ecosystems, including integration with platforms such as WeChat and that creates a personalized patient engagement experience. This is an element of our broader strategy to scale our global ecosystem model, encompassing devices, software and data, yet also customized for ecosystems models that target local market needs. ResMed also continues to drive awareness in the sleep medicine clinical community. Our Continuing Medical Education or CME programs include Sleep Medicine Physician Society approved guidelines including the benefits of cpap, APAP and bilevel therapy as the clinical gold standard, the frontline treatment for any patient diagnosed with sleep apnea. Our sleep apnea educational courses have now been completed more than 80,000 times by more than 45,000 unique clinicians. Surveys at the end of these courses show that 78% of these providers intend to change their clinical practices related to improving sleep health and breathing health based on what they learned. We’re following up with these clinicians to ensure that their intentions can translate into actions that benefit patients on their screening, diagnosis and prescription journey. Early feedback suggests more patients being assessed for obstructive sleep apnea and higher numbers of obstructive sleep apnea diagnoses are occurring. We see this in our virtuox numbers as well. We will remain laser focused on continuous improvement of the sleep apnea pathway to ensure patients who need cpap, APAP and BI level therapy can readily access it and be treated for life. On the clinical research front, we continue to invest in and track important studies that provide new evidence in sleep health. Last quarter I noted a study in JAMA Neurology where researchers found that early treatment of obstructive sleep apnea with CPAP may reduce the risk of developing Parkinson’s disease. Further, in the field of neurology and brain health, we are tracking an increased volume of clinical literature showing that sleep apnea is linked to higher risks of Alzheimer’s disease as well as the broader field of dementia. Specifically, a large population based study recently published in the medical journal Thorax analyzed data from more than 2 million adults in the United Kingdom and found that obstructive sleep apnea was associated with an increased risk of all cause dementia and vascular dementia. Notably, individuals with obstructive sleep apnea who were treated with CPAP and did not show they did not show an elevated risk of dementia compared with matched controls that did not have CPAP treatment. This is huge. Additionally, a meta analysis published in the journal Geroscience showed that individuals with apnea have a 33% higher risk of developing dementia and obstructive sleep apnea was associated with a 45% increased risk of Alzheimer’s disease. The growing body of evidence supports increased focus on screening, diagnosis and treatment of sleep apnoea as part of broader health and aging strategies. This is an area of rising cost and rising relevance for payers, providers, healthcare systems, patients as well as their caregivers and loved ones. On the GLP1 front, I’d like to share some new data with you. We looked at patients on Pap who subsequently start GLP1 therapy to see what happened to their pap use versus a control group that only has Pap therapy. For this real world analysis we analyzed a cohort of N equals 1.7 million DE, identified patient records and focused on the clinical and business relevant outcome of mask and accessory resupply. Our findings were that Pap patients who subsequently start GLP1 therapy show higher Pap adherence rates than patients on Pap alone. Specifically, the two year resupply rates are 5.1% higher and the three year resupply rates are 6.2% higher for patients who are on Pap and then start GLP1 therapy versus patients on PAP alone. As highlighted by Eli Lilly’s own clinical trials in this space these two therapies are better. Together this makes sense. Sleep apnea risk factors always include age, gender, craniofacial anatomy as well as weight. obstructive sleep apnea therefore very often persists after even very significant weight loss and still needs to be treated. Cpap, APAP and BI level therapy remain the gold standard for treatment of obstructive sleep apnea and the reason is simple because these therapies are the most efficacious period. Building on our ongoing real world analyses in this space and the ongoing growth of our own mask and accessories business over the last number of quarters and years. We continue to see that patients on a GLP1 both initiate CPAP therapy more and stay on CPAP therapy longer. As an update to our ongoing large scale claims analysis data that is built from a claims database of over 30 million patients, our specifically analysed cohort includes n equals 2.1 million DE identified patients. Our latest update to this analysis is that we are consistently seeing that patients who have scripts for both PAP and and GLP1 are approximately 11% more likely to start on Pap therapy than patients who have a script for Pap alone. They are also more than 3% more likely to have a resupply event at the one year time period and more than 6% more likely to have a resuptly event at the three year time period. These data have remained consistent over the last years as have our very strong masks and accessories business growth. The data are in sync we believe GLP1s are truly a megatrend and a once in a generation demand gen opportunity for ResMed. Both GLP1s and wearables alike are driving more patients to talk with their doctors and ultimately we believe this will lead to more patients coming into the ResMed ecosystem. In order to ensure that these patients receive the care they need, we’re making meaningful investments, both organic in our business and inorganic in capturing and channeling the increased consumer awareness. We want to educate the clinicians to manage the interest and questions that come to them and we want to create life changing healthcare technologies that people love. Watch this space for more investments and partnerships from ResMed in this exciting area of better helping the 1 billion people worldwide impacted by sleep apnea to find their way to screening, diagnosis and ongoing therapy from ResMed. This theme dovetails with my second message which is that ResMed’s strong free cash flow generation and robust balance sheet provide us with significant flexibility to both invest in our business and to return capital to shareholders. We will continue to invest in our digital sleep health concierge capabilities, expanding the ecosystems to help patients quickly move from awareness through testing all the way to being adherent on our therapy for life. I’m excited to announce today that we are expanding our leadership across the broader sleep health market. This week we signed an M and A deal to acquire Noctrix, a company with an FDA de novo classified medical device that treats restless leg syndrome. Known in the medical community by the acronym rls. RLS is the world’s third most prevalent sleep disorder after sleep APNEA and insomnia. RLS impacts approximately 7% of adults globally and around 17 million people in the US alone. RLS has meaningful overlap with our core market of obstructive sleep apnea. RLS treatments from Noctrix are non invasive, clinically proven and drug free, just like our cpap, APAP and BI level therapies. RLS prescriptions are written predominantly by sleep physicians and the flagship product from Noctrix called Nidra, flows through the same HME DME delivery channel that we here at ResMed lead in market share for our other sleep products. We expect to close this transaction on or around June 1, 2026. Brett will talk more about the expected impact to our financials in a few minutes and we can discuss this strategic tuck in acquisition in further detail during Q and A. I’ll just say this that its revenue growth rate is higher than ResMed’s and its gross margin is higher than ResMed’s and we’re very excited about this tuck in the reach of our ResMed brand among sleep physicians and HME providers as well as our national and international distribution channel. Strength makes us the best owner of this scarce asset. The market and clinical need is incredible. 7% of the world’s adult population need our help. Okay with regard to our residential care software business, we continue our disciplined portfolio management approach and work, investing more in high growth areas of the business and looking to find other solutions for the lower growth areas of the the business. We’ve made significant process with our portfolio management work this quarter and I remain confident that we will accelerate RCS revenue back to sustainable high single digit growth with double digit operating profit growth in fiscal year 2027. We’ll have further updates for you over the coming months and beyond. While investing back into our business is our first priority for capital allocation through R and D and sales and marketing, ResMed also returns significant capital to shareholders through our combination of dividends and share repurchases. During the third quarter. We returned $262 million to shareholders through this combination of our quarterly dividend and $175 million in share repurchases. As you’ve seen, we picked up the pace of our share repurchases in the last couple of quarters and will continue to deploy meaningful capital here. In concert with our ongoing investments, we delivered strong operating profit growth and robust free cash flow growth in the third quarter. ResMed remains a compelling investment opportunity amidst global uncertainty. This is my final, third and final point during the third quarter resmed strong revenue growth, gross margin, expansion and disciplined investment approach generated 18% growth in non GAAP operating income and $520 million in free cash flow. Another quarter of above 100% free cash flow conversion. Whether you look back at the last 12 months or at the compound annual growth rate of CAGR across three years, five years or even 10 years, we’ve consistently been generating high single digit revenue growth or higher and earnings growth that steadily outpaced revenue growth. This track record delivered by 10,000 plus Resmedians, combined with the enormous market opportunity we have in front of us, underpins our continued confidence in our five year outlook for high single digit revenue growth and earnings growth higher than revenue growth. We have a clear and sustained leadership market position. We are committed to keep delivering for consumers, for patients, for physicians, for providers, for payers and for our communities that we serve and of course for you listening to this call our shareholders. Okay with that, I’ll hand the call over to Brett in Sydney to go through a deeper dive into our financials and then we’ll open the floor for your questions. Brett, over to you.

Brett

Great. Thanks Mick. In my remarks today, I will provide an overview of our results for the third quarter fiscal year 2026. Unless noted, all comparisons out of the prior year quarter and in constant currency terms were applicable. We had strong financial performance in Q3 Group. Revenue for the March quarter was 1.43 billion, an 11% headline increase and 8% in constant currency terms. Revenue growth reflected positive contributions across our device and mask portfolio and in our software business. Year over year, movement in foreign currencies positively impacted revenue by approximately 39 million during the March quarter. Looking at our geographic revenue distribution and excluding revenue …

Full story available on Benzinga.com

This post was originally published here

FinWise (NASDAQ:FINW) reported first-quarter financial results on Thursday. The transcript from the company’s first-quarter earnings call has been provided below.

Benzinga APIs provide real-time access to earnings call transcripts and financial data. Visit https://www.benzinga.com/apis/ to learn more.

The full earnings call is available at https://viavid.webcasts.com/starthere.jsp?ei=1753411&tp_key=cd51efaaa1

Summary

FinWise reported a decrease in net interest margin to 7.15% from 7.85% in the prior quarter, influenced by adjustments in credit enhanced program expenses.

Non-interest income fell to $14.6 million from $22.3 million, driven by lower credit enhanced income and a decline in BFG investment value.

Total assets decreased to $899.4 million from $977.1 million, with a decline in deposits due to runoff of funding not needed for current asset levels.

Loan originations for Q2 2026 are tracking at a quarterly run rate of approximately $1.4 billion, with a full year expectation of 5% growth.

The company anticipates $8 million to $10 million average monthly growth in credit enhanced balances for 2026, and continues to sell guaranteed portions of SBA loans.

Management remains focused on reducing the efficiency ratio and controlling expenses, while increasing revenues through new partnerships and product developments.

Despite a slow start in Q1, FinWise is confident in its credit enhanced program, expecting meaningful growth from a key partner in upcoming quarters.

The company is exploring AI adoption to improve efficiencies and has seen a headcount increase in fintech business development and operations.

Full Transcript

OPERATOR

In the prior quarter. The increase was driven by the change in estimate of the credit enhanced loans excess spread allocated to origination cost which is a reduction of income to credit enhanced servicing and guaranteed expenses as well as an increase in average balances in the credit enhanced portfolio. Net of the adjustment for credit enhanced program expenses, net interest margin was 7.15% compared to 7.85% in the prior quarter, consistent with our ongoing risk reduction strategy and fourth quarter 2025 onboarding of a new credit enhancement program for which our compensation includes both interest income generated by credit cards and a portion of the interchange generated by the card usage. As we’ve noted on prior calls, we suggest thinking about our net interest income and net interest margin in two distinct ways including and excluding excess credit enhanced income. Non interest income was 14.6 million compared to the prior quarter’s 22.3 million. The sequential quarter decline was primarily driven by lower credit enhanced income and gain on sale revenue as well as a decline in the fair value of our BFG investment reflecting a broader pullback in private company valuations observed in March following heightened global market volatility. As a reminder, credit enhancement income mirrors the provision for credit losses on credit enhanced loans. Partially offsetting the sequential decline in non interest income was higher interchange income driven largely by a full quarter of contributions from the credit card portfolio acquired in mid November 2025. Non interest expense was $28.3 million compared to $23.7 million in the prior quarter. The increase was primarily due to higher credit enhancement guarantee and servicing expenses resulting from the change in estimated allocation of excess spread on credit enhanced loans from contra income origination costs to servicing and guarantee expenses as described earlier as well as an increase in average balances of credit enhanced loans and the resulting growth in the excess spread excluding credit enhancement related items, core operating expenses remained well controlled. The reported efficiency ratio for the quarter was 66.3% versus 50.5% in the prior quarter. Excluding the offsetting accounting effects of the credit enhanced loans, the efficiency ratio was 65.0% for Q1 2026 and 60.6% for Q4 2025. Total assets were 899.4 million as of the end of the quarter compared to 977.1 million in the prior quarter. The decline was primarily due to decreases in interest bearing deposits with small declines in loans held for sale and loans held for investment. Total end of the period deposits were 674.9 million compared to 754.6 million in the prior quarter. The decline was primarily due to runoff of funding, principally non interest bearing deposits and brokered CDs that were not needed to support the lower level of assets. Finally, we continue to operate with a very strong capital position reflected in a bank leverage ratio of 16.8%, nearly double the current well capitalized minimum requirement to be well capitalized. Let me provide forward outlook on some key metrics as we’ve done in prior quarters. Loan originations for Q2 2026 originations through the first four weeks of April are tracking at a quarterly run rate of approximately 1.4 billion loan originations for the full year 2026. While there may be variability quarter to quarter, we are reaffirming 1.4 billion in quarterly loan originations as our baseline reflecting typical seasonality from student lending partners. Annualizing this baseline and applying a 5% growth rate provides a reasonable outlook for full year 2026 originations. We will continue to update our originations outlook each quarter as the year progresses. Origination levels are influenced by several variables including new partner additions and contributions from both established programs and newer launches. Credit Enhanced Balances for full year 2026 we remain comfortable with organic growth in credit enhanced balances of 8 million to $10 million on average per month for 2026. Quarterly results may be lumpy with growth skewed toward the middle and back half of the year. SBA Loan Sales we will continue to follow our strategy of selling guaranteed portions of our SBA loans as long as market conditions remain favorable. That said, we expect this quarter’s gain on sale of loans to better reflect a sustainable quarterly run rate for the year. Quarterly Net Charge Offs we anticipate an approximate range of 4 to 5 million in net charge offs for non credit enhanced loans is a good quarterly number to use in your models for the remainder of this year. Non Performing loan balances for Q2 2026 we think there is potentially as much as $10 million in watch list loans that could migrate to non performing loans in the second quarter. Net Interest Margin we remain comfortable with our prior outlook that when including credit enhanced balances, the net interest margin is expected to increase driven by growth in credit enhanced balances and efforts to lower funding costs. This upward trend is expected to persist until growth in these balances begins to moderate. Conversely, excluding excess credit enhanced income, we anticipate a gradual decline in margin consistent with our ongoing risk reduction strategy. The Efficiency Ratio we remain focused on driving sustainable positive operating leverage with a long term goal of steadily lowering our core efficiency ratio, that is Excluding the credit enhancement accounting effects. That said, there may be periods in which the efficiency ratio may increase tax rate, while multiple factors may influence the actual tax rate. We suggest using 27% in your modeling. With that, we would like to open the call for Q and A operator. Thank you. We will now be conducting a question and answer session. If you would like to ask a question, please press star one on your telephone keypad. The confirmation tone will indicate your line is in the question queue. You may press star two to remove yourself from the queue. For participants using speaker equipment, it may be necessary to pick up the handset before pressing the star keys. We ask that and we’ll pause for just a moment. Our our first question we’ll hear from Joe Yanchunis with Raymond James.

Joe Yanchunis (Equity Analyst)

Hey guys, how are we doing? Good, Joe, how are you? I’m doing well. So I was wondering, can you help size the remaining pool of these legacy SBA credits? And you know, how should we think about the difference between proactively cleaning up, you know, this specific cohort versus there being some fundamental softening in the industry? And then also I understand that you called out the E commerce industry, but is there any specific vintages you could point to where they’re concentrated?

Jim Noon

Yes, let me just walk through. Hey Joe, this is Jim Noon. Let me just walk through, I think the couple pieces there. So to just bound it, it’s about $50 million in performing outstanding balances at the end of Q1 that carry these attributes. As far as, you know, what the attributes are. You know, we had a surge in SBA originations back in 22 and 23, specifically in some of the consumer focused businesses like E commerce. There’s six attributes from a few cohorts there that we zeroed in on. Like I said, it’s about $50 million in remaining outstanding and performing balances at the end of Q1. Really importantly, you know, these attributes are what has led to 75% of the macroeconomic conditions and a similar amount of the unguaranteed loan balances over the last three years. So. So we feel like we’ve identified it, we’ve segmented it, we’re actively managing it. So I think we’re in good …

Full story available on Benzinga.com

This post was originally published here

Emergent BioSolutions (NYSE:EBS) held its first-quarter earnings conference call on Thursday. Below is the complete transcript from the call.

This content is powered by Benzinga APIs. For comprehensive financial data and transcripts, visit https://www.benzinga.com/apis/.

The full earnings call is available at https://edge.media-server.com/mmc/p/qw3ajghx/

Summary

Emergent BioSolutions reported Q1 2026 revenue of $156 million, exceeding guidance, with an adjusted EBITDA of $36 million.

The company has reduced its net debt by approximately 22% in 2025 and aims for further improvement.

Strategic initiatives include expanding the MCM business internationally and pursuing accretive external opportunities.

Emergent BioSolutions has secured a $140 million multi-product agreement with the Government of Canada and a $54 million contract with ASPR.

The company announced a strategic manufacturing partnership with SAB Biotherapeutics to advance a type 1 diabetes autoimmune candidate.

Full Transcript

OPERATOR

Good day and thank you for standing by. Welcome to the Q1 2026 Emergent BioSolutions earnings conference call. At this time, all participants are in a listen only mode. After the speaker’s presentation, there will be a question and answer session. To ask a question during the session, you’ll need to press star 11 on your telephone. You’ll then hear an automated message advising that your hand is raised. To withdraw your question, please press star 11 again. Please be advised that today’s conference is being recorded. I would now like to hand the conference over to your first speaker today, Frank Vargo, Vice President Treasurer. Please go ahead

Frank Vargo (Vice President Treasurer)

Good afternoon everyone and thank you for joining us at Emergent discusses its operational and financial results for the first quarter of 2026. As is customary, today’s call is open to all participants. It’s being recorded and is copyrighted by Emergent BioSolutions. In addition to today’s press release, a slide presentation accompanying this webcast is available to all webcast participants. Turning to Slide 2 during today’s call, Emergent may make projections and other forward-looking statements related to its business, future events, prospects or future performance. These forward-looking statements are based on our current intentions, beliefs and expectations regarding future events. Any forward-looking statements speak only as of the date of this conference call and except as required by law, Emergent BioSolutions does not undertake to update any forward looking statement to reflect new information, events or circumstances. Investors should consider this cautionary statement as well as the risk factors identified in Emergent’s periodic reports filed with the SEC when evaluating these forward looking statements. During today’s call, Emergent may also discuss certain non GAAP financial measures that include adjustments to GAAP figures to provide additional transparency regarding the company’s operating performance. Please refer to the tables included in today’s press release. Turning to slide 3, the agenda for today’s call includes remarks from Joe Bapa, President and Chief Executive Officer, who will provide an update on the Company’s leadership in public health, preparedness, business performance and key highlights. Rich Lindahl, EVP and chief financial officer, will then review the first quarter 2026 financial results and provide an update on the full year 2026 guidance. Joe will conclude with a discussion of the Company’s key catalysts for growth, followed by a question and answer session. Finally, for the benefit of those who may be listening to the replay of this webcast, this call was held and recorded on April 30, 2026. Since that time, Emergent may have made announcements related to topics discussed during today’s call. With that, I would now like to turn the call over to Joe Poppin

Joe Poppin

Thank you, Frank and good afternoon everyone. Welcome to our first quarter 2026 earnings call. This is Joe Papa. I’m joined today by Rich Lindell, our Chief Financial Officer. Let’s turn to Slide five. Our aspiration at Emergent is to be the leader in solving public health threats around the world. Over the last 25 years we have built what we believe is the most diverse biodefense product portfolio in the world. Our medical countermeasures address anthrax, smallpox, mpox, Ebola, botulism and complications from smallpox vaccination alongside the leading branded Naloxone franchise with our Narcan nasal spray which has a decade of trusted brand leadership. We believe in our unique position within the industry demonstrate just how public private partnerships are critical for national security. Turning to Slide 6 Since implementing our multi year transformation plan in 2024, we have stabilized and rightsized the company in order to provide Emergent with a strong foundation for future growth. 2026 marks a pivotal year of our transformation as we invest in high growth opportunities. I’m pleased to note that this process is now well underway. We are focusing on segment revenue growth and improved operating performance. We are generating strong cash flow for continued investment in internal R and D and quality capabilities. We have identified product acquisition opportunities that address unmet medical needs and have the potential for sustainable long term revenue growth. Debt reduction will remain a priority for us. In 2025, we reduced our net debt levels by approximately 22% and we have planned for further improvement on our balance sheet and credit ratings. Collectively, these activities are about putting in place the foundations for creating sustainable long term value creation. To move to Slide 8, we’ll take a look at our first quarter highlights. Thanks to the great efforts of our emerging team, our first quarter results are evident in both our top and bottom line performance. We reported first quarter revenue of $156 million which exceeded the high end of our guidance range and was ahead of internal expectations. Adjusted EBITDA came at $36 million, also above our internal expectations representing a 23% margin is driven by continued efforts to deliver a lean and operationally efficient customer centric business model. For example, net working capital improved by over $100 million since Q1 2025. We improved our cash balance by $11 million versus the prior year to $160 million and our total liquidity increased to $260 million. Our strong cash position enabled the repayment of $110 million in debt last year on the capital allocation side, we continue to create value In April we announced the refinancing of our prior term loan which enabled us to secure a more favorable interest rate. We also amended our revolver to $50 million and established a new delayed draw term loan facility for 75 million. We also continued our share repurchase program, buying back $9 million in shares in the first quarter. Since the start of the share repurchase program in 2025, Emergent has repurchased approximately $34 million of shares. Turning to our business performance overall, MCM performed very well reflecting increased global demand and strategic diversification in our international market which now represent 37% of our total MCM revenue. We received four contracted product orders in the quarter. With respect to the NALAXO business, we continue maintaining the shared leadership. We command a competitive pricing strategy and recently launched our newest product offering the Narcia Naval Spray Carrying Case and a multi pack configuration, both of which are already performing very well in the first month of launch. We believe on slide 9 the world is an increasingly dangerous place and public health preparedness in the face of potential threats is critical. We are proud of our long standing partnership with the Government of Canada and in Q1 we announced a $140 million multi product agreement. We also executed $54 million big award with ASPR and approximately 21.5 million delivery order to supply Biothrax to the Department of War. Our MCM business represents an important driver of our future growth and with the added flexibility from our recent financing we see multiple opportunities to acquire high growth and complementary products to our MCM portfolio. Our mission on Slide 10 to protect the stabilize is answered every day with the work we do to …

Full story available on Benzinga.com

This post was originally published here

On Thursday, Sinclair (NASDAQ:SBGI) discussed first-quarter financial results during its earnings call. The full transcript is provided below.

Benzinga APIs provide real-time access to earnings call transcripts and financial data. Visit https://www.benzinga.com/apis/ to learn more.

Access the full call at https://www.webcaster5.com/Webcast/Page/2063/53843

Summary

Sinclair Inc reported a strong financial performance for Q1 2026, with total revenue up 4% year over year to $807 million and adjusted EBITDA increasing by 13% to $126 million.

The company is focused on deleveraging, having retired $165 million in term loans at a discount, resulting in a $12 million annual cash interest expense saving.

Sinclair Inc reaffirmed its full-year 2026 guidance, citing strong expectations for political advertising and major sports events, including the FIFA World Cup, which is expected to drive significant viewership and revenue.

Strategic initiatives include closing on partner station buy-ins and completing accretive duopoly transactions, with an ongoing focus on optimizing the broadcast portfolio.

Operational highlights include substantial growth in core advertising and the success of Tennis Channel, which recorded its most-viewed month ever in March 2026.

Management discussed the broader industry issues such as the FCC’s inquiry into the sports media marketplace and potential regulatory impacts on live sports broadcasting.

Sinclair Inc is preparing for a potential spin-off of its Ventures division, though it prefers to align this with a broadcast business combination.

The company is actively exploring the use of AI for both cost reduction and revenue enhancement, with AI tools being rolled out across the workforce.

Full Transcript

OPERATOR

Good day everyone and welcome to the Sinclair first quarter 2026 earnings conference call. At this time, all participants are placed on a listen only mode and we will open the floor for your questions and comments after the presentation. It is now my pleasure to hand the floor over to your host, Chris King, Vice President of Investor Relations. Sir, the floor is yours. And ladies and gentlemen, please remain on the line while we reconnect the speaker to the conference room. Thank you.

Chris King (Vice President of Investor Relations)

Good afternoon everyone and thank you for joining Sinclair’s first quarter 2026 earnings conference call. Joining me on the call today are Chris Ripley, our President and Chief Executive Officer, Narender Sahai, our Executive Vice President and Chief Financial Officer and Rob Weisford, our COO and President of Local Media. Before we begin, I want to remind everyone that slides for today’s earnings call are available on our website, sbgi.net on the events and presentations page of the Investor Relations portion of the site. A webcast replay will remain available on our website until our next quarterly earnings release. Certain matters discussed on this call may include forward looking statements regarding, among other things, future operating results. Such statements are subject to several risks and uncertainties. Actual results in the future could differ from those described in the forward looking statements because of various important factors. Such factors have been set forth in the Company’s most recent reports as filed with the SEC and included in our first quarter earnings release. The Company undertakes no obligation to update these forward looking statements. Included on the call will be a discussion of non GAAP financial measures, specifically adjusted ebitda. This measure is not formulated in accordance with GAAP and is not meant to replace GAAP measurements and may differ from other companies uses or formulations. Further discussions and reconciliations of the company’s non GAAP financial measures to comparable GAAP financial measures can be found on our website. Please note that unless otherwise noted, all year over year comparisons throughout today’s call are presented on an as reported basis. Let me now turn the call over to Chris Ripley.

Chris Ripley (President and Chief Executive Officer)

Thank you Chris and good afternoon everyone. Let me begin on slide 3. We delivered a strong first quarter with results that reflect the consistency of the broadcast business and the growth potential of Tennis Channel for the quarter Total revenue of 807 million was up 4% year over year, while adjusted EBITDA of 126 million grew by 13%. Distribution revenue increased by 2% year over year as modestly improved subscriber trends continued and we’re starting to see the benefit of our partner station buy ins. Net retrans revenue was also up year over year. In addition, we continue to see growth in our core advertising business. Core advertising grew 4% year over year in the first quarter, a result we were pleased with given our underexposure to NBC, which delivered an exceptionally strong quarter due to its affiliates to its affiliates on the back of the Super Bowl, Winter Olympics and NBA. Looking ahead, Fox, our largest affiliation, will carry a record schedule of World cup soccer matches on the broadcast network in June and July, ahead of the political ramp in the fourth quarter. Turning to execution across our broader strategic priorities, we have built real momentum. We’ve now closed on a substantial majority of our JSA and LMA partner station buy ins with only a small number remaining and we expect the full 30 million in annualized synergies in 2026. We also recently completed two accretive duopoly transactions in Providence and Tulsa. With several smaller portfolio optimization discussions underway, our strategic review of the broadcast business remains active. As previously discussed, our ideal path forward is a broadcast combination concurrent with a venture separation. We remain Scripps’ largest shareholder and our perspective on the strategic logic of the combination is unchanged from what we shared previously within Ventures. The portfolio generated 12 million of cash distributions during the quarter, ending with $451 million of cash. That liquidity provides flexibility as we advance our venture separation planning. As a result of our first quarter results and current forecast, we are reaffirming our full year 2026 guidance. And finally, we continue to work to strengthen our balance sheet. Earlier this month, we retired approximately $165 million in term loans at a discount through an unmodified reverse Dutch auction. As a result, we will save approximately $12 million in annual cash interest expense. As evidenced by this transaction, deleveraging remains a top priority. We ended the quarter with total debt of $4.4 billion and total liquidity of approximately $1.5 billion, including total cash of $844 million. We are pleased with our first quarter financial and operational results. Our team is executing with discipline across multiple priorities and we are well positioned for the remainder of 2026. The industry continues to await several important decisions that are now in front of the Federal Communications Commission, while the recent California litigation involving the NEXSTAR TEGNA transaction took up much of the broadcast regulatory headlines over the past few weeks and has introduced some near term uncertainty on timing. We believe the broader environment remains constructive for local broadcasters, and we continue to feel optimistic about the direction of significant issues. Both the FCC and the Department of Justice approved the nexstar acquisition of Tegna with no material conditions, and we remain pleased with the overall deregulatory tone from Washington. I won’t rehash most of those other issues which we discussed on our fourth quarter call in February, but one development is worth noting. In late February, the FCC launched an inquiry into the Sports Media Marketplace examining how streaming exclusives affect consumers, broadcasters and free over the air access. Turning to Slide 5 since the launch of the FCC inquiry on February 25, well over 10,000 comments have been submitted on the FCC’s sports media marketplace inquiry, making it one of the most commented on inquiries in commission history. As every television viewer and sports fan knows all too well, the fragmentation of live sports programming is causing increasing customer frustration with both higher costs and confusion around where the games are televised. With 96 of the top 100 most watched telecasts last year being live sports broadcasts, including record ratings across almost every major sport, this has become an increasingly important topic for both consumers and regulators. Broadcast delivers what no other platform can the widest reach and the lowest cost to the consumer. The numbers make the point. The NFL Thanksgiving game on February drew 57.2 million viewers, the most watched regular season NFL game ever on Fox. The Amazon NFL game the very next day drew only 16.3 million. Same league same week, roughly three and a half times the audience on broadcast. Meanwhile, last year NFL games aired on 10 different services, which according to some estimates could cost a consumer over $1,500 to watch all of the games, even though the large majority of those games aired free over the air on broadcast networks. Live sports is the cornerstone of the broadcast ecosystem. It drives mass audiences and it underwrites the financial model that sustains local television stations and the local journalism they produce. The migration of major sporting events behind streaming paywalls is not just bad for consumers, it risks eroding one of the last shared viewing experiences we all have, and it pressures the very business model that funds local news and community programming. Maintaining broad and free access to live sports should remain a top priority for policymakers as they continue to examine this issue that has clearly struck a nerve with viewers and policymakers across the country. With that, let me turn the call over to Rob to discuss operational highlights in the quarter.

Rob Weisford (Chief Operating Officer and President of Local Media)

Thank you Chris and Good afternoon everyone. Let me walk through our operational performance and how we’re positioned heading into the remainder of 2026. Starting on slide 6, we delivered solid growth in core advertising with first quarter core revenue up 4% year over year driven by the strength in digital and our acquisition of Digital Remedy. Advertisers continue to prioritize platforms that provide scale, interactivity and live engagement, and broadcast consistently delivers on all three. Notably, our NBC affiliates delivered very strong results benefiting from the convergence of major live sporting events. The super bowl was the second most watched telecast of all time in the U.S. the Winter Olympics were the most watched Winter Olympic Games in 12 years on broadcast television, and the NBA continues to deliver solid ratings for the network. While we are underweight NBC, we are overweight Fox, which is our largest network affiliation, and we are already seeing strong demand for the FIFA World cup soccer tournament of Fox. This June and July, notably, 70 of the 104 total matches will air live on the linear Fox broadcast stations, with 40 matches scheduled for prime time. This is exactly the kind of appointment viewing broadcast is built for, delivering mass audience with unmatched reach across the country, our core advertising continues to benefit from Digital Remedy, our programmatic digital advertising platform. As ad dollars increasingly shift across linear connected TV and digital, Digital Remedy allows us to capture demand across all those channels rather than being limited to linear that matters in the political cycle too. Beyond linear, we continue to see engagement growth across podcasts and social platforms. Recent activations like the Tailgate Tour and the Block demonstrate our ability to engage audience beyond traditional broadcast while creating meaningful opportunities for our advertising partners. Our next activation will be at the World cup, hosted by unfiltered soccer stars Landon Donovan and Tim Howard, two of the most capped players in the US national team history. In summary, Sinclair continues to execute well on its core broadcast business. Broadcast’s differentiated role is strengthened in a year like this political and Sports Savvy 2026 with both ratings and subscriber trends showing positive momentum. Turning to Slide seven, Tennis Channel continued the momentum around live sports and delivered an exceptional quarter and a historic month of March. March 2026 was Tennis Channel’s most watched month ever, led by the Indian Wells and Miami Open tournaments attracting record audiences. Miami Open Women’s final between Sabalanca and Goff was the most watched women’s match in Tennis Channel history, breaking a viewership record set just two weeks earlier at the Indian Wells women’s final. In fact, four of the top five most watched matches of all time for Tennis Channel occurred in March as Tennis Channel household viewership increased by 19% year over year in the quarter. In addition, Tennis Channel has hit record D2C subscriber numbers in recent weeks, driven in large part through its recent launch with Amazon prime video. Tennis Channel 2, the network’s fast channel, which launched on Peacock in January, will continue to feature Women’s Day every Tuesday, a programming day exclusively dedicated to women’s tennis, reinforcing our leadership in women’s sports programs. While we remain disciplined on expenses, we are also making thoughtful high return investments to support the long term growth of the franchise, extending our content rights portfolio, scaling our direct to consumer platform and building out Tennis Channel 2 as well as our digital platforms. Tennis Channel is a differentiated premium sports asset and we are vesting behind it accordingly. We are fully bullish on the network. Lastly, we continue to build out Amazing America 250 From Neighborhood to Nation, a multi platform celebration of US history, culture, innovation and community spirit. Programming will expand as we approach the 250th anniversary of our nation’s founding on July 4th. Let me now turn the call over to Dorinda to discuss the first quarter financial results in more detail.

Dorinda

Thank you Rob and good afternoon everyone. Turning to Slide 8, I’m pleased with our first quarter results that reflect strong execution across the business. At the total company level, revenue was $807 million, up 4% year over year. Distribution revenue of $458 million grew 2% supported by lower subscriber churn across key MVPDs and incremental benefit from our partner station buy ins, both of which also contributed to growth in net retransmission revenue. Core Advertising revenue of $305 million also grew 4% reflecting the contribution from Digital Remedy acquisition that closed in March of last year and continued strength in live sports including the Winter Olympics and NFL playoffs. Adjusted EBITDA was $126 million, up 13% year over year. The increase reflects both revenue strength and operating leverage, with operating expenses absorbing the cost base from the Digital Remedy acquisition. While core operating costs remained well controlled in the local media segment, total revenue of $701 million benefited from the same distribution and advertising trends. Distribution revenue of $402 million and core advertising revenue of $261 million both showed modest growth year over year. Segment adjusted EBITDA of $117 million reflects lower programming and production costs, lower network compensation related to prior year station sales, and disciplined SG&A expenses. Within the Tennis segment, Total revenue of $70 million was also up year over year. Adjusted EBITDA of $20 million was below last year’s first quarter reflecting an increase in sales and programming expenses as we continue to invest behind the network’s growth that Rob referenced earlier. Capital expenditures on a consolidated basis are $15 million. Overall. The quarter reflects broad based execution, improving subscriber trends and solid advertising demand across the company. Turning to slide 9 I’d like to provide an update on Sinclair Ventures consistent with the strategy we previously outlined. Ventures continues to shift from passive minority investments towards majority controlled operating businesses with a focus on durable, non discretionary and recurring revenue streams that convert strongly to free cash flow. Ventures generated $12 million in cash distributions during the quarter primarily from the secondary market monetization of one on one minority investment following the $104 million for the full year 2025. These distributions demonstrate our ability to monetize investments while preserving upside in the broader portfolio. We also remain selective on new capital deployment with incremental investments of $6 million in the quarter. Ventures entered the quarter with $451 million in cash and cash equivalents. That liquidity provides meaningful optionality as we advance separation planning and continue to evaluate capital allocation opportunities. Overall, as we advance our work towards a potential separation, Ventures continues to generate meaningful cash while repositioning the portfolio toward greater operational control and long term value creation. Turning to slide 10 as Chris referenced earlier, in early April we settled an unmodified reverse Dutch auction for our term loans retiring $165 million in par value at a discount. The delevering transaction is expected to reduce our annual cash interest expense by approximately $12 million including borrowings under the AR facility. Total Sinclair Television Group or STG debt was $4.4 billion. Our nearest material maturity excluding the AR facility continues to be in December of 2029 at quarter end as defined in our credit agreement, stg net first out first lien leverage was 1.5 times, net first lien leverage was 3.8 times and net leverage was 5.1 times. Net leverage fell by 2/10 of a turn sequentially and these figures do not yet reflect the April term loan retirements that I referenced earlier. We ended the quarter with $844 million in consolidated cash including $392 million at STG and $451 million at ventures including revolver availability. Total liquidity was approximately $1.5 billion. Before turning the call back to Chris, let me briefly frame our first quarter results and outlook in the context of the broader operating environment. When we introduced 2026 full year financial Guidance in February we planned for stable core advertising trends supported by a sports heavy broadcast calendar while remaining appropriately cautious given macro headwinds in certain categories. Since then, given the conflict in the Middle east, the external environment has evolved, consumer sentiment has moved meaningfully lower, inflation expectations have ticked higher, and advertiser visibility in select areas is somewhat more measured than a quarter ago. At the same time, the drivers underpinning our full year outlook remain firmly intact. A record midterm political cycle with competitive races across several of our key markets, the FIFA Soccer World cup anchoring a sports heavy broadcast calendar in the second and third quarters and steady distribution supported by moderating subscriber churn, and expected benefit from our partner station buy ins that are now substantially complete. Based on that balance, we are reaffirming our 2026 full year guidance today. Let me now turn the call back over to Chris for closing comments. Before we open the call to questions

Chris Ripley (President and Chief Executive Officer)

as we wrap up on Slide 11, let me briefly summarize our quarter. First, we continued to execute and build momentum on our core broadcast business. We delivered strong results across the board that translated into meaningful cash generation with stable core advertising trends, audience strength anchored by live sports and improving subscriber churn across key MVPD partners Live sports continues to drive the kind of appointment viewing audiences that no other platform can match. Both the FCC and DOJ are now examining facets of the live sports broadcasting marketplace and we believe they are asking the right …

Full story available on Benzinga.com

This post was originally published here

Beazer Homes USA (NYSE:BZH) held its second-quarter earnings conference call on Thursday. Below is the complete transcript from the call.

This transcript is brought to you by Benzinga APIs. For real-time access to our entire catalog, please visit https://www.benzinga.com/apis/ for a consultation.

View the webcast at https://edge.media-server.com/mmc/p/okazztzm/

Summary

Beazer Homes USA reported second-quarter results with community count, sales pace, ASP, and gross margin aligning with expectations.

The company achieved a sales pace of over two per community per month and improved its Houston business year-over-year.

Beazer Homes USA increased its liquidity by expanding its revolver and repurchased over a million shares at about 60% of book value.

Challenges such as higher mortgage rates and energy costs have made the company more cautious, reducing the likelihood of full-year EBITDA growth.

The company is focused on long-term goals of growing profitability, increasing community counts, and efficiently allocating capital through share repurchases.

Guidance for the third quarter includes selling over 1,000 homes, closing about 900 homes, and generating $30 million from land sales.

The balance sheet remains strong with approximately $400 million in liquidity, and no debt maturities until October 2027.

Management emphasized their strategy of offering energy-efficient homes with low operational costs as a competitive advantage.

Full Transcript

OPERATOR

Good afternoon and welcome to the Beazer Homes Earnings Conference call for the second quarter ended March 31, 2026. Today’s call is being recorded and a replay will be available on the company’s website later today. In addition, PowerPoint slides intended to accompany this call are available in the Investor Relations section of the company’s website@www.beazerhomes.com. at this point, I will turn the call over to David Goldberg, Senior Vice President and Chief Financial Officer.

David Goldberg (Senior Vice President and Chief Financial Officer)

Thank you. Good afternoon and welcome to the Beazer Homes Conference Call discussing our results for the second quarter of fiscal year 2026. Joining me today is Alan Merrill, our Chairman and Chief Executive Officer. After our prepared commentary, we will open up the line and Alan and I will be happy to take your questions. Before we begin, you should be aware that during this call we will be making forward looking statements. Such statements involve known and unknown risks, uncertainties and other factors described in our SEC filings which may cause actual results to differ materially from our projection. Any forward looking statement speaks only as of the date this statement is made. We do not undertake any obligation to update or revise any forward looking statements, whether as a result of new information, future events or otherwise. New factors emerge from time to time and it is simply not possible to predict all such factors. I will now turn the call over to Alan.

Alan Merrill (Chairman and Chief Executive Officer)

Thanks Dave and thank you for joining us. I’m going to organize my comments today around three topics, the highlights from our second quarter results, our responses to a challenging demand environment, and a review of our progress toward our multiyear goals relative to the second quarter. Despite some new challenges in the macro environment, we were encouraged that our community count, sales pace, ASP and gross margin all came in right around our expectations. Of particular note, getting our sales pace back over two per community per month was important, as was the improvement in our Houston business, which was up nicely year over year. Digging a little deeper into the quarter, we were able to drive to be built sales higher to 43% of gross sales, the highest level since the first quarter of 2024. And our new communities, which we define as beginning sales after March of last year represented 34% of gross sales, up sequentially from 24% last quarter. Both of these positive mix dynamics will contribute to higher ASPs and margins in the back half of the year. From a balance sheet perspective, we have maintained a robust lot pipeline with a healthy 60% controlled by options during the quarter, we increased liquidity by upsizing our revolver and we grew book value per share by buying back more than a million shares at about 60% of book bottom line Our results reflected solid execution in a challenging operating environment. Last quarter we described the environment and operational results that would be necessary for us to grow EBITDA this year. Among other items, this included a sales pace above 2.5 in the second half of the year and 300 basis points of margin expansion by the fourth quarter. Several macro headwinds developed since then, notably higher mortgage rates and surging energy costs. Both are readily evident to potential home buyers and both undoubtedly contributed to the recent drop in consumer sentiment. While these challenges may prove temporary, they’ve left us more cautious and reduced the likelihood of achieving sufficient pace and margin expansion to support full year EBITDA growth. We now think a sales pace above 2 for the balance of the year and margin expansion between 200 and 300 basis points by the fourth quarter are more likely and achievable outcomes. With the additional benefit of a sizable mix driven increase in ASPs and a modest ramp in community counts, we are positioned to sequentially improve profitability and returns in the next two quarters. In this environment, we could probably achieve a higher sales pace by increasing spec starts and offering more incentives. We think that would do little more than spike revenue for a few quarters and burn through our valuable lot position. More importantly, it would undermine the progress we are making in getting paid for delivering a more efficient home and the industry’s highest rated customer experience. Our positive margin progression remains intact, but it is built on more than just lower construction costs. It also reflects a growing share of closings from both our newer and our higher priced existing communities where we are effectively competing on quality and value. While our sales pace isn’t where we want it yet, want it yet, we are actively building awareness with buyers, realtors and appraisers that our homes are different, perform better and cost a lot less to operate. We believe this approach will yield greater and more durable returns than simply putting more low feature specs on the ground. Beyond improving margins, we believe the capital allocation decisions we are making will also improve our returns. Land prices remain quite resilient and yet our share price implies our existing assets are worth a lot less than we paid for them, which we know is not the case. That’s why our 2026 capital allocation approach has been to improve the efficiency of our land spend, sell non strategic assets at or above book value and buy back stock at a meaningful discount to book value, all while preserving our Growing Community Count on our last call, we committed to completing our existing $$72 million repurchase authorization this year and we executed 30 million in the second quarter. Upon completion of the full authorization, we will have bought back nearly 20% of our shares since early fiscal 25. Taken together, growing profitability and efficiently allocating capital will increase book value per share this year. Now, looking further out, we are still heading toward our longer term multi year goals for growth deleveraging and book value per share accretion, a combination we believe produces the best path for shareholder value creation. While progress isn’t easy to synchronize in a difficult environment, we continue to pursue each goal. With 169 communities at quarter end, we are still Targeting more than 200 active communities by the end of fiscal 27. Sales paces in existing communities and the attractiveness of incremental land purchases will determine our path to reaching this goal. We remain focused on deleveraging to the low 30% range by the end of fiscal 27. However, as we indicated last quarter, we are prioritizing share repurchase activity in fiscal 26 and expect to make progress on our leverage goal next fiscal year. Growing book value per share into the 50s remains our goal through both earnings and stock buybacks. At quarter end, book value per share was up versus last year finishing at nearly $42 using weighted average shares and nearly $43 using period end shares. With that, I’ll turn the call over to Dave.

David Goldberg (Senior Vice President and Chief Financial Officer)

Thanks Alan. During the second quarter we sold 1,048 homes with a pace of 2.1 sales per community per month with pace increasing from January to February and plateauing in March. On a positive note, our spec sales mix continued to move lower at 57% in the quarter. This is down from 61% in the first quarter and well below the mid to high 70% range we saw in the back half of …

Full story available on Benzinga.com

This post was originally published here

Blue Owl Capital Inc. (NYSE:OWL) disclosed that it trimmed its SpaceX stake by roughly half, with the sale priced off a $1.25 trillion valuation. Co-CEO Marc Lipschultz said the partial exit locked in a substantial gain while allowing the firm to retain its remaining stake.

Lipschultz told analysts on a conference call, “Specifically at SpaceX … we made about 10x our money on that investment,” and added, “We’ve sold about ⁠half of it at a $1.25 trillion valuation, still holding about half of it,” Reuters reported.

One of the firm’s vehicles, Blue Owl Technology Finance Corp, put $27 million into SpaceX equity in 2021 and has repeatedly marked up that position since then. 

A securities filing shows the fund carried its SpaceX shares at $195 million at the end of 2025. That year-end 2025 figure implied a $105 million increase over the year, and SpaceX was the largest driver of the fund’s unrealized appreciation, Reuters added. 

The same filing indicated the portfolio is largely software-focused, with SpaceX standing out as its lone aerospace equity holding.

Lipschultz said the SpaceX profit matters when other parts of a credit book take hits, telling those on the call that “those are the ways… we can offset some ⁠of those losses.” He also said Blue Owl first worked with SpaceX …

Full story available on Benzinga.com

This post was originally published here

When the Dow Jones Industrial Average’s best-performing stock loaded onto the screen Thursday, the first instinct was to check for a data error. Caterpillar Inc. (NYSE:CAT) had returned 185% over the trailing twelve months.

The second-best Dow performer, Nvidia Corp. (NASDAQ:NVDA), had returned 80%.

A bulldozer maker more than doubled the return of the chip company that defined the AI trade.

Then Caterpillar reported first-quarter 2026 results before the open and the stock ripped roughly 9% to a fresh all-time high near $889.

The catalyst is no longer hiding.

Best-Performing Dow Jones Stocks Over The Past Year

Company 1-Year Performance
Caterpillar Inc. +190.74%
Nvidia Corp. +85.07%
The Goldman Sachs Group Inc. (NYSE:GS) +68.76%
Cisco Systems Inc. (NASDAQ:CSCO) +57.60%
Johnson & Johnson (NYSE:JNJ) +47.12%
Chevron Corp. (NYSE:CVX) +42.53%
Amazon.com Inc. (NASDAQ:AMZN) +40.60%
Updated as of April 30, 2026

data-variant=”card”
data-news-mode=”manual”

>


Read Also:

Meta’s Drop Is Historic: Is The Buy Opportunity Even Bigger?

This post was originally published here

St. Joe (NYSE:JOE) reported first-quarter financial results on Thursday. The transcript from the company’s first-quarter earnings call has been provided below.

This transcript is brought to you by Benzinga APIs. For real-time access to our entire catalog, please visit https://www.benzinga.com/apis/ for a consultation.

The full earnings call is available at https://edge.media-server.com/mmc/p/46pm7w97/

Summary

St. Joe reported a 5% increase in revenue and an 8% increase in operating income for Q1 2026, with hospitality revenue up 13% and real estate revenue up 4%.

Net income decreased by 21% due to a decline in equity income from joint ventures, particularly in the Latitude Margaritaville WaterSound project.

The company executed a contract with Pulte Group for 2,653 home sites in a new area plan, marking Pulte’s entry into the Northwest Florida market.

There was an improvement in gross margins for hospitality (24% from 18%) and leasing revenue (61% from 55%) compared to Q1 2025.

The company is executing a multifaceted capital allocation strategy with investments in higher-margin projects and divestments from lower-margin ones.

Operational highlights include the execution of a long-range utility agreement and progress on various residential and commercial projects.

Management remains optimistic about future growth, driven by a strong regional demand and strategic partnerships, while maintaining a focus on sustainable business models.

Full Transcript

OPERATOR

Good day and thank you for standing by. Welcome to the St. Joe Company first quarter 2026 earnings conference call. At this time, all participants are on a listen only mode. After the speaker’s presentation there will be a question and answer session. If you wish to ask a question via the webcast, please use the Q and A box available on the webcast link at any time during the conference, please be advised that today’s conference is being recorded. I would now like to turn the conference over to your speaker Host for today, Mr. Jose Gonzalez, President, CEO and the Chairman of the St. Joe Company. Please go ahead sir.

Jose Gonzalez (President, CEO and Chairman)

Thank you and good afternoon. I’m Jose Gonzalez, president, CEO and chairman of the St. Joe Company. It is my pleasure to welcome you to our quarterly earnings call. I’m joined today by Marek Bakun, our Chief Financial Officer. On Wednesday after the market closed, we issued our first quarter earnings 2026 earnings press release which can be found in the Investor Relations section of our corporate website at joe.com this afternoon we are continuing our commitment to quarterly earnings calls to provide our shareholders and the investor community with an opportunity to ask questions about our business and performance. We have always been an open and transparent company that welcome all feedback and opinions. Because of the types of assets that we own, we always encourage shareholders to visit us in person so they may assess firsthand the progress of the region and of our assets. If you want to send us questions for later in the call, you may do so by visiting the top right hand corner of your screen where the words Submit a Question are visible. Clicking on that text will take you to the text entry box where you can type in your question and then click Submit for later in the call. Before we begin discussing our results and answering your questions, I would like to remind everyone that Wednesday’s press release and statements made during this call include forward looking statements within the meaning of the Private Securities Litigation Reform act of 1995 These statements are subject to risks and uncertainties that could cause actual results to differ materially from our expectations and projections. Such risks and uncertainties include the factors set forth in the earnings release and in our filings with the securities and Exchange Commission. Additionally, during today’s call we will discuss non GAAP measures which we believe can be useful in evaluating our performance. A reconciliation of these measures can be found in our earnings release. Let’s go ahead and get started. We assumed everyone has already carefully reviewed our earnings release which provides comprehensive details about our performance. So we are only going to mention a few key highlights of the first quarter. Before we move on to your questions, for the first quarter we had a 5% increase in revenue and an 8% increase in operating income. The first quarter revenue of 99.1 million was the company’s highest first quarter revenue outside of the one time timberland sales in 2014. The increase in total revenue included a 13% increase in hospitality revenue and a 4% increase in real estate revenue when compared to the same period last year. Leasing revenue decreased by 10% which was primarily due to the sale of the Watercress Senior Living Property in September of 2025. Net income decreased by 21% primarily because of a decrease in equity and income from unconsolidated joint ventures. Equity and income was 3.5 million for the quarter when compared to 10.2 million in the first quarter of 2025. The decrease was primarily attributed to a lower home closing volume in the Latitude Latitude Margaritaville Watersound unconsolidated joint venture Latitude is a large scale long term project that will have ebbs and flows in quarterly and even year to year volume and provides benefits to us beyond its financial performance with consumers. For our commercial and hospitality segments, we continue to successfully execute our strategy of growing recurring revenue as evidenced by the first quarter record of 44.7 million in hospitality revenue and 14.7 million in leasing revenue, which together accounted for 60% of the total revenue in the quarter. As a result of the successful execution of the strategy to grow recurring revenue, the company has a sustainable business model that is poised for future growth with a demonstrated ability to grow multiple revenue streams, all while simultaneously increasing the value of the underlying land assets. In addition to the growth in recurring revenue, we are also improving profitability as evidenced by the increase in gross margins in hospitality and leasing revenue. As we have previously mentioned, since opening five new hotels in 2023 and expanding our club membership program, we have been focused on improving our hospitality operations and increasing margins. The gross margin improved across all hospitality categories to a total of 24% for the first quarter of 2026 as compared to 18% for the first quarter of 2025. Similarly, we have been focused on improving gross margins and leasing revenue with 61% for the first quarter of 2026 when compared to 55% for the first quarter of 2025. Leasing revenue is not as operationally intensive as hospitality revenue, so the strategy to increase profitability and gross margins is to invest in projects with higher margins and divest from projects with lower margins. We are systematically evaluating our leasing portfolio to execute this strategy. An example of investment in higher margin projects is the Watersound Town center and an example of divesting is the 2025 sale of the lower margin Watercress Senior Living Property. In the first quarter we continue to implement a measured and multifaceted capital allocation strategy with 20.7 million in capital expenditures primarily for growth, 9.2 million in cash dividends, 5 million in share repurchases and 10.9 million in reduction of project debt. project debt is a real cash expense and not all project debt is the same. The focus of our project debt reduction strategy is on the variable shorter term higher interest rate debt like for our hospitality assets as opposed to our fixed longer term lower interest rate debt like for our apartment assets.

Jose Gonzalez (President, CEO and Chairman)

Outside of the financial numbers, we continue to fill the pipeline for potential future growth. In the first quarter we were pleased to announce the execution of a contract with Pulte Group for up to 2,653 home sites in our most recently approved detailed Specific Area Plan or dsap.

Jose Gonzalez (President, CEO and Chairman)

Pulte Group is the third largest home builder in the country and this is their first entry into the Northwest Florida market. In the first quarter we were also pleased to execute a long range utility water and sewer agreement with a utility provider that will service the Lake Powell and West Layer DSAPs. With the potential for thousands of future residential home sites, work on this infrastructure is planned to commence later this year. Speaking of the future, most developers and national home builders will admit that two of the most challenging aspects of their future growth are acquiring and entitling land. In addition to the demonstrated ability to execute our business strategy, it is important to remember that we already own over 165,000 acres of land with many entitlements in a growing part of Florida. Our competitive advantage is clear now. Marek and I are going to answer your questions. As a reminder, in the top right hand corner of the screen, the words Submit a Question are visible. Clicking that text will take you to the text entry box where you can type your question and click Submit.

Eric

Eric thank you George. We have a few questions. Can you elaborate on the pace of takedown at Pigeon Creek DSAB 1300 …

Full story available on Benzinga.com

This post was originally published here

The U.S. Department of the Treasury set a new Series I savings bond composite rate of 4.26% Thursday for bonds issued from May 1 through Oct. 31, keeping the fixed-rate piece at 0.90% as the inflation-linked portion ticked higher.

CNBC reported the new 4.26% rate replaces the prior 4.03% offer that ran through April 30, and that the Treasury’s formula rounds the combined figure. The updated composite rate reflects a 3.34% variable component tied to inflation data plus the unchanged 0.90% fixed component.

I bonds are designed to help protect cash from inflation while still paying interest. Holding the fixed rate at 0.90% means new buyers lock in that piece for …

Full story available on Benzinga.com

This post was originally published here

OpenAI‘s business strategy doesn’t impress billionaire Marc Cuban.

“They’re [throwing] away the money at scale,” Cuban said.

In an appearance on the Big Technology Podcast, the former “Shark Tank” star criticized OpenAI’s fundraising efforts. He compared the ChatGPT maker to Apple, stating that they have “spent next to nothing” and yet they have built a foundation where you can just “plug and play into their devices.”

The entrepreneur added that he is skeptical of the large spending projections for data centers. He argued that computing power is advancing so quickly, becoming faster and cheaper, that many of today’s eye-catching investment projections are unlikely to materialize.

The numbers thrown out there “aren’t going to come to fruition,” Cuban said. “It’s not going to happen.”

Those who have gone all in on AI are “spending more cash than they have available,” …

Full story available on Benzinga.com

This post was originally published here

Offerpad Solutions (NYSE:OPAD) released first-quarter financial results and hosted an earnings call on Thursday. Read the complete transcript below.

This transcript is brought to you by Benzinga APIs. For real-time access to our entire catalog, please visit https://www.benzinga.com/apis/ for a consultation.

Access the full call at https://events.q4inc.com/attendee/396683193

Summary

Offerpad Solutions reported Q1 2026 revenue of $80 million across 263 transactions, aligning with guidance and reflecting a more predictable and disciplined operating model.

The company’s multi-solution real estate platform, including Cash Offer, Marketplace, Brokerage Services, and Renovate, is driving improved conversion rates and engagement, with AI tools Scout and Henry enhancing operational efficiency.

Offerpad Solutions aims to achieve approximately 1,000 transactions per quarter by year-end 2026, which is expected to lead to adjusted EBITDA breakeven, with sequential growth anticipated in each quarter.

Full Transcript

OPERATOR

For a question and answer session. If you would like to ask a question, please press STAR followed by the number one on your telephone keypad. To withdraw your question, press Star one again. With that, I’ll turn the call over to Courtney Reed, OfferPad’s vice president of Investor Relations and Communications. Courtney, please go ahead Good afternoon and

Courtney Reed (Vice President of Investor Relations and Communications)

welcome to OfferPad’s for first quarter 2026 earnings call. During the call today, management will make forward looking statements as defined in the Private Securities Litigation Reform act of 1995. Forward looking statements are inherently uncertain and events could differ significantly from management’s expectations. Please refer to the risks, uncertainties and other factors related to the company’s business described in our filings with the U.S. securities and Exchange Commission. Except as required by applicable law, Offerpad Solutions does not intend to update or alter forward looking statements, whether as a result of new information, future events or otherwise. On today’s call, management will refer to certain non GAAP financial measures. These metrics exclude certain items discussed in our earnings release and under the heading Non GAAP Financial Measures. The reconciliations of OfferPad Non GAAP measures to the comparable GAAP measures are available in the financial tables of the first quarter earnings release on OfferPad’s website. With that, I’ll turn the call over to Brian Behr, Chairman and Chief Executive Officer.

Brian Behr (Chairman and Chief Executive Officer)

Thank you Courtney and thank you to everyone for joining us on the call. With me today is our Chief Financial Officer Peter Knaug. OfferPad is executing over the past two years we have evolved from a single product company into a multi solution real estate platform and that platform is now producing measurable results. Today that platform includes Cash Offer, Cash Offer, Marketplace, Brokerage Services and Renovate. The macro environment has shifted since our last call. Geopolitical uncertainty has increased including ongoing conflict in the Middle East and interest rates have moved higher in response. Transaction volumes remain below historical norms and affordability continues to limit mobility for some sellers and this brings uncertainty around timing and proceeds, keeping many on the sidelines. We continue to refine and enhance our model through diversified revenue streams, multiple solutions, disciplined capital allocation and AI driven precision positioning us to operate effectively in environments like this. While some sellers are still cautious, we are seeing greater stabilization with increased engagement and clearer alignment on pricing and expectations. That shift is supporting improved conversion and we expect it to remain a tailwind through the remainder of 2026. With all that said, our cash offer strategy is not dependent on the macro backdrop changing we run this business as a capital allocator first and an operator second. Every transaction competes for capital if it does not meet our return thresholds. We do not transact. Our philosophy is simple, volume follows return, not the other way around. Throughout 2025 that meant deliberately widening spreads, tightening our buy box and slowing acquisitions rather than chasing volume into an unstable market. That approach pressured short term volume, but it strengthened the portfolio and preserved optionality. As we move through 2026, we are deploying capital with the same discipline. The result is a portfolio that is cleaner, faster turning and better positioned for returns than at any other point in recent history. Our aged inventory homes beyond their target period of hold time stands today at less than 30 homes, down from fewer than 60 at the end of quarter four. For remaining homes, we deployed buy down mortgage rate incentives along with pulling other levers to accelerate movement. In addition, we made an important shift in how we operate by moving to a post inspection offer model. We are entering commitments with greater certainty, which means stronger transaction quality, more efficient capital deployment and a better experience for sellers. But the bigger narrative is what is happening at the top of our funnel. Seller engagement with Offerpad Solutions is growing and more importantly, sellers are finding solutions. Our multi solution platform means that when a cash offer is not the right fit, we have options ready the cash offer marketplace or through our brokerage services with an agent led listing path. More sellers are staying in our ecosystem, converting across more pathways and leaving with a solution that works for their situation. Conversion is what we are focused on. The quality and completeness of every seller engagement that should position us to scale transaction volume with confidence through the remainder of 2026. A key part of the execution and central to how we move forward is AI. Real estate is a data intensive decision dense industry and we have spent the last decade building the foundation to do this right. Thousands of transactions, deep market coverage, rich data across pricing, renovations and homeowner behavior. We believe this is a real operating advantage. With Scout and Henry, we are turning it into a faster, smarter and more consistent operating model across stages of the transaction. From the moment a seller first engages with Offerpad Solutions to the final disposition of properties in our portfolio, AI will be embedded in that decision. That is a fundamentally different way to operate and should be a durable advantage that compounds with every home we touch. Let me start with what it’s producing. From January through March following the deployment of Scout across all operating markets, we saw over a 200 basis point improvement in home contracting rates. Let me explain how. Scout is an internally developed AI powered homeowner intake and routing platform that is being rolled out to better understand our seller intent. By cross referencing seller provided data with third party sources, public records and importantly our own proprietary transaction history to improve acquisition accuracy and routing decisions before every single offer is made. Looking ahead, we are building Scout to make our homeowner intake experience fully dynamic and adaptive in real time by personalizing the seller journey based on the solutions available to them. A seller whose home falls outside of acquisition criteria will not be shown a cash offer path. Instead they will be routed to the solution that works for them, guided by our Customer Solutions advisors every step of the way. That capability is in active development and is a core part of how scout scales in 2026. Scout also enhances our call center operations with AI driven conversation analysis, evaluating homeowner interactions in near real time, giving our advisors live coaching and provides leadership visibility into performance trends and customer intent across thousands of conversations each month. Additionally, that intelligence has been extended upstream into our marketing demand generation, improving how we manage spend, optimize performance and drive efficiency across channels. As a result, cost per qualified lead is down 37% year over year. We’re reaching more sellers more efficiently in the markets where we can win. Where Scout powers the seller journey, Henry will help govern the asset we are expanding Henry’s capabilities throughout 2026 deliberately and in stages. AI driven property inspection and renovation estimation tools are now live, powered by computer vision models that analyze property images and inspection data to generate renovation cost estimates based on our historical outcomes. Looking ahead, Henry will guide decisions across renovation scope, listing, price, holding time and overall disposition strategy for every home in the portfolio. A core part of what Henry will enable is a new segmentation framework that combines macro market dynamics with property level signals, allowing us to move beyond traditional static pricing approaches. This data driven model will enhance how we assess demand and liquidity, giving us more consistent and …

Full story available on Benzinga.com

This post was originally published here

White House officials are working on developing an artificial intelligence policy that will outline requirements for AI usage across national security agencies.

The memo, which touches on the ongoing dispute between the Pentagon and Anthropic, encourages U.S. agencies to use multiple AI providers to avoid relying on a single model, sources told Bloomberg.

The policy also notes that AI companies in contract with the Department of Defense must agree not to get involved in the military’s chain of command, in which the president is the final decision maker.

It was previously reported that the Trump administration is developing a strategy to bypass Anthropic‘s

Full story available on Benzinga.com

This post was originally published here

The Hershey Company (NYSE:HSY) shares are trading lower on Thursday. The confectionery giant delivered a sweet quarter, but rising cost pressures left a bitter aftertaste for investors.

Strong brand momentum and snack demand weren’t enough to fully calm concerns around margins and pricing strain.

Quarterly Details

The company reported first-quarter adjusted earnings per share of $2.35, beating the analyst consensus estimate of $2.04.

Quarterly sales of $3.104 billion (an increase of 10.6% year over year) outpaced the Street view of $3.028 billion. Organic net sales, on a constant currency basis, increased 7.9%.

Hershey’s North America Confectionery segment net sales were $2.489 billion in the first quarter of 2026, an increase of 8.3% versus the same period last year. 

Volume declined approximately 4 points, reflecting price elasticity …

Full story available on Benzinga.com

This post was originally published here

Fidelity Investments is expanding its push into active, factor-driven strategies with the launch of four new ETFs. The funds extend Fidelity’s “Enhanced ETF” suite to 12 products, targeting growth and value opportunities across mid- and small-cap equities. The funds are:

  • Fidelity Enhanced Mid Cap Growth ETF (NYSE:FEMG),
  • Fidelity Enhanced Mid Cap Value ETF (NYSE:FEMV),
  • Fidelity Enhanced Small Cap Growth ETF (NYSE:FSEG), and
  • Fidelity Enhanced Small Cap Value ETF (NYSE:FSEV)

data-variant=”card”
data-news-mode=”manual”

>


Read Also:

Bill Ackman’s $5B Pershing Square IPO Revives A Question ETFs Already Answered: Do Investors Still Need Hedge Fund …

This post was originally published here
One Polymarket wallet pocketed nearly $500,000 betting on the June 2025 US strike on Iranian nuclear facilities in the hours before it happened.

A new report says it was not an isolated case.

The Anti-Corruption Data Collective reviewed all 435,672 markets settled on Polymarket between January 2021 and mid-March 2026, covering $54.4 billion in wagers. It found low-probability bets in war markets win at more than triple the rate prices suggest they should.

War Markets Are The Outlier

Longshot bets, defined by ACDC as wagers of $2,500 or more at prices of 35 cents or lower, win 14% of the time across all Polymarket categories. In military and defense markets, the win rate climbs to 51.8%.

Political markets overall, including elections and politician speech, sit closer to 25%.

Roughly $35 million has been wagered on winning longshot bets in political markets since 2021. About $25 million of that came in the first 10 weeks of 2026 alone, exceeding the entire 2025 total.

Full story available on Benzinga.com

This post was originally published here

Newrez LLC released results from an internal review of about 1.2 million mortgages it services, showing homeowners insurance bills climbed sharply from 2021 through 2025. The company said the average annual premium rose 64% over that span, and the rate of increase slowed in 2025 compared with prior years.

Newrez, which is owned by Rithm Capital Corp. (NYSE:RITM), said the analysis excluded lender‑placed coverage and focused on premiums paid from escrow accounts at each year‑end.

Homeowners insurance costs surge

According to Newrez’s portfolio data, the average annual homeowners insurance premium increased to $2,625 by year‑end 2025 from $1,597 at year‑end 2021, a 64% jump. Premium hikes were in the double digits in 2022, 2023 and 2024 before easing to a 10% gain in 2025, the slowest rate of increase since 2021.

Shane Ross, Newrez’s head of servicing, tied the run‑up to weather‑related losses and higher rebuilding expenses, saying homeowners insurance has become a much larger component of housing costs as more frequent severe weather and higher construction costs put pressure on insurers.

Ross …

Full story available on Benzinga.com

This post was originally published here

On Thursday, ConocoPhillips (NYSE:COP) discussed first-quarter financial results during its earnings call. The full transcript is provided below.

This transcript is brought to you by Benzinga APIs. For real-time access to our entire catalog, please visit https://www.benzinga.com/apis/ for a consultation.

Access the full call at https://edge.media-server.com/mmc/p/5uk5zwys/

Watch this earnings call stream on YouTube.

Summary

ConocoPhillips reported strong first-quarter 2026 results with $2.4 billion in free cash flow and $2 billion returned to shareholders.

The Willow project in Alaska reached 50% completion, with significant progress in construction and exploration activities.

A third-party tolling agreement was executed in Equatorial Guinea, extending the LNG facility’s life into the next decade.

The company updated its guidance due to macroeconomic volatility, with an expected production midpoint of 2,310,000 barrels of oil equivalent per day for the year.

ConocoPhillips maintains its commitment to returning 45% of CFO to shareholders and is increasing Permian activity to sustain operational efficiency.

Management expressed confidence in achieving a $1 billion run rate in cost savings by year-end 2026.

The company’s LNG strategy is progressing well, with existing contracts and growing interest in unplaced volumes amid a tightening global market.

The sentiment was cautiously optimistic, acknowledging geopolitical risks but emphasizing strategic execution and financial resilience.

Full Transcript

OPERATOR

Welcome to the first quarter 2026 ConocoPhillips earnings conference call. My name is Liz and I will be your operator for today’s call. At this time all participants are in a listen only mode. Later, we will conduct a question and answer session. During the question and answer session, if you have a question, please press star 1-1 on your touchtone phone. I will now turn the call over to Guy Baber, Vice President, Investor Relations. Guy, you may begin.

Guy Baber (Vice President, Investor Relations)

Thank you Liz and welcome everyone to our first quarter 2026 earnings conference call. On the call today are several members of the ConocoPhillips leadership team including Ryan Lance, Chairman and CEO Andy O’Brien, Chief Financial Officer and Executive Vice President of Strategy and Commercial Nick Olds, Executive Vice President of lower 48 and global HSE and Kirk Johnson, Executive Vice President of Global Operations and Technical Functions. Ryan and Andy will kick off the call with opening remarks after which the team will be available for your questions. For the Q&A, we will be taking one question per caller a few quick reminders. First, along with today’s release, we publish supplemental financial materials and a slide presentation which you can find on the Investor Relations website. Second, during this call we will be making forward looking statements based on current expectations. Actual results may differ due to factors noted in today’s release and in our periodic SEC filings. We will make reference to some non Generally Accepted Accounting Principles (GAAP) financial measures today. Reconciliations to the nearest corresponding Generally Accepted Accounting Principles (GAAP) measure can be found in today’s release and on our website. With that, I’ll turn the call over to Ryan.

Ryan Lance (Chairman and CEO)

Thanks Guy and thank you to everyone for joining our first quarter 2026 earnings conference call. As we begin, I want to start by acknowledging the ongoing conflict in the Middle East. Our thoughts are first and foremost with our employees, our partners and the broader communities directly affected by these events. The supply curtailment and ensuing macro volatility have not only impacted energy markets but are also being felt across the global economy. Periods of volatility in our industry are inevitable, but this conflict reinforces the importance of both US and global energy security. We certainly hope for a swift and diplomatic solution that resolves the conflict, protects U.S. interests, opens commerce and provides stability in the region. Now, turning to the first quarter results, we delivered another strong quarter of strong financial and operational performance. We generated $2.4 billion of free cash flow and returned $2 billion of capital to our shareholders in the lower 48 where we have the deepest and highest quality inventory of any operator. We continue to improve our peer leading capital efficiency, meaningfully increasing the number of 3-mile-plus laterals in our program in Alaska, we’re winding down another successful winter construction season with the Willow project now 50 percent complete. Our teams have completed the project’s gravel scope, an important milestone and mobilization for summer work is underway. We also recently completed our four well exploration program in Alaska, the first in a multi year program to leverage existing infrastructure to unlock additional low cost of supply resource consistent with our long term track record. It’s still early days but we are excited about the opportunity and the results and more low cost of supply resources coming to the greater Willow area. As the broader industry increasingly recognizes Alaska’s unique resource potential, we believe our long standing position, legacy infrastructure investments and technical expertise provide us with a meaningful competitive advantage. Turning to lng, we recently executed a third party tolling agreement in Equatorial guinea extending the life of the LNG facility well into the next decade. This is a strategically located asset in a gas rich part of the world surrounded by discovered resource which supports its long term potential. Additionally, the Port Arthur LNG project continues to progress very well with first LNG expected next year. Turning to the outlook While ongoing events have significantly tightened crude oil and LNG markets, the macro environment remains volatile and pretty impossible to predict. Amid such uncertainty, it’s critical our priorities remain steadfast. They are clear, consistent and they are durable. They have served us well for the last decade and will continue to guide us into the future. We will continue delivering base dividend growth competitive with the top quartile of the S&P 500. We will maintain and protect our investment grade balance sheet. Recall last year we were one of the only companies that delivered on our shareholder return objectives and strengthened the balance sheet. We’ll continue returning significant CFO to shareholders right off the top. We’ve averaged about 45% over the past decade. Through the cycles and after meeting all these priorities, we’ll evaluate disciplined reinvestment for growth. In terms of how these priorities are translating to our 2026 plan, our expected CFO generation is up materially. Given our unhedged oil and LNG torque. Shareholders will directly share in this upside. With our 45% of CFO return of capital objective. We have also added a modest amount of Permian activity over the second half of the year to maintain our operational efficiency into 2027. Long term ConocoPhillips continues to offer a compelling value proposition that is differentiated in the market. We believe we have the highest quality asset base in our peer space. As we have said before, we are resource rich in a world that is looking increasingly resource scarce. This is a distinguishing competitive advantage. We have the deepest and Most capital efficient lower 48 inventory in the sector and outside the lower 48 we have an abundance of diversified low cost to supply legacy assets and we are uniquely investing in our portfolio to drive peer leading free cash flow growth. We’re on track to deliver our previously announced 7 billion free cash flow inflection by 2029 driven by our cost reduction efforts, LNG projects and Willow. So with that let me turn the call over to Andy to cover our first quarter performance and updated outlook in more detail.

Andy O’Brien (Chief Financial Officer and Executive Vice President of Strategy and Commercial)

Thanks Ryan. Starting with our first quarter performance, we produced 2.309 million barrels of oil equivalent per day. This includes the impacts of the Middle east conflict on Qatar volumes and higher royalty rates at Surmont from higher oil prices. These impacts were partially offset by strong performance across our lower 48 and international portfolio. In the lower 48 we produced 1,453,000 barrels of oil equivalent per day representing 4% year over year growth. On an underlying basis, we generated $$1.89 per share in adjusted earnings and $$5.4 billion of CFO capital. Expenditures were $2.9 billion. We returned $2 billion to our shareholders during the first quarter, 1 billion in ordinary dividends and 1 billion of share repurchases. We ended the quarter with cash and short term investments of $$6.7 billion as well as 1.2 billion in liquid long term investments. Turning to our outlook, we are updating our guidance to account for the impact of recent macro events and the uncertainty surrounding the Middle east conflict. To be clear, this is not a call on when we think the conflict will resolve. We’re simply trying to provide a clear and transparent framework for you to model and assess the underlying performance of the company for production. The midpoint of our annual guidance is updated at 2,310,000 barrels of oil equivalent per day. This reflects a 20,000 barrel of oil equivalent per day annual impact due to CASA being excluded from second quarter production guidance and a 15,000 barrel of oil current per day annual royalty rate adjustment at Surmont due to higher prices. We’ve made no other adjustments to our annual production guidance. The midpoint of our second quarter production guidance is 2,200,000 barrels of oil equivalent per day which reflects the full exclusion of Qatar production from guidance for the quarter. The Cermont royalty rate adjustment and planned second quarter maintenance. Moving to operating costs full year guidance of $10.2 billion is unchanged reflecting a $400 million reduction from 2025 due to the benefits of our cost reduction and margin enhancement program. We made strong progress in the first quarter and we remain confident in realizing the full $1 billion run rate by year end. For capital spending, we’re updating our guidance to a range of 12 to $12.5 billion versus our prior guidance of about $12 billion representing a 2% increase at the midpoint. This increase is due to slightly more Permian activity over the second half of the year. We’re adding a rig to keep pace with the completion efficiencies and we expect higher levels of non operated spend. These modest activity additions will maintain our operational continuity into 2027. Additionally, we’re incorporating a guidance range to capture the uncertainty around the macro environment as well as the Middle east conflict. Specifically, as it pertains to timing for NFE and NFF spending to wrap up, we delivered strong first quarter results. We executed well financially and operationally. We continue to advance our strategy and amid a volatile macro environment, we remain committed to clear, consistent and durable priorities that have served us well for the last decade. As Ryan mentioned, our expected CFO is up materially from the beginning of the year. We remain unhedged on oil and LNG to ensure we capture the price upside with 40% of our crude production linked to premium markets such as ANS and Dated Brent and shareholders are directly participating in this upside as we remain committed to returning 45% of our CFO consistent with our long term track record. Looking ahead, we remain focused on exiting our plan and enhancing our differentiated investment thesis unmatched portfolio quality including leading lower 48 inventory debt, attractive long cycle investment, strong return on and of capital and driving sector leading free cash flow growth through the end of the decade. That concludes our prepared remarks. I’ll now turn it over to the operator to start the Q and A.

OPERATOR

Thank you. We will now begin the question and answer session. In the interest of time we ask that you limit yourself to one question. If you have a question, please press 11 on your touchtone phone. If you wish to be removed from the queue, please press 11 again. If you’re using a speakerphone, you may need to pick up the handset first before pressing the numbers. Once again, if you have a question, please press star 1-1 on your touchtone phone. Our first question comes from Scott Hanold from RBC Capital Markets. Your line is now open.

Scott Hanold (Equity Analyst)

Yeah, good afternoon. Thank you. Hey, a lot happening obviously in the macro front and I know you all do a lot of work on the oil macro in addition to obviously having feelers out there can you give us a sense of your view of what’s happened in the market? If you’ve got any view of physical versus the financial position of oil and how you expect operators to act and react? It sounds like you guys are going to maintain operational efficiency, but it’ll be good to see if you’ve got a view on what you’re seeing and hearing from others.

Andy O’Brien (Chief Financial Officer and Executive Vice President of Strategy and Commercial)

Yeah, thanks, Scott. Maybe I’ll let Andy talk a little bit about some of the numbers that we see out there, then maybe I come back and address some of your broader set questions after that. Thanks, Ryan. And morning, Scott. Yeah, I’ll start with, I think you said this for me. There’s certainly a lot of moving pieces out there right now. And I’ll summarize sort of our view of the world. I’m not sure it’s too different to others, but I think it’s good to summarize it. For about two months now, we’ve had about 10 million barrels per day a day of production offline. That even factors in the redirected volumes. In countries like Saudi Arabia, we have seen inventory and Strategic Petroleum Reserve (SPR) releases that have partially backfilled some of that lost supply. And the ongoing Strategic Petroleum Reserve (SPR) releases that have been announced, they’ll certainly help through the May, July time frame. But I do think it’s really important for people to understand that the brunt of the supply shortfall is currently being absorbed by refinery run cuts and demand curtailments. If you include the Persian Gulf refineries that have been damaged, the total global refinery run cuts right now probably amount to around 8 million barrels a day. Now as we look forward from here, we think the biggest challenge we’re about to face is that the markets sort of had a bit of a grace period initially when the tankers that left the Persian Gulf in late February were still on the water. Now all of those have reached their destination, the impacts of the lost supply is going to start to become more apparent. We could possibly see from here now inventory draws really start to accelerate. You’ve already seen that governments in over a dozen countries are implementing policies to ration or otherwise reduce demand in advance of physical shortages. So given those factors I’ve just described, we are downgrading our view of global oil demand to be flat year over year with probably a bit more risk to the downside if the conflict goes on. And probably one final point I’d make before sort of passing it off to Ryan is despite efforts that are ongoing to manage demand, we are going to start to see some import dependent Countries potentially start to face critical shortages as we get into the June, July time frame. So I’ll probably stop there and let Ryan sort of add a bit more to that.

Ryan Lance (Chairman and CEO)

Yeah, maybe. Scott, how are people acting? I think people are watching pretty closely to see what happens. Maybe a little bit of short cycle investments and I’m sure that’ll come up in our call with the capital. We’re just trying to maintain the efficiency gains that we’ve got in the lower 48 and we won’t be drilled out of some of our OVO activity, but we’re trying to look longer term as well. As Andy said, assess the supply and the demand fundamentals. I think at a minimum we think the floor probably is going to have to raise up a little bit, at least relative to where we were before the conflict started. Recall we had a mid cycle ti price of about 65 and that’s we believe that’s probably going to come up with a floor. But we’re trying to assess right now given the demand dynamics and the supply dynamics but what long term effect that’s going to have on what we would call a mid cycle equilibrium price and for how long that might persist. And recall we were pretty constructive over the last few years before this got started with some uncertainty around how the physical and paper markets were acting a little bit and this has just accelerated a lot of that. But certainly think the floor probably has to come up to account for the changes that have occurred over the last couple of months.

OPERATOR

Our next question comes from Neil Mehta from Goldman Sachs. Your line is now open.

Neil Mehta (Equity Analyst)

Yeah, Ryan, Andy, great comments there and definitely our thoughts are with your people in the region. I want to pivot over to Alaska and we went through winter construction season here and so love a mark to market on how those plans progressed. Where do you stand in terms of Willow construction and what are the big milestones as we continue to de risk this project and get to that free cash flow inflection?

Ryan Lance (Chairman and CEO)

Good morning Neil. Thanks for the question. We’ve had a really strong showing here just in the last six months in Willow, so I’ll probably address maybe a couple things. I’ll touch on Willow directly your question and then very related to that, given it is the winter season, we’ve also had a really strong showing in exploration as well. So I’ll take you through a little bit of how we’re seeing these projects progress starting with Willow. As mentioned in the opening remarks, we are in fact at 50% complete on the project and that achieving that requires a collection of key milestones that our teams have been able to accomplish and get behind us here. And this winter season in …

Full story available on Benzinga.com

This post was originally published here

Hyatt Hotels Corp. (NYSE:H) shares rose Thursday after the company reported first-quarter 2026 results that topped expectations, supported by strong global demand and continued expansion. However, some regional softness weighed on sentiment.

Quarterly Details

The company reported first-quarter adjusted earnings per share of 63 cents, beating the analyst consensus of 56 cents. Quarterly sales of $1.748 billion outpaced the Street view of $1.738 billion.

Comparable system-wide hotel RevPAR increased 5.4% compared with the first quarter of 2025. Comparable system-wide all-inclusive resorts net package RevPAR increased 7.4%.

Net rooms growth reached 5.0% over the trailing twelve months, while the pipeline of executed management or franchise contracts rose 9.4% to about 151,000 rooms.

Adjusted EBITDA was $266 million, an increase of 2.1%, compared to the first quarter of 2025.

Gross fees increased 8.6% compared with the first quarter of 2025.

Incentive management fees rose …

Full story available on Benzinga.com

This post was originally published here

CVR Energy (NYSE:CVI) released first-quarter financial results and hosted an earnings call on Thursday. Read the complete transcript below.

This content is powered by Benzinga APIs. For comprehensive financial data and transcripts, visit https://www.benzinga.com/apis/.

The full earnings call is available at https://events.q4inc.com/attendee/598656914

Summary

CVR Energy reported a first-quarter 2026 consolidated net loss of $160 million, with losses per share at $1.91 and an EBITDA loss of $52 million, primarily due to unrealized derivative losses and changes in RFS liability.

The company announced a $0.10 per share dividend for the first quarter, reflecting a commitment to balanced debt reduction and shareholder returns.

Operational highlights included a crude utilization rate of 97% and ammonia plant utilization at 103%, with the company positioned to capture improved margins due to global supply chain disruptions.

Management emphasized a focus on deleveraging and indicated continued interest in M&A opportunities, while also navigating a volatile market environment.

Future guidance for the second quarter of 2026 includes expected throughput of 200,000 to 215,000 barrels per day in the petroleum segment and an ammonia utilization rate between 95% and 100% in the fertilizer segment.

Full Transcript

Regina (Conference Operator)

Hello and thank you for standing by. My name is Regina and I will be your conference operator today. At this time I’d like to welcome everyone to the first quarter 2026 CVR Energy Inc. Earnings conference call. All lines have been placed on mute to prevent any background noise. After the speaker’s remarks, there will be a question and answer session. If you would like to ask a question during this time, simply press Star then the number one on your telephone keypad. To withdraw your question, press Star one. Again, we ask that you please limit your questions to one and one follow-up I’d now like to turn the conference over to Richard Roberts, vice president of FP&A and Investor Relations. Please go ahead.

Richard Roberts (Vice President of FP&A and Investor Relations)

Good afternoon everyone. We very much appreciate you joining us this afternoon for our CVR Energy first quarter 2026 earnings call. With me today are Mark Pytosch, our Chief Executive Officer, Dane Newman, our Chief Financial Officer, Mike Wright, our Chief Operating Officer, Travis Capps, our Chief Commercial Officer and other members of management. Prior to discussing our 2026 first quarter results, let me remind you that this conference call may contain forward looking statements as that term is defined under federal securities laws. For this purpose, any statements made during this call that are not statements of historical facts may be deemed to be forward looking statements. You are cautioned that these statements may be affected by important factors set forth in our filings with the Securities and Exchange Commission and in our latest earnings release. As a result, actual operations or results may differ materially from the results discussed in the forward looking statements. We undertake no obligation to publicly update any forward looking statements, whether as a result of new information, future events or otherwise, except to the extent required by law. This call also includes various non GAAP financial measures. The disclosures related to such non GAAP measures, including a reconciliation to the most directly comparable GAAP financial measures, are included in our 2026 first quarter earnings release that we filed with the SEC and Form 10-Q for the period and will be discussed during the call. With that said, I’ll turn the call over to Mark.

Mark Pytosch (Chief Executive Officer)

Thank you Richard Good afternoon everyone and thank you for joining our earnings call. In the first quarter our operations performed well with crude utilization of 97% and ammonia plant utilization of 103%. Major geopolitical events drove volatility in energy and fertilizer markets which have set up attractive market opportunities for the balance of 2026. Given the disruptions in global supply chains with loss of production and lack of product movement for refined products and fertilizer, CVR Energy is well positioned to improve our margin capture for the balance of the year. We are pleased to announce the first quarter 2026 dividend of $0.10 per share and we believe our prospects should allow for balanced debt reduction and capital returns to shareholders as we move forward. Now let me turn the call over to Dane to discuss our financial highlights.

Dane Newman (Chief Financial Officer)

Thank you Mark Good afternoon everyone. For the first quarter of 2026 our consolidated net loss was 160 million, losses per share were $1.91 and EBITDA was a loss of 52 million. Our first quarter results include unrealized derivative losses of 158 million, which primarily relate to NYMEX gasoline and diesel crack spread swaps entered into during the quarter against expected future production at a crack spread value of 447 million through 2027, which I will discuss further in our petroleum segment results. In addition, our results also include an unfavorable change in our RFS liability of 51 million and favorable inventory valuation impacts of 120 million. Excluding the above mentioned items, adjusted EBITDA for the quarter was 37 million and adjusted losses per share were $1.24. Adjusted EBITDA in the Petroleum segment was a loss of $50 million for the first quarter compared to a loss of $30 million for the first quarter of 2025. Increased rent expenses, higher operating costs and realized derivative losses drove the majority of the decrease from the prior year period. Combined total throughput for the first quarter of 2026 was approximately 214,000 barrels per day. Period utilization for the quarter was approximately 97% of nameplate capacity and light product yield was 93% on total throughput volumes. Benchmark cracks for the first quarter of 2026 increased from the prior year period, with the Group 3211 averaging $21.58 per barrel compared to $17.65 per barrel in the first quarter of 2025. Our first quarter realized margin adjusted for unrealized derivative losses, the change in RFS liability and inventory valuation was $4.72 per barrel, representing a 22% capture rate on the Group 3 211. Benchmark RIN prices increased significantly from the first quarter 2025 levels, more than doubling to almost $9.50 per barrel for the first quarter of 2026. Net RINs expense for the quarter excluding the change in RFS liability was 143 million or $7.37 per barrel, which negatively impacted our capture rate for the quarter by approximately 34%. EPA has repeatedly stated that the cost of RINs is ultimately passed through to consumers at the pump. The decision to establish the highest RVO in history through the recent set to rule has driven RIN prices significantly higher, which has in turn raised the price of gasoline. This is in direct conflict with the Administration’s stated goal of lowering fuel costs for American consumers. RIN prices have increased more than 75% since the beginning of the year, in addition to the 18% increase in the RVO, currently adding 25 to 30 cents to every gallon of fuel purchased in America. If the Administration is serious about lowering fuel prices, it should start with the rfs. The estimated accrued RFS obligation on the balance sheet was 204 million at March 31, representing 113 million RINs mark to market at an average price of $1.80. As EPA has not yet ruled on our pending 2025 petition, we’ll we will continue to recognize 100% of Wynnewood Refining Company’s RIN obligation in our financials, which for the first quarter of 2026 was approximately 52 million. Had Winniewood Refining Company received the 100% SRE we believe it is entitled to, our consolidated capture rate for the quarter would have improved by approximately 12%. Once again, EPA has missed a deadline on ruling on Wynnewood Refining Company’s 2025 SRE petition. Will the EPA ever meet a deadline? Our first quarter 2026 results included derivative losses totaling 182 million. As previously discussed, 158 million of this loss was the unrealized mark to market change in all of our open crack spread swap positions as of March 31, and our physical positions intended to offset are expected to be sold as the swap contracts expired through 2027. Given this disconnect, we do not view the impact of the unrealized loss as a …

Full story available on Benzinga.com

This post was originally published here

“Big Short” investor Steve Eisman disclosed Thursday he is shorting credit scoring company Fair Isaac (NYSE:FICO), accusing the firm of years of aggressive price hikes that have alienated mortgage lenders.

Speaking on CNBC’s “Squawk Box,” the former Neuberger Berman portfolio manager said FICO has raised prices roughly 500% over many years and “ticked off literally everybody in the lending world.”

The named short follows Eisman’s warning last week about the next credit crisis brewing inside private equity’s software loan book.

Why Fair Isaac Is In Trouble

Fair Isaac built the FICO score, the three-digit number used in roughly 90% of U.S. consumer lending decisions, and earns royalties every time a lender pulls one.

That near-monopoly is what gave the company its pricing power, and what VantageScore is now contesting.

Eisman argued the math has shifted against the credit-scoring incumbent. FICO has cut prices in …

Full story available on Benzinga.com

This post was originally published here

Opendoor Technologies Inc. (NASDAQ:OPEN) shares fell during Thursday’s session. The real estate tech firm faces a difficult mix of hot inflation data and heavy short-seller activity.

• Opendoor Technologies shares are retreating from recent levels. What’s weighing on OPEN shares?

Macro Headwinds Dampen Sentiment

The Bureau of Economic Analysis reported Thursday that the Core PCE price index — the Fed’s favorite inflation gauge — hit 3.2% in March.

This acceleration from 3% in February suggests persistent pricing pressure. Additionally, first-quarter gross domestic product (GDP) grew at a 2% annualized rate, missing the 2.3% economist forecast.

These figures indicate a cooling economy paired with sticky …

Full story available on Benzinga.com

This post was originally published here

Southern (NYSE:SO) held its first-quarter earnings conference call on Thursday. Below is the complete transcript from the call.

This content is powered by Benzinga APIs. For comprehensive financial data and transcripts, visit https://www.benzinga.com/apis/.

View the webcast at https://events.q4inc.com/attendee/395018905

Summary

Southern reported adjusted earnings for the first quarter of 2026 above estimates, with significant year-over-year growth across its businesses.

The company signed contracts for 1.9 gigawatts of customer load, bringing the total to over 11 gigawatts, focusing on high credit quality hyperscalers.

Southern announced $26.5 billion in loan agreements with the Department of Energy, expected to save $7 billion over 30 years.

Adjusted EPS for Q1 2026 was $1.32, $0.12 above estimates, driven by customer growth and increased usage, notably from data centers.

The company initiated an all-source RFP to procure 2-6 gigawatts of new generation resources projected for 2032-2033.

Southern Power plans to add 400 megawatts of capacity upgrades, with potential for an additional 300 megawatts, adding $700 million to the capital plan.

The Board approved an $0.08 increase in the annual dividend, marking 25 consecutive annual increases.

Management emphasized the importance of rate stability and customer benefits from growth through strategically structured contracts.

Full Transcript

Christine (Conference Operator)

Good afternoon, My name is Christine and I’ll be your conference operator today. At this time I would like to welcome everyone to the Southern Company first quarter 2026 earnings call. All lines have been placed on mute to prevent any background noise. After the speaker’s remarks, there will be a question and answer session. If anyone should require operator assistance during the conference, please press Star 0 on your telephone keypad. As a reminder, this conference is being recorded. I would now like to turn the call over to Greg McLeod, Director of Investor Relations. Please go ahead sir.

Greg McLeod (Director of Investor Relations)

Thank you. Christine, good afternoon and welcome to Southern Company’s first quarter 2026 earnings call. Joining me today are Chris Womack, Chairman, President and Chief Executive Officer of Southern Company and David Perroch, Chief Financial Officer. Let me remind you that we will make forward looking statements today. In addition to providing historical information, various important factors could cause actual results to differ materially from those indicated in the forward looking statements, including those discussed in our Form 10K, Form 10Q and subsequent securities filings. In addition, we will present non-GAAP financial information on this call. Reconciliations to the applicable GAAP measure are included in the financial information we released this morning as well as the slides for this conference call which are both available on our investor relations website at investor.southerncompany.com at this time, I’ll turn the call over to Chris. Thank you Greg Good afternoon and thank you for joining us today. As you can see from the materials that we released this morning, we reported adjusted earnings results the first quarter above our estimate with year over year growth reflected across all our major businesses. That performance reflects premium execution and the strength of our strategy to serve the phenomenal growth we’re seeing across the Southeast with reliable and affordable energy while delivering durable long term value for shareholders. We continue to see extraordinary growth and economic development opportunities as our service territories attract investment people and jobs at a pace few regions can match. As we previously highlighted, a substantial portion of this growth is driven by projected demand from large load customers. The demand for power across our electric service territories has culminated in 23 gigawatts of contracted or late stage load in just the last two months. We assigned contracts for another 1.9 gigawatts of customer load with high credit quality hyperscalers bringing our fully contracted large load agreements to more than 11 gigawatts across our electric subsidiaries. These bilateral negotiated agreements are structured so that customers driving incremental demand cover the full share of the cost to serve them, helping to assure this growth benefits all customers. We continue to execute on our plans to serve growth and our straightforward approach protects existing customers. We invest in line with demand to serve growth that enables us to deliver regular, predictable and sustainable results while providing meaningful benefits to the customers and communities we are privileged to serve. Southern Company continues to be uniquely positioned to do this because of our scale, our experience and our expertise, all supported by constructive, long standing regulatory frameworks. At Southern Company we are capitalizing on transformative growth opportunities while delivering energy reliability and rate stability as energy demands. Growth with base rates held stable in Alabama and Georgia until at least 2010 and 2029, along with the recent filing to lower rates in Georgia associated with the recovery of fuel and storm costs, we are demonstrating the value of this approach. Rate stability for our customers is a purposeful objective supported by our constructive, orderly planning and procurement processes, cost management and thoughtful financing. This same built for purpose approach also creates the potential for additional capital investment to serve incremental growth opportunities under established regulatory processes. We have routinely demonstrated as growth opportunities present themselves that Southern Company has the ability to convert these opportunities into value through enhanced operations and grid improving infrastructure investments for the benefit of customers and investors alike. The construction of many of these investments is well underway. In the last two months, Georgia Power achieved commercial operations for two battery energy storage systems providing nearly 200 megawatts of capacity, representing an important step forward in advancing reliable, sustainable energy solutions across the state. These projects are the first of several resources included within our 10 gigawatt portfolio of approved new generation resources that are in development to power the extraordinary productive growth in our region, including multiple battery systems and natural gas combustion turbines that are projected to be online later in 2026 and 2027.. Before I turn the call over to David for our financial update, I’d like to highlight the recently announced historic $26.5 billion in loan agreements with the Department of Energy that will benefit customers across Alabama and Georgia for decades as we expect these loans to translate into meaningful long term customer savings while reducing pressure on our capital market needs. Over the approximately 30 year term of the Department of Energy loans, this lower cost financing is projected to generate cumulative savings of $7 billion for customers. David, I’ll now turn the call over to you for a financial update.

David Perroch (Chief Financial Officer)

Thanks Chris and good afternoon everyone. For the first quarter of 2026, our adjusted EPS was $1.32 per share, $0.09 higher than the first quarter of 2025 and $0.12 above our estimate. The primary drivers of our performance for the quarter compared to last year were meaningful customer growth and increased usage, including from data centers. at our state-regulated electric utilities. Additionally, increased revenues in our gas utilities and higher energy related revenues in our unregulated businesses including Southern Power were positive drivers in the first quarter. This was partially offset by higher financing costs and milder weather year over year compared to the first quarter of 2025. A complete reconciliation of year over year earnings is included in the materials we released this morning. Our adjusted EPS estimate for the second quarter is $1 per share. Turning now to retail electricity sales first quarter weather normal retail electricity sales to all classes were 2.3% higher than the first quarter of 2025. This represents the highest total retail sales growth that we’ve seen the first quarter in recent history. In fact, sales to all three customer classes were up year over year, including residential where we saw 46,000 new customers added to our system as positive trends and net migration continue. The commercial class grew 4.5% in the first quarter when adjusted for weather, bolstered by ongoing growth in data centers.. Data center usage saw material expansion in the quarter up 42% year over year, primarily due to accelerating usage ramps at large load facilities. Our industrial sales grew 1.5% with particular strength in several segments, including robust activity at multiple steel manufacturers in Alabama. More broadly, the Southeast continues to stand out as one of the most attractive economic regions in the country, driven by a diverse mix of advanced manufacturing technology and other energy intensive industries. In the first quarter alone, there were economic development announcements for over $7 billion of capital investment and the creation of nearly 4,000 permanent jobs in our region, including a global biopharmaceutical manufacturing project north of Atlanta bringing $2 billion of investment and over 300 jobs to Georgia. The sustained higher high quality growth reinforces why demand in this region of remains strong and visible, underscoring the region’s tremendous opportunity for future growth. Outside the Southeast, we continue to see momentum in our gas utilities, including a recently announced Hyundai investment in Illinois that is expected to bring 2,500 jobs and $500 million of investment to the Nicor Gas service territory. As we look ahead, the interest from large load customers in our electric service territories, which includes data centers. and large manufacturers, remains strong with a prospective pipeline of well over 75 gigawatts. And we continue to make incredible progress advancing projects through stages in our large load process to finality with executed contracts. As Chris mentioned, over the past two months Georgia Power signed two projects representing 1.9 gigawatts, pushing the cumulative amount of contracted large loads to over 11 gigawatts across Alabama, Georgia and Mississippi. These bilaterally negotiated contracts with pricing and terms designed to both protect and benefit existing customers also support our long term financial outlook. We continue to see incredible momentum and tangible interest for power from large load customers and are in active late stage discussions for another 12 gigawatts of contracted load through the mid-2030s, an increase of 2 gigawatts from what we shared last quarter. Importantly, roughly 6 gigawatts or half of these late stage gigawatts are expected to be finalized with executed contracts in the near term. In a little over two months we’ve seen projects representing 12 gigawatts advance to the next stage in our large load process. The demonstrated progress we are making in attracting and signing new agreements with large load customers is exciting and continues to drive projected growth in our risk adjusted load forecast which ultimately helps inform future generation needs and generation requests for proposals or RFPs across our service territory. For example, Georgia Power recently initiated the regulatory process for an all source RFP to procure 2 to 6 gigawatts of new dispatchable generation resources including from thermal generation, battery energy storage and renewables that are projected to be in service in 2032 and 2033. Generation procurement through RFPs delivers substantial value to customers and is a testament to the transparent and orderly processes in our vertically integrated state-regulated markets with long range integrated resource planning. To the extent that company owned resources are selected through Alabama Power and Georgia Power’s active RFP processes and ultimately authorized by their respective Public Service Commission (PSC), these generation investments would represent substantial incremental investment above our current base capital plan. Turning to Southern Power, we are moving Forward to add 400 megawatts of additional capacity upgrades through natural gas turbine upgrades and multiple existing facilities in Alabama and Georgia with commercial operation projected between 2029 and 2031. This incremental investment is projected to add approximately $700 million to our capital plan over the next several years. We continue to evaluate other growth investment opportunities at Southern Power, including an additional 300 megawatts of natural gas up rates as well as other new generation opportunities in both the Southeast and other markets to meet future demand. Before I turn the call back over to Chris, I’d like to provide an update on our financing activities through the first quarter. We continue to proactively address equity needs that support our strong credit quality and path towards 17% FFO to debt by 2029. Over the last quarter we sourced an incremental $500 million of equity through our at the Market or ATM program with forward contracts that settle at our discretion by 2028, combined with the significant amount of equity previously sourced and including the incremental 700 megawatts of Southern. I’m sorry, $700 million of Southern power projected capital expenditures I mentioned earlier. We project a remaining need for equity or equity equivalents of approximately $1.8 billion through 2030 in support of our capital plan and long term credit objectives. We are well positioned to continue financing our remaining equity needs in a credit supportive and shareholder focused fashion. I’ll now turn the call back over to Chris.

Chris Womack (Chairman, President and Chief Executive Officer)

Thank you, David. Last week the Southern Company Board of Directors approved an increase of $0.08 per share in our annual common dividend, raising the annualized rate to $3.04 per share. This action marks our 25th consecutive annual increase and this will now be 79 consecutive years. Dating back to 1948. Southern Company has paid a dividend that is equal to or greater than the previous year. Increasing dividend 25 years in a row represents a historic milestone for the company and underscores our focus on premium risk-adjusted total shareholder return, and our goal of delivering regular, predictable and sustainable value for our shareholders. We are incredibly proud of our strong dividend track record which continues to be an integral part of Southern Company’s long term value proposition. As we conclude our discussion today, our first quarter results reinforce a simple point our company is delivering. We’re off to a strong start in 2026 and that momentum gives us confidence as we continue executing on our long term goals. We’re capturing growth, protecting customers and creating long term value. And we’re doing it in a disciplined, predictable way. With that foundation, we have a bright future ahead. Thank you for joining us this afternoon and for your continued interest in Southern Company Operator. We are now ready to take questions.

OPERATOR

Thank you. We will now be conducting a question and answer session. If you would like to ask a question, please press Star 1 on your telephone keypad. A confirmation tone will indicate your line is in the question queue. You may press Star 2 if you would like to remove your question from the queue. For participants using speaker equipment, it may be necessary to pick up your handset before pressing the star keys. One moment please, while we poll for questions. Thank you. Our first question comes from the line of Char Parizo with Wells Fargo. Please proceed with your question.

Char Parizo (Equity Analyst)

Hey Char. Hey guys. Hey guys. Hey Chris. All right, not too bad. Hope you’re doing well. Good. Good for you. Because just on New Nuclear there seems to be sort of a consortium that’s formed with utilities and hyperscalers, maybe with some backstop by US government around sort of new AP1000s. And it seems like there could be some views that hyperscalers would be willing to take on some of the cost inflation above budgeted amounts. One of your peers kind of highlighted that they wouldn’t be surprised if the first deal was announced this year. Can you maybe comment on your views? Is Southern interested? Are you in the consortium? Just, I guess, some thoughts on new nuclear in light of the learning curves of Unit three versus Unit four. Thanks.

Chris Womack (Chairman, President and Chief Executive Officer)

Yeah, sure. I mean, a very, very good question. And let me at the outset say I am very excited to see all the actions that the current administration has taken to support the build and construction of new nuclear. I mean, I’ve said it, you heard me say it many times. With the growth that we see in this country, I think it’s going to be important that we have make available new nuclear in this country to help and support and meet this demand. The current administration, I think, is taking some wonderful steps on the regulatory front. All the conversations that DOE is leading and having today about long lead times for supply chains, all of these issues are matters that we clearly have to address …

Full story available on Benzinga.com

This post was originally published here

On Thursday, Precision Drilling (NYSE:PDS) discussed first-quarter financial results during its earnings call. The full transcript is provided below.

This transcript is brought to you by Benzinga APIs. For real-time access to our entire catalog, please visit https://www.benzinga.com/apis/ for a consultation.

Access the full call at https://edge.media-server.com/mmc/p/952icqoy/

Summary

Precision Drilling reported improved utilization rates in Q1 2026, with a 7% increase in Canada and a 24% increase in the U.S., despite a 7% decline in industry rig counts in both markets.

The company generated $63 million in operating cash flow, reduced its debt by $25 million, and allocated $4 million towards share buybacks.

Precision Drilling’s capital expenditures were $65 million, with $35 million for sustaining infrastructure and $30 million for rig upgrades.

Adjusted EBITDA for Q1 was $124 million, but net earnings were down to $18 million from $35 million in Q1 2025, partly due to increased stock-based compensation expenses.

The company expects record Q2 activity levels in Canada and increased utilization in the U.S. due to higher oil prices and rig upgrades.

Precision Drilling raised its capital expenditure budget to $265 million for 2026, with $168 million for sustaining infrastructure and $97 million for upgrades.

Management highlighted strategic priorities, including maintaining strong free cash flow, enhancing shareholder returns, and expanding their digital and technology initiatives.

The company is optimistic about increasing U.S. rig counts in the second half of the year and expects price increases to improve margins.

International operations faced challenges due to Middle East tensions, but efforts are underway to secure more contracts and expand technology offerings.

Full Transcript

OPERATOR

Good day and thank you for standing by. Welcome to the Precision Drilling Corporation 2026 First Quarter Results Conference call and webcast. At this time, all participants are in listen only mode. After the speaker’s presentation, there’ll be a question and answer session where we will take questions from research analysts. To ask a question during the session, you’ll need to press Star one one on your telephone. You will then hear an automated message advising your hand is raised. To withdraw your question, please press star 11 again. Please be advised today’s conference is being recorded. I would now like to hand the conference over to your speaker today, Lavon Schudonek, Vice President, Investor Relations. Please go ahead.

Lavon Schudonek (Vice President, Investor Relations)

Welcome and thank you everyone for joining Precision Drilling’s first Quarter Conference call and webcast. Today. I’m joined by Kerry Ford, our President and CEO, and Dustin Honing, our CFO. Please note that some comments today will refer to non IFRS financial measures and include forward looking statements which are subject to a number of risks and uncertainties. For more information on financial measures, forward looking statements and risk factors, please refer to Our news release MD&A and financial statements which are now available on Sedar and edgar. Before I pass the call over, I would like to highlight a couple points from our news release. First, utilization improved meaningfully in the quarter compared to Q1 of 2025. It increased 7% in Canada and 24% in the U.S. even as industry rig counts declined 7% in both markets. This performance underscores the value customers continue to see in our high performance high value strategy. Second, we delivered strong progress on our 2026 priorities, growing revenue year over year, generating $63 million in operating cash flow and returning capital to shareholders through debt reduction and share repurchases. In the first quarter, Precision had 123 rigs operating globally and remained the second most active driller in North America. With that, I’ll pass it over to Dustin.

Dustin Honing (Chief Financial Officer)

Thank you Lavon and good morning. Good afternoon. For those calling from different locations before we cover our 2026 Q1 financial results and outlook, I’ll briefly comment on our capital allocation strategy. As you’re likely aware, Precision has a longstanding reputation for publishing clear and transparent strategic priorities aligned with enhancing the competitive positioning of the business and driving enhanced shareholder returns. Over the last decade, Precision’s free cash flow generating abilities have allowed us to outpace expected timelines for delivering on major strategic initiatives, positioning the business with rapidly increasing financial flexibility. We remain committed to our shareholder return targets while responsibly investing back into the business with a return space mandate. These investments are paying dividends as we anticipate record Q2 activity levels in Canada and a notably strengthened utilization and customer mix in the US Maximizing strong free cash flow remains central to our strategy. Moving on to first quarter results despite our recurring and expected heavy Q1 working capital build, Precision generated 63 million of cash from operations. Capital expenditures were 65 million, comprised of 35 million for sustaining an infrastructure and 30 million for rig upgrades. These investments were made in step with our shareholder return commitments, reducing debt by 25 million and allocating 4 million towards share buybacks. We recorded adjusted EBITDA of 124 million which equates to 143 million before share based compensation expense compared with prior year Q1 EBITDA of 137 million 140 million before share based compensation expense. Although operating results exceeded prior year, this was offset by a larger stock based compensation accrual resulting from our share price appreciating 39% during the quarter. Net earnings were 18 million compared to 35 million in the first quarter of 2025. In Canada, drilling activity averaged 79 active rigs, an increase of 5 rigs from Q1 2025. Our reported Q1 daily operating margins were $14,282 compared to $14,780 in the prior first quarter 2025, falling within our prior guidance range. During the first quarter, Precision’s operating margins were slightly impacted by rig mix, with stronger demand requiring a higher proportion of super singles and doubles working through the winter. In the US we averaged 37 active rigs in line sequentially from Q4 and an increase of 7 rigs from prior year Q1. Our daily operating margins for the quarter were US $9,291 compared to US $8,754 sequentially from Q4, slightly exceeding our prior guidance range. Internationally, Precision averaged 7 active rigs down 8 rigs from prior year Q1. International day rates averaged US $51,596, an increase of 4% from prior year, all due to rig move revenues during the quarter. Rig margins were unfavorably impacted by one Kuwait rig coming down offset by one reactivated rig in Saudi Arabia. We incurred US $2 million of one time charges associated with this reactivation and in addition recognized added logistics costs tied to the Middle east conflict. In our Completion and Production (CMP) segment. Adjusted EBITDA was 18 million in line with prior year Q1 increased well servicing demand in Canada more than offset the impacts of winding down our U.S. operations back in the second quarter of 2025. Moving on to forward guidance, I will begin with our expectations for the second quarter of 2026 starting in Canada. As I previously alluded to, our strong presence in Canada’s unconventional natural gas and heavy oil markets is expected to generate record activity levels this quarter. Our ability to capitalize is largely due to growing demand coupled with our prior year rig upgrades, expanding the pad drilling capabilities of our fleet and allowing these assets to work through the traditional seasonal constraints of spring breakup. For the full quarter we expect to average active rig counts to be approximately 60 rigs, a 20% increase from the 50 average rigs working in prior year Q2. We expect the end of the quarter to be at the mid-70s, up a similar percentage from prior year as a result of more super singles working. Our operating margins in Canada are expected to range between $12,000 and $13,000 per day, slightly lower than normalized prior year Q2, all due to rig mix. Keep in mind that prior year quarter operating margins were materially impacted by one time customer upfront payments for rig upgrades. Our expectation is that pricing levels will remain firm within our Super Single and Super Triple fleet. In the US we expect to sustain the momentum we built in the last year. Early in Q2 we experienced increased contract turn with multiple rigs falling idle between jobs. This will correct over the next month or so with our rig count increasing to 35 rigs by next week exiting the quarter at our annual high within the high 30s. Beyond that level, we expect further precision rig count increases related to higher oil prices and our upgrade program. For the second quarter, we expect our operating margins to range between US 7,500 and US $8,500 a day due to increased reactivation costs tied to rig deployments through Q2 and into Q3. Given increased market demand for drilling rigs and precision super triples, we are in the process of implementing price increases which will flow to the back half of the year through the back half of year 26. Internationally we expect to run seven rigs. However, operating margins will be lower than prior year due to one higher margin Kuwait rig coming down in Q1 offset by recently reactivated lower margin rig in Saudi Arabia. For Q2 we expect to incur additional operating costs in response to ongoing tensions in the Middle East. Our CMP business continues to generate strong free cash flow driven by our well servicing and surface rentals business lines. For Q2, we expect EBITDA to remain in line with prior year levels. Moving on to forward guidance for the full year we’ve increased our capital expenditures budget to $265 million up from prior guidance of $245 million, which is now comprised of 168 million for sustaining an infrastructure and 97 million for upgrades. This increase includes two Canadian Super Triple rig upgrades underpinned by multi year contract commitments plus various oil weighted upgrade opportunities in both Canada and the US. Of note, we anticipate Q2 capital expenditures to be disproportionately high this quarter due to timing of bulk deliveries and scheduled maintenance capital projects leveling out through the back half of the year. Full year depreciation is expected to be 310 million and cash interest expense from debt is expected to be approximately 45 million. Our effective tax rate is expected to be approximately 25 to 30% with cash taxes remaining low in 2026. For 2026 we expect SGA to stay flat at approximately 95 million before share based compensation expense. As previously communicated, share based compensation guidance for the full year would range between 25 million and 45 million assuming a share price of 100 to 140 and a 1 times multiplier. Our long term target to achieve a net debt to adjusted EBITDA of less than one times remains firmly in place. In 2026 we were planning to reduce debt levels by at least 100 million while allocating up to 50% of free cash flow to share repurchases. Today we have an average cost of debt of 6.6% and over $433 million in total liquidity.

Kerry Ford (President and CEO)

With that, I’ll pass it over to Kerry. Thank you Dustin and good morning and good afternoon to everyone. From my prepared remarks, I plan to cover four areas. First, an update on our Middle east operations. Second, how we are growing revenue aligned with our first strategic priority. Third, our North American market outlook and fourth, a returns focused mindset that is foundational to Precision drilling. For an update on our Middle east operations, I want to recognize Precision’s leadership and crews for their performance over the past few months amid a dynamic regional environment and persistent uncertainty about where the conflict may lead next. In the face of these challenges, our team continues to focus on personnel safety and with all seven rigs delivering excellent results for our customers, we are all extremely proud of this team moving on to progress on our first strategic priority, growing revenue and deepening customer relationships. We are succeeding on several fronts, but I will focus on three field performance, our upgrade program and international optionality. There are many ways we measure field performance, but in general field performance is almost perfectly correlated with customer satisfaction, which is also almost perfectly correlated with the drilling contractor’s ability to grow revenue. Now forgive me as I will briefly get into the weeds talking about a key field performance metric which is mechanical downtime. This is the percentage of time a rig is down in the field due to a mechanical issue when it should be making hole for a customer. In short, unplanned downtime is bad and customers don’t like it, so we do everything we can to minimize it for precision. In Q1, mechanical downtime in the US was 0.59% and in Canada it was 0.48%. These figures are the best on record for Precision in each market and we believe they are industry leading. In Canada they were achieved in the highest activity Q1 we have had in over a decade. So why else is this metric important enough to highlight the performance results from our business acting on real time Data flows from the rig. Our scaled digital Twin initiative data driven sourcing of supply chain components, rig crews and maintenance practicing supporting a data driven approach. It is a true team effort with technology at the core. Furthermore, low downtime numbers are indicative of predictable repeatable performance which support safe operations and faster drill times. For those of you on the call who attended our Analyst and Investor Day in Houston one month ago, you saw firsthand how our digital platform is integrated and scaled into our operations and every operational support function, making these results possible and repeatable. Now there are multiple performance metrics demonstrating Precision’s progress in the field, a number of customer records set in the quarter, but I will stop short of …

Full story available on Benzinga.com

This post was originally published here

Precision Drilling (TSX:PD) released first-quarter financial results and hosted an earnings call on Thursday. Read the complete transcript below.

Benzinga APIs provide real-time access to earnings call transcripts and financial data. Visit https://www.benzinga.com/apis/ to learn more.

The full earnings call is available at https://edge.media-server.com/mmc/p/952icqoy/

Summary

Precision Drilling reported a significant increase in rig utilization for Q1 2026, with a 7% rise in Canada and a 24% increase in the U.S., despite a 7% industry rig count decline.

The company generated $63 million in operating cash flow and returned capital to shareholders through debt reduction and share repurchases, with 123 rigs operating globally.

Precision Drilling plans to increase capital expenditures to $265 million for 2026, focusing on strategic upgrades and sustaining infrastructure, while targeting a net debt to adjusted EBITDA ratio of less than one by reducing debt by at least $100 million.

Management highlighted strong field performance with record low mechanical downtime in Canada and the U.S., contributing to high customer satisfaction and revenue growth.

The company anticipates record Q2 activity levels in Canada and expects to increase rig counts in the U.S. in response to higher oil prices, with price increases planned for the second half of the year.

Full Transcript

OPERATOR

Good day and thank you for standing by. Welcome to the Precision Drilling Corporation 2023 First Quarter Results Conference call and webcast. At this time, all participants are in listen only mode. After the speaker’s presentation, there’ll be a question and answer session where we will take questions from research analysts. To ask a question during the session, you’ll need to press Star one one on your telephone. You will then hear an automated message advising your hand is raised. To withdraw your question, please press star one one again. Please be advised today’s conference is being recorded. I would now like to hand the conference over to your speaker today, Lavon Schudomik, Vice President, Investor Relations. Please go ahead.

Lavon Schudomik

Welcome and thank you everyone for joining Precision Drilling’s first Quarter Conference call and webcast. Today. I’m joined by Kerry Ford, our President and CEO, and Dustin Honing, our CFO. Please note that some comments today will refer to non IFRS financial measures and include forward looking statements which are subject to a number of risks and uncertainties. For more information on financial measures, forward looking statements and risk factors, please refer to Our news release MD&A and financial statements which are now available on Sedar and edgar. Before I pass the call over, I would like to highlight a couple points from our news release. First, utilization improved meaningfully in the quarter compared to Q1 of 2025. It increased 7% in Canada and 24% in the U.S. even as industry rig counts declined 7% in both markets. This performance underscores the value customers continue to see in our high performance high value strategy. Second, we delivered strong progress on our 2026 priorities, growing revenue year over year, generating $63 million in operating cash flow and returning capital to shareholders through debt reduction and share repurchases. In the first quarter, Precision had 123 rigs operating globally and remained the second most active driller in North America. With that, I’ll pass it over to Dustin.

Dustin Honing (Chief Financial Officer)

Thank you Lavon and good morning. Good afternoon. For those calling from different locations before we cover our 2026 Q1 financial results and outlook, I’ll briefly comment on our capital allocation strategy. As you’re likely aware, Precision has a longstanding reputation for publishing clear and transparent strategic priorities aligned with enhancing the competitive positioning of the business and driving enhanced shareholder returns. Over the last decade, Precision’s free cash flow generating abilities have allowed us to outpace expected timelines for delivering on major strategic initiatives, positioning the business with rapidly increasing financial flexibility. We remain committed to our shareholder return targets while responsibly investing back into the business with a return space mandate. These investments are paying dividends as we anticipate record Q2 activity levels in Canada and a notably strengthened utilization and customer mix in the US Evolving Maximizing strong free cash flow remains central to our strategy. Moving on to first quarter results despite our recurring and expected heavy Q1 working capital build, Precision generated 63 million of cash from operations. Capital expenditures were 65 million, comprised of 35 million for sustaining an infrastructure and 30 million for rig upgrades. These investments were made in step with our shareholder return commitments, reducing debt by 25 million and allocating 4 million towards share buybacks. We recorded adjusted EBITDA of 124 million which equates to 143 million before share based compensation expense compared with prior year Q1 EBITDA of 137 million 140 million before share based compensation expense. Although operating results exceeded prior year, this was offset by a larger stock based compensation accrual resulting from our share price appreciating 39% during the quarter. Net earnings were 18 million compared to 35 million in the first quarter of 2025. In Canada, drilling activity averaged 79 active rigs, an increase of 5 rigs from Q1 2025. Our reported Q1 daily operating margins were $14,282 compared to $14,780 in the prior first quarter 2025, falling within our prior guidance range. During the first quarter, Precision’s operating margins were slightly impacted by rig mix, with stronger demand requiring a higher proportion of super singles and doubles working through the winter. In the US we averaged 37 active rigs in line sequentially from Q4 and an increase of 7 rigs from prior year Q1. Our daily operating margins for the quarter were USD 9,291 compared to USD 8,754 sequentially from Q4, slightly exceeding our prior guidance range. Internationally, Precision averaged 7 active rigs down 8 rigs from prior year Q1. International day rates averaged USD 51,596, an increase of 4% from prior year, all due to rig move revenues during the quarter. Rig margins were unfavorably impacted by one Kuwait rig coming down offset by one reactivated rig in Saudi Arabia. We incurred US $2 million of one time charges associated with this reactivation and in addition recognized added logistics costs tied to the Middle east conflict. In our Completion and Production (CMP) segment. Adjusted EBITDA was 18 million in line with prior year Q1 increased well servicing demand in Canada more than offset the impacts of winding down our U.S. operations back in the second quarter of 2025. Moving on to forward guidance, I will begin with our expectations for the second quarter of 2026 starting in Canada. As I previously alluded to, our strong presence in Canada’s unconventional natural gas and heavy oil markets is expected to generate record activity levels this quarter. Our ability to capitalize is largely due to growing demand coupled with our prior year rig upgrades, expanding the pad drilling capabilities of our fleet and allowing these assets to work through the traditional seasonal constraints of spring breakup. For the full quarter we expect to average active rig counts to be approximately 60 rigs, a 20% increase from the 50 average rigs working in prior year Q2. We expect the end of the quarter to be at the mid-70s, up a similar percentage from prior year as a result of more super singles working. Our operating margins in Canada are expected to range between $12,000 and $13,000 per day, slightly lower than normalized prior year Q2, all due to rig mix. Keep in mind that prior year quarter operating margins were materially impacted by one time customer upfront payments for rig upgrades. Our expectation is that pricing levels will remain firm within our super Single and Super Triple fleet. In the US we expect to sustain the momentum we built in the last year. Early in Q2 we experienced increased contract turn with multiple rigs falling idle between jobs. This will correct over the next month or so with our rig count increasing to 35 rigs by next week exiting the quarter at our annual high within the high 30s. Beyond that level, we expect further precision rig count increases related to higher oil prices and our upgrade program. For the second quarter, we expect our operating margins to range between USD 7,500 and USD 8,500 a day due to increased reactivation costs tied to rig deployments through Q2 and into Q3. Given increased market demand for drilling rigs and precision super triples, we are in the process of implementing price increases which will flow to the back half of the year through the back half of 2026. Internationally we expect to run seven rigs. However, operating margins will be lower than prior year due to one higher margin Kuwait rig coming down in Q1 offset by recently reactivated lower margin rig in Saudi Arabia. For Q2 we expect to incur additional operating costs in response to ongoing tensions in the Middle East. Our CMP business continues to generate strong free cash flow driven by our well servicing and surface rentals business lines. For Q2, we expect EBITDA to remain in line with prior year levels. Moving on to forward guidance for the full year we’ve increased our capital expenditures budget to $265 million up from prior guidance of $245 million, which is now comprised of 168 million for sustaining an infrastructure and 97 million for upgrades. This increase includes two Canadian Super Triple rig upgrades underpinned by multi year contract commitments plus various oil weighted upgrade opportunities in both Canada and the US. Of note, we anticipate Q2 capital expenditures to be disproportionately high this quarter due to timing of bulk deliveries and scheduled maintenance capital projects leveling out through the back half of the year. Full year depreciation is expected to be 310 million and cash interest expense from debt is expected to be approximately 45 million. Our effective tax rate is expected to be approximately 25 to 30% with cash taxes remaining low in 2026. For 2026 we expect SGA to stay flat at approximately 95 million before share based compensation expense. As previously communicated, share based compensation guidance for the full year would range between 25 million and 45 million assuming a share price of 100 to 140 and a 1 times multiplier. Our long term target to achieve a net debt to adjusted EBITDA of less than one times remains firmly in place. In 2026 we were planning to reduce debt levels by at least 100 million while allocating up to 50% of free cash flow to share repurchases. Today we have an average cost of debt of 6.6% and over $433 million in total liquidity.

Kerry Ford (President and CEO)

With that, I’ll pass it over to Kerry. Thank you Dustin and good morning and good afternoon to everyone. From my prepared remarks, I plan to cover four areas. First, an update on our Middle East operations. Second, how we are growing revenue aligned with our first strategic priority. Third, our North American market outlook and fourth, a returns focused mindset that is foundational to Precision drilling. For an update on our Middle East operations, I want to recognize Precision’s leadership and crews for their performance over the past few months amid a dynamic regional environment and persistent uncertainty about where the conflict may lead next. In the face of these challenges, our team continues to focus on personnel safety, and with all seven rigs delivering excellent results for our customers, we are all extremely proud of this team moving on to progress on our first strategic priority, growing revenue and deepening customer relationships. We are succeeding on several fronts, but I will focus on three field performance, our upgrade program and international optionality. There are many ways we measure field performance, but in general field performance is almost perfectly correlated with customer satisfaction, which is also almost perfectly correlated with the drilling contractor’s ability to grow revenue. Now forgive me as I will briefly get into the weeds talking about a key field performance metric which is mechanical downtime. This is the percentage of time a rig is down in the field due to a mechanical issue when it should be making hole for a customer. In short, unplanned downtime is bad and customers don’t like it, so we do everything we can to minimize it for precision. In Q1, mechanical downtime in the U.S. was 0.59% and in Canada it was 0.48%. These figures are the best on record for Precision in each market and we believe they are industry leading. In Canada they were achieved in the highest activity Q1 we have had in over a decade. So why else is this metric important enough to highlight the performance results from our business acting on real time Data flows from the rig. Our scaled digital Twin initiative data driven sourcing of supply chain components, rig crews and maintenance practicing supporting a data driven approach. It is a true team effort with technology at the core. Furthermore, low downtime numbers are indicative of predictable repeatable performance which support safe operations and faster drill times. For those of you on the call who attended our Analyst and Investor Day in Houston one month ago, you saw firsthand how our digital platform is integrated and scaled into our operations and every operational support function, making these results possible and repeatable. Now there are multiple performance metrics demonstrating Precision’s progress in the field, a number of customer records set in the quarter, but I will stop short of covering those in detail and state that our rigs and crews are performing exceptionally well. Our customer satisfaction is high and we are growing revenue, but we still have more room for upgrades. We continue to execute our plan and are even expanding our growth investment to include two contracted Canadian Super Triple rig upgrades for delivery later this year in the first quarter. …

Full story available on Benzinga.com

This post was originally published here

Beyond Meat Inc (NASDAQ:BYND) shares are trading sharply higher on Thursday following an announcement that the U.S. Army is seeking to manufacture meatless proteins for field rations.

Army Seeks Alternative Protein Sources

The U.S. Army Combat Capabilities Development Command – Soldier Center (DEVCOM-SC) published a Sources Sought notice on Wednesday.

The Army aims to identify innovative research on product development for alternative proteins. This initiative seeks to enhance food supply chain resilience.

The notice specifically excludes cell-cultured or insect proteins, focusing on technologies like fermentation.

Q1 Earnings Date Spark Rally

Investor sentiment is also …

Full story available on Benzinga.com

This post was originally published here

Wayfair Inc. (NYSE:W) shares are trading lower on Thursday, even as solid growth and improving profitability in the first quarter couldn’t shake concerns about demand volatility in the home furnishings market.

• Wayfair stock is feeling bearish pressure. Why is W stock falling?

What Happened

The company reported first-quarter adjusted earnings per share of 26 cents, in line with the analyst consensus estimate. Quarterly sales of $2.90 billion (+7.4% year over year) outpaced the Street view of $2.89 billion.

U.S. net revenue of $2.6 billion increased 7.5% year over year, while International net revenue of $319 million increased 6% year over year.

Adjusted Gross Profit in the quarter …

Full story available on Benzinga.com

This post was originally published here

The private‑credit market has hit a rough patch in recent months, with weakening investor sentiment and rising redemption requests at non‑traded business development companies (BDCs) signaling mounting stress.

Michael Lebowitz, a portfolio manager at RIA Advisors, believes that the “chaos and bad press” surrounding private credit has dragged down both strong and weak players in the sector. 

“The poor sentiment toward private credit funds has dragged down many high-quality BDCs, as well as weaker ones. The chaos and bad press surrounding private credit funds are not reasons to avoid BDCs. In fact, we think it’s a reason to consider it,” Lebowitz wrote on X.

According to a recent Bank of America report as cited by PitchBook, redemption activity in BDCs will reach its highest point in the second quarter of 2026, following record levels seen in the first quarter.

The increase will continue into the second quarter as “advisors request more than needed in reaction to the prorations,” which capped withdrawals at roughly 5% across most BDCs. As a result, some investors are expected to attempt to recover unmet redemption requests from the prior quarter, the report stated. 

data-variant=”card”
data-news-mode=”manual”

>


Read Also:

Cramer Puts Pressure On Private Equity: ‘You Gotta Sell Something’

This post was originally published here

Beacon Financial (NYSE:BBT) reported first-quarter financial results on Thursday. The transcript from the company’s first-quarter earnings call has been provided below.

This content is powered by Benzinga APIs. For comprehensive financial data and transcripts, visit https://www.benzinga.com/apis/.

The full earnings call is available at https://events.q4inc.com/attendee/947331842

Summary

Beacon Financial completed a significant core systems conversion in Q1, enhancing client retention despite financial performance falling short of expectations.

GAAP earnings were $0.55 per share, with operating earnings at $0.70 per share, reflecting a challenging environment with balance sheet contraction and margin pressure.

The company plans to focus on executing strategic priorities, stabilizing the balance sheet, and achieving growth as merger-related charges and system conversions are complete.

Operating return on assets was 1.01%, and operating return on tangible common equity was 11.24%, with disciplined expense management and core profitability despite revenue declines.

The board approved a quarterly dividend of 32.25 cents per share and authorized a $50 million stock repurchase program, pending regulatory approval.

Credit metrics showed slight deterioration, with non-performing loans rising to 83 basis points of total loans, but reserves remain robust at 1.36% of loans.

Loan growth is expected to be soft in Q2 but should strengthen later in the year, with the margin stabilizing around 3.80% and gradually improving.

Management is confident in closing the performance gap as uncertainties like interest rates and legislative factors are resolved.

Full Transcript

Tina (Conference Operator)

Thank you for standing by. My name is Tina and I will be your conference operator today. At this time I would like to welcome everyone to the Beacon Financial Report Corporation first quarter 2026 earnings conference call. All lines have been placed on mute to prevent any background noise. After the speaker’s remarks, there will be a question and answer session. To ask a question, simply press star one on your telephone keypad. To withdraw your question, press star one again. It is now my pleasure to turn the call over to Dario Hernandez, Corporate Counsel. You may begin.

Dario Hernandez (Corporate Counsel)

Thank you Tina and good afternoon everyone. Yesterday we issued our earnings release and presentation which is available on the investor relations page of our website beaconfinancialcorporation.com and has been filed with the SEC. This afternoon’s call will be hosted by Paul Peralt and Carl Carlson. During the question and answer session they will also be joined by Mark Miklejohn, the Chief Credit Officer. This call may contain forward looking statements with respect to the financial condition results of operations and business of Beacon Financial Corporation. Please refer to page two of our earnings presentation for our forward looking statement disclosure. Also, please refer to our other filings with the Securities and Exchange Commission which contain risk factors that could cause actual results to differ materially from these forward looking statements. Any references made during this presentation to non GAAP measures are only made to assist you in understanding Beacon Financial’s results and performance trends and should not be relied on as financial measures of actual results or future predictions. For a comparison and reconciliation to GAAP earnings, please see our earnings release at this time. I’m pleased to introduce Beacon Financial’s President and Chief Executive Officer Paul Peralt.

Paul Peralt (President and Chief Executive Officer)

Thanks Dario and good afternoon everyone and thank you for joining us for our first quarter earnings call. I’m pleased to share that we achieved a major milestone in our integration process in the first quarter with the successful completion of a core systems conversion in mid February. I would like to recognize the hard work and dedication of our teams in executing on this very critical step and just as importantly, their efforts to achieve strong client retention throughout that process. That outcome reflects months of preparation, disciplined execution and a continued focus on serving clients during a period of significant change. From a financial perspective, I am very disappointed with our first quarter results. Loan growth and the margin fell far short of our expectations and reflects some near term pressures, uncertainty in the economic environment and the tail end of merger-related activity. GAAP earnings for the first quarter were $0.55 per share and operating earnings were $0.70 per share excluding merger related charges. While operating results were below both of our prior quarter and our expectations. The core returns remained good with operating ROA just over 1% and operating return on tangible common equity of 11 and a quarter percent. As we discussed coming out of the fourth quarter, the operating environment during the first quarter remained quite challenging. Balance sheet contraction, margin pressure from declining rates and lower fee income all weighed on our results. Importantly, several of these headwinds are not structural in nature. They were influenced by seasonal dynamics, timing and the uncertainty created in economic environment from persistent inflation, extremely thin pricing, global events and the prospect of rent control legislation in our major markets. Collectively, these headwinds impacted loan volumes. While the pipelines remain strong, clients are cautious yet optimistic as the economic environment remains quite fluid. Excuse me. On the positive side, we continue to make progress on the strategic priorities we laid out at the time of the merger. Expense discipline remains strong. Core funding costs improved sequentially. Capital levels are robust with CET1 at 11% and tangible common equity at just over 9%. And while credit metrics moved modestly higher during the quarter, they remain manageable and well reserved, reflecting proactive credit management in a still uncertain environment. Now that the systems conversion is behind us and merger charges are largely complete, our focus shifts squarely to execution, stabilizing the balance sheet, restoring growth momentum and fully capturing the revenue and efficiency benefits we outlined when we announced the merger. We believe the pieces are now in place to close the gap between current performance and our planned Runway as we move through the remainder of the year. Before I turn it over to Carl, I’ll note that our board approved a quarterly dividend of 32.25 cents per share, consistent with our commitment to returning capital to stockholders. In addition, the board authorized a $50 million stock repurchase program subject to regulatory approval, reflecting our confidence in the franchise, our capital strength and long term value creation opportunity that we see ahead. I will now turn it over to Carl to walk us through the financial results in some more detail. Carl?

Carl Carlson

Thank you Paul. I’ll begin with the high level summary of the quarter and then walk through the income statement, balance sheet and credit trends in more detail. First quarter operating results declined sequentially driven primarily by balance sheet contraction, modest net interest margin pressure tied to the rate environment and lower non interest income. GAAP earnings totaled $46.2 million or $0.55 per share. Operating earnings were 58.4 million or $0.70 per share, which excludes $13 million of one time pre tax merger related charges. Operating return metrics remained healthy. Operating ROA was 1.01% and operating return on tangible common equity was 11.24%, reflecting continued expense discipline and solid core profitability even with lower revenues. Turning to the income statement in more detail, managed income was $190.8 million, down 8.9 million or 4% from the fourth quarter. This decline was driven by lower average earning assets and a modest reduction in asset yields. As rates moved lower in late 2024, the net interest margin declined by 4 basis points to 3.78%. Importantly, funding costs improved sequentially. Interest bearing deposit costs declined 17 basis points and we expect continued improvement as pricing actions taken continue to flow through as balance sheet growth resumes. We believe this positions the margin more favorably. Looking ahead, non interest income totaled 23.9 million, down 2 million or 8% from the prior quarter. The decline was primarily driven by lower deposit fees and reduced gains on loan sales as SBA activity moderated from a very strong fourth quarter. These declines were partially offset by higher mark to market income on derivatives, tax credit, investment income and relatively stable wealth management fees. On the expense side, operating costs remained well controlled. Total managed expense was essentially flat compared to the fourth quarter came in nearly 1 million below budget. This performance reflects disciplined cost management and continued execution against merger synergies, offset modestly by seasonal increases in occupancy costs and a true up in FDIC insurance. Excluding merger charges, the operating efficiency ratio for the quarter was 59.5%, underscoring the underlying expense discipline in the business. Now turning to the balance sheet, total assets declined $992 million to $22.2 billion, driven primarily by lower cash balances associated with point in time payroll fulfillment deposits. Loans declined approximately 1%, reflecting continued runoff in the commercial real estate and consumer portfolios, partially offset by growth in core commercial lending. Loan originations and draws were 734 million, with a weighted average coupon of 628 basis points. 67% of originations were floating rate deposits declined 6%, driven largely by payroll deposits and brokered balances. Excluding payroll and brokered deposits. Core customer deposits declined approximately 2%, reflecting typical seasonal outflows related to tax payments and commercial activity. Turning to credit Credit metrics deteriorated modestly during the quarter. Non Performing loans increased to 83 basis points of total loans, driven primarily by migration of Boston office exposure and several rent controlled multifamily properties in New York City. Net charge offs total 13.6 million or 30 basis points annualized, reflecting resolutions of a small number of larger credits. The allowance for loan losses closed the quarter at 244 million, representing 1.36% of loans. Given portfolio composition and current risk trends, we believe reserve coverage remains appropriate. Provision expense declined modestly from the prior quarter and we continue to expect provisioning to be less than that. Charge offs as we work through existing criticized credits. Capital generation remains a clear strength. CET1 ended the quarter at 11%, tangible common equity at 9.1% and tangible book value increased $0.16 to $23.48 per share. Importantly, with the core systems conversions completed in early February, we have now recognized the final significant merger charges. Total merger costs were in line with expectations and management is confident the announced cost synergies of the merger have been realized. Looking ahead, we anticipate improving earnings momentum now that the merger costs and system conversions are completed and announced expense synergies have been realized. We expect loan growth to remain soft in the second quarter, then strengthen throughout the remainder of the year. We expect the margin to stabilize around 380 basis points and gradually improve. While near term, macro and rate uncertainties remain. We believe the franchise is well positioned to improve performance and close the gap to our targeted run rate over the coming quarters. That concludes my prepared remarks. Back to you, Paul. Thank you, Carl.

Paul Peralt (President and Chief Executive Officer)

We will now be joined by Mark Meljohn and Michael McCurdy and we’ll open it up for questions.

Tina (Conference Operator)

As a reminder to ask a question, simply press Star one on your telephone keypad. And our first question comes from the line of Justin Crawley with Piper Sandler. Please go ahead.

Justin Crawley (Equity Analyst)

Hey, good afternoon everyone.

Paul Peralt (President and Chief Executive Officer)

Hi Justin.

Justin Crawley (Equity Analyst)

Just wanted to start out on the margin in the outlook there. Can you just, Carl, maybe provide a little more detail on the reset on accretion expectations? Just what changed from the original assumptions that went into that and what got you from 15 down to that $12 million number just on a go forward basis?

Carl Carlson

Sure. Thanks for the question. So when we first estimated the purchase accounting, we tried to take out the impact of prepayments and things of that nature and we’re estimating at around 15 million. A lot of the schedules suggested that we’ve got these, these all set up in our systems to track as loans pay down and it’s coming in a little bit lower and we’re not seeing any kind of prepayment activity at this point that that’s meaningful to the amounts. And so we’re it’s coming in for this quarter came in at 12.1. I believe it was over 13 million last quarter. And so I’m feeling more confident that the $12 million range is something now that the System conversions have been taking place. We’re all on the. We had two general ledger conversions, and all the systems conversions onto a new system. I feel more confident that this will be the number going forward.

Justin Crawley (Equity Analyst)

Okay, understood. And just I guess some of the moving pieces there, you know if I look at the average balance sheet and just loan yields what they did for the quarter that 596 was down over 30 basis points and you pointed it out but you know without a huge huge swing in accretion income, you know and …

Full story available on Benzinga.com

This post was originally published here

Elon Musk took the stand Thursday, accusing OpenAI of stealing a charity before he admitted that his own AI startup, xAI, had “partly” distilled OpenAI’s models to build Grok.

The Tesla Inc. (NASDAQ:TSLA) CEO is suing OpenAI for $150 billion in damages, alleging the start-up betrayed its founding nonprofit mission.

Under cross-examination from OpenAI lead counsel William Savitt on day three of the federal trial in Oakland, Musk was asked whether xAI had distilled OpenAI’s models.

“Generally AI companies distill other AI companies,” Musk replied. Pressed for a yes or no, he answered “partly.”

Distillation, the practice of using one AI model to train another, is banned by OpenAI’s terms of service. Bloomberg has separately reported that xAI engineers have leaned on Anthropic models for coding.

Musk vs Scam Altman

The animosity between the two former co-founders has been hard to miss. Musk has taken to calling Sam Altman “Scam Altman” on X, and is seeking his removal from the OpenAI board alongside a reversal of …

Full story available on Benzinga.com

This post was originally published here

Biogen (NASDAQ:BIIB) reported upbeat earnings for the first quarter on Wednesday.

The company posted quarterly earnings of $3.57 per share which beat the analyst consensus estimate of $3.01 per share. The company reported quarterly sales of $2.478 billion which beat the analyst consensus estimate of $2.255 billion.

Biogen cut its FY2026 adjusted EPS guidance from $15.25-$16.25 to $14.25-$15.25.

Biogen shares fell 1.3% to trade at $191.84 on Thursday.

These analysts made changes to their price targets on Biogen following earnings announcement.

  • Wedbush analyst …

Full story available on Benzinga.com

This post was originally published here

Broadcom Inc. (NASDAQ:AVGO) shares rose on Thursday morning. The stock is outperforming the Nasdaq, which slipped 0.42%. This surge follows massive capital expenditure signals from tech hyperscalers.

• Broadcom stock is showing upward movement. Why are AVGO shares climbing?

Hyperscaler Spending Validates AI Demand

Investors are reacting to earnings from Meta Platforms Inc. (NASDAQ:META) and Microsoft Corp. (NASDAQ:MSFT). These giants signaled continued investment in artificial intelligence infrastructure.

Analysts at JPMorgan project that the top four U.S. hyperscalers will drive a $200 billion increase in data center capex by 2026.

Analysts Call …

Full story available on Benzinga.com

This post was originally published here

Newmark Group (NASDAQ:NMRK) reported first-quarter financial results on Thursday. The transcript from the company’s first-quarter earnings call has been provided below.

This transcript is brought to you by Benzinga APIs. For real-time access to our entire catalog, please visit https://www.benzinga.com/apis/ for a consultation.

The full earnings call is available at https://event.webcasts.com/starthere.jsp?ei=1758449&tp_key=12af26fa8a

Summary

Newmark Group reported significant year-over-year cash flow growth, aligning with adjusted EPS expectations, maintaining strong financial flexibility.

The company is actively expanding into data center opportunities despite concerns about CapEx and power availability, noting continued strength and client interest in this sector.

Recent acquisitions have enhanced cross-selling opportunities, particularly in fund administration, property accounting, and related services, contributing to growth.

Geographic expansion is progressing, with notable growth in Europe and other international markets, outpacing U.S. revenue growth.

Management expressed confidence in raising guidance despite a turbulent market, citing strong pipelines and continued transaction closings.

AI and infrastructure management are strategic focus areas, with AI enhancing productivity and infrastructure management expanding into technical facilities and energy sectors.

The company sees significant opportunities in advanced manufacturing and is aligning with hyperscalers despite community pushback on data centers.

The affordable housing sector is gaining traction, driven by strategic hires and investor interest in alternative asset classes.

Full Transcript

OPERATOR

With that, I would now like to open the call for questions. Thank you. If you are dialed in via the telephone and would like to ask a question, please Signal by pressing STAR 1 on your telephone keypad. If you are using a speakerphone, please make sure your mute function is turned off to allow your signal to reach our equipment. Again, please press STAR 1 to ask a question and we will take our first question from Alex Goldfarb with Piper Sandler.

Alex Goldfarb (Equity Analyst)

Hey, morning. Good morning. Two questions. First Mike, you know the guidance increase. Great. You know it’s impressive. Curious how your expectation for cash flow growth, you know, has changed. Is it mirroring growth that you now expect in the adjusted EPS or is cash flow expected to grow differently from earnings?

Mike

Morning, Alex. Yeah, I think our cash, our cash flow is going to grow in line with earnings as we said. And as you can see in the release, it’s up significantly year-over-year on a trailing twelve-month basis. And we continue to just generate a lot of cash flow from the business which gives us a significant amount of flexibility.

Barry

Okay, and the second question is, Barry, you guys have expanded into data centers. Obviously there’s a lot of leasing from AI and office spaces, but there are all these stories that we read about, you know, CapEx loads you can see with the big tech have increased their capex. There’s concern about power availability and whether or not there’s too much capital chasing data centers or not. But as you work with your clients and data centers are the, are the power and CapEx concerns, you know, playing out and affecting how data centers are being invested in or how your clients are looking at them? Or are these headlines that we read sort of, I don’t want to say noise, but sort of noise around the edges and it hasn’t changed the velocity at which people are, you know, investing and breaking ground on new data centers. Yeah, the behind the change from using the grid to behind the meter and developing distributed power requires additional expertise in structuring these transactions, which is good for us because we’ve been involved in the more complex transactions around structuring credit and the ability to get money for compute. And we think the velocity as we see it now, the pipeline looks really, really good and it’s still people are aggressively pursuing opportunities and some of the deck chairs are changing. Some more of the power companies are getting involved closer up into the hyperscaler side of the business because they’re holding the cards. So understanding how to navigate in this environment is really interesting and good for us. And we’re really actively pursuing today, powered land where you were next to the grid or next to an oil or gas basin is almost any piece of dirt is available, subject to the community pushback to be created into either some form of digital infrastructure and hyperscaling, as opposed to the limited supply of land that was available right next to the grid and the ability for the grid to provide power. So it actually opens it up and requires people to be more expert about this. So we think it’s good for us. Okay, so Net, you are not seeing any slowdown in the appetite as people face these challenges? You’re seeing continued strength in your data center business. Yes. Okay, cool. Thank you.

OPERATOR

Thank you. And we will take our next question from Mitch Germain with Citizens Bank.

Mitch Germain (Analyst)

Thank you and congrats on the quarter. Just curious, obviously a couple acquisitions. I think you even mentioned one …

Full story available on Benzinga.com

This post was originally published here

Tetra Tech (NASDAQ:TTEK) held its second-quarter earnings conference call on Thursday. Below is the complete transcript from the call.

This content is powered by Benzinga APIs. For comprehensive financial data and transcripts, visit https://www.benzinga.com/apis/.

The full earnings call is available at https://events.q4inc.com/attendee/145752051

Summary

Tetra Tech reported an 8% year-over-year increase in net revenue for the second quarter, driven by demand for consulting services in water, environment, and sustainable infrastructure.

The company achieved an all-time record second-quarter EBITDA of $146 million, resulting in a margin expansion of 90 basis points compared to the previous year.

The backlog increased by 8% sequentially, reaching $4.28 billion, indicating strong demand for the company’s services.

Tetra Tech’s Government Services Group grew by 5% year-over-year with a margin increase of 220 basis points, while the Commercial International Group saw a 10% revenue increase with a 12.2% margin.

The company reported strong cash flows from operations, with a record $238 million generated in the first half, and a significant improvement in DSO to 58 days.

Tetra Tech increased its guidance for the full fiscal year 2026, raising net revenue expectations to $4.25 – $4.4 billion and adjusted EPS guidance to $1.50 – $1.58.

The company announced an 11% increase in its quarterly cash dividend and continued its stock buyback program, demonstrating confidence in its financial position.

Full Transcript

OPERATOR

Good morning and thank you for joining the Tetra Tech Earnings call. As a reminder, Tetra Tech is also simulcasting this presentation with slides in the Investor SECtion of its website and this call is being recorded at the request of Tetra Tech and this broadcast is the copyrighted property of Tetra Tech. Any rebroadcast of this information in whole or part without the prior written permission of Tetra Tech is prohibited. With us today from management are Roger Argust, Chief Executive Officer and President and Steve Burdick, Chief Financial Officer. They will provide a brief overview of the results and will then open the call for questions. I would like to direct your attention to the Safe harbor statement in today’s presentation. Today’s discussion contains forward looking statements about future business and financial expectations. Actual results may differ significantly from those projected in today’s forward looking statements due to various risks and uncertainties, including the risks described in Tetra Tech’s periodic reports filed with the SEC. Except as required by law, Tetra Tech undertakes no obligation to update its forward looking statements. In addition, since management will be presenting some non GAAP financial measures as references, the appropriate GAAP financial reconciliations are posted in the Investors SECtion of Tetra Tech’s website. At this time I would like to inform you that all participants are in a listen only mode. At the request of the company, we will open the conference for questions and answers after the presentation. With that, I would now like to turn the call over to Roger Argus. Please go ahead Mr. Argust.

Roger Argust (Chief Executive Officer and President)

Thank you Christine Good morning and welcome to our fiscal year 2026 Second Quarter Earnings Conference call. I’m pleased to join you today for my first quarterly call as CEO of Tetra Tech. I want to begin by recognizing Dan Batrack’s leadership for more than two decades. Dan and I have worked together for many years and I’m grateful for his continued partnership and support as our Executive Chairman. Tetra Tech’s success is made possible by our 25,000 employees around the world. I’ve had the privilege of working with many of our technical teams across our operations. Their expertise, client commitment and ability to solve complex problems are what make Tetra Tech different. Demand for clean water, environmental quality and resilient infrastructure continues to grow worldwide. Our strategy is not changing. We will continue to focus on high end solutions that address the complex challenges where our clients need us most. For the call today, I will begin with an overview of our second quarter’s performance and the client markets that are driving our growth. Steve Burdick, our Chief Financial Officer, will provide additional detail on Our Financial performance and Capital Allocation we delivered a strong second quarter with positive performance across our key financial metrics. Net revenue increased by 8% during the quarter on a year over year basis supported by demand for our high end consulting services in water, environment and sustainable infrastructure. EBITDA of $146 million resulted in a margin expansion of 90 basis points when compared to last year and is an all time record for a second quarter. Earnings per share were $0.36 including $0.02 associated with the completion of the divestiture of our Norwegian operations.. Our adjusted earnings per share of $0.34 exceeded the high end of our guidance and was also the highest for any second quarter. And importantly, our backlog increased by 8% sequentially and is now $4.28 billion which illustrates the resiliency of our technically differentiated meeting with science approach. Overall, the quarter demonstrated the strength of our business model. We are growing in the right markets, improving margins and entering the second half of the fiscal year with strong momentum. I would now like to discuss our performance by segment. The Government Services Group or GSG grew 5% in the second quarter on a year over year basis and generated a margin of 16.3% up 220 basis points from last year. Demand remained solid for our water, environment, defense and resilient infrastructure services. The Commercial International Group or CIG also performed well with revenue up 10% from the prior year and a margin of 12.2%. CIG’s diversified mix of clients across water, environmental, power and energy markets worldwide provided growth across the key geographies that we work in. I would now like to provide an overview of our net revenue by customer. Our US federal work was up 11% last year and represented 20% of our business. This growth was driven by our work with the U.S. army Corps of Engineers for resilient infrastructure including flood protection and inland navigation, defense, facility systems modernization and major planning and permitting programs for defense. Our U.S. state and local business grew 9% this quarter on a year over year basis and represented 14% of our business. Growth was driven by municipal water projects, primarily in the high priority regions of Florida, Texas, California and Virginia. Our US commercial business represented 19% of our business and was down 2% compared to last year. We did see a significant increase in revenues for energy and transmission related services. However, this growth was offset by a reduction in renewable energy services, especially associated with the wind down of the large offshore wind programs we worked on last year. Our international work was up 12% on a year over year basis driven by revenue growth in water services in the UK Ireland and the Netherlands, increase in infrastructure services in Canada and growth in the digital automation revenues in Australia. I would now like to discuss our backlog. We had a strong quarter for new orders and our backlog increased 8% sequentially. This is an important indicator of our increased demand for our services. As we’ve stated before, we take a conservative approach to backlog. We include only work that is contracted, funded and authorized. This gives us high quality visibility into future performance and increases our confidence in our project pipeline. Our backlog growth was supported by several important wins across our priority markets. In the United States we added more than $650 million in contract capacity from U.S. defense clients for water and resilient infrastructure services. These projects support critical infrastructure needs that align directly with our strengths in water, environmental services, engineering, design and digital systems. In Northern Ireland, we added a new 18 million British pound single award contract for water and wastewater treatment services. In the Netherlands we added a framework contract that significantly expands our capacity in key regions with planned investments to address essential flood protection and infrastructure modernization needs. At the Port of Los Angeles, we were awarded a Master Service agreement that supports one of the most important trade and logistics gateways in the United States. And finally, we further expanded high end solutions for United Utilities in the UK with our waternet software that provides a comprehensive platform for managing priority water leakage detection and water delivery modernization needs. I will now turn the call over to Steve Burdick, our Chief Financial Officer to discuss our financial results and capital allocation in more detail.

Steve Burdick (Chief Financial Officer)

Steve, well hey, thank you Roger. I would like to now provide an update on our reported year-to-date fiscal 2026 results, working capital, Cash Flows and Capital Allocation so as Roger just discussed in this call, our market leading focus on the front end consulting and design for water and environmental projects are carrying higher margins across all of our end markets. As such, even as the reported revenue was down from last year due primarily to the decrease in revenue from USAID customers and revenues from one-time disasters this year compared to last year our operating income increased significantly and adjusted EBITDA on net revenue for the quarter increased by 100 or for the yeah for the quarter year to date increased by 110 basis points to 14% for the first half of fiscal 2026. These results further support our long term strategic goals in improving ebitda margins by 50 basis points annually. As a result of our ability to enhance our profit margins and further manage our working capital, we were able to increase earnings per share (EPS) over last year and come in well above our previous guidance range for the second quarter. Now, regarding our working capital, Cash flows generated from operations for the first half of the year were a historical record at $238 million which represents a significant improvement over fiscal 2025 and consistent with the last 20 plus years, our operating cash flows have continued to exceed net income. Our focus on working capital and cash flows has resulted in our Days Sales Outstanding (DSO) reflecting an industry leading standard of 58 days, which is a nine day improvement compared to Q2 of last year. This lower Days Sales Outstanding (DSO) metric provides a significant insight into our core business as it reflects outstanding work that our project managers lead relative to higher quality projects highly satisfied clients in our broad portfolio across all of our end markets and geographies. Our net debt is amounted to about $657 million and the net debt on EBITDA was at a leverage of 1.0 times which is about which is a little over 25% lower than our leverage ratio one year ago when it stood at 1.36 times. As we continue to execute on high quality operating results with increasing margins, our operating cash flows in excess of net income and lower working capital KPIs we will continue to provide higher returns for our shareholders and those higher shareholder financial returns are reflected in an improving return on capital employed which now stands at over 20%. So with that perspective I would like to now present our capital allocation strategy and overview. We have a very strong balance sheet, probably the strongest balance sheet in our history, and our operating cash flow was $688 million for the trailing twelve month period. Now Roger will discuss our strategic growth areas later in this presentation, but I do want to point out that our balance sheet and cash flows provide us with significant liquidity available to invest in organic and acquisitive growth priorities in order to take advantage of these key business opportunities, which includes technology and automation which also continues to provide us a dominant position in those markets. During the second quarter and third quarter to date, we have closed the acquisitions of technical leaders focused on defense such as halvik in the U.S. providence in Australia. And regarding our dividend program, I’m pleased to announce that our board of Directors approved the quarterly cash dividend which is an 11% increase year over year to be paid in the third quarter. This is the 44th consecutive quarterly dividend with annual double digit increases in the amounts to be paid and based on the lower leverage, we’ve continued our stock buyback program this year and in the first half of 2026 we bought back a total of $100 million. We do have 498 million available from the stock buyback plan approved by our board as part of our capital allocation strategy. So I’m pleased to share these really strong results for the start of fiscal 2026, which has enabled us to increase shareholder returns as we can pay, increasing dividends, increase our stock buybacks, engage in accretive acquisitions, all the while deleverage our balance sheet. I want to thank you for your support and I will now hand the call back over to Roger to discuss Tetra Tech’s growth opportunities for 26 and beyond.

Roger Argust (Chief Executive Officer and President)

Thank you, Steve. I would now like to provide an update for our outlook for the second half of fiscal year. We are beginning the third quarter with strong backlog and clear growth opportunities across our markets. As a result, we are increasing our forecasted growth rates for the second half of the year for both our US Federal and US Commercial client sectors to 8 to 12%. Together, these sectors represent 40% of our revenues. We expect US Federal to increase as our clients deploy funding to address both Domestic civil works programs, Defense Facility Modernization Globally, US Commercial’s increased growth rates align with the expected demand for water management for mining operations, expansion of domestic rare earths mine development and further acceleration of the upfront work of planning and permitting for power generation and transmission. International work we expect to grow at a 5 to 10% rate with continued strength in the United Kingdom, Ireland, the Netherlands, water and expected marine defense infrastructure spending in the UK and Australia. State and local work is expected to be about 15% of our business with a growth rate in the high single digits between 5 and 10%. Our long term outlook remains strong with state and local spending increasing regionally in alignment with demand. I’ll now discuss our U.S. commercial, U.S. defense and U.S. state and local municipal water business each in a bit more detail. Our US Commercial business …

Full story available on Benzinga.com

This post was originally published here

ONEOK Inc (NYSE:OKE) reported mixed results for the first quarter, after the closing bell on Tuesday.

The company posted quarterly earnings of $1.23 per share which missed the analyst consensus estimate of $1.31 per share. The company reported quarterly sales of $9.618 billion which beat the analyst consensus estimate of $8.234 billion.

“ONEOK’s first-quarter performance reflects year-over-year volume growth and continued operational execution across our integrated asset portfolio,” said Pierce H. Norton II, ONEOK president and CEO. “Strong performance across multiple business segments, supported by a constructive market environment, is strengthening our forward outlook, building momentum through …

Full story available on Benzinga.com

This post was originally published here

On Thursday, Choice Hotels Intl (NYSE:CHH) discussed first-quarter financial results during its earnings call. The full transcript is provided below.

This transcript is brought to you by Benzinga APIs. For real-time access to our entire catalog, please visit https://www.benzinga.com/apis/ for a consultation.

The full earnings call is available at https://events.q4inc.com/attendee/640056043

Summary

Choice Hotels Intl reported first-quarter results in line with expectations, highlighting an inflection point in underlying trends with improvements in rooms growth, RevPAR, and lower capital intensity.

The company emphasized its asset-light growth model, improving franchisee economics, and increased royalty rates, leading to consistent earnings growth and shareholder returns.

U.S. net rooms growth improved, with gross openings up 32% year-over-year and a strong U.S. pipeline providing visibility into future growth.

International operations showed strong performance, with a 13% year-over-year increase in net rooms and significant growth in Canada following a shift to direct franchising.

Choice Hotels Intl is investing in AI and technology to enhance franchisee operations and guest experience, with initiatives like the AI-enabled EasyBid platform increasing group business conversion rates.

The company maintained its full-year guidance, expecting adjusted EBITDA between $632 million and $647 million and adjusted EPS between $6.92 and $7.14, despite macroeconomic uncertainties.

Management highlighted strong franchisee demand for its extended stay and mid-scale brands, with a focus on conversion-led growth and reducing hotel development costs.

Full Transcript

OPERATOR

Ladies and Gentlemen, thank you for standing by. Welcome to Choice Hotels International’s first quarter 2026 earnings call. At this time all participants are in a listen only mode. Following the presentation, we will open up the lines for questions. I will now turn the call over to Ali Summers, Senior Director of Investor Relations. Please go ahead.

Ali Summers (Senior Director of Investor Relations)

Good morning and thank you for joining us. Before we begin, please note that today’s discussion includes forward looking statements as defined under U.S. securities laws. These statements are subject to risks and uncertainties that could cause actual results to differ materially from those expressed or implied. For more information, please refer to our filings with the SEC and including our most recent Forms 10-K and 10-Q. These statements speak only as of today and we undertake no obligation to update them. A reconciliation of any non GAAP financial measures referenced in today’s remarks is included in our earnings press release available on the Investor relations section of ChoiceHotelsIntl.com joining me this morning are Patrick Pacious, our President and Chief Executive Officer, and Scott Oaksmith, our Chief Financial Officer. Pat will discuss our business performance and strategic progress and Scott will review our financial results and outlook. And with that I’ll turn the call over to Pat.

Patrick Pacious

Thank you Ali and good morning everyone. We appreciate you joining us today. We delivered first quarter results in line with our expectations, signaling an inflection point in underlying trends toward rooms growth, RevPAR improvement and lower capital intensity. The work we have done over the past several years has now positioned us as a more accretive asset light growth model with significantly lower capital intensity and stronger unit economics which is reflected in the continued expansion in our average royalty rate. Taken together, this supports more consistent earnings growth and increasing returns to shareholders at choice. Our strategy is built on a straightforward repeatable model. Improving franchisee economics drives demand and rooms growth which we convert into higher quality earnings and free cash flow. We reinvest that cash in high return capital light opportunities and return excess capital to shareholders in a disciplined and increasingly predictable way. We are now seeing this translate more clearly into our results. First, US Net rooms growth is inflecting and improving sequentially with GROSS Openings up 32% year over year, first quarter hotel openings at a five year high and exits at their lowest level since 2023. Our U.S. pipeline is also expanding sequentially providing greater visibility into future growth. At the same time, our international portfolio continues to scale as an additional growth engine. Second, franchisee unit economics are improving driven by stronger revenue delivery and lower hotel development and operating costs. This is resulting in stronger returns across the system reflected in our strong voluntary franchisee retention rate and continued expansion in our average royalty rates. With improving RevPAR now flowing through a higher quality of more revenue intense system and third, as we move beyond a period of elevated investment that has achieved its strategic objectives, capital intensity is now declining materially with development outlays coming down. As market conditions continue to improve, we intend to accelerate capital recycling further enhancing our ability to return capital to shareholders and drive a more consistent capital return Profile we were pleased with the quarter and in the 46 states not impacted by hurricanes, RevPAR was up 1.8% year over year driven by gains in occupancy. Looking ahead, as we move past last year’s hurricane impact, demand continues to benefit from tax refunds and is expected to be further supported by event driven travel this summer such as the FIFA World cup and the US 250th anniversary. More broadly, we are seeing strength across our core segments supported by several structural trends that are already driving performance today. Affordability remains a key factor in travel decisions, aligning directly with our value oriented brands and core middle income customer and we are seeing continued strength in small and mid sized business travelers and group demand. Employment growth continues in sectors such as healthcare, construction and utilities, driving workforce based travel from customers who rely on our hotels. In addition, repeat stays from the rising number of retirees and road trips provide a stable base of demand. We are also seeing a shift in guest expectations toward accommodations that feel more like home, supporting strong demand for our extended stay portfolio. Importantly, these are not future tailwinds, they are trends we are seeing in the business today contributing to a stable and diversified demand base across cycles. So when you step back the story is clear. Room growth is inflecting, unit economics are improving and capital intensity is declining positioning us to deliver more consistent earnings growth over time. Importantly, we believe we are uniquely positioned to to capture demand in segments where we have a structural advantage. Let me build on that by focusing on what is driving the durability of our room growth. Our growth is driven by a conversion led development model where we have a clear advantage in speed and capital efficiency, a brand portfolio aligned with both guest demand and owner returns, and improving unit level economics that continue to drive developer demand across our core segments. Globally, we grew rooms by 1.7% year over year with growth improving sequentially. In the US developer demand remains strong with franchise agreements awarded up 65% year over year. In the first quarter, we have made meaningful progress in reducing the time from signing to opening enabling faster revenue generation. In the first quarter, US conversion room openings increased 59% year over year and approximately 60% of franchise agreements executed in the quarter are expected to open this year, providing strong near term visibility into growth. Importantly, a meaningful portion of our openings come from conversions that never appear in our quarter end pipeline. Underscoring the speed of our model, we also focus on segments where we are structurally advantaged. Extended stay remains a key growth driver with 11 consecutive quarters of double digit rooms growth and now represents more than 40% of our U.S. pipeline. Supported by strong unit level economics, a dedicated extended stay field organization and a leading hotel pipeline, we are well positioned to extend our leadership in this category. In mid scale and economy transient we are seeing strong developer interest with US franchise agreements awarded up 38% year over year and pipelines continuing to build driven by improving unit level economics and owner returns. As part of our focus on enhancing franchisee returns, we have reduced the cost to build and convert hotels, including lowering prototype costs by up to 25% across key mid scale brands and simplifying property improvement requirements. A clear example is Country Inn and Suites by Radisson where the redesigned lower cost prototype is driving renewed momentum with franchise agreement growth of 50% year over year for the brand. In economy transient, our portfolio strategy continues to improve system quality and guest satisfaction supporting continued developer engagement. With the pipeline increasing 26% sequentially, International continues to scale as an important growth engine with net rooms up 13% year over year in the first quarter. In Canada, we are seeing strong early returns following last year’s transition to a direct franchising model with net rooms growth of over 30%, the strongest performance in more than a decade and a pipeline up 55% year over year alongside improving revenue and guest satisfaction. As we continue to enhance the choice value proposition internationally, we see a meaningful opportunity to drive both system growth and stronger franchise economics over time. Our hotel development pipeline remains a powerful engine for future earnings growth. Importantly, 97% of rooms in our global pipeline are in higher revenue brands which we expect to be approximately 1.7 times more accretive than our current portfolio. Taken together, these trends reinforce our confidence in our ability to deliver durable global net rooms growth supported by a structurally advantaged portfolio, a high quality and more accretive pipeline and a development model that enables consistent capital efficient expansion. Turning to unit economics, our growth is supported by structurally improving franchisee economics driven by enhancements to our revenue generation, engineering and lower franchisee operating costs. Importantly, the mix of customers we are attracting is becoming more valuable over time. The segments where we are growing business travelers and groups generate higher spend per stay while loyalty is driving more repeat stays together, translating into stronger franchisee economics. Loyalty is a key driver of our higher quality demand and customer lifetime value. Our Choice Privileges program now exceeds 75 million members up 7% year over year. Earlier this year we launched the next evolution of the program building on the strong momentum we delivered last year through continued enhancements designed to further strengthen engagement and drive repeat stays. We are already seeing this translate into our results with loyalty contribution increasing over 300 basis points in March year over year as new members generated higher revenue per member than prior year cohorts. In business and group travel, we continue to see strong performance with small and mid sized business revenue up 14% and group revenue up 9% year over year supported by recurring event driven demand such as youth sports. This performance reflects our ability to effectively capture and convert these higher value demand segments across our platform. Technology is an increasingly important differentiator for choice. We have a long standing advantage having been an early mover in migrating both our infrastructure and data to the cloud which underpins how we deploy AI across our business. That foundation enables us to move faster, deploy capabilities at scale and translate innovation into real business outcomes for our franchisees. We are already seeing this in action. For example, our recently launched AI enabled EasyBid platform is improving response time to group RFPs by approximately 30% which is translating into conversion rates that are roughly 250 basis points higher and driving incremental group business for our franchisees. Through our long standing partnership with aws. We are the first major hospitality provider in the US to standardize on a common AI foundation, allowing us to move beyond pilots and rapidly deploy capabilities across our business, embedding them across guest experience, franchise operations and distribution. We are also extending these capabilities through our partnership with Salesforce where we are deploying intelligent agents across our field organization to improve franchisee operations, strengthen how our hotels capture group demand and enable faster, more data driven decisions, giving us the flexibility to rapidly deploy and scale new capabilities across our platform. Together these capabilities are improving franchisee returns and driving continued expansion in our average royalty rates. Looking ahead, Choice is well positioned for continued growth with a clear path to more consistent higher quality cash returns. US Maroon’s growth is inflecting, unit economics are strengthening and capital intensity is declining. With a structurally advantaged higher quality portfolio of hotels, a more accretive pipeline, a capital light model and a differentiated cloud based technology platform, Choice is positioned to deliver durable earnings growth and create long term shareholder value. With that, I’ll turn the call over to Scott.

Scott Oaksmith (Chief Financial Officer)

Thanks Pat and good Morning everyone. Let me start with our first quarter results. For the first quarter, revenues excluding reimbursable revenue from franchise and managed properties increased 3% year over year to $217 million driven by global rooms growth and expansion in our average royalty rate. Of particular note, international performance was strong with revenues excluding reimbursable revenue from franchised and managed properties increasing 63% year over year. Adjusted EBITDA was $126 million compared to $130 million a year ago and adjusted earnings per share were $1.07 compared to $1.34 a year ago. The year over year decline in adjusted EBITDA primarily reflects the timing of certain SG&A costs. The decline in adjusted EPS further reflects a temporary adjustment to our effective income tax rate in the first quarter. These items were anticipated and are expected to normalize over the balance of the year consistent with our full year guidance. As a result, we are maintaining our outlook across all key metrics. Let me now turn to the key drivers of our performance. Three themes shaped our first quarter results. First, US Net rooms growth improved supported by strong openings and lower exits. RevPAR trends improved through the quarter and finally, capital intensity declined as investment in Cambria and Everhome has achieved its strategic objectives and is now being significantly reduced. Let’s start with our net rooms growth. In the first quarter we grew global rooms 1.7% year over year, led by a 2.5% growth in our higher revenue segments and highlighted by a 37% increase in room openings. Developer demand remained robust with global franchise agreements awarded up 72% year over year. Importantly, in the US performance improved meaningfully with nearly 6,000 gross rooms opened in the quarter and net exits declined 52% year over year and improved sequentially, reaching the lowest level in recent years. As the quarter progressed, hotel development momentum accelerated with March accounting for approximately 70% of first quarter US franchise agreements executed. Growth was broad based, led by extended stay and strong momentum in mid scale. Conversion activity remains a key driver of our growth, expected to account for over 80% of openings for the full year. US conversion franchise agreements increased 63% year over year while the US conversion pipeline grew 17% year over year and expanded sequentially, reinforcing our visibility into future openings. Relocancing activity increased significantly year over year, reflecting both brand strength and continued franchisee confidence. Taken together, these trends reinforce our expectation that US net rooms growth returns to positive territory in 2026 with sequential improvement already evident in the quarter. International growth also remains robust. Turning to RevPAR, our global RevPAR declined 80 basis points year over year on a currency neutral basis in the first quarter, primarily reflecting the lapping of hurricane related impacts in the prior year. International RevPAR increased 2.6% year over year on a currency neutral basis led by strong performance in Canada and the Caribbean and Latin American region. In the U.S. excluding a 410 basis point impact from prior year hurricane related demand, first quarter RevPAR increased 1.8% year over year supported by sequential monthly occupancy gains, an important leading indicator for future RevPAR performance. On a comparable basis, REVPAR turned positive in February and remained positive in March. Preliminary April trends remain positive supporting our expectations for continued improvement. Performance continues to trend favorably relative to our expectations supported by constructive underlying demand. Moving to royalty Rate a key driver of our earnings growth in the first quarter, we increased our U.S. average royalty …

Full story available on Benzinga.com

This post was originally published here

On Thursday, Vista Energy (NYSE:VIST) discussed first-quarter financial results during its earnings call. The full transcript is provided below.

Benzinga APIs provide real-time access to earnings call transcripts and financial data. Visit https://www.benzinga.com/apis/ to learn more.

View the webcast at https://edge.media-server.com/mmc/p/o9nw2rw6/

Summary

Vista Energy reported a 67% year-over-year increase in total production, with oil production reaching 117,000 barrels per day.

Total revenues for the first quarter of 2026 were $694 million, a 58% increase from the prior year, driven by higher oil production despite lower oil prices.

Free cash flow was impacted by non-recurring items, but excluding these, free cash flow would have been nearly neutral.

The company tied in 23 new wells, with significant productivity contributing to increased production forecasts.

Vista Energy updated its annual guidance, increasing production expectations and projecting adjusted EBITDA to benefit from higher oil prices.

Management emphasized the company’s strategy to use additional cash flows from higher oil prices for deleveraging and maintaining a robust cash position.

The company expects to continue benefiting from favorable oil price dynamics, with updated financial metrics reflecting potential scenarios at varying Brent prices.

Full Transcript

OPERATOR

Thank you for standing by. Welcome to Vista’s first quarter 2026 earnings webcast conference call. At this time, all participants are in a listen only mode. After the speaker’s presentation, we’ll open up for questions. To ask a question during the session you need to press star 11 on your telephone. You will then hear an automated message advising your hand is raised to withdraw your question, please press Star one one again. Please be advised that today’s call is being recorded and I’d like to hand it over to our first speaker, Alejandro Chernikov, Vista Strategic Planning and Investor Relations Officer. Please go ahead.

Alejandro Chernikov (Strategic Planning and Investor Relations Officer)

Thanks. Good morning everyone. We are happy to welcome you to Vista’s first quarter 2026 results conference call. I am here with Miguel Gallucho, Vista’s chairman and CEO Pablo Verapinto, Vista CFO Juan Garobi, Vista’s CTO and Matthias Weisel, Vista COO. Before we begin, I would like to draw your attention to our cautionary statement on slide 2. Please be advised that our remarks today, including the answers to your questions, may include forward looking statements. These forward looking statements are subject to risks and uncertainties that could cause actual results to be materially different from the expectations contemplated by these remarks. Our financial figures are stated in US Dollars and in accordance with International Financial Reporting Standards ifrs. However, during this conference call we may discuss certain non IFRS financial measures such as adjusted EBITDA and Adjusted Net Income. Reconciliations of these measures to the closest IFRS measure can be found in the earnings release that we issued yesterday. Please check our website for further information. Our company is Asociación Anónima Bursátil de Capital Variable, organized under the laws of Mexico, registered in the Bolsa Mexicana de Valores and the New York Stock Exchange. Our tickers are VISTA in the Bolsa Mexicana de Valores and VIST in the New York Stock Exchange. I will now turn the call over to Miguel. Thanks Ale Good morning and welcome to this earning call. During the first quarter of 2026 we made solid progress in our annual work program on the back of a robust new well productivity. Total production was 135,000 boes per day, up 67% year over year. Oil production was 117,000 barrels per day, an increase of 68% vis a vis the previous year. Total revenues during the quarter were $694 million, 58% above the same quarter of last year. Lifting cost was $4.30 per boe, 8% below year over year. Capital expenditure was $391 million driven by a strong progress in new well activity during any quarter. Adjusted EBITDA was $451 million, an interannual increase of 64%. Net income was $108 million, leading to earnings per share of $1 during the quarter. Free cash flow was minus $341 million, impacted by $331 million of non recurring items of which $206 million corresponded to the initiation of BESA operations on a delivery basis. Without these non recurring items, free cash flow in the quarter would have been almost neutral. Finally, our net leveraging ratio at quarter end was 1.7 times adjusted EBITDA. During Q1 2026 we tie in 23 wells, 12 in Baja del Palo Este, four in Baja del Palo Este and seven net wells in La Marga Chica. This represents very good progress compared to our guidance of 80 to 90 wells for the full year. Solid well productivity of the tying wells drove a material production increase from 127.4 thousand boes per day in January to 143.2 thousand boes per day in March. Total production during Q1 averaged 134.7 thousand boes per day. This represents an interannual increase of 67% reflecting organic growth and our largest scale after the acquisition of La Marga Chica. Oil production was 116.7 thousand barrels per day, 68% higher year over year. Gas production increased 62% on an interannual basis in Q1 2026. Total revenues were $694 million, 58% above the previous year driven by a solid increase in oil production which more than offset lower oil prices. Oil exports more than doubled year over year reaching 7.2 million barrels in the quarter representing 67% of our total sales volume. Realized oil price in Q1 was $60.10 per barrel on average, down 12% on interannual basis and up 2% on a sequential basis in both cases driven by Brent, we sold 100% of oil volumes at equipment parity prices both domestically and internationally. Higher oil prices owing to work in Middle east has a minor impact in Q1 revenues as we have mostly locked in March prices when the conflict started in February 28th. We expect higher oil prices to significantly boost adjusted EBITDA and free cash flow during Q2 2026 and onwards. In Q4 lifting cost was $4.30 per boe, 8% below the same quarter of last year reflecting our low cost asset base fixed cost dilution. As we continue to gain scale selling expenses were $3.80 per boe, down 41% on interannual basis, mainly driven by the elimination of oil tracking as of then of Q1 2025. Adjusted EBITDA during the quarter was $451 million, 64% higher interannually, mainly driven by the consolidation of 50% working interest in La Marga Chica and organic production growth in our core development hub which more than offset lower oil prices. On a sequential basis. Adjusted EBITDA increased 2% driven by higher realized oil prices. Adjusted EBITDA margin was 65% up 3 percentage points compared to the same quarter of last year driven by lower export duties, selling expenses and lifting costs which offset lower oil prices. In Q1 2026. Cash flow from operating activities was $86 million mostly impacted by two one off negative items. First, a working capital impact of $206 million as a consequence of of ramping up our trading operation which move a large part of our export from FOB to deliver basis and at a higher Brent price. Second, an outflow of $46 million corresponding to a tax payment in Mexico which has been booked in previous quarters. Cash flow used in investing activities was $427 million reflecting accrued CapEx of $391 million, a decrease in CapEx related working capital of $53 million and the $80 million deposit related to the Equinor acquisition. As a result, free cash flow was minus $341 million during the quarter net of the working capital one off impacts and the equinor deposit. Recurring free cash flow was minus $10 million during the quarter. These impacts were expected and do not change our positive free cash flow forecast for the year including payment to Equinor. Additionally, as we will show in the following slide, free cash flow is forecast to be materially higher than our original expectations. Cash flow from financing activities were $118 million driven by proceeds from borrowings for $590 million, partially offset by the repayment of borrowings for 130 million and the interest payments of $27 million. Finally, our cash position remains very strong standing at $615 million. At the end of the quarter our net leveraging ratio stood at 1.7 times adjusted EBITDA. Today we are updating our annual guidance to reflect the impact of robust production performance as well as a more contracted view of oil prices based on the solid progress of our new well campaign with 23 tying to date and robust productivity, we are increasing our full year production guidance from 140,000 to 143,000 boes per day, more than a million barrels of oil equivalent for the year. Importantly, our CAPEX guidance remains unchanged. We forecast to spend between 1.5 and $1.6 billion of capex in 2026. Considering the current oil price volatility, we are showing different scenarios for Q2 through Q4 75, 85 and $95 Brent. Based on this new production and oil price assumptions, we are forecasting a material increase in our financial Metrics. In the $85 per barrel scenario, our adjusted EBITDA guidance increased to $2.6 billion, an improvement of $700 billion from our previous guidance. Assuming $95 Brent for Q2 through Q4, adjusted EBITDA will be $2.9 billion and at $75 Brent it will be $2.3 billion. Our 2026 free cash flow guidance increase to $700 million. Assuming our best case of $85 Brent in Q2 through Q4, this is half a billion dollars more than in the original guidance. Assuming $75 for the same period, free cash flow for the year will be $400 million, whereas at $95 it will be $1 billion of free cash flow for the year. This updated guidance does not reflect the closing of Equinox Argentina acquisition. Last week we completed all the conditions precedent to close the transaction. We expect closing to occur in early May and guidance will be updated probably after on a preliminary basis. After consolidating the acquired Asset, we forecast 2026 adjusted EBITDA guidance to increase to $3 billion assuming $85 Brent for Q2 to Q4. To conclude this call and before we move to Q and A, I will make some closing remarks. Solid execution of our annual work program delivered material production growth during the quarter …

Full story available on Benzinga.com

This post was originally published here

O’Reilly Automotive (NASDAQ:ORLY) released first-quarter financial results and hosted an earnings call on Thursday. Read the complete transcript below.

This transcript is brought to you by Benzinga APIs. For real-time access to our entire catalog, please visit https://www.benzinga.com/apis/ for a consultation.

View the webcast at https://www.webcaster5.com/Webcast/Page/2939/53764

Summary

O’Reilly Automotive reported strong financial performance in the first quarter, with sales increasing by $424 million and an 8.1% increase in comparable store sales.

The company maintained its full-year comparable store sales guidance of 3-5% and increased its full-year diluted EPS guidance to a range of $3.15 to $3.25.

O’Reilly Automotive opened 59 net new stores across the U.S., Mexico, and Canada in the first quarter, and plans to open 225 to 235 net new stores in 2026.

The company’s gross margin increased by 19 basis points to 51.5% for the first quarter, driven by cost reductions and strong sales volumes.

O’Reilly Automotive’s private label penetration has climbed to over 50% of total revenue, contributing to improved sourcing capabilities and margins.

Full Transcript

Brad

Expected providing a strong start to the quarter. Moving into February, weekly volumes began increasing as tax refunds started to flow to consumers. Our business often receives some level of benefit from tax refund season, but is not always a direct correlation to average refund size or total refund dollars. As weather and general economic conditions can play a role in the extent to which consumers spend these refund dollars and where they are spent this year, we do believe the combination of an increase in average refund size as well as higher total refund dollars coincided with favorable weather to produce a benefit for our business. Warm and generally dry conditions in most of our markets provided a supportive backdrop for consumers looking to perform vehicle maintenance and in conjunction with the benefit from tax refunds. While we surpassed expectations each month, our business strengthened as we moved through the quarter relative to both our plan and on a 1, 2, and 3-year stack comp basis. April has had the expected degree of seasonal moderation in volumes relative to March, but our business continues to be strong in both DIY and professional. From a category perspective, our results were driven by broad based strength across the business with solid results in many of our undercar hard part categories coupled with continued healthy performance in our maintenance categories including oil filters and fluids. Even in light of widespread strong comp contributions across a broad range of categories, we still see some evidence of consumer caution. Discretionary categories were not as pressured from a relative comp perspective as we’ve seen in the past few quarters, but this was mainly due to the soft comparisons as we are lapping periods of pressure in this small subset of our business. I will discuss in more detail in a moment, but our outlook assumes a continuation of this uncertain stance by consumers. Growth in average ticket was a mid single digit contributor to comps on both sides of our business, while average ticket growth represented the larger driver of our comp for the first quarter. These results were essentially in line with our expectations. As I referenced earlier, it was really the growth in transactions that exceeded our expectations coming into the quarter. We assumed average ticket would benefit from same-SKU inflation of approximately 6% and actual results came in right in line with those expectations. As a reminder, the front half of 2026 is expected to receive a larger benefit from same-SKU inflation as we do not compare against the more significant cost and associated price increases in 2025 until the third quarter. Turning to guidance, we maintained our full year comparable store sales guidance range of 3 to 5%. We are very pleased with the strong start to 2026 that our team has been able to deliver. The first quarter results exceeded our plan and right now have pushed us to the top half of our full year range. However, we remain cautious in our outlook for the consumer. Rapid increases in fuel costs have the potential to impact consumer spending even in predominantly non discretionary sectors like our industry. While the more fundamental long term demand drivers of miles driven and the average age and size of the vehicle fleet are expected to remain supportive and change very gradually over time, spikes in prices at the pump and the impact it can have on other day to day spending in the life of a consumer can cause short term reactions. So far, our first quarter results and trends thus far in April have not indicated a pullback in consumer demand. However, we remain cognizant that sustained inflation pressure on the consumer or potential for future shocks could create volatility in demand. Likewise, we are always cautious to not overreact to first quarter results which can be susceptible to demand variability driven by weather and tax refund dynamics. Given these considerations, we have kept our sales and operating margin outlook for the remaining three quarters of the year unchanged from our previous guidance. It goes without saying that our team is highly motivated to sustain our first quarter momentum as we move through 2026. Ultimately, we will lean on our business model of service and availability to grow our business with both our existing and new customers the same. We have confidence in the health of our industry and even more in our ability to take market share in any market backdrop. Our store and sales teams operate with a high degree of discipline within their markets. We expect to win business by delivering value through deep win win relationships, excellent customer service, superior product availability as our teams focus on partnering with our professional customers who recognize this value and place us in a position of preferred supplier. As a result of the consistent execution of our team. This same high standard of customer service also drives our DIY business since these customers are just as dependent on the trusted advice of our professional parts people to help them solve problems, go the extra mile and in turn keep their vehicles on the road and well maintained. Before I wrap up, I would like to note that we are increasing our full year diluted earnings per share guidance to a range of $3.15 to $3.25. Our increase in EPS guidance is driven by our first quarter sales and operating performance and the impact of shares repurchased through the date of our earnings release yesterday. We are pleased to be delivering an increase to our full year guide after kicking off the year and look forward to the opportunity to execute on our fundamentals and generate strong results throughout the remainder of the year. As I wrap up my prepared comments, I’d like to take the opportunity once again to thank Team O’Reilly for your hard work and commitment to growing our business. Now I’ll turn the call over to Brent.

Brent

Thanks, Brad. I would also like to begin my comments this morning by congratulating Team O’Reilly on a strong start to 2026. As your hard work continues to earn business and take share today, I will further discuss our first quarter gross margin and SG&A results and provide an update on the progress toward our expansion and capital investment plans for 2026. Starting with gross margin our first quarter gross margin of 51.5% was a 19 basis point increase from the first quarter of 2025, which was in line with our expectations. Within the first quarter, our gross margin did encounter some pressure from seasonal product mix, but we are pleased to be able to offset this pressure with acquisition cost reductions and improved leverage of our distribution cost driven by solid DC productivity and strong sales volumes. The acquisition cost environment remains stable and the pricing environment continues to be rational across our industry. Our first quarter gross margins were not materially impacted by the changes within the tariff environment as our net tariff exposure has remained relatively stable. Additionally, at this point, neither our first quarter results nor our outlook include any benefit from tariff refunds. We actively monitor these topics as they develop and are being proactive to ensure our sourcing is competitive and reflects the scale of our company. The conflict in Ukraine and resulting constraints on global oil supply have the potential to be disruptive to certain categories, particularly motor oil, and could impact supply chain costs such as freight. However, we did not see a material impact in the first quarter and have not adjusted our full year outlook assumptions for these factors. We have strong relationships with our supplier community and have been working through challenging situations surrounding international trade and geopolitics for an extended period of time. Now, while every situation can be unique, our expectation is that our merchandise teams will continue to successfully navigate these environments and that we will be able to leverage our long term relationships with supplier partners as well as our scale to ensure that we lead the industry in availability. We are maintaining our full year gross margin guidance range of 51.5 to 52%. At this stage, we believe we have the ability to manage the current dynamics surrounding product acquisition, cost and freight within our full year guidance range. Our supply chain teams work to not only act actively mitigate cost increases, but also to diversify our supplier base and seek alternative sourcing options when necessary. A significant benefit to us on this front has been the continued development of our private label brand portfolio. Our private label penetration has climbed to over 50% of total revenue and we will continue to work to prudently leverage the strength of our proprietary brands. The benefits of our private label strategy range from improving margins and customer brand loyalty to improved sourcing capabilities as we have control over the product within the box and can seamlessly source a single SKU from multiple suppliers when supply chain constraints emerge. Having the ability to adjust orders and demand across a broader base of suppliers is an important tool for our teams to leverage and in order to maintain a strong in stock position. Moving to SG&A Our teams generated an impressive 34 basis points of SG&A leverage as they diligently managed our cost structure and delivered robust sales results. Our total SG and A dollar spend was at the higher end of our expectations for the first quarter due to incremental spend to support elevated sales volumes. This produced SG&A average SG&A per store growth of 5.5% for the first quarter and we are still expecting our full year SG&A per store growth to run approximately 3 to 4%. Our first quarter SG and A was expected to drive the highest average per store growth rate of the year and we expect our per store growth to moderate as we move through the year and compare against the SG&A ramp that occurred throughout 2025. Within our SG&A, gas price increases had a muted impact on balance for the quarter. We do operate a large delivery fleet across our stores and quick, timely delivery of product to our professional customers is an incredibly important part of our value proposition. As a result, there is certainly the potential for some level of impact to our SG&A, but this is heavily dependent on the extent and the duration of fuel price increases. When managing our cost structure and in particular when gauging a response to cost pressures over a short time frame. We always view our business through a long term lens with a focus on serving our customers and supporting high levels of service and availability. In keeping our SG and A and margin guidance unchanged for the remainder of the year, we have considered the potential for modest pressure from rising fuel prices and the opportunities we have to manage those pressures within the broader context of our overall cost structure, we are raising our full year operating profit guidance range by 10 basis points to an updated range of 19.3 to 19.8%. This reflects the flow through of operating cost leverage from our strong first quarter results and our unchanged outlook for the remainder of the year. At the midpoint, this updated guidance range projects full year operating margin expansion of nine basis points over 2025, which is a testament to Team O’Reilly’s dedication to profitable growth. Inventory per store finished the first quarter at $874,000 which was up 8.5% from this time last year and up 0.5% from the end of the year. We are still targeting growth of 5% per store by the end of 2026. Our inventory position at the end of the first quarter was slightly below our plan resulting from the strong sales performance and the timing cadence of inventory additions. Our turns remain strong at 1.6 times and we are pleased with the productivity we have seen from our inventory investments and our efforts to continually enhance inventory deployment within our tiered distribution network. We absolutely believe that our industry leading inventory availability is a factor contributing to the share gains that we are compounding and we will continue to aggressively capitalize on opportunities to bring our inventory closer to the customer. Lastly, to touch on our store growth and capital investments in the first quarter, we opened a total of 59 net new stores across the U.S. mexico and Canada. Domestic new store performance continues to meet our high expectations and we are pleased with the opportunities we have across the US Both to backfill existing markets and expand into new greenfield markets. Our international markets continue to make progress in building the O’Reilly store growth engine and we remain on track for our 2026 store opening goal of 225 to 235 net new stores. Capital expenditures for the first quarter were $244 million and we still expect a total capital expenditure investment in 2026 of 1.3 billion to $1.4 billion. The major projects driving this expected level of spend are on schedule and we are excited for the growth opportunities and in store for us in all of the markets that we operate in. Before I turn the call over to Jeremy, I want to once again thank our entire team of Team O’Reilly for their continued hard work and unwavering commitment to our customers. Now I’ll turn the call over to Jeremy.

Jeremy

Thanks Brent. I would also like to thank all of Team O’Reilly for their continued hard work and dedication to our customers. Now we will fill in some additional details on our first quarter results and updated guidance for 2026. For the first quarter, sales increased $424 million, driven by an 8.1% increase in comparable store sales and a $91 million non-comp contribution from stores opened in 2025 and 2026 that have not yet entered the comp base for 2026. We continue to expect our total revenues to be between 18.7 and $19 billion. Our first quarter effective tax rate was in line with expectations at 22.5% of pre tax income comprised of a base rate of 23% reduced by a 0.5% benefit for share based compensation. This compares to the first quarter of 2025 rate of 21.3% of pre tax income which was comprised of a base tax rate of 23.2% reduced by a 1.9% benefit for share based compensation. For the full year of 2026 we continue to expect an effective tax rate of 22.6% comprised of a base rate of 23.0% reduced by a benefit of 0.4% for share based compensation. We expect that the quarterly rate will fluctuate due to variations in the tax benefit for share based compensation and the tolling of certain tax periods in the fourth quarter. Now we will move on to free cash flow and the components that drove our results. Free cash flow for the first quarter of 2026 was $785 million versus $455 million in 2025. The increase in free cash flow was primarily driven by …

Full story available on Benzinga.com

This post was originally published here

Garrett Motion (NASDAQ:GTX) held its first-quarter earnings conference call on Thursday. Below is the complete transcript from the call.

This transcript is brought to you by Benzinga APIs. For real-time access to our entire catalog, please visit https://www.benzinga.com/apis/ for a consultation.

View the webcast at https://event.choruscall.com/mediaframe/webcast.html?webcastid=fTv98mHJ

Summary

Garrett Motion reported strong financial results for Q1 2026 with net sales of $985 million, up 6% at constant currency, and adjusted EBIT of $151 million, representing a 15.3% margin.

The company increased its 2026 full-year financial outlook, driven by strong performance across all verticals, including commercial vehicle, industrial, and aftermarket sectors.

Strategic initiatives included multiple awards for their turbo technology, progress in zero emission technologies with a significant E Powertrain Production award in China, and advancements in industrial cooling systems.

Garrett Motion maintained its capital allocation strategy, repurchasing $87 million in common stock and paying $16 million in dividends during the quarter.

Management highlighted continued productivity measures, disciplined execution, and a robust liquidity position with no near-term debt maturities.

Full Transcript

Cindy (Operator)

Hello, my name is Cindy and I will be your operator this morning. I would like to welcome everyone to the Garrett Motion First Quarter 2026 Financial Results Conference Call. This call is being recorded and a replay will be available later today. After the company’s presentation, there will be a Q and A session. I would now like to hand over the call to Cyril Granjon, Garrett’s Vice President, Investor Relations and Treasurer.

Cyril Granjon (Vice President, Investor Relations and Treasurer)

Thank you Cindy and good day everyone. We appreciate you joining us to review Garrett Motion’s first quarter 2026 financial results. Our presentation and press release are available on the Investor Relations section of our website. Today’s discussion includes forward looking statements that involve risks and uncertainties. Please refer to our SEC filings, including our most recent annual report on Form 10-K, for a discussion of factors that could cause our results to differ materially from these forward looking statements. Today’s presentation also includes certain non-GAAP metrics which we use to help describe how we manage and operate our business. Please review the disclaimers on slide 2 of our presentation as the content of our call will be governed by this language. With me today are Olivier Rabier, our President and Chief Executive Officer, and John Deason, our Senior Vice President and Chief Financial Officer. Olivier will begin by sharing highlights from a very strong quarter both in terms of financial performance and strategic wins. Sean will then review our first quarter financial results and updated 2026 outlook. With that, I’ll turn the call over to Olivier. Thank you Cyril and thank you all for joining the call today. We started the year by delivering another very strong set of financial results in the first quarter, driven by growth in a muted industry and disciplined operational execution. Net sales for the first quarter were $985 million, up 6% at constant currency. We delivered growth across all verticals including commercial vehicles and industrial. Considering that light vehicle production was down in Q1, Garrett’s growth reflects share of demand gains in passenger vehicles and as well as continued strong performance in commercial, off highway and industrial. Through continued productivity actions and disciplined execution, we have been enabled to convert this growth into a very solid operating performance. Adjusted EBIT was $151 million and our adjusted EBIT margin was 15.3%. In addition, we generated an adjusted free cash flow of $49 million in the quarter. Together, these strong results support our decision to increase the upper range of our 2026 full year outlook. Lastly, we continue to allocate capital in line with our stated framework and our commitment to return capital to shareholders. During the first quarter, we maintained our share repurchase activity, buying back $87 million of common stock and we also paid $16 million in quarterly dividends. With that, let me now Turn to Slide 4 to share more on Garrett’s continued success across our differentiated technology. Indeed, we continue to win across our turbo portfolio with multiple gasoline awards including VNT Turbo for hybrids and range electric vehicle applications. At the same time, we kept on the successful trend we have seen in industrial as we secured additional wins including for large power generation applications. Turning now to our zero emission technologies, we have made solid progress in Q1 2026 as we secured our second commercial vehicle E Powertrain Production award in China with startup production planned again for 2027. We also won a major production award for our industrial cooling compressor with Tonfai in China, a leading supplier for battery energy storage system cooling solutions. Overall, I’m very pleased with our progress. These wins demonstrate customer adoption of our differentiated technologies across a broad range of applications, supporting both portfolio expansion and growth while continuing to deliver strong financial results. I will now hand it over to Sean who will talk you through our financial results and outlook.

Olivier Rabier (President and Chief Executive Officer)

Thanks Olivier and good morning everyone. I will begin my remarks on slide 5 as Olivier highlighted We delivered strong financial performance in the first quarter. Our net sales were $985 million driven by sequential growth across all verticals. This was driven by share of demand gains in diesel and gasoline applications, recovery of commercial vehicle volumes and continued demand for industrial applications. We delivered $151 million of adjusted EBIT in the quarter, equating to a 15.3% margin. This represents both a year over year and a sequential improvement driven by strong volume conversion and favorable foreign exchange. Finally, adjusted free cash flow was $49 million as the business continues to convert earnings into cash in line with expectations. Now Moving to Slide 6, we show our Q1 net sales bridge by product category as compared with the same period last year. In the quarter net sales increased by $107 million versus the prior year or 12% on a reported basis and 6% on a constant currency basis. Double digit growth in commercial vehicle, industrial and aftermarket contributed significantly to the strong performance. We also benefited from continued gasoline share of demand gains and new launches in diesel. The sales growth occurred across all key regions. In North America, the key drivers of sales growth were off highway, industrial and aftermarket. In Europe we saw share of demand gains in light vehicle, gasoline and diesel as well as a recovery in off highway applications. And in China, growth was driven primarily by industrial and on highway applications. Turning to Slide 7 during the quarter we generated $151 million of in adjusted EBIT representing a $20 million increase over the same period last year. Our margin rate of 15.3% reflects a 40 basis point improvement year over year, 20 basis points of which are due to favorable foreign exchange currency impacts partially offset by tariff pass throughs. The increase in adjusted EBIT was primarily driven by volume and favorable mix from our strong growth in commercial, vehicle, industrial and aftermarket in the quarter. Year over year operating performance was slightly negative, largely as a result of timing and in line with our expectations. As we begin to execute on our productivity measures, we expect to generate positive operating performance through the balance of this year, continuing to benefit from sustained fixed cost actions and variable cost productivity. Turning now to slide 8, I’ll walk you through the adjusted EBIT to adjusted free cash flow bridge. For the quarter we delivered positive adjusted free cash …

Full story available on Benzinga.com

This post was originally published here

Old Dominion Freight Line Inc. (NASDAQ:ODFL) on Wednesday reported upbeat first-quarter 2026 results.

Revenue declined 2.9% year over year to $1.335 billion, topping analyst expectations of $1.312 billion. The decrease was driven by a 7.7% drop in less-than-truckload (LTL) tons per day, reflecting a 7.9% decline in shipments per day during the quarter.

Net income decreased 6.4% to $238.3 million. Earnings came in at $1.14 per share, down 4.2% year over year but above the consensus estimate of $1.06.

Marty Freeman, President and Chief Executive Officer of Old Dominion, said, “Old Dominion’s first quarter financial results reflect a continuation of encouraging trends that started developing late last year. While our first quarter revenue decreased on a year-over-year basis, demand for our LTL service improved as the quarter progressed. The improvement in demand, coupled with our ability to consistently deliver superior service to our customers, …

Full story available on Benzinga.com

This post was originally published here

Regency Centers (NASDAQ:REG) reported first-quarter financial results on Thursday. The transcript from the company’s first-quarter earnings call has been provided below.

This transcript is brought to you by Benzinga APIs. For real-time access to our entire catalog, please visit https://www.benzinga.com/apis/ for a consultation.

View the webcast at https://edge.media-server.com/mmc/p/5ksnzj6y/

Summary

Regency Centers reported strong financial performance with a 4.4% growth in same property NOI and robust operating fundamentals, driven by high-quality trade areas and essential retail anchoring.

The company highlighted its strategic focus on ground-up development as a key differentiator, with $42 million in completed projects and over $600 million in the in-process pipeline, yielding returns above 9%.

Regency Centers maintains a strong balance sheet with low leverage and high liquidity, having issued $450 million of notes at a favorable rate, supporting its strategic growth initiatives without needing to raise equity.

Management remains optimistic about future growth with expectations for continued NOI growth and a robust investment pipeline, projecting over $1 billion in development starts over the next three years.

The company expects to maintain its full-year guidance for same property NOI growth and core operating earnings, driven by strong leasing activity and favorable market conditions.

Full Transcript

OPERATOR

Greetings and welcome to the Regency Centers Corporation First Quarter 2026 Earnings Call. this time all participants are in a listen only mode. A question and answer session will follow the formal presentation. If anyone should require operator assistance during the conference, please press Star0 on your telephone keypad. Please note this conference is being recorded. I will now turn the conference over to your host, Christy McElroy. Please go ahead.

Christy McElroy (Moderator)

Good morning and welcome to Regency Centers first quarter 2026 earnings conference call. Joining me today are Lisa Palmer, President and Chief Executive Officer Mike Moss, Chief Financial Officer Alan Roth, East Region President and Chief Operating Officer and Nick Wibbenmeier, West Region President and Chief Investment Officer. As a reminder, today’s discussion may contain forward looking statements about the company’s views of future business and financial performance including forward earnings guidance and future market conditions. These are based on the current beliefs and expectations of management and are subject to various risks and uncertainties. It is possible that actual results may differ materially from those suggested by these forward looking statements. We may make Factors that could cause actual results to differ materially from these statements may be included in our presentation today and are described in more detail in our filings with the SEC. Specifically in our most recent Form 10K and 10Q filings. In our discussion today we will also reference certain non GAAP financial measures. The comparable GAAP financial measures are included in this quarter’s earnings materials which include which are posted on our investor relations website. Please note that we have also posted a presentation on our website with additional information including disclosures related to forward earnings guidance. Our caution on forward looking statements also applies to these presentation materials. As a reminder, given the number of participants we have on the call today, we respectfully ask that you limit your questions to 1. Please rejoin the queue if you have additional follow up questions.

Lisa Palmer (President and Chief Executive Officer)

Lisa thank you Christy Good morning everyone and thank you for joining us. We are off to an outstanding start to the year. Building on the positive momentum from last year. In the first quarter we delivered strong same property NOI and earnings growth driven by robust operating fundamentals and effective capital allocation. Our results demonstrate the durability of our portfolio, the strength of our platform and the execution of our team. Our tenants are performing well in our centers supported by the resiliency and spending power of consumers in our strong suburban trade areas as well as our focus on essential retail anchored by top performing grocers. It is this combination of high quality trade areas and our concentration of necessity based value oriented and convenience retail that positions our portfolio to perform consistently even in uncertain macroeconomic environments. We also continue to see significant momentum across our investments platform. Our track record of success in ground up development is one of Regency’s greatest differentiators and is a key driver of our external growth strategy. In an environment with very little new retail supply, our ability to source, execute and deliver high quality developments across the country really sets Regency apart. Our project deliveries will translate into meaningful NOI contribution in 2026 and beyond, boosting total NOI growth and driving earnings and nav accretion as we look ahead. I’m really energized by our strong start to the year and by the opportunities in front of us. I want to reiterate just how distinct Regency’s growth story is. Our portfolio of high quality grocery anchored neighborhood and community centers located in some of the strongest trade areas in the country has consistently delivered durable cash flows across economic cycles. Our leading national development platform is creating meaningful value for shareholders at a time when few others can compete with our expertise, relationships and proven results. Our strong balance sheet gives us flexibility and the capacity to be opportunistic with low cost and substantial access to capital. And most importantly, we have the best team in the business. With this foundation, Regency is exceptionally well positioned to continue delivering strong and sustainable growth for our shareholders.

Alan Roth (East Region President and Chief Operating Officer)

Alan thank you Lisa and good morning everyone. We delivered another excellent quarter to start the year following what was a record breaking year for us in 2020. The fundamentals across our portfolio remain strong and I couldn’t be more proud of our team’s execution. Tenant demand continues to be robust across nearly all categories and regions spanning both anchor and shop space. Grocers, restaurants, health and wellness concepts and off price retailers are among the most active, but the breadth of engagement across our portfolio is really impressive. The availability of high quality space is increasingly scarce both at our centers and in our trade areas and that dynamic is working in our favor. Our same property percent leased, which is approaching 97%, was up 10 basis points over the fourth quarter. A sequential uptick in Q1 is seasonally unusual and it really speaks to the strength of the demand we’re experiencing and to the durability of our occupancy. Leased occupancy is now close to our prior peak, though I am confident further upside is achievable, particularly in anchor leasing where we continue to have meaningful engagement with leading national retailers. What is especially encouraging is the nature of our activity today. We continue having success proactively leasing occupied space, upgrading merchandising, bringing in new and vibrant concepts and replacing outdated or underperforming uses. Our same property commenced rate also increased 20 basis points in the quarter as we made meaningful progress commencing tenants within our S and O pipeline. The pipeline continues to be a significant tailwind to future NOI growth representing approximately $42 million of incremental base rent. We achieved robust cash re leasing spreads in the first quarter and gap spreads were near a record high. These results reflect our ability to achieve compelling mark to market rent increases in addition to embedding meaningful contractual rent steps into our leases. That success is the basis for our ability to drive strong sustainable rent growth within our portfolio over the long term. Same property NOI growth of 4.4% in the first quarter was reflective of these strong operating trends along with the substantial progress we’ve made raising occupancy and completing redevelopment projects. In closing, the trends we are seeing in leasing activity, tenant sales, collections and foot traffic remain very favorable. We are positioned for success and continued growth ahead and I’m excited about what our team will accomplish with that. I’ll hand it over to Nick thank

Nick Wibbenmeier (West Region President and Chief Investment Officer)

you Alan and good morning everyone. We continue to have significant momentum within our investments platform evident in an active first quarter of accretive investment activity. Our team is successfully executing on and delivering projects within our in process pipeline and we continue to source attractive new ground up projects. During the first quarter we completed $42 million of projects including Oakley Shops at Laurel Fields, a Safeway anchored neighborhood center we developed ground up in the Bay Area. Our team did an exceptional job bringing this project to fruition in less than 18 months, one of the quickest ground up deliveries that I can recall. We also started another $73 million of new projects this quarter including Crystal Brook Corner, a redevelopment on Long Island. We acquired this underutilized piece of real estate and are transforming it into a Whole Foods anchored neighborhood center. This project demonstrates our ability to look at acquisition opportunities through a differentiated lens, leveraging Regency’s platform, our relationships and our development expertise to drive near term value creation. Our in process pipeline now exceeds $600 million with exceptional leasing momentum and blended returns above 9%. The team has been executing these projects on time and on budget, which I want to emphasize is a direct result of the substantial risk mitigation we undertake before we break ground within our ground up development platform. We we continue to see remarkable results. An example includes Ellis Village in Northern California which we started in the second half of 2025. The project is already 100% leased with an anticipated anchor opening later this year. Our Sunbed and Stonebridge Ground UP projects in the Northeast. Each celebrated Whole Foods openings during the first quarter, both with strong community reception. As Lisa discussed, ground up development remains a substantial differentiator for Regency and our brand as a developer has never been stronger. We are the only national developer of high quality grocery anchored shopping centers at scale in an environment of otherwise limited new supply. Our teams are actively sourcing new projects and we continue to have visibility to a potential of more than $1 billion of project starts over the next three years. Leading grocers across the country remain engaged in a year to expand with us and shop tenants are excited to be part of our projects. Landowners trust us to deliver given our proven track record and the strength of our grocer relationships, particularly among master plan developers where our retail projects are providing a significant amenity and value to their communities. This positive momentum continues to enhance our success, strategically positioning us to capitalize on additional opportunities. We are creating real value for shareholders at meaningful spreads to market cap rates and we are excited about the opportunities for continued growth in our investments platform.

Mike Moss (Chief Financial Officer)

Mike thank you Nick Good morning everyone. Regency delivered another strong quarter to start the year, a testament to our team’s continued execution on our strategy and the favorable conditions of our markets. Same property NOI growth was 4.4% in the first quarter including 3.5% of base rent growth. Recall last quarter we discussed that Q1 would be above and that Q2 would fall below our full year guidance range with this quarter driven by the uneven nature of other income and next quarter driven by tough comp relative to last year’s favorable expense reconciliation performance. Most importantly, base rent continues to grow at very healthy levels, benefiting from increasing rents, commencing our SNO pipeline and delivering on our accretive redevelopment projects. Looking through the variables in first and second quarters, we are maintaining guidance for full year same property NOI growth of 3.25 to 3.75% as well as for growth in core operating earnings and NAREIT FFO per share each at 4.5%. At the midpoint we continue to expect total NOI growth north of 6% reflecting meaningful contributions from ground up development deliveries and the substantial acquisitions we completed last year. We did make a few minor assumption changes within our outlook. We modestly increased development and redevelopment spend as a result of increased starts expectations as well as our acquisitions guidance to now include known transactions. These changes reflect continued strong investment activity and support positive momentum in external growth and value creation. The strength of …

Full story available on Benzinga.com

This post was originally published here

On Thursday, Brunswick (NYSE:BC) discussed first-quarter financial results during its earnings call. The full transcript is provided below.

Benzinga APIs provide real-time access to earnings call transcripts and financial data. Visit https://www.benzinga.com/apis/ to learn more.

Access the full call at https://event.choruscall.com/mediaframe/webcast.html?webcastid=XoSenHxr

Summary

Brunswick reported a strong start to 2026 with Q1 net sales increasing by 13% year-over-year, driven by market share gains and strong OEM demand.

The company’s adjusted EPS rose by 25% to $0.70, with robust operating leverage offsetting incremental tariff impacts.

Brunswick continued its disciplined capital allocation strategy, repurchasing $20 million in shares and increasing its dividend for the 14th consecutive year.

The company maintained healthy inventory levels, aligning wholesale with retail demand, and saw improvements in dealer sentiment.

Future outlook was cautiously optimistic with guidance reflecting stable market conditions and potential for further share gains, though geopolitical volatility was noted as a concern.

Full Transcript

OPERATOR

Good morning and welcome to Brunswick Corporation’s first quarter 2026 earnings conference call. All participants will be in a listen only mode until the question and answer period. Today’s meeting will be recorded. If you have any objections, you may disconnect at this time. I would now like to introduce Steven Weiland, Senior Vice President and Deputy CFO, Brunswick Corporation.

Steven Weiland (Senior Vice President and Deputy CFO)

Good morning and thank you for joining us. With me on the call this morning are David Foulke, Brunswick’s Chairman and CEO, and Ryan Gwillim, Brunswick’s CFO. Before we begin with our prepared remarks, I would like to remind everyone that during this call our comments will include certain forward looking statements about future results. Please keep in mind that our actual results could differ materially from these expectations. For details on the factors to consider, please refer to our recent SEC filings and today’s press release. All of these documents are available on our website at brunswick.com during our presentation we will be referring to certain non GAAP financial information. Reconciliations of GAAP to non GAAP financial measures are provided in the appendix to this presentation and the reconciliation sections of the unaudited consolidated financial statements accompanying today’s results. I will now turn the call over

David Foulke (Chairman and CEO)

to Dave, thank you, Steve we delivered an excellent start to the year, building on the market recovery in the second half of 2025 with first quarter results significantly ahead of expectations. Despite the dynamic geopolitical and tariff environment, Global and US Boat retail were approximately flat on a unit basis compared to the relatively strong first quarter of last year and premium sales were up. Q1 was the third consecutive quarter of improved relative retail performance, building confidence in our retail forecast for the year as we move into the core selling season in our largest markets. Strong OEM order patterns drove gains for Mercury Marine and Navico Group, while solid boating participation benefited our recurring revenue, parts and accessories, aftermarket and subscription boating businesses. From an inventory perspective, boat and engine pipelines remain healthy, lean and well aligned with demand. Global boat pipelines are down approximately 2000 units versus last year and flat sequentially versus the end of 2025, reflecting our deliberate actions to closely match wholesale with retail. Our overall net sales of $1.4 billion increased 13% year over year, with growth across all segments driven by continued market share gains, strong OEM demand accelerated new product and technology introductions and disciplined operational execution across the enterprise. Our adjusted earnings per share of $0.70 increased 25% versus last year with strong operating leverage from higher sales, more than offsetting the impacts of the tariffs implemented after the first quarter of last year. We continued to execute our disciplined capital allocation strategy, repurchasing $20 million of shares year to date and delivered our 14th consecutive annual dividend increase, underscoring our commitment to returning capital to shareholders while maintaining a strong balance sheet in our core US Market. Product demand and boating participation remain relatively unaffected by the conflict in the Middle east, although the health of the value consumer remains a focus. We have a relatively small direct exposure to Middle east markets but are monitoring trends in Australia, New Zealand and other more exposed markets as oil supply tightens. Our high exposure to the most insulated markets, particularly the US and Canada, which account for more than 70% of total sales, balanced portfolio Lean channel inventories and operational discipline position us strongly to effectively navigate the volatility. Turning to segment performance for the third consecutive quarter, all segments delivered year over year sales growth, operating margin expanded across the portfolio except for Propulsion which absorbed the majority of first quarter incremental tariffs. The strong performance reflected improving retail and wholesale trends, sustained voter participation and disciplined operational execution across the organization. Propulsion sales increased significantly versus last year with Mercury’s global and US outboard unit orders increasing more than 15% over the prior year period and record Mercury outboard share at recent boat shows including 60% overall, an 80% on the water share at Miami and 70% share at Palm beach signaling the potential for further high horsepower share gains. Overall R12 share remains steady of 47% with year to date retail share up 200 basis points along with strong wholesale share gains. Our accelerated investments in future high horsepower outboard platforms and all new mid range high volume models will reinforce our long term competitive advantage. Healthy boating participation and continued distribution gains drove higher sales and margin year over year in our engine P and a business with Land ‘N’ Sea again increasing US distribution share by 150 basis points. Navico Group delivered revenue growth and margin improvement supported by new product launches and operational improvement actions. We introduced the Simrad NSO4 and B&G Zeus SRX multifunction displays at the Miami Boat show, received an Innovation Award for the Lowrance Active Target 2 XL fishfinder and continued to execute Simrad autocaptive implementation plans with a range of OEM customers. Finally, our boat group segment grew sales and margin as wholesale shipments aligned with stable retail. Boat show revenue increased year over year despite weather impacts of some upper Midwest and northern market events. At the Palm Beach Premium Saltwater Show, Boston Whaler and Sea Ray delivered higher unit sales and a substantial 40% revenue increase versus last year. Freedom Boat Club added four new locations in the quarter, increased member trips by 20%, improved same store sales by 10% and earlier this month completed the acquisition of the largest remaining franchise club in the Freedom Network, which serves the Boston and Cape Cod region. Moving on to external conditions Rate cuts enacted late in 2025 are a continuing tailwind for retail and floor plan financing as we enter the peak selling season. While expectations for incremental rate relief have moderated, our forecast does not rely on additional cuts. Fuel prices have risen recently due to geopolitical events but generally remain within historical bounds and we are not experiencing any clearly discernible direct impact on retail or OEM demand or on boating participation in our largest markets. The tariff environment remains dynamic and Ryan will discuss a specific impact to our guidance later on the call. The tariff on Mercury Marine’s Japanese competitors remains in place, representing a potential structural advantage for Brunswick. Refunds related to previously paid IPA tariffs are not yet factored into our outlook. Current dealer sentiment is improved overall but still cautious, supported by healthy and fresh inventories and lower pre owned boat supply which supports new boat demand. While incentives remain elevated versus historical norms, they improved approximately 100 basis points last year and we are forecasting further modest improvement in 2026. Looking now at industry retail performance, the latest SSI data for March shows US industry main powerboat retail down approximately 5% year to date. Against this backdrop, SSI reported that Brunswick outperformed the industry. Our global and US internal retail unit sales were approximately flat year over year compared with the relatively strong first quarter of 2025 prior to the impact of tariffs with premium and core again outperforming value. From a pipeline standpoint, conditions remain very healthy. Global boat pipelines are down approximately 2,000 units versus last year, but flat sequentially versus the fourth quarter and benefiting from wholesale to retail alignment consistent with our plan. In addition, our global boat order backlog at the end of the first quarter represented 71% of our second quarter wholesale forecast up 6 percentage points from last year, providing improved near term visibility. Turning to engines, US outboard engine industry grew 6% in the first quarter with Mercury retail units up approximately 11%. With a similar dynamic to boats, US outboard pipelines were down approximately 10% versus last year, but flat sequentially versus the fourth quarter reflecting wholesale to retail matching. Overall, the combination of sustained share gains, disciplined pipeline management and improving wholesale to retail alignment gives us confidence in our outlook for 2026 and supports our expectation for a flat to improving market as we enter the peak boating season. Finally, I want to address the impacts of recent oil price volatility which has been a frequent topic in recent investor discussions. From the boat buyer or boater perspective, historically there has not been a correlation between oil price spikes and boat sales or boating participation. A primary driver of this low correlation is that fuel costs represent a relatively small portion of total boat ownership expense because on an annual basis the typical recreational boat only uses about 20% to 30% of the fuel of a comparable passenger vehicle. From a boat group perspective, exposure to oil linked materials is relatively small, representing a combined 2% of total cost of goods sold and with the relevant materials being under long term supply agreements, our scale and sophistication also enable hedging programs for other key commodities such as aluminum, further reducing exposure to spot price volatility. However, aluminum prices do remain elevated. Diesel prices have, however, impacted boats and other transportation costs and we have implemented some surcharges. I’ll now turn the call over to Ryan to discuss our first quarter financial performance and updated guidance.

Ryan Gwillim (CFO)

Thank you Dave and good morning everyone. Brunswick’s outstanding first quarter performance came in ahead of expectations with strong sales and earnings growth versus the first quarter of last year. On a consolidated basis, sales were up 13% reflecting improved wholesale and retail trends, continued market share gains in propulsion and several boat categories, strong OEM demand for propulsion components and electronics, favorable changes in foreign currency exchange rates, pricing actions in each segment commencing in the second half of 2025 and solid boating participation driving aftermarket performance. Adjusted operating earnings were up 15% supported by the increased sales, favorable mix, improved absorption and disciplined cost management, more than offsetting the impact of incremental tariffs implemented after the first quarter of last year. Absent the year over year enterprise impact from incremental tariffs. Adjusted operating leverage was approaching 30%, driving adjusted EPS of $0.70 for the quarter. Free cash flow was negative in the first quarter, consistent with seasonal and historical patterns, reflecting higher production levels and working capital investment ahead of the peak selling season compared to the prior year. Free cash flow was down solely due to reinstated variable compensation paid in the quarter. Moving to our segments, Propulsion delivered a very strong start to the year with sales increasing 17% versus the prior year, driven by an improved market, global share gains and strong OEM demand heading into the selling season. Adjusted operating earnings declined year over year solely due to the planned accelerated investments in product development and incremental tariff impact, which slightly more than offset the benefits of higher sales and improved absorption. Absent the incremental tariffs. Pro forma, adjusted operating leverage for propulsion was north of 20% in the quarter even after accounting for the high single digit million dollars of additional product development spend in the quarter moving to engine parts and accessories. This segment once again delivered growth from its aftermarket high margin recurring revenue portfolio with sales up 14% versus the prior year with significant growth across both products and distribution. Healthy early season boating participation even with the recent increase in fuel prices and continued market share gains in our global distribution business drove growth in the quarter. The higher sales and robust adjusted operating leverage at 27% led to a 24% increase in adjusted operating earnings with a 140 basis point improvement in adjusted operating margin. Navico Group had another great quarter transitioning from stability to growth with sales up 7% over prior year and up across all business lines supported by improving OEM demand, steady aftermarket performance and operational efficiency. More importantly, adjusted operating earnings increased 64% with adjusted operating margin expanding 280 basis points reflecting the early benefits of product portfolio optimization, operational improvements and disciplined cost control actions which more than offset incremental tariffs. We often discuss the inherent operating leverage in this high gross margin business, so it’s fantastic to see 47% adjusted operating leverage in the quarter. As our actions bear fruit, we continue to see encouraging traction from recent product launches including Simrad NSO4 and BNG Zeus SRX and recognition for innovation with Lowrance Active Target 2XL. While there is still work ahead, the results this quarter reinforce our confidence that Navico Group is on a sustainable path towards improved profitability. Finally, our boat segment also had a strong quarter with sales up 6% over prior year driven by higher wholesale shipments, matching stabilized retail conditions, favorable mix and continued momentum in the business acceleration portfolio. Boat growth was led by our aluminum, fish and pontoon brands while Freedom Boat Club continued to deliver strong increases in members and trips and locations. As mentioned earlier, adjusted operating earnings increased 63% and adjusted operating margin expanded 130 basis points reflecting healthy adjusted operating leverage of 25% primarily driven by the higher sales and favorable mix. Dealer pipelines remain very lean with mostly current model year product well positioning the business heading into the prime retail season. Lastly, I’ll discuss our updated outlook for 2026 as we enter the core retail selling season in the U.S. we are encouraged by the stable market conditions and the strength of our first quarter performance. Steady dealer and customer sentiment, exceptionally healthy and lean pipelines, disciplined wholesale to retail alignment and sustained boating participation are sources of confidence as we move through the remainder of 2026. However, while direct sales and operational impacts remain limited, heightened geopolitical volatility has introduced new uncertainties. Earlier, Dave discussed the muted impacts to date caused by fluctuations in interest rates and fuel prices, but we remain cognizant of the potential impact on the health of our consumer, especially outside the US from a prolonged conflict in the Middle East. Finally, the tariff environment remains dynamic and during the quarter IPA tariffs were repealed and replaced with section 122 and more recently section 232 tariffs on steel and aluminum were amended. The net impact of these changes is positive and we now believe our full year incremental net tariff impact will ultimately land near the lower end of our original $35 to $45 million estimate shared at the beginning of the year. Also, as Dave mentioned, refunds related to previously paid IEIPA tariffs are not yet factored into our outlook or recognized in our financial statements. The result is materially unchanged guidance on the sales margin and free cash flow lines, but an increase to adjusted eps guidance to $4 to $4.50 reflecting the lower full year expected incremental net tariff impacts I just discussed, as well as the first quarter overdrive while also factoring in some cautiousness given the current dynamic macroeconomic environment. Overall, we believe our guidance reflects confidence in our operating plan, the resilience of our portfolio and our ability to generate strong financial performance in a flat to slightly up retail environment. I’ll now pass it …

Full story available on Benzinga.com

This post was originally published here

Wingstop Inc. (NASDAQ:WING) on Wednesday reported mixed first-quarter results.

The company reported first-quarter adjusted earnings per share of $1.18, beating the analyst consensus estimate of $1.03. Quarterly sales of $183.725 million (+7.4% year over year) missed the Street view of $189.109 million.

“Despite the decline in same-store sales, we delivered system-wide sales growth and double-digit Adjusted EBITDA growth in the quarter, supported by 17% unit growth,” said CEO Michael Skipworth.

The company said its 2026 outlook remains tied to an uncertain macro environment. It now expects a low-single-digit decline in domestic same-store sales.

Wingstop shares fell 3% to trade at $166.04 on Thursday.

These analysts made …

Full story available on Benzinga.com

This post was originally published here

Top Wall Street analysts changed their outlook on these top names. For a complete view of all analyst rating changes, including upgrades, downgrades and initiations, please see our analyst ratings page.

  • Morgan Stanley analyst Sanjit Singh downgraded Appian Corp (NASDAQ:APPN) from Overweight to Equal-Weight and cut the price target from $41 to $25. Appian shares closed at $21.72 on Wednesday.

Full story available on Benzinga.com

This post was originally published here

U.S. stocks traded mostly higher midway through trading, with the Dow Jones index gaining more than 1% on Thursday.

The Dow traded up 1.29% to 49,489.79 while the NASDAQ fell 0.01% to 24,673.01. The S&P 500 also rose, gaining, 0.37% to 7,162.03.

Leading and Lagging Sectors

Industrials shares jumped by 2.2% on Thursday.

In trading on Thursday, information technology stocks fell by 1.1%.

Top Headline

Caterpillar Inc. (NYSE:CAT) reported better-than-expected first-quarter 2026 results.

The company’s sales surged 22% year over year to $17.4 billion. Adjusted profit per share of $5.54 beat the $4.62 estimate, while GAAP profit per share was $5.47.

Equities Trading UP
           

  • Bandwidth Inc (NASDAQ:BAND) shares shot up 38% to $33.34 after the company reported better-than-expected first-quarter financial results and raised its FY26 sales guidance above estimates.
  • Shares of Everspin Technologies Inc (NASDAQ:MRAM) got a boost, surging 38% to $18.16 after the company reported better-than-expected first-quarter financial …

Full story available on Benzinga.com

This post was originally published here

Apple Inc. (NASDAQ:AAPL) reports fiscal Q2 earnings after the bell today.

The company has a habit of routinely beating earnings estimates, which explains the 94% chance Polymarket gives it of beating the $1.94 GAAP EPS consensus.

The more interesting action is on Kalshi, where traders are betting on which specific words Tim Cook and his team will say on the call, his last quarterly call as CEO before John Ternus takes over on September 1.

What Kalshi Predicts

“China” at 98%. “Manufacturing” at 96%.

Apple’s iPhone business in China collapsed through 2024 as Huawei’s premium phones took share.

It came roaring back this winter, with shipments up roughly 20% in calendar Q1. Investors want to know whether the recovery holds, and whether Cook’s two-year pivot of production to India is far enough along to insulate Apple from the next round of China tension.

“Tariff” at 96%. Apple absorbed $1.4 billion in tariff costs last quarter.

The Supreme …

Full story available on Benzinga.com

This post was originally published here

Hubbell (NYSE:HUBB) held its first-quarter earnings conference call on Thursday. Below is the complete transcript from the call.

Benzinga APIs provide real-time access to earnings call transcripts and financial data. Visit https://www.benzinga.com/apis/ to learn more.

The full earnings call is available at https://edge.media-server.com/mmc/p/z66aupdq/

Summary

Hubbell reported strong financial performance in Q1 2026, with double-digit growth in sales, adjusted operating profit, and EPS, driven by 8% organic growth and strategic acquisitions.

The company has raised its full-year 2026 outlook for total sales growth, organic sales growth, and adjusted EPS, citing confidence in its position in key markets such as electrical solutions and grid infrastructure.

Hubbell highlighted a significant growth opportunity in high-voltage transmission, estimating a $1.5 billion market opportunity over the next decade, driven by the need to efficiently transmit large amounts of power.

Operational highlights include a 21% growth in adjusted operating profit for the Utility Solutions segment, and strong demand in data center and light industrial markets driving Electrical Solutions growth.

Management emphasized ongoing investment in capacity expansion and productivity improvements, maintaining a strong balance sheet to support acquisitions and share repurchases.

Full Transcript

OPERATOR

Good day and thank you for standing by. Welcome to the first quarter 2026 Hubbell Incorporated earnings Conference Call. At this time all participants are in listen only mode. After the speaker’s presentation there will be a question and answer session. To participate you will need to press star 1-1 on your telephone. You will then hear a message advising your hand is raised to withdraw the question. Simply press star 1-1 again. Please be advised that today’s conference is being recorded now. It’s my pleasure to hand the conference over to the Senior Director of Investor Relations, Dan Inamorato. Please proceed.

Dan Inamorato (Senior Director of Investor Relations)

Thanks, Operator. Good morning everyone and thank you for joining us. Earlier this morning we issued a press release announcing our results for the first quarter of 2026. The press release and slides are posted to the Investors section of our website@hubble.com joined today by our Chairman, President and CEO Gerben Bakker and our CFO Joe Capozzoli. Please note our comments this morning may include statements related to the expected future results of our company. These are forward looking statements defined by the Private Securities Litigation Reform act of 1995. Please note the discussion of forward looking statements in our press release and considered incorporated by reference into this call. Additionally, comments may also include non GAAP financial measures. Those measures are reconciled to the comparable GAAP measures which are included in the press release and slides. Now let me turn the call over to Gerben.

Gerben Bakker

Great. Thanks, Dan and good morning everyone and thank you for joining us to discuss Hubble’s first quarter 2026 results. Hubbell delivered strong financial performance to begin the year with double digit growth in sales, adjusted operating profit and adjusted earnings per share. Organic growth of 8% in the first quarter was driven by double digit organic growth in our electrical solutions segment as well as our grid infrastructure businesses. Within the utility solutions segment, our core utility Transmission and Distribution (T&D) markets remained strong with highly visible load growth driving continued strong demand in transmission and substation markets and aging infrastructure resiliency investments driving strong demand in distribution markets. Electrical solutions growth continues to be driven by strength in data center and light industrial markets enabled by our leading brands and continued success in our strategy to compete collectively in high growth verticals. We are raising Our full year 2026 outlook for total sales growth, organic sales growth and adjusted earnings per share. This morning as we are confident Hubbell’s strong position in attractive end markets and continued execution of our long term strategy will enable us to execute through a dynamic operating environment. Before I turn the call over to Joe to walk you through our financial performance in more detail I would like to highlight an emerging growth opportunity for Hubbell in high voltage transmission, a long term megatrend that sits squarely in our core and we are demonstrating early success in a multi year investment cycle. As background, 765kV transmission represents one of the most efficient methods to move large amounts of power over long distances in order to accommodate accelerating electricity demand from electrification and load growth. Operating transmission lines at higher voltages enables utilities to deliver more power per line with lower losses and fewer space requirements. For Hubbell, high voltage transmission represents a significant multi year opportunity which is largely incremental to existing strength in traditional 345kV transmission markets. Our leading position and strong customer relationships position us well to capture this opportunity and we are demonstrating early success with several key project wins supporting this initial phase of high voltage transmission buildup. Additionally, our portfolio depth and breadth positions us as a preferred partner who customers can trust to provide a full package of critical components. This solutions offering enables high service levels and reliability while driving installation efficiency and ease of doing business for our customers. We are actively investing to support future growth in this market including development and testing of new product offerings in collaboration with major customers as well as in capacity expansion investments. Overall, we believe 765kV transmission represents an addressable market opportunity of approximately 1.5 billion over the next 10 years and we believe we are well positioned to serve this attractive long term investment cycle. With that, let me turn the call over to Joe to provide more details on our financial results.

Joe Capozzoli (Chief Financial Officer)

Thank you Gerben and good morning everybody. I am starting my comments on slide 5. Hubbell’s first quarter financial performance was strong with double digit growth across sales, adjusted operating profit and adjusted earnings per diluted share. Net sales of $1.517 billion in the first quarter of 2026 increased by 11% compared to the prior year driven by 8% organic growth and acquisitions contributing 3%. Consistent with our fourth quarter 2025 performance, both electrical solutions segment and grid infrastructure products within our utility solutions segment delivered double digit organic growth in the first quarter partially offset by anticipated softness in grid automation. Acquisitions contributed three points to growth in the first quarter with DMC power off to a strong start and integrating nicely within our Transmission and Distribution (T&D) business. From an operational standpoint, Hubbell generated $301 million of adjusted operating profit in the first quarter representing 18% growth versus the prior year with adjusted operating margins expanding 110 basis points year over year. This improvement in adjusted operating profit and adjusted operating margin was primarily driven by strong volume growth in high margin businesses While cost inflation accelerated against 2025 exit rates as anticipated, our pricing and productivity actions continued to keep pace more than offsetting those higher levels of inflation on a dollar for dollar basis in the first quarter. We also accelerated our investment levels in the first quarter as previously communicated, most notably to expand capacity in high growth areas and generate future productivity. And as anticipated, we invested $7 million in our restructuring and related program to further streamline our operational footprint primarily within our Electrical Solutions segment which as a reminder Restructuring and Reinvestment (R&R) is included in our adjusted results. Adjusted earnings per diluted share were $3.93 in the first quarter representing a 16% increase versus the prior year, driven primarily by adjusted operating profit growth below the line. Higher interest expense associated with borrowings from the DMC acquisition and a slightly higher year over year tax rate were partially offset with lower share count as a result of prior repurchase activity. Additionally, we repurchased $168 million worth of shares in the first quarter at a dollar cost average below $500 per share. We expect the net impact of these repurchases to be neutral to 2026 earnings as a lower share count will be offset by higher interest, but the repurchases of shares at attractive valuations is expected to provide us with earnings accretion in 2027. Our balance sheet remains strong and is poised to invest on behalf of our shareholders. Our primary focus remains on internal reinvestments and acquiring differentiated businesses to bolt on to attractive areas of our portfolio. The pipeline of opportunities remains healthy and active and we continue to remain disciplined in our approach. Share repurchases represents an additional lever that we can and will utilize to return cash to shareholders over time. Turning to page six to review our performance by segment, Utility Solutions delivered another strong quarter with double digit growth in sales and adjusted operating profit. First quarter performance overall reflected a continuation of the momentum we realized exiting 2025 with overall drivers very similar across end markets. Utility Solutions generated net sales in the first quarter of $949 million which represented growth of 11% versus the prior year and includes organic growth of 7% and acquisitions contributing 3%. Organic growth of 7% in the first quarter was driven by 12% organic growth in our larger higher margin grid infrastructure business where demand strength was broad based across Transmission and Distribution (T&D)N markets. Utilities are investing at heavy rates and demand for Hubbell Solutions to serve the expanding critical infrastructure needs of our customers is driving continued momentum in orders and providing visibility to further strength over the balance of 2026. As we will highlight in a few minutes. We now anticipate our utility solutions segment to deliver high single digit organic growth on a full year basis outside of our core Transmission and Distribution (T&D) markets. Telecom and gas distribution grew attractively in the first quarter while METERS and AMI markets remained weak as anticipated. While grid Automation organic sales declined 7% year on year in the first quarter sales increased slightly on a sequential basis. We remain confident that Meter and AMI markets have stabilized and we anticipate easing comparisons and continued strength in protection and controls products will enable grid automation organic sales to return to slight year over year growth in the second quarter. Operationally, HUS delivered $207 million of adjusted operating profit in the first quarter representing 21% growth in adjusted operating profit versus the prior year with adjusted operating margins expanding 190 basis points year over year. Operating profit growth was primarily driven by strong volumes in high margin grid infrastructure products, favorable price cost, productivity and acquisitions which were partially offset by grid automation volumes declines. Moving to page 7, electrical solution results were also strong in the quarter with double digit growth in net sales and adjusted operating Profit. For the first quarter, Electrical Solutions generated sales of $568 million which represented growth of 12% versus the prior year. Organic growth of 11% was again driven by strength in data center and light industrial markets as well as solid non residential growth partially offset by softer heavy industrial markets. The electrical solutions segment achieved approximately 40% growth in data center markets in the first quarter driven by strength in both balance of system component demand as well as sales of our modular power distribution skids. Data center order activity remained robust in the first quarter as build out activity continues to accelerate across hyperscaler and colocation customers, providing enhanced visibility for us to increase our full year outlook in data center markets to more than 25%. Broader light industrial markets remain healthy as solid US manufacturing activity generated demand for electrical components and our strategy to compete collectively in vertical markets continues to drive out growth. Operationally, he’s delivered $93 million of adjusted operating profit in the first quarter representing 10% growth in adjusted operating profit versus the prior year reflecting strong volume growth. Adjusted operating margins of 16.4% were down 30 basis points versus the prior year as benefits from volume growth and the associated operating leverage were offset by higher investments in restructuring and growth initiatives as you’ll see in our press release financials. Within the electrical solutions segment, we invested $6 million in restructuring initiatives in the first quarter of 2026 versus only $2 million in the prior year which impacted year over year margins by approximately 80 basis points as we execute on footprint optimization projects which we are confident will continue to drive long term productivity and margin expansion, price realization remains strong which combined with productivity more than offset cost inflation on a dollar for dollar basis in the first quarter. Turning to page eight to discuss our full year outlook, we are raising our full year sales growth outlook to 8 to 11% and our organic sales growth outlook to 6 to 9%. This represents an increase of 1 point to the lower end and 2 points to the higher end of our prior full year outlook and is driven by both incremental price realization to offset increased inflation relative to our initial outlook as well as enhanced visibility to continued demand strength in our Transmission and Distribution (T&D) and data center end markets. Operationally, we anticipate double digit growth and adjusted operating profit at the midpoint of our guidance range for 2026, driven primarily by strong sales growth in high margin areas of our portfolio. We remain confident in managing price cost productivity to neutral or better on a dollar for dollar basis over the full year. So the math on higher inflation as well as planned investments to support accelerated growth initiatives results in a slightly more modest outlook for the full year margin expansion versus our initial outlook. Below the line, we anticipate that lower share count of 53.1 million shares on a full year basis will be fully offset by higher net interest while our assumptions for the other expense and tax rate remain unchanged. Overall, we continue to anticipate at least 90% free cash …

Full story available on Benzinga.com

This post was originally published here

CVR Partners (NYSE:UAN) released first-quarter financial results and hosted an earnings call on Thursday. Read the complete transcript below.

This transcript is brought to you by Benzinga APIs. For real-time access to our entire catalog, please visit https://www.benzinga.com/apis/ for a consultation.

The full earnings call is available at https://events.q4inc.com/attendee/451428767

Summary

CVR Partners reported first quarter 2026 net sales of $180 million and net income of $50 million, with an EBITDA of $78 million.

The company declared a distribution of $4 per common unit, reflecting strong operational performance with ammonia plant utilization at 103%.

Increased sales volumes and pricing for UAN and ammonia were noted, driven by market tightness and geopolitical conflicts impacting global supply.

Capital spending for 2026 is estimated to be between $60 and $75 million, with a significant portion funded through cash reserves.

Management highlighted ongoing projects to increase production capacity and reduce costs, including feedstock diversification and plant debottlenecking efforts.

Full Transcript

OPERATOR

Ladies and gentlemen, thank you for standing by and welcome to the first quarter 2026 CS CVR Partners LP earnings conference call. All lines have been placed on mute to prevent any background noise. After the speaker’s remarks, there will be a question and answer session. If you would like to ask a question during that time, press Star followed by the number one on your telephone keypad. If you would like to withdraw your question, press star followed by the number one. As a reminder, today’s call is being recorded. I will now hand today’s call over to Richard Roberts, Vice President of FPA and Investor Relations. Please go ahead, sir.

Richard Roberts (Vice President of FPA and Investor Relations)

Good morning everyone. We appreciate your participation in today’s call. With me today are Mark Pytosh, our Chief Executive Officer, Dan Newman, our Chief Financial Officer, Mike Wright, our Chief Operating Officer and other members of management. Prior to discussing our 2026 first quarter results, let me remind you that this conference call may contain forward looking statements as that term is defined under federal securities laws. For this purpose, any statements made during this call that are not statements of historical facts may be deemed to be forward looking statements. You are cautioned that these statements may be affected by important factors set forth in our filings with the Securities and Exchange Commission and in our latest earnings release. As a result, actual operations or results may differ materially from the results discussed in the forward looking statements. We undertake no obligation to publicly update any forward looking statements, whether as a result of new information, future events or otherwise, except to the extent required by law. This call also includes various non GAAP financial measures. The disclosures related to such non GAAP measures, including reconciliation to the most directly comparable GAAP financial measures, are included in our 2026 first quarter earnings release that we filed with the SEC for the period. Let me also remind you that we are a variable distribution MLP. We will review our previously established reserves current cash usage, evaluate future anticipated cash needs and may reserve amounts for other future cash needs and as determined by our General Partners Board. As a result, our distributions, if any, will vary from quarter to quarter due to several factors including but not limited to operating performance fluctuations, the prices received, finished products, capital expenditures and cash reserves deemed necessary or appropriate by the Board of Directors of our General Partner. With that said, I’ll turn the call over to Mark Pytosh, our Chief Executive Officer.

Mark Pytosh (Chief Executive Officer)

Mark, thank you. Richard, good morning everyone and thank you for joining us for today’s call. The summarized financial highlights for the first quarter of 2026 include net sales of 180 million net income of 50 million, EBITDA of 78 million and the board of directors declared a first quarter distribution of $4 per common unit, which will be paid on May 18 to unitholders of record at the close of the market on May 11. For the first quarter of 2026, our ammonia plant utilization was 103%, with both plants running well and experiencing minimal downtime during the quarter. We also saw an increase in ammonia sales volume relative to the prior year period along with increased sales prices for UAN (Urea Ammonium Nitrate) and ammonia. The tightness in the nitrogen fertilizer market that began …

Full story available on Benzinga.com

This post was originally published here

Tetra Technologies (NYSE:TTI) released first-quarter financial results and hosted an earnings call on Thursday. Read the complete transcript below.

Benzinga APIs provide real-time access to earnings call transcripts and financial data. Visit https://www.benzinga.com/apis/ to learn more.

View the webcast at https://events.q4inc.com/attendee/733196623

Summary

Tetra Technologies reported a strong first quarter of 2026, with revenue reaching $156 million and adjusted EBITDA at $26 million, both 10-year highs.

The industrial chemicals and production testing subsegments delivered record revenues, driven by robust operational and financial fundamentals across all segments.

The ongoing conflict in the Middle East, which historically accounts for about 5% of revenue, is not expected to negatively impact financial results due to offsetting activities in other regions.

The company’s One Touch Tetra 2030 strategy is progressing well, with significant growth opportunities in deep water specialty chemicals, electrolytes for battery energy storage, and desalination of produced water.

The Arkansas Bromine project is on track, with phase two underway and completion expected by 2028, designed to double the existing bromine supply capacity.

International production testing revenue exceeded 50% of total segment revenue, with successful expansion in Argentina and increased market share in unconventional land operations.

Despite uncertainties in oil and gas prices, the company maintains its 2026 guidance of single-digit revenue growth and strong completion fluid margins.

The company is evaluating options to accelerate lithium and magnesium development, leveraging synergies with the ongoing bromine project.

Management expressed confidence in Tetra Technologies’ ability to navigate current market conditions and make progress toward 2030 targets.

Full Transcript

Carly (Operator)

Thank you for standing by. My name is Carly and I will be your conference operator today. At this time I would like to welcome everyone to the Tetra Technologies Inc. 1Q 2026 earnings conference call. All lines have been placed on mute to prevent any background noise. After the speaker’s remarks, there will be a question and answer session. If you would like to ask a question during this time, simply press STAR followed by the number one on your telephone keypad. If you would like to withdraw your question, press Star one again. Thank you. I would now like to turn the call over to Curt Halliott. Please go ahead.

Curt Halliott

Hey, Good morning and thank you for joining Tetra’s first quarter 2026 earnings call. Speakers on today’s call will be Brady Murphy, President and Chief Executive Officer, and Matt Sanderson, Chief Financial Officer. Before we begin, I’d like to call your attention to the Safe harbor statement in our Form 10Q. Some of the remarks we make today may be forward looking and are subject to risks and uncertainties as outlined in our SEC filings. Actual results may differ materially from those expressed or implied. In addition, we may refer to adjusted ebitda, free cash flow and other non GAAP financial measures. Please refer to our press release for GAAP reconciliations and note that these reconciliations are not a substitute for GAAP financials. As such, we encourage you to Refer to our 10Q that was filed yesterday. After Brady and Matt provide their comments, we will open the line for Q and A. I’ll now turn the call over to Brady.

Brady Murphy (President and Chief Executive Officer)

Thank you Kurt and good morning everyone. Welcome to Tetra’s first quarter 2026 earnings call. I’ll walk through the very positive first quarter highlights how Tetra is positioned in this uniquely uncertain time and the progress towards our 2030 targets before turning it over to Matt to cover more detailed financials and the balance sheet. Despite the backdrop of one of the most tumultuous periods in the history of the oil and gas industry, we started 2026 with one of the strongest first quarter performances in the company’s past 10 years. If we exclude the benefit of the Gulf of Mexico Neptune project. In the first quarter of last year, revenue of 156 million and adjusted EBITDA of 26 million were 10 year highs, as were the first quarter results for both Brazil and Gulf of Mexico. In addition, the industrial chemicals and production testing subsegments each delivered 10 year high revenues with strong margin contributions. What encourages us most about our results is that the operational and financial fundamentals for each of our segments and many of our subsegments are improving even before the benefit of current elevated oil prices and potential increased customer spending activity at current oil prices. We anticipate offshore projects could be pulled forward into unconventional activity in the US will eventually respond. Combine this with the significant growth opportunities laid out in our One Touch Tetra 2030 strategy, which while I will update later on our call, we feel very good about how Tetra’s position for 2026 in the coming years regarding the ongoing conflict in the Middle east and given that this region has historically accounted for about 5% of the company’s revenue, we do not expect an overall negative impact on our financial results. That is because what we have seen so far is activity in our core business regions of the U.S., Europe and Latin America will likely offset any reductions that may occur in our Middle east business. This applies to our supply chain as well since all of our chemical manufacturing plants are located in the United States and Europe and our elemental bromine is sourced from Arkansas which is also location of our critical minerals resources. Over the longer term it remains to be seen how developments in the Persian Gulf and Middle east will impact the global oil and gas markets and our business, but in general we believe it could boost investment in the US and international oil convention activity and provide tailwinds to an already robust offshore and deep water outlook for completion fluids and products.. Our industrial chemicals business had a record setting first quarter with revenue up 15% year over year and 13% quarter over quarter. For the first time since 2021 when energy services were suppressed due to COVID 19, it accounted for over 50% of the total first quarter segment revenue. Higher pressure gas plays in South Texas and the western Haynesville supporting Gulf Coast LNG plants are driving higher volumes of higher value completion fluids. Increasing pressures in West Texas due to disposal of well pore space are also contributing to higher density fluids for well workovers. Looking forward, we’re well positioned heading into our Traditional European seasonal second quarter peak for completion fluid. Energy Services Q1 revenue and adjusted EBITDA in Brazil were at a 10 year high. Although we did not execute any Neptune jobs, our first quarter fluids business in the Gulf of Mexico, excluding NEPTUNE work in the first quarter of last year also recorded a 10 year high in revenue and adjusted EBITDA. Regarding NEPTUNE projects, we’re very encouraged by the growing pipeline. The trend toward deeper hotter wells in the Gulf of Mexico continues as evidenced by very strong first quarter revenues for our highest density zinc bromide completion fluid for the water and flowback business. Despite US frac fleets down 24% year over year and a slow January due to freezing weather. Our Overall revenue was up 1% year over year and 3% quarter over quarter. Our production testing subsegment reached a 10 year high in the Q1 revenue as our automated sandstorm technology continues to gain market share across the unconventional land operations in the us, Argentina and the Middle East. Our strategy to grow this segment internationally has been successful and for the first time in the last 10 years, international production testing revenue was over 50% of the total PT subsegment revenue. Looking ahead to the rest of 26, significant uncertainty remains for oil and gas prices. However, given our geographic footprint, we believe any headwinds from the Middle east will be offset by the strength of our other geomarkets. We expect to gain further clarity on customer activity on offshore and outside of the Middle east as we move through the second quarter. For now, we are maintaining our prior 26 guidance of single digit revenue growth over 2025 with completion fluid margins between 25 and 30% and water flow back in the mid teens. Turning to our strategic progress towards our One Tetra 2030 objectives, at our Investor day last September we outlined a clear strategic path for the company. Although much has changed in the world since that event, our view of the company’s key growth trajectories across deep water specialty chemicals, electrolytes for battery energy storage, critical minerals and desalination of produced water has strengthened. We expect bromine demand to support our deep water completion fluids and battery storage electrolytes to double by 2030, driving the need for and reliable access to cost effective elemental bromine, the critical feedstock. This has become more evident with the current events in the Middle east as well. Over 50% of the global bromine supply comes from that region. Our bromine plant project in Southwest Arkansas continues to proceed on time and on budget. Phase two of the project is underway with phase three slated for 2027 and first production at the start of 2028. The plant is designed to have an annual capacity of up to 75 million pounds, more than double our existing long term third party supply agreement. Tetra’s electrolyte revenue grew meaningfully in 2025 as the US Energy Information Administration reports that a record 15 gigawatts of utility scale battery storage was added to the grid in 25. The EIA projects that another record 24 gigawatts is planned for 2026, representing a 60% growth rate as artificial intelligence and cloud computing drive rapid growth in data center power demand, scalable long duration energy storage is becoming increasingly critical. Tetra’s proprietary pure flow zinc bromide is a key input for these systems, supporting safe, non flammable performance at utility scale. Tetra’s OASIS TDS end to end desalination of produced water for beneficial reuse continues to gain momentum with multiple engineering efforts and customer commercial engagements. Since achieving 24.7 steady state operations 60 days ago, our Permian Basin pilot project has operated at over 96% uptime and continues to meet our performance specifications. We believe that behind the meter, power generation, access to affordable natural gas and land and other factors will drive significant data center growth in West Texas and accelerate the produced water desalination market well ahead of our 2030 targets. Regulatory agencies continue to focus on understanding the technology, setting permitting standards and encouraging the industry to bring solutions to the produced water disposal challenge. TETRA is honored to participate in the National Petroleum Council Produced Water Committee and to support the recently announced U.S. environmental Protection Agency Reuse Action Plan 2.0. Regarding Tetra’s lithium and magnesium critical mineral resources in Arkansas, we continue to advance relationships with technology providers and conduct engineering studies. We have formed a joint venture with Magrathea Metals to advance domestic magnesium metal production and monetize this asset. The JV will leverage our specialty chemical processing expertise and large scale magnesium resource base combined with Magrathea’s proprietary electrolytic magnesium production technology which has been partially underwritten by the US Department of War. In April, Magrathea successfully converted Tetras Mac OVA brine rich in magnesium into a high purity magnesium metal at its small pilot operation in the San Francisco Bay area. The JV named Arkansas Magnesium is currently conducting engineering studies for a first of a kind demonstration plant planned for colocation at the Evergreen Bromine site in Arkansas for lithium. A strong rebound in lithium carbonate prices over the past six months has led us to look at options to accelerate the development of our evergreen 585,000 metric ton lithium carbonate resources. As a reminder, Evergreen is a 6,900 acre brine unit in southwest Arkansas on which Tetra owns 65% of the brine mineral rights and ExxonMobil owns 35%. The combination of current LCE prices of around 25,000 per metric ton and efficiency advances in direct lithium extraction technology are making this a very attractive option to accelerate more to come as we look at ways to advance this opportunity. With that, I’ll turn the call over to Matt.

Matt Sanderson (Chief Financial Officer)

Thank you Brady. Good morning everybody. Completion Fluids and products revenue of 92 million adjusted EBITDA 26 million increased 10% and 12% respectively relative to Q4 2025. The sequential increase was driven by higher sales volumes in our industrial chemicals business and ongoing deep water projects in the Gulf of America and Brazil that Brady referenced earlier Year over year completion fluids and products revenue and adjusted EBITDA decreased 1% and 23% respectively. As a reminder, our first half 2025 results included high impact Tetra NEPTUNE projects which we previously noted we do not expect to repeat in the first half of this year. That said, the pipeline of deep water and high pressure high temperature completion opportunities continues to grow. With our best in class service delivery and unique fluid chemistry solutions, we’re well positioned to participate in a forecasted growth in offshore deepwater activity. As Brady mentioned earlier, geopolitical unrest in Europe and the Middle east has led to rapid shifts in global market dynamics. As …

Full story available on Benzinga.com

This post was originally published here

On Thursday, WESCO Intl (NYSE:WCC) discussed first-quarter financial results during its earnings call. The full transcript is provided below.

This transcript is brought to you by Benzinga APIs. For real-time access to our entire catalog, please visit https://www.benzinga.com/apis/ for a consultation.

View the webcast at https://edge.media-server.com/mmc/p/cbfg8kb6/

Summary

WESCO Intl reported strong Q1 2026 results with record sales of $6.1 billion, up 14% year-over-year, driven by a 70% increase in data center sales.

The company achieved significant profit growth, with adjusted EBITDA up 25% and a 52% increase in adjusted EPS, supported by gross margin expansion and strong operating leverage.

WESCO Intl raised its full-year 2026 outlook, expecting sales growth of 6-9% and adjusted EPS between $15 and $17, reflecting continued positive business momentum despite macroeconomic uncertainties.

Operational highlights include record backlog growth of 22%, strong cash flow generation, and successful refinancing that improves liquidity and reduces interest expenses.

Management highlighted strategic initiatives focused on scaling business in high-growth markets, improving operating leverage, and enhancing working capital efficiency.

Full Transcript

OPERATOR

Hello and welcome to Wesco’s 2026 first quarter earnings call. I would like to remind you that all lines are in listen only mode throughout the presentation. If you would like to ask a question, please press STAR followed by one on your telephone keypad. Please note that this event is being recorded. I would now hand the call over to Scott Gaffner, Senior Vice President, Investor Relations to begin

Scott Gaffner (Senior Vice President, Investor Relations)

thank you and good morning everyone. Before we get started, I want to remind you that certain statements made on this call contain forward looking information. Forward looking statements are not guarantees of performance and by their nature are subject to uncertainties. Actual results may differ materially. Please see our webcast slides and the Company’s SEC filings for additional risk factors and disclosures. Any forward looking information speaks only as of this date and the Company undertakes no obligation to update the information to reflect changed circumstances. Additionally, today we’ll use certain non GAAP financial measures required. Information about these measures is available on our webcast slides and in our press release, both of which are posted on our website@wesco.com on the call this morning we have John Engel, Wesco’s chairman, president and CEO and Neil Dev, Executive Vice President and Chief Financial Officer. Now I’ll turn the call over to

John Engel (Chairman, President and CEO)

John thank you Scott Good morning everyone. Thank you for joining our call. Today we delivered an exceptional start to 2026, building on last year’s market outperformance and accelerating business momentum. In the first quarter. Sales backlog, operating margin, adjusted earnings per share and free cash flow all increased versus the prior year and exceeded our expectations. Record first quarter sales of 6.1 billion were up 14% marking our third quarter in a row of double digit sales growth. Booming data center demand remains a significant growth driver of our business. Data center sales of 1.4 billion were up approximately 70% versus prior year and represented 24% of total company sales in the quarter. Overall, our business momentum continued to accelerate in the quarter with organic sales up sequentially outpacing normal seasonality and reinforcing the strength and durability of demand across our end markets. This performance reflects broad based strength across our entire portfolio led by continued strong momentum in CSS and EES along with improving trends in ubs. We again ended this quarter with a record backlog up 22% versus prior year reflecting the continued effectiveness of our cross selling program and providing clear visibility of the secular growth trends on our business. Profit growth, margin improvement and free cash flow generation were also Excellent. In the first quarter. Adjusted EBITDA grew 25% and adjusted EBITDA margin expanded 60 basis points driven by gross margin expansion and strong operating cost leverage on our double digit sales growth. Adjusted diluted earnings per share was up 52% versus the prior year. Free cash flow generation at 128% of adjusted net income was also very strong, underscoring our disciplined execution and continued focus on working capital management. We’re very pleased with our first quarter results. While we remain mindful of the volatility of the broader macroeconomic environment, we see positive momentum continuing across our business. As a result, we are raising our full year outlook for 2026 as the market leader and with positive momentum building, I’m confident that Wesco will continue to outperform our markets through disciplined execution, our differentiated value proposition and the strength of our global platform. Our Wesco team remains focused on driving strong growth and margin expansion and delivering superior value to our customers and shareholders. One final comment as we announced earlier this year, Dave Schultz is retiring from Wesco and Neil Dev has joined our team as cfo. I would like to thank Dave for his outstanding leadership, his dedicated service and his tremendous contributions to Wesco and our overall success over the past 10 years. We wish Dave and his family our very best. Neal’s off to a great start as Wesco’s new CFO and I will now turn it over to him to take you through our excellent first quarter results and raised full year outlook in more detail.

Neal Dev

Neal thank you John and good morning everyone. I’d like to thank John and the board for the opportunity and I want to recognize Dave for his leadership and thank him for his partnership during this transition. Before turning to our results, I’ll take a minute to touch on my near term priorities. I intend to focus on partnering with the leadership team to scale our business in attractive end markets, drive profitable growth, continued market outperformance and deliver strong cash flow with disciplined capital allocation. That mindset has been shaped by working across both public and private companies, often in complex global, highly competitive technology and capital intensive businesses. John and I are aligned on the initial focus areas where we have the potential for taking our existing great capabilities to the next level. First, driving operating leverage and margin expansion as we scale, particularly in data centers and other high growth end markets. This will be accomplished by a combination of partnering with our business leaders to ensure that our commercial and go to market strategy reflects our enhanced value proposition and partnering with our functional leaders on continuing to improve our cost structure. It’s all about profitable growth. Second, improving working capital efficiency and cash conversion through tighter processes, analytics and execution discipline. This is not just about back office, it’s about optimizing our end to end capabilities from sales funnel to cash collection Transitioning to our Results Let me start with the highlights for the quarter. We delivered strong organic sales growth year over year with sequential performance better than typical seasonality. Profitability improved with meaningful EBITDA margin expansion. EPS was up more than 50% and free cash flow generation was strong at 128% of net income. With that, let me Turn to our first quarter results. Starting on Slide 4, we delivered an excellent first quarter with reported sales of 6.1 billion, up 14% year over year including 12% organic growth. We delivered volume growth across all three SBUs and realized an estimated price benefit of approximately 3 points. Gross margin was 21.2%, up approximately 20 basis points year over year and SGA operating leverage improved by 40 basis points. As a result, adjusted EBITDA increased 25% to 389 million and adjusted EBITDA margin expanded 60 basis points to 6.4% of sales. Turning to Slide 5, adjusted EPS increased 52% year over year to $3.37. The year over year improvement was driven primarily by stronger operating performance in the quarter reflecting higher sales and improved profitability. Additionally, EPS growth benefited from a lower tax rate and from the absence of the preferred stock dividend following last year’s redemption. Turning to Slide 6, CSS delivered another excellent quarter with organic sales up 22% year over year and reported sales up 24%. This growth was driven by continued strength in Wesco Data Center Solutions which delivered a record quarter with sales up over 60%. Within the rest of the portfolio, security delivered high single digit growth while enterprise network infrastructure declined mid single digits due to weakness in the service provider market. However, including data center related sales, Enterprise network infrastructure grew high teens year over year. Overall, organic growth was driven primarily by volume up about 21% with price contributing approximately 1%. Backlog ended the quarter at a record level and was up approximately 40% versus the prior year reflecting continued strong data center project activity and order rates. Profitability also improved meaningfully and our focus remains on margin expansion as we scale the business, particularly in our data center markets. Adjusted EBITDA increased 41% to $223 million and adjusted EBITDA margin expanded 110 basis points to 9%. Importantly, despite some modest pressure on gross margin from large data center projects, we generally see healthy and accretive EBITDA margins for Wesco Data center solutions. Moving to slide 7 ESS delivered solid growth in the quarter with organic sales up 7% and reported sales up 9% year over year. Growth was driven by strong execution in OEM and construction. OEM was up mid teens driven by strength in the semiconductor and data center markets. Construction was up low double digits supported by robust wire and cable demand and continued infrastructure project activity. Industrial was down low single digits primarily reflecting project timing impacts. However, our industrial stock and flow business grew mid single digits in the first quarter and backlog was up double digits supporting an improving trend. Data center sales in EES were up over 100% year over year and represented about 10% of EES sales, highlighting the continued scaling of our exposure to this secular growth trend. Overall, organic growth was driven by solid underlying demand with volume contributing approximately 3% and pricing contributing about 4%. Importantly, backlog ended the quarter at a record level up 14% versus the prior year supported by strong order activity and pipeline conversion. Profitability improved meaningfully in the quarter. Adjusted EBITDA increased 30% to $185 million. An adjusted EBITDA margin expanded 130 basis points to 8.2% driven by higher gross margins and strong operating leverage. Turning to Slide 8 UBS delivered 6% organic sales growth in the first quarter supported by improving demand and an increasing backlog. Utility delivered high single digit growth driven by strong double digit growth in investor owned utilities and continued positive momentum in grid services. Public power was flat year over year which is encouraging. However, the market remains highly competitive and gross margins are expected to remain under pressure given weak sales in transformers and wiring cable. Consistent with our prior commentary, Broadband delivered mid single digit growth year over year supported by strength in the U.S. overall organic sales growth reflected approximately 3% volume growth and about 3% pricing. Backlog increased 16% year over year. We are seeing increasing interest in our grid services enabled power capabilities from hyperscalers and other data center customers. We have a growing funnel of sales opportunities and we are bullish that we will benefit from AI driven data center investments and other major power related infrastructure projects over the long term. Adjusted EBITDA was 131 million, down 5% versus the prior year and adjusted EBITDA margin decreased 120 basis points to 9.6% primarily driven by gross margin pressure and higher SG&A as a percentage of sales. Recall that UBS is accretive to total company adjusted EBITDA margin given its higher margin profile and the improved growth rates will lead to even higher margins over time given the operating leverage. Turning to slide 9 I want to take a moment to further review the continued momentum we’re seeing in the broader data center market and Wesco’s role in that growth. Data center sales continued to scale in the first quarter reaching approximately 1.4 billion, up about 70% year over year and representing 24% of total company sales in the quarter. Notably, the data center end market is now Wesco’s largest end market across all three SBUs and support a diverse set of customers with a diverse set of Wesco capabilities. On a trailing twelve month basis, data center sales are now approximately 4.8 billion or 20% of Wesco’s total sales. This underscores both the strength of the secular demand environment and the expanding scope of what we provide customers across all business units and across the full life cycle. Turning to slide 10 this highlights our end to end data center offering and the role we play across the full lifecycle with exposure across css, EES and ubs. Wesco supports hyperscale, multi tenant colocation and enterprise customers with a comprehensive portfolio of products, services and solutions that span power, connectivity and ongoing operations. Our expanding capabilities and global ecosystem position us as a trusted partner as customers build, scale and operate increasingly complex data center environments. Turning to Slide 11, we delivered strong free cash flow of 213 million in the first quarter. Free cash flow was 128% of adjusted net income despite sequential sales growth. Net working capital was a source of cash in the quarter, largely driven by timing of inventory purchases and accounts payable. Moving to slide 12 during the quarter we executed a highly successful 1.5 billion bond refinancing that was upsized relative to the initial launch, reflecting strong investor demand and record pricing. Notably, we achieved the lowest coupon WISCO has ever achieved on a senior notes offering and the lowest for a double B rated five year note issued since 2021. The net proceeds will be used to redeem our 2028 senior notes, improve liquidity and further strengthen the balance sheet. This refinancing meaningfully improves our debt maturity profile and is expected to generate more than 20 million in annualized interest expense savings. We exited the quarter at 3.2 times net debt to adjusted EBITDA. Additionally, we repurchased $25 million of shares during the quarter towards offsetting dilution. Moving to Slide 13 within CSS, we have raised our 2026 outlook to low double digit growth reflecting the continued strength and visibility we are seeing in data centers. Data center sales are now expected to be up 20 plus percent for the year. Given the size of the market, we intend to continue to focus on healthy EBITDA margin business. Our outlook for EES and UBS remains unchanged. Moving to slide 14 we are increasing our outlook for the full year given strong first quarter results. Before I get into the details, I want to address our position relative to the current macroeconomic uncertainty. Through the first quarter and into April, we have seen no meaningful disruption to our revenue or profitability, but we continue to monitor the situation closely and kept this backdrop in mind for our outlook in the Middle East. I am pleased to report that all of our employees are safe from a company perspective. We generate less than 1% of our sales in the region, with the majority of those sales related to our CSS business. The secondary impacts on transportation costs are more tangible but have so far been manageable. Our teams are focused on passing these cost increases to our customers where appropriate and limiting the time that transportation quotes are valid to minimize overall risk. On the tariff front, the overall impact to Wesco is not material. As a reminder, Wesco is the importer of record for a small percentage of our cost of goods sold, typically low single digits. We typically …

Full story available on Benzinga.com

This post was originally published here

SunCoke Energy (NYSE:SXC) released first-quarter financial results and hosted an earnings call on Thursday. Read the complete transcript below.

This transcript is brought to you by Benzinga APIs. For real-time access to our entire catalog, please visit https://www.benzinga.com/apis/ for a consultation.

The full earnings call is available at https://event.choruscall.com/mediaframe/webcast.html?webcastid=RDZPXkjz

Summary

SunCoke Energy reported a consolidated adjusted EBITDA of $56.5 million for Q1 2026, reflecting strong operational execution despite severe winter weather and turbine failure impacts.

The company announced a quarterly dividend of $0.12 per share, marking the 27th consecutive quarter of dividend distribution, indicating a commitment to shareholder returns.

SunCoke Energy reaffirmed its full-year 2026 consolidated adjusted EBITDA guidance range of $230 to $250 million, driven by strong operational execution and improved market conditions.

The industrial services segment saw a significant increase in adjusted EBITDA to $26.2 million, primarily due to the integration of Phoenix and improved terminal handling volumes.

SunCoke Energy ended Q1 with a cash balance of $104.4 million and total liquidity of $262 million, enabling continued debt paydown and dividend payouts.

Full Transcript

OPERATOR

Good day and welcome to the Q1 2026 SunCoke Energy, Inc. Earnings Conference call. All participants will be in a listen only mode. Should you need assistance, please signal a conference specialist by pressing the star key followed by zero. After today’s presentation, there will be an opportunity to ask questions. To ask a question, you may press star, then one on a touchtone phone. To withdraw your question, please press star and then two. Please note this event is being recorded. I would now like to turn the conference over to Sharon Doyle, IR Manager. Please go ahead.

Sharon Doyle (IR Manager)

Thanks, Nick Good morning and thank you for joining us to discuss SunCoke Energy first quarter 2026 results. With me today are Kathryn Gates, President and Chief Executive Officer and Shantanu Agrawal, Senior Vice President and Chief Financial Officer. This conference call is being webcast live on the Investor Relations section of our website and a replay will be available later today. Following management’s prepared remarks, we will open the call for Q and A. If we do not get to your questions on the call today, please feel free to reach out to our investor relations team. Before I turn things over to Kathryn, let me remind you that the various remarks we make on today’s call regarding future expectations constitute forward looking statements. The cautionary language regarding forward looking statements in our SEC filings apply to the remarks we make today. These documents are available on our website as are reconciliations to non GAAP financial measures discussed on today’s call. With that, I’ll now turn things over to Kathryn.

Kathryn Gates

Thanks Sharon. Good morning and thank you for joining us on today’s call. This morning we announced SunCoke Energy first quarter results. I want to share a few highlights before turning it over to Shantanu to discuss the results in detail. We’re pleased with our performance in the first quarter delivering consolidated adjusted EBITDA of $56.5 million, reflecting strong operational execution. Our industrial services business performed well during the quarter with sequential improvement in terminals handling volumes and with Phoenix, performing to our expectations. As discussed on our fourth quarter 2025 earnings call, our Coke plants were impacted by severe winter weather and the Middletown turbine failure. Earlier today we also announced a quarterly dividend of $0.12 per share payable to shareholders on June 2, 2026. This is our 27th consecutive quarter announcing a dividend. While the dividend is evaluated on a quarterly basis by our board, we expect the dividend to continue as part of our well balanced capital allocation strategy. We had strong operating cash flow generation of $72.7 million and ended the quarter with ample liquidity of $262 million. As previously discussed, we are running at full capacity and sold out for the full year. With the continued seamless integration of Phoenix, the resumption of power production at Middletown and continued strong operational execution, we are confident we will achieve full year 2026 consolidated adjusted EBITDA within our guidance range of 230 to $250 million. With that, I’ll turn it over to Shantanu to review our first quarter earnings in detail.

Shantanu Agrawal (Senior Vice President and Chief Financial Officer)

Thanks, Kathryn Turning to Slide 4, net loss attributable to SunCoke was $0.05 per share in the first quarter of 2026 down $0.25 versus the prior year period. The decrease was primarily driven by higher depreciation expense, the shutdown of our Haverhill 1 Coke making facility, severe winter weather and the lower power sales due to Middletown turbine failure partially offset by lower income tax expense. Consolidated adjusted EBITDA for the first quarter of 2026 was $56.5 million compared to $59.8 million in the prior year period. The decrease in adjusted EBITDA was primarily driven by the impact of severe winter weather on our Coke operations, lower power sales from the Middletown turbine failure and the shutdown of Haverhill 1 mostly offset by the addition of Phoenix. Moving to slide 5 to discuss our domestic Coke business performance in detail. First quarter domestic Coke adjusted EBITDA was $35.3 million and Coke sales volumes were 842,000 tons compared to $49.9 million and 898,000 tons in the prior year period. The decrease in adjusted EBITDA was primarily driven by severe winter weather impacting our operations, lower power sales due to the turbine failure at Middletown and lower Coke sales volume due to the Haverhill 1 shutdown. While we experienced a slow start to the year, we are already seeing improvement in our Coke operations in the second quarter. With more favorable weather conditions, we are confident we’ll make up the lost …

Full story available on Benzinga.com

This post was originally published here

MARA Holdings Inc (NASDAQ:MARA) shares climbed on Thursday morning. This rally follows the company’s announcement of a landmark acquisition.

MARA entered a definitive agreement to acquire Long Ridge Energy & Power LLC from FTAI Infrastructure Inc (NASDAQ:FIP).

Landmark $1.5 Billion Infrastructure Acquisition

The deal carries a total transaction value of approximately $1.5 billion. This includes the assumption of at least $785 million in debt. Barclays is backstopping the transaction with a bridge loan.

The acquisition includes a 505-megawatt combined-cycle gas power plant in Hannibal, Ohio.

It also includes 1,600 contiguous acres for a digital infrastructure campus.

MARA expects to close the deal in the second half of …

Full story available on Benzinga.com

This post was originally published here

Martin Marietta Materials (NYSE:MLM) released first-quarter financial results and hosted an earnings call on Thursday. Read the complete transcript below.

This content is powered by Benzinga APIs. For comprehensive financial data and transcripts, visit https://www.benzinga.com/apis/.

The full earnings call is available at https://edge.media-server.com/mmc/p/eajqs9v6/

Summary

Martin Marietta Materials reported a strong start to 2026 with a 17% increase in revenue, reaching $1.4 billion, driven by a 7.2% growth in organic aggregate shipments.

The company reaffirmed its full-year 2026 adjusted EBITDA guidance of $2.43 billion at the midpoint, citing robust infrastructure and non-residential demand.

The Quikrete Asset Exchange was completed, providing $450 million for further aggregate acquisitions, and the acquisition of New Frontier Materials is expected to close in the second half of the year.

Operational highlights include the strongest first-quarter safety performance in the company’s history and record first-quarter shipments in core aggregates and specialties business.

Management emphasized confidence in the durability of construction demand, driven by ongoing infrastructure investment and strong non-residential construction activity.

Full Transcript

OPERATOR

Ladies and Gentlemen, welcome to Martin Marietta Materials’ first quarter 2026 earnings conference call. All participants are currently in a listen only mode. A question and answer session will follow the Company’s prepared remarks. As a reminder, today’s call is being recorded and will be available for replay on the Company’s website. I will now turn the call over to your host, Ms. Jacqueline Rooker, Martin Marietta Materials’ Vice President of Investor Relations. Jacqueline, you may begin.

Jacqueline Rooker (Vice President of Investor Relations)

Good morning and thank you for joining Martin Marietta Materials’ first quarter 2026 earnings call. With me today are Ward Nye, Chair, President and Chief Executive Officer and Michael Petro, Senior Vice President and Chief Financial Officer. As a reminder, today’s discussion may include forward looking statements as defined by United States Securities Laws. These statements relate to future events, operating results or financial performance and are subject to risks and uncertainties that could cause actual results to differ materially. Martin Marietta undertakes no obligation to publicly update or revise any forward looking statements except as legally required, whether due to new information, future developments or otherwise. For additional details, please refer to the legal disclaimers contained in today’s earnings release and other public filings, which are available on both our own and the Securities and Exchange Commission’s websites. Supplemental information summarizing our financial results and trends is available during this webcast and in the Investors section of our website. As a reminder, Our full year 2026 guidance summary on slide 5 reflects continuing operations only. Definitions and reconciliations of non GAAP measures to the most directly comparable GAAP measure are provided in the Appendix to the supplemental information in our SEC filings and on our website. Today’s earnings call will begin with Ward Nye, who will discuss our first quarter operating performance 2026 outlook, and supporting market trends. Michael Petro will then review our financial results and capital allocation details, after which Ward will provide closing remarks. Please note that all comparisons are to the prior year’s corresponding period. A question and answer session will follow. Please limit your Q&A participation to one question. I will now turn the call over to Ward.

Ward Nye (Chair, President and Chief Executive Officer)

Thank you Jacqueline Good morning and thank you for joining today’s teleconference. Before reviewing our first quarter results, I’ll take a moment to discuss the leadership appointment we announced earlier this week. As you may have seen, Chris Zamborski was appointed Martin Marietta Materials’ chief operating officer effective May 1. Chris is a highly respected and proven leader who most recently served as President of our west and Specialties Divisions. Under his leadership, both businesses delivered meaningful growth and strong operational execution since joining Martin Marietta in 2018, Chris has consistently made a significant and positive impact in every role he’s held. His deep operational experience, disciplined leadership style and strong commitment to our culture make him exceptionally well suited for this role. With Chris serving as COO, Kirk Light will assume leadership of our west and Specialties divisions while continuing in his role as President of our Southwest Division. In addition, our East Division President Oliver Brooks, Central Division President Bill Bedrazic, Vice President of Operational Excellence Ronnie Walker, and Vice President of Safety and Health Jessica Kosian will report directly to Chris. This appointment and enhanced leadership structure reflect the deep bench of talent across our divisions, districts and functions all focused on consistent execution, continuous improvement and a shared commitment to our One Culture. I’m pleased to welcome Chris to his new position and am confident that as COO he will continue to play a critical role in helping guide Martin Marietta to even greater success. With that, I’ll now turn to the quarter 2026 is off to a strong start with revenues increasing an impressive 17% to $1.4 billion. A new first quarter record organic aggregate shipments growth of 7.2% meaningfully exceeded our guidance, benefiting from an early start to the construction season in the Midwest and Colorado as well as continued strength in infrastructure and heavy nonresidential demand across our geographic footprint. As we look ahead, underlying fundamentals across the business remain favorable. Notably, the quarter’s Results reflect a 14% improvement in both adjusted EBITDA from continuing operations as well as adjusted earnings per diluted share from continuing operations. I’m especially pleased to report that our teams delivered the strongest first quarter safety performance in the company’s history as measured by both total and lost time incident rates. This achievement reflects the strength of our culture, unwavering commitment to world class safety and the operational discipline embedded throughout the organization. The quarter was also highlighted by the February 23rd closing of the Quikrete Asset Exchange, our largest aggregates acquisition to date. Importantly, this transaction accelerated our aggregates led strategy by shifting the portfolio away from more cyclical cement and concrete assets, enhancing the quality and durability of our earnings profile while providing $450 million of cash to redeploy into aggregate acquisitions. Accordingly, and consistent with the company’s SOAR 2030 strategic plan, on April 19th we entered into a definitive agreement to acquire New Frontier Materials, a complementary bolt on to our Central division that produces over 8 million tons of aggregates annually. This transaction is expected to close in the second half of the year, subject to regulatory approvals and other customary closing conditions. Looking ahead. Our MA pipeline remains active and is primarily focused on pure play aggregates opportunities across attractive sewer aligned geographies. As highlighted in this morning’s release. Our core aggregates product line delivered record first quarter shipments of 43.9 million tons, a 12% increase and record revenues of $1.1 billion representing a 14% increase. Our specialties business also achieved new all time quarterly records with revenues of $143 million up 63% year over year and gross profit of $45 million, an increase of 17%. Despite ongoing macroeconomic uncertainty and volatility, we continue to benefit from a business intentionally built for durability and resilience, enabling us to remain focused on what we can control regardless of underlying economic trends. With April’s continued strong product demand, the impact of April 1st price increases and ongoing OPTIM efforts, we’re reaffirming Our full year 2026 adjusted EBITDA from continuing operations guidance of $2.43 billion at the midpoint. Turning to end market trends, we continue to see a constructive backdrop for US Infrastructure. Our most aggregates intensive and countercyclical end market sustained federal and state investment continues to provide meaningful multi year funding visibility and as we look ahead to the next surface transportation reauthorization. Notably, a significant portion of authorized funding under the Infrastructure Investment and Jobs act, or IIJA, has yet to be deployed, with nearly half of highway and bridge funding remaining undistributed as of late February. Policymakers are negotiating a five year successor surface transportation bill with committees targeting reauthorization by October 1st following the current IIJA’s expiration on September 30th. While the timing remains subject to the legislative process and could include an interim continuing resolution, industry commentary from the American Road and Transportation Builders of America or ARTBA, indicates that state departments of transportation retain multi year visibility into their project pipelines and continue to plan under assumptions of stable federal funding. As a result, we do not expect a short term continuing resolution to disrupt construction activity in 2026 and for the near future. Beyond infrastructure, heavy non residential construction demand continues to be driven by robust data center and power generation activity aggregates. Intensive LNG projects along the Gulf coast is also gaining momentum, including projects such as the one at Port Arthur LNG, which Martin Marietta is actively supplying. Warehouse and distribution construction trends continue to recover as shipments inflected positively in the third quarter of 2025 and have continued to trend favorably. By contrast, affordability pressures tied to higher interest rates continue to influence the pace of light, non residential and and residential construction activity. Taken together, all these trends underscore the durability of long term construction demand across our footprint and bode well for our company and shareholders. I’ll now turn the call over to Michael to discuss our first quarter financial results. Michael, over to you.

Michael Petro (Senior Vice President and Chief Financial Officer)

Thank you Ward and good morning everyone. As Ward noted, our core aggregates business delivered record first quarter revenues of $1.1 billion, up 14% year over year driven by organic shipment growth of more than 7% and approximately one month of acquisition contributions. Daily shipments have continued to trend above expectations in April, led by infrastructure and non residential strength in our east division, organic pricing in the first quarter was negatively impacted by geographic mix, driven primarily by robust organic shipment growth of more than 20% in our Central and West divisions which carry lower average selling prices and gross margins than our east and Southwest divisions reported aggregates Gross profit declined 3% to $288 million as stronger volumes and underlying organic pricing improvements were more than offset by geographic mix and purchase accounting impacts, including a non cash $22 million charge associated with the fair market value step up of quickrete inventory as well as higher depreciation, depletion and amortization expense which is now disclosed within our product line reporting. Importantly, underlying organic cost of goods sold per ton excluding pass through freight cost and timing related items is tracking below our implied 3% guidance as cost optimization efforts continue. Other building materials revenues declined 5% to $116 million and consistent with typical first quarter seasonality posted a $16 million gross loss driven by customary asphalt plant winter shutdowns in both Colorado and Minnesota. Our specialties business delivered revenues of $143 million and gross profit increased 17% to $45 million, both all time quarterly records reflecting contributions from the July 2025 Premier Magnesia acquisition and and organic pricing gains which were partially offset by lower organic shipments and higher energy costs. Turning to capital allocation, completion of the Quikrete asset exchange on February 23rd marked a significant milestone for the company, concluding our SOAR 2025 divestiture program providing $450 million in cash and simultaneously representing the largest aggregates acquisition in our history. With this transaction complete, We’ve now launched SOAR 2030 supported by a strong balance sheet and a focus on aggregates led acquisitive growth. The quikcrete integration is progressing ahead of plan with results since closing exceeding both our EBITDA and margin expectations. Further, we expect to realize synergies of approximately $50 million over the coming years as we normalize unit Profitability Importantly, the $450 million of cash proceeds combined with the company’s significant free cash flow generation provides ample capacity to advance our very active M&A pipeline and opportunistically repurchase shares during times of market volatility. Consistent with this capital deployment framework, we repurchased $200 million of shares in the first quarter and announced the acquisition of New Frontier Materials, which complements our differentiated position along the I 70 corridor from Kansas City to St. Louis. Please note that our reaffirmed 2026 guidance does not include contributions from New Frontier as the transaction has not yet closed. Consistent with historical practice, we will revisit guidance at midyear. With that, I will now turn the

Ward Nye (Chair, President and Chief Executive Officer)

call back over to Ward. Thank you, Michael the first quarter of 2026 marked the launch of SOAR 2030, an important milestone in the continued evolution of our company’s portfolio. Our increasingly aggregates led foundation was strengthened by the closing of the Quikrete Asset Exchange and further reinforced by additional bolt on aggregates acquisition activity already announced this year. Combined with our high performing differentiated specialties business, these actions have created a resilient and durable enterprise. This streamlined and focused portfolio supported by attractive long term demand drivers, advantaged market positions and and culture deeply rooted in safety, commercial and operational excellence, reinforces our confidence in SOAR 2030, and our ability to deliver sustainable growth and enduring value creation for our shareholders. If the operator now provides the required instructions, we’ll turn our attention to addressing your questions

OPERATOR

and thank you. We will now begin the question and answer session. If you have dialed in and would like to ask a question, please press Star one on your telephone keypad to raise your hand and join the queue. If you would like to withdraw your question, simply press Star one a second time. If you’re called upon to ask your question and are listening via speakerphone on your device, please pick up your handset and ensure that your phone is not on mute when asking your question. Again, it is Star one to join the queue and our first question comes from the line of Trey Grooms with Stevens. Your line is open.

Ward Nye (Chair, President and Chief Executive Officer)

Hey, good morning Ward and Michael. Thanks for taking my question. So, given the more challenging near term cost environment, particularly around diesel and potentially softer residential demand backdrop, Ward, could you walk us through some of the key assumptions that are supporting your decision to reiterate the full year EBITDA guidance? Specifically, maybe how you’re thinking about the cadence of pricing through the year, including any catch up to the higher diesel costs and you know what level maybe of incremental or Mid year increases is embedded in that outlook. Thank you. That’s right. Thanks for the question. Good to hear your voice. So several things. One, as you noted, we are reaffirming our guidance for the year relative to EBITDA. We feel very confident in that. As you know, this actually excludes anything from New Frontier because that hasn’t closed yet. Secondly, we tend to come back at midyear and reassess our guidance. I’ll tell you right now I’m feeling pretty optimistic about what that reassessment is going to look like. So I’m looking forward to that at mid year. I would say several things. One, if we just think about some of the reasons why, if we’re looking at our shipment trends, as you may recall, when we announced our guide in February for the year, we said if there was any place that we thought we were being a little bit probably conservative on, it may be on the shipment outlook. You can see how that came through in Q1. You can also tell from the prepared remarks today and the headlines to the, to the release that April has come out of the box very attractively as well. So my guess is we’re going to see shipments probably trending to the higher end of the guide relative to pricing. I’m not looking at pricing and having any concern about how I think that’s going to roll out for the year. We did call out in the prepared remarks, I know Michael did that what we saw in the Central and West groups in particular was volumes up 21%. I mean that’s a big number. And keep in mind, pricing there is notably lower, and by that I mean dollars per ton lower than it is in the East and the Southwest. And so what we’ve seen so far in April is we’re seeing that mix flow back to the type of cadence that we would ordinarily expect. So we’re seeing the east really catch up nicely with that. Keep in mind too, I anticipate we’re going to see a greater realization of mid year price increases this year than we saw last year. Clearly the diesel impact and others will be a driver on that. That is not taken into account in our guide. So again, it’s something that gives me a lot of confidence in what we’re doing. I know part of your question dealt very specifically with diesel and how we see that. So if you think about the fact that we’re going to consume, let’s call it 55 ish million gallons of diesel fuel this year, that’s assuming that diesel prices peak probably in Q2 and then return not to lower levels, but probably somewhat more moderated levels in Q3 and Q4. We feel like the overall impact from diesel headwinds, and that’s including other items impacted by it, will be about $36 million in the aggregates business, probably $50 million for the entire company. So it’s not going to be anything that’s material. The other thing that I would remind you is if we go back in time and remember what diesel pricing looked like back when Ukraine and Russia first started their conflict, diesel spiked. And then we saw that headwind for a while, and then we actually saw a nice margin expansion actually later that year. This is not as pronounced as that was at the time. So I feel like it’s very manageable. And again, to your point, with what’s going on in infrastructure and what’s going on with heavy non-residential activity, I think the volume backdrop will continue to be very attractive. But Trey, I hope that helps.

Trey Grooms

That did. That was super helpful, Ward. And specifically on that 36 million you’re talking about for 2Q, I’m guessing it’d be more weighted there.

Ward Nye (Chair, President and Chief Executive Officer)

Any color, just for our modeling, it is weighted more there. I’ll turn it over to Michael to talk to you a little bit more about any modeling questions you may have.

Michael Petro (Senior Vice President and Chief Financial Officer)

Yeah, Trey, you’re absolutely right. So we’re thinking about 20 to 25 million of it coming through in Q2, given where spot rates are. But just in terms of the organic cost cadence as compared to last year. Remember in Q1 of last year, we had sub 2.5% cost of goods sold (COGS) per ton growth. And then we had 6ish percent in Q2 and Q3 and 4 in Q4. So we’ve now passed the tough cost comp growth. And so we feel very good about the implied cost per ton through the balance of the year, assuming we do get a little bit of diesel headwind embedded in there as well.

Trey Grooms

Got it. All right, thanks for the color. I’ll pass it on.

OPERATOR

And our next question comes from the line of Catherine Thomson with Thomson Research Group. Your line is open.

Catherine Thomson

Hi. Thank you for taking my question today and appreciated your color and prepared commentary on the reauthorization of IIJA. So we have been speaking to a wide variety of contacts on this bill reauthorization. And the general theme is no bill is going backwards on funding the House is what we’re hearing is $$550 billion. Sounds like it fits pretty close to what you’re also saying. But I think the important thing, too, just to clarify is how much of this is going to be true surface transportation versus the $350 …

Full story available on Benzinga.com

This post was originally published here

Hilton Grand Vacations (NYSE:HGV) held its first-quarter earnings conference call on Thursday. Below is the complete transcript from the call.

Benzinga APIs provide real-time access to earnings call transcripts and financial data. Visit https://www.benzinga.com/apis/ to learn more.

The full earnings call is available at https://events.q4inc.com/attendee/662419070

Summary

Hilton Grand Vacations reported a strong start to 2026, with adjusted EBITDA exceeding expectations and contract sales meeting guidance.

The company repurchased $150 million in stock during the quarter and raised its full-year adjusted EBITDA guidance due to strong performance and the acquisition of the Alara JV.

Leisure travel demand remained robust, and the company is closely monitoring external risks, such as geopolitical conflicts, but remains confident in its strategic initiatives and cost control measures.

The acquisition of Alara in Las Vegas allows the company to fully control the project, enhancing inventory flexibility and offering notable financial benefits.

The company is undertaking an inventory optimization initiative, identifying properties for disposition to improve portfolio quality and reduce long-term costs.

Full Transcript

Sam

It’s Sam. Good morning and welcome to the Hilton Grand Vacations first quarter 2026 earnings conference call. At this time, all participants have been placed in a listen only mode and the floor will be opened for your questions following the presentation. If you would like to ask a question, please press Star one on your touchtone phone to enter the queue. If at any point your question has been answered, you may remove yourself from the queue by pressing Star 2. If you should require operator assistance, please press 0. If using a speakerphone, please lift your handset to allow the signal to reach our equipment. Please limit yourself to one question and one follow up to allow the opportunity for everyone to ask questions. You may reenter the queue to ask additional questions. I would now like to turn the call over to Mark Melnick. Thank you, Mark Melnick, Senior Vice President of Investor Relations. Please go ahead, sir.

Mark Melnick (Senior Vice President of Investor Relations)

Thank you, Operator, and welcome to the Hilton Grand Vacations first quarter 2026 earnings call. Our discussions this morning will include forward looking statements. Actual results could differ materially from those indicated by these forward looking statements. The statements are effective only as of today. We undertake no obligation to publicly update or revise these statements. For a discussion of some of the factors that could cause actual results to differ, please see the Risk Factors section of our SEC filings. Our reported results for all periods reflect accounting rules under ASC606, which we adopted in 2018. Under ASC606, we’re required to defer certain revenues and expenses related to sales made in the period when a project is under construction and then hold off on recognizing those revenues and expenses until the period when construction is completed. The aggregate of these potentially overlapping deferrals and recognitions from various projects in any given period are known as net deferrals. Please note that in our prepared remarks today, we’ll only be referring to metrics that remove the impact of net deferrals which more accurately reflects the cash flow dynamics of our financial performance during the period. To simplify our discussion today, we’ve uploaded slides to our Investor Relations site showing these metrics which we’ll be referring to on today’s call. I’d urge you to view these slides on our website and investors on slide 2 of these materials, you can see the deferral adjusted metrics that we’ll be referring to on today’s call. Reported results for the quarter do not reflect $25 million of net contract sales deferrals under ASC 606, which had the effect of reducing reported GAAP revenue and were related to pre sales of our Kohaku project, partially offset by a recognition associated with our Kyoto project, which opened in March. Also on slide two, we deferred a net $7 million of direct expenses associated with these revenues. Adjusting for both these items would increase the adjusted EBITDA to shareholders reported in our press release by a net of $18 million to $267 million. With that, let me turn the call over to our CEO Mark Wang.

Mark Wang (CEO)

Mark: Good morning everyone and welcome to our first quarter earnings call. We’re off to a strong start this year and overall we’re pleased with how the quarter came together. The results we delivered in Q1 reflect disciplined execution by our teams across the business and a consistent focus on our strategic initiatives. Contract sales met the expectations we laid out on our prior call and adjusted EBITDA exceeded expectations, growing 8% versus the prior year with 130 basis points of margin expense expansion. In addition, we drove great new buyer growth along with cost efficiencies that supported healthy EBITDA flow through. These results reinforce our confidence that we’re on track to achieve our long term algorithm of consistent growth in sales and EBITDA and strong free cash generation, along with a commitment to returning capital to our shareholders. We repurchased an additional $150 million of stock during the quarter, bringing the total to nearly 2.3 billion we’ve returned since becoming a standalone public company. Next taking a look at our consumer environment. Leisure travel demand among our members remained healthy, arrivals were strong in the first quarter, and we see trends improving through the fall and March was our strongest sales month of the quarter, with momentum carrying into April. At the same time, we’re carefully monitoring the impact of the conflict in the Middle east and the potential broader effects on the leisure travel landscape. But our business model carries several advantages that should help us to navigate the environment. Our members have prepaid their vacations for the year, making them less sensitive to travel costs, and new buyers are attracted by the value proposition of our marketing package offerings. In addition, the efficiency initiatives that we already have underway, combined with the variable nature of our cost structure leaves us well positioned. So while we keep a close eye on the external risks, our focus remains on executing our strategic initiatives and controlling what we can control. Given the results of the first quarter and our purchase of the remainder of the Alara JV to take full control of the project, which I’ll cover shortly, I’m pleased to report that we’re raising our adjusted EBITDA guidance for the full year. More broadly, the quarter and guidance reinforced the progress we’re making as an integrated business and the consistency of our execution against our strategic priorities which are operational excellence, attracting new customers, product evolution and innovation, and enhancing member lifetime value. Operational excellence drove strong execution in the quarter while tours outpaced VPG and we saw a higher mix of new owners. Our teams effectively manage costs to drive improved EBITDA contribution and we remain confident in our guidance to grow EBITDA for the full year. We also did a great job of adding new buyers. The investments we made in our marketing pipeline last year supported high single digit new buyer tour growth in Q1, maintaining the strong pace that we saw in the fourth quarter. In addition, solid conversion of those tours led to the highest level of first quarter new buyer transactions since 2023, up 8% versus the prior year, which is key to driving improved efficiency as well as growing our embedded value. Those new buyers helped to support 29% growth in our HCV Max member base over the prior year to 277,000 members. On the product front, I’m happy to announce that we reached an agreement to purchase the development rights of Alara, our flagship resort in Las Vegas, allowing us to take full control of the project by moving it from a fee for service JV to an owned property as part of the natural progression with our fee for service projects. It provides us several significant benefits including receiving the full economics of the real estate business as well as assuming the existing and future financing business associated with the project along with providing additional inventory flexibility. Alara has always been very popular with new buyers, but this transaction also unlocks our ability to better sell the project across our entire sales distribution network outside of Las Vegas, enabling owners to upgrade out of the project while simultaneously allowing any of our members to upgrade into Alara. We’re also making great progress with our inventory optimization initiative. We’ve identified a set of eight properties that no longer fit with our portfolio and we recently entered into an agreement with a third party for the disposition of our interest in these assets at high level. Dispositions allow us to proactively manage aging and non core inventory, reduce long term carry risk and ensure capital is continually recycled into higher performing opportunities. This discipline helps us to balance between growth, flexibility and profitability. From a strategic standpoint, dispositions support our broader goals by improving the mix and quality of inventory over time, creating capacity to reinvest into priority markets, products and experiences, and reinforcing a proactive rather than reactive approach to inventory management. Taken together with the financial benefits Dan will outline, these dispositions help us to optimize the portfolio and position the business for sustained growth. Turning to the Embedded value, we’re continuing to expand our industry leading HCV MAX and HCV Ultimate Access offerings to enhance our value proposition and drive member engagement. We recently introduced additional enhancements to Hilton honorpoints conversions within the MAX program to complement the suite of benefits that have proven so popular with our MAX members. Lastly, our Ultimate Access teams continue to to expand our Best in Class experiential platform. In just the past few months alone, our members have enjoyed private concerts with number one Billboard artist Ella Langley, the legendary Beach Boys and Grammy Award winner Kelly Clarkson. Our partnership with the LPGA provided members in person access to our Tournament of Champions to see this year’s winner Nellie Corder, which was televised on NBC and the Golf Channel. HGV will also continue as an official event partner of Formula One’s Heineken Las Vegas Grand Prix where members have access to exclusive trackside HCV clubhouse suites and entertainment at Alara. So HEV Ultimate Access is already the biggest and most comprehensive program of its kind and this year will be even bigger and better. We’ve got new events planned for new members including FIFA, World cup events, nascar, an expanded Summer Concert Series lineup, and we’ll also be announcing additional exciting programming to further enhance member experiences throughout the year. So to sum it up, I’m happy with the performance at the start of the year. Owners and new buyers continue to respond well to our value proposition. We delivered on our target that we laid out, which allowed us to increase our full year EBITDA guidance. We’re continuing to make incremental progress in our evolution as an integrated entity, and we’re focused on consistent execution against our strategic priorities as we move through the rest of the year. None of this would be possible without the dedication of our team members and leadership who have built such a strong, innovative and people first culture. With that, I’ll turn it to Dan for more details on the numbers.

Dan

Dan thank you Mark and good morning everyone. We had great results in the quarter, achieving our contract sales forecast while also exceeding our expectations for EBITDA growth through cost controls that drove margin expansion. As Mark mentioned, this strong performance along with the momentum that we’re carrying into the second quarter gave us the confidence to raise our full year. Adjusted EBITDA guidance Turning to our results for the quarter, total revenue before cost reimbursements in the quarter grew 2% to $1.2 billion. Adjusted EBITDA to shareholders grew 8% to $267 million with margins excluding reimbursements of 23%, up 130 basis points over the prior year within our real estate business, contract sales of 719 million were down slightly, performing in line with the expectations we laid out on our prior call. The decline was the result of tough comparisons for our blue green business as it normalized against a strong HCV Max launch period last year. New buyer contract sales were over 26% of the total for the quarter, an increase of approximately 160 basis points from the prior year as we benefited from continued strength in new buyer tours along with solid execution from our sales teams that drove new buyer transactions to their best first quarter performance since 2023. Stores grew 8.5% during the quarter to more than 189,000 with growth coming from both our new buyer and owner channels. Conversion of the package pipeline we built over the past year fueled new buyer growth while the strong value proposition of HEV Max continues to drive owner tour demand. BPG was nearly $3,800 for the quarter, declining 8% and in line with the expectations of a high single digit decline we discussed last quarter. As we indicated, the decline was driven by the normalization of owner close rates at bluegreen due to the lapping of the record HEV Max launch period comparisons along with higher mix of new buyer sales in the quarter which carry lower VPGs. Cost of product in the period was 10% which benefited from higher than expected sales mix of lower cost inventory during the quarter. Real estate sales and marketing expense for the quarter was 352 million or 49% of contract sales, 260 basis points lower than the prior year. The strong margin performance was primarily the result of our efficiency initiatives which the team did a great job executing against real estate. Profit for the quarter was 152 million with margins of 28% up 350 basis points versus the prior year. Overall, I’m very pleased with our performance this quarter as our focus on efficiency was able to more than offset the margin dilutive effects of lower VPG and higher new buyer mix in our financing business. First quarter revenue was 138 million and profit was $87 million. Excluding the amortization items associated with our acquired receivables portfolio financing margins were 65%, up 510 basis points from the prior year. Looking at our portfolio metrics, our weighted average interest rate for originated loans was 14.5%. Combined gross receivables for the quarter were 4.4 billion. Our total allowance for bad debt was 1.3 billion. On that 4.4 billion receivable balance or 29% of the portfolio the portfolio remains in great shape Overall. Our annualized default rate for our consolidated portfolios was 10.1% for the quarter, reflecting a slight improvement against the first quarter of the prior year and as …

Full story available on Benzinga.com

This post was originally published here

Centerra Gold (TSX:CG) reported first-quarter financial results on Thursday. The transcript from the company’s first-quarter earnings call has been provided below.

This content is powered by Benzinga APIs. For comprehensive financial data and transcripts, visit https://www.benzinga.com/apis/.

The full earnings call is available at https://event.choruscall.com/mediaframe/webcast.html?webcastid=NnpeYvWb

Summary

Centerra Gold reported a strong start to 2026 with consolidated production of 68,000 ounces of gold and 14.2 million pounds of copper, in line with full-year guidance.

The company strengthened its financial position with a cash balance increase to $543 million, while returning $33 million to shareholders through buybacks and dividends.

Strategic initiatives include ongoing developments at Mount Milligan, Thompson Creek, and the Chemex project, with significant progress on life-of-mine optimization studies and sustainability efforts.

Management highlighted the successful temporary resumption of operations at Langloth and the positive impact of higher byproduct credits on costs, despite recent diesel price increases.

Guidance for 2026 remains on track, with expectations for higher production in upcoming quarters and continued commitment to capital returns via share buybacks and dividends.

Full Transcript

Lisa Wilkinson (Vice President, Investor Relations and Corporate Communications)

Thank you Operator and good morning everyone. Welcome to Centerra Gold’s first quarter 2026 results conference call. Joining me on the call today are Paul Tomory, President and Chief Executive Officer Brian Snyder, Chief Financial Officer and Mike Silvest, our Interim Chief Operating Officer. Other members of the executive team are available for the Q and A session. Our news, published last night outlines our first quarter 2026 results and is complemented by our MD&A and financial statements which are available on Sedar, Edgar and our website. All figures are in US Dollars unless otherwise noted. Presentation slides accompanying this webcast are available on Sentara’s website. Following the prepared remarks, we will open the call for questions. Before we begin, we would like to remind everyone that today’s discussion may include forward looking statements which are subject to risks that could cause our actual results to differ from from those expressed or implied. For more information, please refer to the cautionary statements in our presentation and the risk factors outlined in our annual information form. We will also be referring to certain non GAAP measures during today’s discussion. For a detailed description of these measures, please see our news release and MD&A issued yesterday. I will now turn the call over to Paul Temori.

Paul Tomory

Thank you Lisa and good morning everyone. We achieved a very strong start to the year with production performing in line with our plan across operations. Consolidated first quarter production of 68,000 ounces of gold and 14.2 million pounds of copper of copper. Mount Milligan delivered results consistent with our recently published pre-feasibility study (PFS) and full year guidance, while the site delivered a strong quarter driven by higher grades supporting robust free cash flow generation across both sites. Our financial position strengthened this quarter with our cash balance increasing to $543 million. This was achieved while we continue to invest in our internal growth pipeline, built working capital at Langelot and returned $33 million to shareholders through share buybacks and dividends in the quarter. We remain focused on leveraging the strength of our balance sheet and our cash flow generation to advance our disciplined self funded growth strategy. In January we announced the results of a PEA for Chemistry highlighting the long term potential of the project which remains a cornerstone of our future growth pipeline. We also continue to progress key initiatives across our portfolio including delivering on the Mount Milligan PFS and ongoing development work at Thompson Creek which is expected to achieve first production in mid-2027. Work on the Life of Mine Optimization study at UXIT continues to progress. We are evaluating the incremental production potential of residual leaching of the heap and the inclusion of low grade oxide mineralization outside of the current reserve pit into the mine plan. This study remains on track for completion by the end of 2026. Gold field development activities are advancing well with field campaigns and support of engineering now complete. Detailed engineering, procurement of long lead time items and mobilization activities for 2026. Early works are progressing as planned. First production at Gold Field remains on track for late 2028. Together these growth projects position Sentara to deliver sustainable value for shareholders over the long term. In January we released an updated mineral resource and preliminary economic assessment for Kemess. The study outlined a De-risk Restart Plan which leverages substantial existing infrastructure and focuses on an integrated open pit and underground mining operation. The PEA highlights an initial 15 year mine life with meaningful gold and copper production of 171,000 ounces and 61 million pounds respectively at an all in sustaining cost on a byproduct basis of $971 per ounce. Chemist is supported by robust economics with an after tax NPV of $2.8 billion and a 29% IRR at prices of 4,500 per ounce of gold and $6 per pound of copper. The capital profile takes a phased approach with approximately 770 million in initial non sustained capital support open pit development followed by 277 million in expansionary non sustaining capital over the two years following open pit startup to support the commencement of underground operations. Most importantly, the pea only evaluates 47% of the overall resource tons, highlighting the potential for additional resources to be incorporated into future technical studies and the project’s overall scale and long term production profile. Overall, CHEMEX represents a high quality, compelling and large scale growth opportunity for Sentara. We’ve advanced technical work on a pre feasibility study which is expected in 2027. Now I’d like to provide an update on our sustainability initiatives. We continue to make progress on our environmental and permitting activities across the portfolio. During the first quarter Goldfield reached an important milestone with the receipt of its water rights transfers, supporting the advancement of the project towards operations. We remain focused on advancing the remaining permits at Goldfield and we continue to engage constructively with regulators and with the community. We remain confident in the overall permitting process for the project. Our commitment to strong social performance also remains a key focus at Goldfield. Our team hosted two Joshua Tree donation events during the quarter, engaging local communities and supporting the responsible relocation of 340trees, including 260 for personal use and 80 replanted around the perimeter of our property. At UXEUT, our social programs continue to support education, youth development and broader community initiatives, including a sport and academic program launched this quarter that is expected to reach approximately 14,000 local students over the year. We continue to advance our commitment to responsible mining practices and transparent reporting. Our team is actively working on the 2025 Sustainability Report which will highlight our progress across key environmental, social and governance initiatives. We look forward to publishing the report in May and sharing the steps we are taking to create long term value for our stakeholders before we move into our operating highlights, I would like to welcome Mike Silvest as our new Interim Chief Operating Officer who joined us at the end of March. We’ve initiated a search for a permanent CEO and in the interim Mike brings a wealth of operational experience and technical expertise to the role. His leadership will be instrumental in supporting our operations and advancing our key priorities as we remain focused on safe and reliable performance across the business. I look forward to working closely with Mike and benefiting from his expertise and his leadership and with that I’ll pass the call over to Ryan to walk through our operating and financial highlights.

Ryan Snyder

Thanks Paul. Starting with the operations, Slide 7 shows the operating highlights at Mount Milligan for the first quarter. Mount Milligan produced over 29,500 ounces of gold in the quarter, representing approximately 20% of full year guidance in line with the production profile we previously outlined, copper production was 14.2 million pounds. Gold and copper sales exceeded production, reflecting the impact of weather related logistics disruptions at the end of December that deferred some sales into 2026. We continue to expect gold production and sales to be higher in the second and third quarters reflecting planned line sequencing, all in sustaining costs on a byproduct basis for $1,060 per ounce in the first quarter, benefiting from higher byproduct credits driven by elevated copper and silver prices. Recent increases in diesel prices did not have a material impact on Mount Milligan’s cost structure in the first quarter. Moving on to Oxu, first quarter production was over 38,400 ounces of gold higher than planned due to higher grades. Full year 2026 production at Oxu remains in the range of 110,000 to 125,000 ounces, with production the remaining quarters of 2026 expected to be more evenly weighted and lower than the first quarter. Production ASIC on a byproduct basis was $1,653 per ounce in the first quarter, lower compared to last quarter, driven by higher gold ounces produced and sold and lower …

Full story available on Benzinga.com

This post was originally published here

Centerra Gold (NYSE:CGAU) reported first-quarter financial results on Thursday. The transcript from the company’s first-quarter earnings call has been provided below.

Benzinga APIs provide real-time access to earnings call transcripts and financial data. Visit https://www.benzinga.com/apis/ to learn more.

Access the full call at https://event.choruscall.com/mediaframe/webcast.html?webcastid=NnpeYvWb

Summary

Centerra Gold reported strong financial performance in Q1 2026, with consolidated production of 68,000 ounces of gold and 14.2 million pounds of copper, and a cash balance increase to $543 million.

The company is advancing its disciplined, self-funded growth strategy with key projects like the Mount Milligan PFS, Thompson Creek development, and ongoing work on the Life of Mine Optimization study at UXIT.

Centerra Gold remains committed to returning capital to shareholders, repurchasing 1.3 million shares and declaring a quarterly dividend of $0.07 per share.

Management highlighted progress on sustainability initiatives and community engagement, including milestones at Goldfield and social programs at UXIT.

Future outlook includes maintaining strong operational performance, advancing key growth projects, and managing cost pressures like increased diesel prices.

Full Transcript

Lisa Wilkinson (Vice President, Investor Relations and Corporate Communications)

Thank you Operator and good morning everyone. Welcome to Centerra Gold’s first quarter 2026 results conference call. Joining me on the call today are Paul Tamori, President and Chief Executive Officer, Brian Snyder, Chief Financial Officer and Mike Silvest, our Interim Chief Operating Officer. Other members of the executive team of the executive team are available for the Q and A session. Our news, published last night outlines our first quarter 2026 results and is complemented by our MD&A and financial statements which are available on Sedar, EDGAR and our website. All figures are in US Dollars unless otherwise noted. Presentation slides accompanying this webcast are available on Sentara’s website. Following the prepared remarks, we will open the call for questions. Before we begin, we would like to remind everyone that today’s discussion may include forward-looking statements which are subject to risks that could cause our actual results to differ from from those expressed or implied. For more information, please refer to the cautionary statements in our presentation and the risk factors outlined in our annual information form. We will also be referring to certain non-GAAP measures during today’s discussion. For a detailed description of these measures, please see our news release and MD&A issued yesterday. I will now turn the call over to Paul Temori.

Paul Tamori (President and Chief Executive Officer)

Thank you Lisa and good morning everyone. We achieved a very strong start to the year with production performing in line with our plan across operations. Consolidated first quarter production of 68,000 ounces of gold and 14.2 million pounds of copper. Mount Milligan, a mine in British Columbia, delivered results consistent with our recently published Pre-Feasibility Study (PFS) and full year guidance, while the extute delivered a strong quarter driven by higher grades supporting robust free cash flow generation across both sites. Our financial position strengthened this quarter with our cash balance increasing to $543 million. This was achieved while we continue to invest in our internal growth pipeline, built working capital at Langloth and returned $33 million to shareholders through share buybacks and dividends in the quarter. We remain focused on leveraging the strength of our balance sheet and our cash flow generation to advance our disciplined self funded growth strategy. In January we announced the results of a PEA for Kemess highlighting the long term potential of the project which remains a cornerstone of our future growth pipeline. We also continue to progress key initiatives across our portfolio including delivering on the Mount Milligan PFS and ongoing development work at Thompson Creek which is expected to achieve first production in mid-2027. Work on the Life-of-Mine Optimization study at Oksut continues to progress. We are evaluating the incremental production potential of residual leaching of the heap and the inclusion of low grade oxide mineralization outside of the current reserve pit into the mine plan. This study is on track to be completed by completion by the end of 2026. Goldfield development activities are advancing well with field campaigns and support of engineering now complete. Detailed engineering, procurement of long lead time items and mobilization activities for 2026. Early works are progressing as planned. First production at Gold Field remains on track for late 2028. Together these growth projects position Sentara to deliver sustainable value for shareholders over the long term. In January we released an updated mineral resource and preliminary economic assessment for Kemess. The study outlined a De-risk Restart Plan which leverages substantial existing infrastructure and focuses on an integrated open pit and underground mining operation. The PEA highlights an initial 15-year mine life with meaningful gold and copper production of 171,000 ounces and 61 million pounds respectively at an all-in sustaining cost on a byproduct basis of $971 per ounce. Chemist is supported by robust economics with an after tax NPV of $2.8 billion and a 29% IRR at prices of 4,500 per ounce of gold and $6 per pound of copper. The capital profile takes a phased approach with approximately 770 million in initial non sustained capital support open pit development followed by 277 million in expansionary non sustaining capital over the two years following open pit startup to support the commencement of underground operations. Most importantly, the pea only evaluates 47% of the overall resource tons, highlighting the potential for additional resources to be incorporated into future technical studies and the project’s overall scale and long term production profile. Overall, CHEMEX represents a high quality, compelling and large scale growth opportunity for Sentara. We’ve advanced technical work on a pre feasibility study which is expected in 2027. Now I’d like to provide an update on our sustainability initiatives. We continue to make progress on our environmental and permitting activities across the portfolio. During the first quarter Goldfield reached an important milestone with the receipt of its water rights transfers, supporting the advancement of the project towards operations. We remain focused on advancing the remaining permits at Goldfield and we continue to engage constructively with regulators and with the community. We remain confident in the overall permitting process for the project. Our commitment to strong social performance also remains a key focus at Goldfield. Our team hosted two Joshua Tree donation events during the quarter, engaging local communities and supporting the responsible relocation of 340trees, including 260 for personal use and 80 replanted around the perimeter of our property. At UXEUT, our social programs continue to support education, youth development and broader community initiatives, including a sport and academic program launched this quarter that is expected to reach approximately 14,000 local students over the year. We continue to advance our commitment to responsible mining practices and transparent reporting. Our team is actively working on the 2025 Sustainability Report which will highlight our progress across key environmental, social and governance initiatives. We look forward to publishing the report in May and sharing the steps we are taking to create long term value for our stakeholders before we move into our operating highlights, I would like to welcome Mike Silvest as our new Interim Chief Operating Officer who joined us at the end of March. We’ve initiated a search for a permanent CEO and in the interim Mike brings a wealth of operational experience and technical expertise to the role. His leadership will be instrumental in supporting our operations and advancing our key priorities as we remain focused on safe and reliable performance across the business. I look forward to working closely with Mike and benefiting from his expertise and his leadership and with that I’ll pass the call over to Ryan to walk through our operating and financial highlights.

Ryan

Thanks Paul. Starting with the operations, Slide 7 shows the operating highlights at Mount Milligan for the first quarter. Mount Milligan produced over 29,500 ounces of gold in the quarter, representing approximately 20% of full year guidance in line with the production profile we previously outlined, copper production was 14.2 million pounds of copper. Gold and copper sales exceeded production, reflecting the impact of weather-related logistics disruptions at the end of December that deferred some sales into 2026. We continue to expect gold production and sales to be higher in the second and third quarters reflecting planned mine sequencing, all-in sustaining costs on a byproduct basis for $1,060 per ounce in the first quarter, benefiting from higher byproduct credits driven by elevated copper and silver prices. Recent increases in diesel prices did not have a material impact on Mount Milligan’s cost structure in the first quarter. Moving on to Oxu, first quarter production was over 38,400 ounces of gold higher than planned due to higher grades. Full year 2026 production at Oxu remains in the range of 110,000 to 125,000 ounces, with production the remaining quarters of 2026 expected to be more evenly weighted and lower than the first quarter. Production ASIC on a byproduct basis was $1,653 per ounce in the first quarter, lower compared to last quarter, driven by higher gold ounces produced and sold and lower sustaining capex. This was partially offset by a …

Full story available on Benzinga.com

This post was originally published here

Cigna Group (NYSE:CI) reported first-quarter financial results on Thursday. The transcript from the company’s first-quarter earnings call has been provided below.

Benzinga APIs provide real-time access to earnings call transcripts and financial data. Visit https://www.benzinga.com/apis/ to learn more.

The full earnings call is available at https://edge.media-server.com/mmc/p/apwjtsv4/

Summary

Cigna Group reported strong first quarter 2026 results with total revenues of $68.5 billion and an adjusted earnings per share (EPS) of $7.79.

The company raised its full-year 2026 adjusted EPS outlook to at least $30.35 due to strong performance and market momentum.

Strategic portfolio updates include exiting the individual exchange business and exploring strategic alternatives for Evercore to focus on core growth platforms.

Management highlighted the launch of a new rebate-free pharmacy benefits model, Signature, aimed at providing the lowest out-of-pocket costs for consumers.

CEO David Cordani announced his transition to Executive Chair, with Brian Ivanko succeeding him as CEO in July 2026.

Full Transcript

OPERATOR

Ladies and Gentlemen, thank you for standing by for the Cigna Group’s first quarter 2026 results review. At this time, all callers are in a listen only mode. We will conduct a question and answer session later during the conference and review procedures on how to enter queue to ask questions at that time. If you should require assistance during the call, please press Star zero on your touch tone phone. As a reminder, ladies and gentlemen, this conference, including the Q and A session is being recorded. We’ll begin by turning the conference over to Ralph Jacoby. Please go ahead.

Ralph Jacoby (Senior Vice President of Investor Relationship)

Great, thanks. Good morning everyone. Thanks for joining today’s call. I’m Ralph Jacoby, Senior Vice President of Investor Relations. With me on the line this morning are David Cordani, the Cigna Group’s Chairman and Chief Executive Officer Brian Ivanko, President and Chief Operating Officer and Ann Denison, Chief Financial Officer. In our remarks today, David, Brian and Anne will cover a number of Topics, including our first quarter 2026 financial results and our financial outlook for 2026. Following their prepared remarks, David, Brian and Anne will be available for Q and A. As noted in our earnings release, when describing our financial results, we use certain financial measures, including adjusted income from operations and adjusted revenues, which are not determined in accordance with accounting principles generally accepted in the United States, otherwise known as GAAP. A reconciliation of these measures to the most directly comparable GAAP measures, shareholders net income and total revenues respectively, is contained in today’s earnings release which is posted in the Investor relations section of thecignagroup.com we use the term labeled adjusted income from operations and adjusted earnings per share on the same basis as our principal measures of financial performance. In our remarks today, we will be making some forward looking statements, including statements regarding our outlook for 2026 and future performance. These statements are subject to risks and uncertainties that could cause actual results to differ materially from our current expectations. A description of these risks and uncertainties is contained in the cautionary note to today’s earnings release and in our most recent reports filed with the SEC regarding our results. In the first quarter, we recorded after tax special items charges of $322 million or $1.22 per share. Details of the special items are included in our quarterly financial supplement. Additionally, please note that when we make prospective comments regarding financial performance, including our full year 2026 outlook, we will do so on a basis that includes the potential impact of future share repurchases and anticipated 2026 dividends. With that, I’ll turn the call over to David.

David Cordani (Chairman and Chief Executive Officer)

Thanks, Ralph. Good morning everyone. And thank you for joining us today. This call is somewhat bittersweet for me as it is my last quarterly earnings call after many years at Cigna Group as CEO, I participated in close to 70 of these calls with you, and I’m pleased to be able to share strong results again on this call today, I’ll focus my remarks on our strong first quarter performance and how we continue to deliver in a dynamic operating environment, and then I’ll take a moment to address our leadership transition on July 1, when Brian Ivanko will step into the CEO role to drive our company’s next chapter of growth and I’ll transition to the role of Executive Chair. Following my remarks, Brian will provide a more detailed update on our business platforms and performance and then Ann will review additional details about our financial results and outlook and then we’ll move to your questions. So let’s get started. I’m pleased to report that the Cigna Group delivered strong performance in the first quarter, including total revenues of $68.5 billion and adjusted earnings per share of $7.79 all while we continue our disciplined track record of reinvesting back in our businesses to fund growth, addressable market expansion and innovation. With our performance, we are raising our full year 2026 adjusted EPS outlook to at least $30.35, reflecting our disciplined approach and steady execution in an operating environment that continues to be shaped by many forces. Two of these forces are clearly rising to the top for customers and employers. First, affordability and second, the need for health care that is more personalized and as a result, easier to navigate. We are addressing these expectations in an environment where healthcare demand continues to rise and the cost of new services like pharmaceuticals continue to grow at a rate greater than inflation. Against this backdrop, over the course of my tenure, there are three key attributes that our company has demonstrated time and again to fuel a successful track record of performance rooted in purpose and innovation. First, and perhaps most importantly, we’ve been steadfast in our commitment to put the customer at the center to make the healthcare journey more affordable, personalized and overall easier to navigate. This commitment is what spurred us to improve our prior authorization process as outlined in our first Customer Transparency Report, which was released last month. Our goal is to make the process faster and more seamless while ensuring that care is delivered at the right time and right place appropriately and safely. To that end, we have removed hundreds of tests and procedures and services from prior authorization process in the United States, decreasing the volume of medical prior authorizations by about 15%. Our commitment to the customer also drove us to take an active role within the industry, which last week announced further progress towards standardization of the prior authorization process. This is enabling greater automation and more seamless, efficient access to care while maintaining appropriate safeguards. This announcement reflects continued progress on the voluntary commitments our industry made in June of 2025 in coordination with HHS and CMS. Second, our company is taking a strategic and disciplined approach to the way we shape our business portfolio, which Brian will address more in a moment. Through our approach, we remain sharply focused on where we can deliver differentiated value and we feed those businesses with additional capabilities and resources and where we cannot, we make the decision to exit. This process has honed our focus on the addressable markets where we have a right to win for the benefit of our customers, patients and clients, which has been a critical driver in our success for many years. Finally, we have a proven ability to innovate and perform even in the most challenging environments, whether that has been periods of accelerated medical costs or during the COVID 19 pandemic, just to name two. In moments like these, when customers, needs and behaviors change quickly, we remain relentlessly focused on market centricity, customer centricity and micro segmentation. The introduction of our transformative rebate free pharmacy service model is the most recent example. This multi year investment in innovation will deliver the lowest price to the consumers for their brand drugs, which will be 30% lower with full transparency each and every time and this model further deepens partnerships with independent pharmacists, including those critical ones in rural communities. We call this offering Signature, a name that reflects a new era in pharmacy services. Now, before concluding my remarks, I also want to speak briefly to our upcoming leadership transition. After my nearly 17 years as CEO of the Cigna Group, we are on track for our carefully planned transition on July 1st when Brian will succeed me as CEO and I will take on the role of Executive Chairman. Brian has a strong history of prioritizing customer and client needs and decision making, grounded in our clarion mission and enduring sense of purpose. Looking ahead, he is committed to further the use of data and AI to drive affordability and personalization, which in turn drives value and sustained growth with a strong foundation and clear focus. I’m excited for Brian to take the helm to guide the Cigna Group to its next chapters of growth and I look forward to working closely with Brian in my role as Executive Chair. Now let me wrap up and summarize the quarter and our results. We delivered strong performance, giving us the confidence to raise our full year guidance for 2026. We delivered total revenues of $68.5 billion and earnings per share of $7.79. Looking ahead, our increased adjusted EPS outlook of at least $30.35 reinforces the sustained growth, durability and strength of our company. We are delivering in a highly dynamic environment and we continue to invest with purpose through a customer first orientation, driving, disciplined portfolio shaping and innovating to personalize and modernize health care for the benefit of our customers and clients. We have a clear strategy and the right leadership team in place to capitalize on those opportunities ahead. And with that, I’ll turn the call over to Brian to discuss our results in more detail.

Brian Ivanko (President and Chief Operating Officer)

Thanks, David. Good morning everyone. First, I want to take a moment to thank David and acknowledge his strong leadership both within our company and throughout the industry. Through his 35 years of service with the company, he has left an enduring legacy defined by an unwavering focus on meeting customer needs, a relentless partnership orientation toward others, and a deep commitment to the communities that we serve. It’s been a privilege to work with him for so many years. Looking to the future there’s no question that the status quo in health care is unsustainable. Costs continue to rise as does demand for healthcare services, an untenable equation in this environment. The experience that I have gained over my nearly three decades with the company have sharpened my understanding of the needs of those we serve and strengthened my commitment to continue to deliver on our mission. I’m humbled and honored to take on the role of CEO in July with a focus on the Cigna Group becoming the clear leader in consumer focused and AI enabled health services with an emphasis on clinically complex patients making care more affordable and more personalized for those we serve. In my remarks today, I will cover several topics. First, I will share a few ways we are shaping our portfolio for the future aligned to our strategy. Then I will review our first quarter business performance across our growth platforms and I will go a bit deeper on ways that we are harnessing data, advanced analytics and AI to deliver more affordable and more personalized healthcare services. Turning to our portfolio, we have a disciplined and consistent approach to ensure that our businesses are aligned to and support our strategic direction and can deliver differentiated value in the market. Over the years, this approach has guided our decisions to either add to or subtract from our portfolio, which in turn has positioned our core healthcare businesses for sustainable growth. For example, last year we added key capabilities in the highly attractive specialty pharmacy market. Our acquisition of carepath Rx provides us with further depth in infusion related services and our investment in Shields Health Solutions provides us the opportunity to partner more closely with hospitals and health systems who serve patients with complex care needs and rely on specialty medications. On the other end of the spectrum are the businesses we have divested where the assets no longer support our strategic direction or have reduced management focus from our core growth platforms. Our divestiture of our group life and disability business, which also meaningfully reduced the company’s exposure to economic downturns, is a prime example, as is the more recent sale of our Medicare businesses. Divesting each of these assets enabled greater focus and investment in the remaining businesses within our portfolio, supporting our forward looking growth path. In keeping with this portfolio shaping discipline, today we are announcing two additional actions. First, we are planning to exit our individual exchange business at the end of this year. We did not make this decision lightly and appreciate the importance of ensuring patients have continuity through the transition. There are no changes to coverage or networks related to this announcement and we will support members who are through their open enrollment transitions into 2027. Second, as our industry continues to make strong progress on standardizing and automating prior authorization services, we have decided to initiate a strategic review of alternatives for evicor. Evicor is a part of enabling how care is evaluated and delivered across the industry, including working with numerous health plans to perform reviews and prior authorizations on their behalf. As David mentioned, prior authorization plays an important role in health care and we will explore options to continue delivering the highest level of service for health plans and the industry at large while maximizing long term value. We see the potential for different approaches to standardized prior authorization across the improving transparency for customers and clients, reducing the administrative burden for providers and creating efficiencies for the industry. Both of these actions reflect a deliberate strategy to sharpen our focus on our core platforms where we have the capabilities, positioning and expertise to deliver differentiated value for the benefit of those we serve. Turning to our performance in the first quarter, we started the year with strong results across both evernorth Health Services and Cigna Healthcare. Overall, Evernorth earnings were slightly ahead of expectations. This was driven by the strength of our specialty and care services businesses which delivered adjusted earnings growth of 20% in the quarter, reflecting continued attractive volume growth as the specialty pharmacy marketplace continues to grow. We are well positioned across our suite of solutions, our strong supply chain and our expertise in inventory management and complex drug distribution. Our ability to deliver a strong clinical support model continues to have a positive impact for patients and clients alike. We see this through higher adoption and adherence rates once patients begin taking biosimilars in specialty generics, leading to better overall outcomes. Turning to Evernorthth’s pharmacy benefit services business, our results were in line with expectations. Our first quarter results reflect previously discussed impacts of large client renewals and investments as we progress toward our transformative new rebate free model, aptly named Signature. This week we met with hundreds of leaders from our largest pharmacy benefit services clients and there are a few consistent themes we’re hearing from clients and prospects alike about the direction of our business. First, our forward thinking innovation is resonating or its focus on the consumer offering the lowest out of pocket cost at the pharmacy counter and helping clients navigate through a very complex and fluid external environment. As clients continue to face budget uncertainty driven by new drug launches and mid year market disruptions, our new simplified model will give clients clear visibility into economic value and greater predictability. Second, they appreciate that we are proactively leading through regulatory and legislative changes. We continue to hear from clients and prospects that they are seeking clarity, predictability and value for consumers. Our Signature model directly addresses these priorities and supports plan sponsors as they address their obligations today and in the future. Finally, our clients value our partnership in meeting their needs today while anticipating future needs. This feedback is reflected in a strong start to our 2027 pharmacy benefits services selling season. Finally, turning to Cigna Healthcare, our earnings exceeded expectations in the quarter and grew 18% year over year powered by solid persistency, continued disciplined execution and MCR favorability. Our strong earnings performance is further enabled by our innovative offerings and focus on consumer experience improvements. Recently, Cigna Healthcare was ranked number one by JD Power and Digital Experience Satisfaction among commercial health plan members. For the second consecutive year, we are also seeing Clarity. Our new co Pay only medical plan launched late last year generates strong market interest. In addition to its simplified product design, Clarity features externally derived clinical quality measures and a single digital front door that gives customers integrated access to care and their historical claims Data through our MyCigna app. Taken altogether, we’re pleased with our strong first quarter performance across both Evernorthth and Cigna Healthcare. The positive first quarter results and market momentum are further powered by our embrace of data and modern technology. By leveraging the combined power of data, advanced analytics and AI, we’re able to drive greater customer and client satisfaction through improved affordability of care and greater personalization of services. Let me offer a few examples. Starting in our specialty and care services businesses today we are using AgentIQ AI together with our clinical expertise to improve customer and patient experiences. This is enabling us to transform how prescriptions are processed efficiently, schedule prescription orders and proactively identify patients who may need additional service. We do not use AI for clinical decision making, but rather AI capabilities increase the speed and strength in the decision quality of our highly experienced clinical teams. In pharmacy benefits services, we are utilizing AI to enable better care and service to our customers. This includes leveraging AI in our signature model to improve member communication and notifications and help patients make decisions on their care journey and enhancing our capabilities to deliver the lowest out of pocket cost for consumers including with GLP1s where we continue to evolve as new oral solutions enter the market and prices decrease. In Insignia Healthcare, we are using AI enabled capabilities to improve outcomes through risk prediction models, identifying complex patients earlier and connecting them with our clinical teams. Our predictive high cost claimants model identifies members with increasing care needs earlier in their clinical journey. This then enables targeted clinical engagements that improve affordability, reduce acute utilization and drive measurable cost savings. To date for those customers engaged in this model, we see an average of $2,000 per member per year in savings resulting in the elimination of unnecessary provider and ER visits. This improved high cost claimant prediction capability has benefits across Cigna Healthcare, for example in the stop loss business more broadly, we are proactively helping our customers in highly personalized ways. The combination of our AI tools and contact centers and improved customer digital experiences led to a 20% drop in total inbound calls for digitally eligible customer in our Cigna Healthcare US employer business and a 25% reduction for pharmacy benefit services members when compared to just two years ago. Ultimately, these capabilities allow us to go beyond administrative …

Full story available on Benzinga.com

This post was originally published here

On Thursday, Gildan Activewear (NYSE:GIL) discussed first-quarter financial results during its earnings call. The full transcript is provided below.

Benzinga APIs provide real-time access to earnings call transcripts and financial data. Visit https://www.benzinga.com/apis/ to learn more.

The full earnings call is available at https://edge.media-server.com/mmc/p/uivgavbh/

Summary

Gildan Activewear reported record Q1 sales from continuing operations of nearly $1.2 billion, a 64% increase year-over-year, primarily due to the Hanes brand acquisition.

Adjusted diluted earnings per share from continuing operations were $0.43, down from $0.59 in Q1 2025, influenced by short-term integration initiatives.

The company is progressing with the integration of Hanes, relocating production to leverage Gildan’s cost structure, and aims for $250 million in run-rate cost synergies over three years.

Despite uncertainties in the Middle East, the company maintains its 2026 guidance and three-year objectives, citing strong competitive positioning and a robust innovation pipeline.

Management expressed confidence in achieving financial targets, with a focus on operational excellence, cost discipline, and synergy realization.

Full Transcript

OPERATOR

Ladies and Gentlemen, thank you for standing by and welcome to Gildan Activewear’s 2026 Q1 earnings conference call. Please be advised that today’s conference is being recorded. I would now like to hand the conference over to J.C. Hayem, Senior Vice President, Head of Investor Relations and Global Communications. Please go ahead.

J.C. Hayem (Senior Vice President, Head of Investor Relations and Global Communications)

Thank you, Angela. Good morning, everyone and thank you for joining us this morning. Earlier today we issued a press release announcing our results for the first quarter while maintaining our guidance for 2026 as well as our three year objectives for the 202628 period. The company’s management discussion and analysis and consolidated financial statements are expected to be filed with the Canadian securities and regulatory authorities and the U.S. securities and Exchange Commission today and will also be available on our corporate website. As a reminder, please note that we’ll be holding our annual general meeting today at 2pm Eastern time with more information available on the events page of our corporate website now. Joining me on the call today are Glenn Shemandy, President and CEO of Gildan Activewear, Luca Barilli, Executive Vice President, Chief Financial Officer and Chuck Ward, Executive Vice President, Chief Commercial Officer. This morning we’ll take you through the results for the quarter and then a question and answer session will follow. Before we begin, please take note that certain statements included in this conference call may constitute forward looking statements which involve unknown and known risks, uncertainties and other factors which could cause actual results to differ materially from future results expressed or implied by such forward looking statements. We refer you to the Company’s filings with the U.S. securities and Exchange Commission and Canadian securities regulatory authorities, including in the case of our fiscal 2026 outlook and our three year objectives for the 2026-28 period, as well as certain risks and assumptions related thereto and our earnings press release dated April 30, 2026. During this call we’ll also discuss certain non GAAP financial measures. Reconciliations to the most directly comparable IFRS measures are provided in today’s earnings release as well as our mdna. Before I turn it over to Glenn, a few items to note Remember that the first quarter represents the first full fiscal reporting period during which the results of Hanes Brands are fully consolidated into the company’s financial statements. Please note that we may refer to Hanes Brands as Hanes throughout this call. Then, as previously announced, the Hanes Brands Australian business, which we refer to as haa, has been classified as held for sale and reported as discontinued Operations as of December 1, 2025, the date of closing of the Hanes brand acquisition. So unless otherwise indicated, the figures we’ll be discussing today are from continuing operations and therefore exclude the results of the HAA business. With this in mind, we are only in position to confirm that the sale process is progressing as expected and will not provide any further updates at the moment. Also, as we announced last quarter, we have transitioned to reporting disaggregated net sales by wholesale and retail as of the first quarter. You will find in our press release supplementary pro forma net sales from continuing operations disaggregated by channel and geographic area on a quarterly and full year basis for 2025. In addition, you’ll also find supplementary pro forma net sales from continuing operations for the same periods showing Gildan Activewear on the stand alone basis and adjusted for Hanes brand sales. For reference, wholesale comprises sales to distributors, screen printers, embellishers and global lifestyle brand customers which we refer to as glb, whereas retail comprises sales to mass merchants, department stores, national chains, specialty and online retailers and directly to consumers. And now I’ll turn it over to Glenn.

Glenn Shemandy (President and CEO)

Thank you Jesse and good morning everyone and thank you for joining us on this call. As we highlighted in this morning’s press release, we are pleased with our first quarter performance reflecting disciplined execution and continued progress against our strategic priorities. We delivered record Q1 sales from continuing operations of nearly 1.2 billion which were up 64% versus last year primarily due to the Hanes brand acquisition. We also reported adjusted diluted earnings per share from continuing operations of $0.43 compared to $0.59 in the first quarter of 2025, reflecting the short term impact of integration initiatives that we have put in place to accelerate synergies captured. We remain very excited about the Hanes acquisition and the opportunities we see. We are progressing well with our integration initiatives and relocating textile production volumes from the Haines to the Gildan facilities, leveraging our low cost manufacturing and supply chain structure. We are working fast but with a well thought approach to be able to unlock the benefits of operating as one integrated company and we continue to optimize and expand our capacity in 2026 to support growth in 2027. We are also enhancing our distribution network. Our plans to standardize IT systems, key supply chain and manufacturing processes, all remain on track. Given the progress so far, we remain confident in attaining our objective of approximately 250 million in run rate cost synergies over the next three years, including approximately 100 million in 2026 and we continue to pursue additional synergies beyond the three year target. Now with the situation in the Middle east, the external environment around us becomes increasingly uncertain. But Gildan has navigated through uncertain situations in the past with agility and discipline. That said, I’d like to address two key elements related to this situation. First, despite inflationary environment, we have good visibility for 2026 when it comes to our input costs including cotton, polyester as well as energy. Second, our Bangladesh operations have been running normally until now and we have built in temporary contingency plans should the situation deteriorate. This is what our agility and our vertical integration enables us to do. So we have a clear line in sight into our plans for the rest of the year and we are focused on what we can control, driving operational excellence, advancing on our integration of Hanes, maintaining our cost discipline and consistent execution. With that in mind, considering the strength of our competitive positioning across our product lines, channels and geographies driven by our scale and our strong pipeline of innovation, we are maintaining our guidance for 2026 and remain confident in our ability to achieve our three year objectives for 20262028 period. I look forward to answering your questions after our formal remarks. And now I’ll turn it over to LUCA for a financial review.

Luca Barilli (Executive Vice President, Chief Financial Officer)

Thank you Glenn and good morning everyone. Thank you for joining us today to discuss our first quarter results. Let me start with the specifics of the quarter, then turn to our 2026 outlook and guidance. First, the quarterly results. We reported record first quarter sales from continuing operations of 1.17 billion, up 63.8% year over year in line with guidance of approximately 1.15 billion. The increase reflects the Hanes Brands acquisition, partially offset by our integration initiatives undertaken to optimize the company’s manufacturing footprint and accelerate synergy capture. Now, compared with pro forma net sales from continuing operations of 1.29 billion, the year over year decline was primarily driven by lower volumes stemming from our proactive inventory reduction across customer channels which temporarily reduced sell in as we previously communicated. Now looking at Wholesale net sales were 552 million compared to 626 million in the prior year due primarily to the impact of the voluntary inventory reduction across customer channels as well as the non recurrence of some preemptive buying ahead of tariffs in the comparable period last year. This was partially offset by pricing initiatives which were implemented to partially offset a portion of the impact from tariffs. The contribution of Hanes brand’s unfavorable mix. We continue to see robust demand for comfort colors in our new brands such as Champion, which is under a licensing agreement and Alpro. Now turning to retail, net sales were 614 million compared to 85 million in the prior year, primarily reflecting the contribution from the Hanes brand’s acquisition and higher net selling prices. To a lower extent, retail sales were also affected by the lower sell in previously detailed and the non recurrence of preemptive buying ahead of tariffs. As previously mentioned, our key underwear brands captured additional market share in the quarter and new programs launched in mid-2025 are performing well. Shifting to margins, we generated gross profit of $278 million or 23.9% of net sales versus $222 million or 31.2% of net sales in the same period last year. Adjusting for an inventory fair value step up charge of 106 million recorded as part of the Hanes Brands acquisition, adjusted gross profit was 385 million or 33% of net sales compared to 31.2% in the prior year. The 180 basis point improvement mainly reflects favorable pricing initiatives implemented to partially offset the impact of tariffs, the favorable contribution from Hanes brands and to a lesser extent lower raw material and manufacturing costs. SGA expenses were 219 million compared to 87 million in the prior year. Adjusting for charges related to the proxy contest and leadership changes and related matters, adjusted SGA expenses were 218 million or 18.7% of net sales compared to 86 million or 12.1% of net sales for the same period last year. The increase in adjusted SGA in the quarter reflects the acquisition of Hanes brands partially offset by synergies realized as part of the Hanes Brands integration process. As we bring all these elements together and adjusting for the restructuring and acquisition related costs and the inventory fair value step up charge as part of the acquisition as well as the costs relating to proxy contests and leadership changes and related matters, adjusted operating income was 167 million, up 31 million year over year. Adjusted operating margin was 14.3% of net sales was down 470 basis points versus last year and ahead of guidance provided of approximately 12.9% the year over year. Decrease in adjusted operating margin is mainly a reflection of the Hanes brand’s acquisition and Hanes lower operating margins due to historically higher levels of SGA relative to Gildan. Net financial expenses were $67 million, up $37 million year over year primarily due to higher borrowing levels related to the Hanes Brands acquisition. Now taking into account all of these factors and a higher outstanding share base as a result of the acquisition, Generally Accepted Accounting Principles (GAAP) diluted loss per share from continuing operations was $0.30 compared to Generally Accepted Accounting Principles (GAAP) diluted earnings per share of $0.56 in the prior year in adjusting for restructuring and acquisition related costs, inventory fair value, step up charge and an income tax recovery of 33 million related to restructuring charges and other adjustments. Adjusted diluted earnings per share from continuing operations were $0.43 down 27.1% from $0.59 in the prior year. Now turning to cash flow and balance sheet items. Cash flows used in operating activities, which includes discontinued operations, totaled 279 million for the first quarter compared to 142 million in the prior year, primarily reflecting lower net earnings from continuing operations. After accounting for capital expenditures totaling 30 million, the Company consumed approximately $310 million of free cash flow. We ended the quarter with net debt of $4.868 billion and a leverage ratio of 3.3 times net debt to trailing twelve months pro forma adjusted EBITDA as previously announced, we are pursuing a sale of HAA and the net proceeds from the potential divestment will be used to pay down a portion of the company’s outstanding debt and further accelerate our objective to return to a leverage framework of 1.5 to 2.5 times net debt to pro forma adjusted EBITDA. Turning to the outlook for 2026 with respect to our continuing operations, we are maintaining our guidance as revenue of 6 billion to 6.2 billion full year adjusted operating margin of approximately 20%, CAPEX to come in at approximately 3% of net sales, adjusted diluted Earnings Per Share (EPS) in the range of $4.2 to $4.4, an increase of 20 to 25% year over year and free cash flow to be above 850 million. Furthermore, the assumptions underpinning our outlook are essentially the same as we previously communicated and are detailed in our press release issued earlier today. Finally, we have also provided guidance for our second quarter, we expect net sales from continuing operations to be approximately 1.6 billion. This continues to reflect proactive temporary reduction of inventory levels across customer channels which is reducing sell in as we complete the consolidation of manufacturing facilities to accelerate synergy capture. Furthermore, a timing shift in shipments from the second quarter into the second half of 2026 is also reflected and is due to the non recurrence of some pre buying in the second quarter of 2025 ahead of pricing actions. Our adjusted operating margin is expected to be around 19.7% reflecting the higher SGA levels which includes higher amortization of intangible assets and depreciation of property, plant and equipment resulting from the fair value purchase accounting impacts of the Hanes Brands acquisition in addition to a timing differential between some integration related costs incurred and the flow through of their benefit in subsequent quarters. Finally, the company’s adjusted effective income tax rate in the second quarter is expected to be slightly lower than the expected full year 2026 adjusted effective income tax rate. In summary, we are pleased with the quarter and our integration progress. The broader operating environment remains uncertain and we feel cautiously optimistic about the remainder of 2026 while being mindful of the Middle east conflict and the heightened concerns on the end consumer. Nonetheless, we are focused on what we can control. We believe that our low cost, vertically integrated business model and the agility it provides, together with strong industry positioning provide a solid foundation for us to navigate evolving external conditions and support continued financial performance. Thank you. And now I’ll turn it over to Jesse.

Jesse Haim (Moderator)

Thank you Luca. This concludes our prepared remarks and now we’ll begin taking your questions. Before moving to the Q and A session, I’d like to remind you to limit your questions to two and we’ll circle back for a second round if time permits. Angela, please begin the Q and A session.

Angela

Thank you. We will now begin the question and answer session. If you have dialed in and would like to ask a question, please press Star one on your telephone keypad to raise your hand and join the queue. If you would like to withdraw your question, simply press Star one again. Thank you. Your first question comes from the line of JSOL with ubs. Your line is now open.

Jay

Great. Thank you so much. Two questions for me, Glenn. I’d love if you could give us a little review of the point of sale both for the Guild and Printwear business, but also for the Hanes business that you saw in the quarter that you’re kind of seeing second quarter to date. And then also maybe if you can take A step back and tell us how the strategy that you’re developing for the Hanes business is evolving, how you’re thinking about investing in marketing, investing in product. If you can give us an update on that, that would be terrific as well. Thank you.

Chuck Ward (Executive Vice President, Chief Commercial Officer)

Okay, well, let Chuck go with the. Discuss the market conditions and I’ll answer the other side. Okay, thank you. Good morning, Jay. As we look at net sales for the quarter, as Lucas said, we were in line with guidance. Both markets were a little bit softer than we expected with some impacts in the US obviously with some tough weather during Q1 that everybody experienced. But overall, as Glenn mentioned, we performed well and we outperformed both markets. We continue to gain share in both markets. And as he mentioned in his comments, we typically perform well in challenging markets. But if I break it down, we really. Jay, look at it wholesale retail, as Jessie mentioned in her opening remarks. So I’ll really address it from a wholesale retail perspective. As we look at the wholesale market, the market was down low single digits while we performed up low single digits. So again, continuing to take share in the market. If you really dive into that market, Jay, it’s continuing strong performance with our premium products. Luca mentioned comfort colors, for example, and the strength that we’re seeing continue in that brand, our growth in …

Full story available on Benzinga.com

This post was originally published here

DT Midstream (NYSE:DTM) reported first-quarter financial results on Thursday. The transcript from the company’s first-quarter earnings call has been provided below.

This transcript is brought to you by Benzinga APIs. For real-time access to our entire catalog, please visit https://www.benzinga.com/apis/ for a consultation.

View the webcast at https://events.q4inc.com/attendee/436325929

Summary

DT Midstream reported a strong start to 2026, driven by high demand and cold weather, reinforcing their full-year plan.

The company announced investments in two new pipeline projects: Vector Pipeline expansion and Millennium R2R, supported by long-term contracts.

DT Midstream is engaged in active commercial discussions for potential pipeline expansions in response to strong market demand.

Q1 2026 adjusted EBITDA was $308 million, a $15 million increase from the previous quarter, with growth capital investment at $72 million.

The company reaffirmed its 2026 adjusted EBITDA guidance and highlighted strategic expansions to meet growing energy demands.

DT Midstream emphasized the importance of US LNG as a stable energy supply source amidst geopolitical developments.

The company maintained its quarterly dividend of $0.88 per share, aligning with adjusted EBITDA growth.

Full Transcript

OPERATOR

Welcome to the DT Midstream First Quarter 2023 Earnings Call. My name is Rebecca and I will be your conference operator today. All lines have been placed on mute to prevent any background noise. After the Speaker’s remarks, there will be a question and answer session. If you would like to ask a question during this time, simply press STAR followed by the number one on your telephone keypad. If you would like to withdraw your question, press Star one again. I will now turn it over to our Speaker, Todd Lormar, Director of Investor Relations. Please go ahead

Todd Lormar

Good morning and welcome everyone. Before we get started, I would like to remind you to read the safe harbor statement on page two of the presentation including the reference to forward looking statements. Our presentation also includes references to non GAAP financial measures. Please refer to the reconciliations to GAAP contained in the appendix. Joining me this morning are David Slater, Executive Chairman and CEO Chris Zona, President and COO and Jeff Jewell, Executive Vice President and CFO. So with that I’ll go ahead and turn the call over to David.

David Slater (Executive Chairman and CEO)

Thanks Todd and good morning everyone and thank you for joining. During today’s call I’ll touch on our financial results and provide an update on the latest commercial activity and our growth projects. I’ll then close with some commentary on the current market fundamentals before turning it over to Jeff to review our financial performance and outlook. So turning to our financial results, we’re off to a strong start in 2026 fueled by a strong demand and cold winter giving us confidence in our full year plan. We continue to advance organic opportunities from our 3.4 billion project backlog in a very strong market environment that supports our future growth. We are announcing today that DTM has approved investment in two new projects in our pipeline segment. The first is a mainline expansion of Vector Pipeline which increases the total capacity of vector by approximately 400 million cubic feet per day and is anchored by investment grade utility customers under 20 year negotiated rate contracts with a Q4 2028 expected in service. The next project DHAM has approved investment in is Millennium R2R which is supported by long term contracts with two utilities and an existing power plant for 70 million cubic feet per day of capacity and is expected to be fully in service in Q1 2027. These investments are supported by strong market fundamentals backed by utility and power generation customers and will serve the growing demand in the upper Midwest and New York and New England markets. In addition, we have entered into an agreement to build a pipeline lateral to serve a new utility scale power development located just off Midwestern Pipeline in Indiana where the developer plans to construct a 900 megawatt power plant which we expect to serve under a 20 year demand based contract for approximately 265 million cubic feet per day of capacity. This project is subject to our customer reaching FID in the power plant which we expect to occur in 2026. Our expected lateral pipeline and service date is in the first half of 2028. Also on Midwestern, we recently recontracted approximately 30% of the system’s capacity with term extensions ranging from 5 to 25 years, reflecting the importance of this critical capacity and how the market values it. Finally, we commercialized a new interconnect on Nexus this quarter which will have a capacity of 250 million cubic feet per day and will provide supply for a behind the meter natural gas fired power generation facility to power a new data center in Ohio. Adding this load to the mainline of Nexus strengthens the asset over the long term. We are also seeing strong market interest for additional pipeline projects in the Midwest and Northeast and are advancing these potential opportunities towards commercialization. Midwestern Pipeline closed a successful non binding open season at the beginning of April for both northbound and southbound expansions to increase capacity by up to 1.5 billion cubic feet per day and I’m pleased to report that the open season was oversubscribed. Vector Pipeline also recently closed a non binding open season for the 2030 expansion project to to increase westbound capacity into Chicago by 300 to 500 million cubic feet per day which received very strong customer interest and was also oversubscribed. Our next steps with these two projects are to optimize the pipeline and facility design based on the customer requests and then to work with our customers to reach binding commitments. We will keep you updated as we continue to progress these opportunities. Turning to our construction activity, our Midwestern gas transmission power plant lateral to serve AES Indiana’s gas fired power plant was placed in service on time and under budget with commercial operations expected to begin in Q2 this year. All of our other in flight growth investments remain on track and on budget. Finally, I’d like to take a moment to address the recent market movements and the global geopolitical situation. The first quarter of 2026 was a volatile period for the market with significant cold weather in January driving extreme prices across the country, highlighting capacity constraints in the North American market driven by demand growth, followed by geopolitical developments in the Middle east that are contributing to the broader energy market instability. These events have renewed both domestic and global focus on reliability and security of supply. Internationally, the discussion has largely centered on oil, yet curtailed and constrained LNG volumes from the Middle east region have underscored the value of US LNG as a stable and dependable supply source. We believe this dynamic will favor increased LNG exports from the US Gulf coast and create additional expansion opportunities for US based supply which our Haynesville system is very well positioned to serve. With its high degree of both receipt and delivery connectivity. Our LEAP pipeline is currently running full at its design capacity of 2.1 billion cubic feet per day and has the ability to expand to 4 billion cubic feet per day. Turning to the domestic front, we are seeing growing energy reliability and affordability concerns across many regions. With much of the pipeline infrastructure operating at maximum capacity, many regions cannot access low cost supplies of natural gas produced domestically in our prolific production basins, which highlights the need for incremental natural gas pipeline and storage investments to unlock these low cost supplies. In the Midwest and Northeast, power demand fundamentals continue to strengthen. Driven by data centers and other large load customers, utilities in these regions are converting potential opportunities into signed load more quickly than previously expected, with multiple gigawatts of contracted demand now backed by binding agreements and capital plans that materially increase peak load projected through the end of the decade. With large load tariff frameworks in place to protect affordability, this level of growth is evolving rapidly. As construction is underway, energy is flowing to some projects such as Phase one of Microsoft’s Mount Pleasant Data center in Wisconsin, reinforcing our growth outlook for increased gas fired generation and natural gas demand. Our interstate gas pipeline footprint is strategically located in this region to serve this growth and the strong response to the recent open seasons on Midwestern and Vector pipelines support these fundamentals. I’ll now pass it over to Jeff to walk you through our quarterly financials and outlook.

Jeff Jewell (Executive Vice President and CFO)

Thanks David and good morning everyone. In the first quarter we delivered adjusted EBITDA of 308 million, representing a 15 million increase from the prior quarter. Our pipeline segment results were 14 million higher than the prior quarter, driven by seasonally higher EBITDA from our joint venture and Interstate pipelines and higher revenue on Stonewall and Leap. Gathering segment results were 1 million greater than the prior quarter, reflecting higher volumes on Blue Union and Appalachia gathering. Growth capital Investment for the first quarter was 72 million, which is in line with our plan and we expect a ramp in growth capital weighted towards the second half of this year. Operationally, total gathering volumes increased in both regions from the fourth quarter. Haynesville volumes averaged 2.09 bcf per day, driven by new volumes and recovery from upstream maintenance completed in the fourth quarter. In the Northeast, volumes averaged 1.42 bcf per day, driven primarily by the Stonewall Mountain Valley pipeline expansion that was placed into service at the beginning of February. As we look at the balance of the year, we expect the second quarter to be in line with our full year guidance, but to be lower than the strong first quarter driven by seasonality across our interstate pipelines, including JVs, a rate step down on Guardian Pipeline and typical seasonal planned maintenance. We remain confident in our full year outlook and reaffirm our 2026 adjusted EBITDA guidance range and our 2027 adjusted EBITDA early outlook. As David mentioned, DTM has approved investment in the Vector 2028 pipeline expansion and we expect total DTM investment of 80 to 100 million for the project. DTM has also approved investment in a millennium R2R project which will be completed under our existing regulatory authorization. We’ve increased our committed capital in 2026 and 2027 to reflect these new investments. 2026 is approximately 400 million and 2027 is approximately 440 million. Finally today we also announced that our Board of Directors approved our first quarter dividend of $0.88 per share, unchanged from the prior quarter and we remain committed to grow the dividend in line with adjusted ebitda. I’ll now pass it back over to David for closing remarks.

David Slater (Executive Chairman and CEO)

Thanks, Jeff. So in summary, we remain confident in delivering on our guidance, continuing our track record of strong performance we’ve maintained since we spun the company in 2021. Our high quality pure play natural gas pipeline asset portfolio is very well positioned to take advantage of growth opportunities across our network as we execute on our large organic project backlog. The fundamentals supporting natural gas infrastructure remains stronger than ever with a broader realization of the key role US LNG will need to play as a reliable and stable global energy supply and accelerating power generation needs in the Midwest and Northeast, including data center driven load. And with that we can now open up the line for questions.

OPERATOR

At this time I would like to remind everyone in order to ask a question, press star, then the number one on your telephone keypad. We’ll pause for a moment to compile the Q and A roster. Your first question comes from the line of Michael Bloom with Wells Fargo. Your line is open.

Michael Bloom (Equity Analyst)

Thanks. Good morning everyone. Wanted to start with the MIST project. Wonder if you can just give us a little more detail in terms of where you see progress to fid Anything you can say in terms of the size of the project, how it’s scoping in terms of capital. And then would you expect this project to be expanded in phases or you think it’s going to be one big expansion?

David Slater (Executive Chairman and CEO)

Morning, Michael. Great question. I’d say let me start at the highest level and then I’m going to pass it over to Chris for a few of the details. Really strong market interest in that open season. You know, we were offering both northerly pathways and southerly pathways. I think as we’ve talked in the past, Midwestern follows a corridor of power generation between Chicago and Nashville. So there’s tremendous power generation assets and infrastructure in that corridor. You know, we can talk about what we announced today on the power generation side on Midwestern. I, you know, I think the big takeaway is that we’ve attached, you know, 565 million a day of power generation load to Midwestern in the last 12 months, which is material. So really strong market interest. Very consistent with our thesis, our fundamentals thesis that we’ve been sharing with the investors. And maybe I’ll pass it over to Chris Zona to talk a little more detail around what I’ll call the nuts and bolts of the project.

Chris Zona (President and COO)

Yeah, sure. Thanks, David. Yeah, and so it’s early. I’ll start with that, Michael. You know, right now, you know, we are in the process of, okay, we, we’ve got the fantastic response here to the open season again, you know, electric and gas utilities, data center development, generation, power generation, all the above. And recall really this NIST expansion is really trying to put a box around, you know, the needs in the, in the early cycle here, the 2930 time frame and how do we help kind of quantify what that really looks like for those customers and then, you know, go through the detail engineering, get through the kind of solution and then progressing those conversations to FID or you know, binding PAs that can lead to FID. And that’s the process that will be in here in the next few months here with the shippers. We’ve already started those conversations and we’ve already had our customership for meeting started this week. And I expect you over the next few months we’re going to be going through that in more detail. But again, as David mentioned, really exciting demand on both the northbound path and the southbound path.

Michael Bloom (Equity Analyst)

Great, thank you for all that. Appreciate it. Then, you know, interesting comment on this. Interconnect on Nexus to server behind the meter project. You know, there’s, we’re starting to see some pushback from, you know, to data center Development from, you know, both politicians and some local communities. So curious. Just get your latest thoughts in terms of how you think the behind the meter opportunity set is shaping up. I know that was something you talked about a long time ago and it sort of went quiet a bit, but maybe, maybe it’s picking back up.

David Slater (Executive Chairman and CEO)

Yeah, I think our, our view on the, what I’ll call the aggregate power demand, low growth. Generally speaking, the utilities are winning more than the independent developers. I’ll just start there. We’re seeing that across the footprint. Ohio, this particular project in Ohio is well into construction and will go commercial very shortly. And that’s just an example …

Full story available on Benzinga.com

This post was originally published here

DTE Energy (NYSE:DTE) held its first-quarter earnings conference call on Thursday. Below is the complete transcript from the call.

This content is powered by Benzinga APIs. For comprehensive financial data and transcripts, visit https://www.benzinga.com/apis/.

View the webcast at https://events.q4inc.com/attendee/727416035

Summary

DTE Energy reported a strong start to 2026 with operating earnings of $407 million, translating to $1.95 per share, positioning the company to achieve the high end of its operating EPS guidance.

The company is executing significant data center projects with Oracle and Google, which are expected to drive substantial affordability benefits for existing customers and require about $5 billion in incremental investments.

DTE Energy is focused on grid modernization and reliability improvements, with strategic infrastructure investments showing a 90% improvement in outage duration from 2023 to 2025.

The company maintains a 6-8% long-term operating EPS growth target through 2030, supported by data center opportunities, with potential to exceed this range as more projects are solidified.

DTE Energy plans to issue $500 to $600 million in equity annually through 2028 to support its capital investment plan while maintaining a strong investment-grade credit rating.

Full Transcript

Liz (Operator)

Thank you for standing by. My name is Liz and I’ll be your conference operator today. At this time I would like to welcome everyone to the DTE Energy first quarter 2026 earnings conference call. All lines have been placed on mute to prevent any background noise. After the speaker’s remarks, there will be a question and answer session. If you would like to ask a question during this time, simply press STAR followed by the number one on your telephone keypad. If you would like to withdraw your question, press Star one again. Thank you. I would now like to turn the call over to Matt Kierpinski, Director of Investor Relations. Please go ahead.

Matt Kierpinski (Director of Investor Relations)

Thank you and good morning everyone. Before we get started, I’d like to remind you to read the Safe harbor statement on page two of the presentation, including the reference to forward looking statements. Our presentation also includes references to operating earnings, which is a non GAAP financial measure. Please refer to the reconciliation of GAAP earnings to operating earnings provided in the appendix. With us this morning are Joy Harris, President and CEO and Dave Rude, cfo. And now I’ll turn it over to Joy to start our call this morning.

Joy Harris (President and CEO)

Thanks, Matt. Good morning everyone and thank you for joining us. I’m happy to be with you today. I’ll start by saying 2026 is off to a strong start and that momentum gives us confidence in delivering an exceptional year for all of our stakeholders. As we have said before, our success begins with our team. We have a highly engaged organization that’s executing extremely well. Our team is focused on doing what’s right for our customers and communities and that strong employee engagement really shows up in our performance. A great example is our team’s response to a couple of large storms we experienced in the first quarter. During a January weather event, the team restored 100% of impacted customers within 48 hours. And during the March storm, a more significant event, we restored service to over 99% of the customers within 48 hours. This kind of performance reflects the commitment, preparation and pride our employees take in their work. I’m incredibly proud of how our team continues to show up for our customers when it matters most. We continue to execute our customer focused capital plan that strengthens the grid and improves reliability. These investments are essential to enhance the grid, to support our customers, and they’re being made with a clear focus on customer affordability. That focus is reflected in our recent rate case filing where we are targeting investments that drive the highest impact while carefully balancing customer affordability. Turning to data centers, we continue to see great progress. The 1.4 gigawatt Oracle Data center included in our plan is approved and construction is underway. We’ve also executed an agreement with Google to serve a 1 GW data center. This project represents incremental upside to our current long term plan and the contract has been submitted to the NPSC for approval. Beyond Oracle and Google, we continue to have constructive discussions with other potential customers. As those conversations progress, they represent additional upside to our capital plan over time. It’s also important to highlight that this data center growth provides real affordability benefits to our existing customers. These large loads help spread fixed system costs over a broader base and because these data centers use so much power, they absorb a significant portion of these costs which will provide meaningful benefits to existing customers as these loads ramp. As I’ve said, we are off to a great start in 2026 and well positioned to achieve the high end of our operating EPS guidance. We are confident in our long term operating EPS growth rate target of 68% through 2030 and we remain confident in our ability to reach the high end of our guidance range in each year driven by R and D tax credits and the flexibility they provide. The Google Data center project and other data center opportunities provide upside to this plan. Let me move to slide five to highlight our improvements in reliability we delivered meaningful reliability improvements in 2025 driven by a combination of strategic infrastructure investments, targeted process improvements and more favorable weather conditions. From 2023 to 2025, we achieved a 90% improvement in outage duration, reflecting both stronger system performance and faster restoration. We recorded our best all weather SADI performance in nearly 20 years, underscoring the impact of our sustained focus on reliability and and placing us in the top quartile of utilities nationwide. Last year we restored 99.9% of impacted customers within 48 hours, demonstrating continued improvement in storm response and operational execution. That momentum has carried into 2026 as we continue to successfully execute our reliability strategy. Earlier, I mentioned the strong storm response our team delivered during the first quarter. That performance was on full display during the March storm when we experienced wind gusts of more than 70 miles per hour for a sustained period. About 300,000 customers were impacted and thanks to dedication and hard work of our crews, nearly all customers had power restored within 48 hours. When we look back at a similar storm several years ago, the progress is clear. That earlier event, which was a little less severe, impacted more than 750,000 customers and restoration took significantly longer. The improvements we’re seeing today reflect years of targeted investment, improved processes and the commitment of our employees. This work continues to make a meaningful difference for our customers through less frequent outages, faster restoration and improved reliability, and demonstrates that when we invest in IT works. We are continuing our efforts to modernize our electric distribution system, including the installation of smart grid devices to improve outage detection and restoration times. We are also maintaining a disciplined focus on pull top maintenance, executing a robust tree trim program and advancing the ongoing rebuild of the 4.8 KV system, all of which are critical to long term reliability and those initiatives are already translating into measurable results. We remain on track to achieve our long term goals of reducing the number of power outages by 30% and cutting outage duration in half by 2029, reflecting our commitment to sustained improvement. Let me move to slide 6 to provide an update on data center developments. We continue to make steady progress executing and finalizing contractual agreements needed to support data center growth. The Oracle contracts are approved and construction is underway with load ramping over the next several years. The growth is supported by existing capacity and planned energy storage and the contracts are structured to ensure Oracle will cover the full cost of energy and capacity they need while also providing significant affordability benefits to our existing customers. Our project with Google also continues to advance. The contracts have been filed with the NPSC for approval and we expect their load to fully ramp by the end of 2028. The load ramp is supported by a balanced mix of resources including renewable generation, energy storage, demand, demand response and additional longer term generation that will be identified through the IRP process. As a result, meeting Google’s capacity needs could drive roughly $5 billion of incremental generation and storage investment through 2032. Importantly, these investments are supported by contracts that protect existing customers. We have a 20 year power supply agreement with minimum monthly charges combined with a separate clean capacity acceleration agreement that covers renewable and storage investments. Termination provisions combined with credit and collateral requirements are designed to protect existing customers and support affordability. This means that Google will cover the full cost of the energy and capacity they need while also providing affordability benefits to our other customers. Beyond these two projects, we remain highly engaged with additional data center opportunities. We’re in advanced discussions that could represent roughly 2 gigawatts of incremental load with additional projects in our pipeline that could add another three to four gigawatts over time. Importantly, we also expect additional demand as these customers continue to expand once the are on the system. Collectively, these opportunities would require investment in new baseload generation, renewables and related storage with the exact resource mix and timing to be refined through the IRP process. Overall, we see our strong pipeline continue to advance with disciplined execution that delivers growth while remaining focused on reliability and affordability. Let me move to slide 7 to describe the benefits these data centers provide and discuss our continued commitment to customer affordability. These data center projects bring on large, steady load that help spread fixed system costs and create meaningful affordability benefits for our existing customers. Once fully ramped, Oracle is expected to drive about $300 million of annual benefits to our existing customers, while the Google Data center is expected to generate roughly $1.7 billion of benefits over the life of the contract. These savings strengthen our affordability story, complementing the strong continuous improvement culture that we have developed over the years. Continuous improvement is part of how we operate every day and it underpins our ability to consistently deliver strong reliability while managing customer affordability. We’ve executed our investment plan with discipline while remaining highly focused on affordability for our customers. As the chart illustrates, our average annual bill increases over the past four years have been well below the national average and the Great Lakes region. One of our biggest sources of customer value is how we’re using new technologies. Advanced analytics are driving efficiencies, lowering cost and improving maintenance and storm response. Delivering customer focused efficiencies through technology remains a top priority for our team. Our transition from coal to natural gas and renewables is also reducing O and M costs, and the tax credits available under the Inflation Reduction act help to make our clean energy investments more affordable for customers. Today, the typical residential electric bill represents less than 2% of the median household income and our residential bills are 18% below the national average. We also continue to expand energy assistance for our most vulnerable customers, delivering millions of dollars in energy assistance and donating significantly to support nonprofits across Michigan. Overall, we are well positioned to sustain our historical success in managing customer affordability while continuing to invest in the grid and support long term growth. Let’s turn to the next slide and walk through our regulatory strategy and the benefits we are delivering to our customers. Our Electric rate case filing is an important step in supporting customer focused investment in system reliability and grid modernization while continuing to manage affordability. This rate case filing is predominantly driven by our Distribution Infrastructure Investment Plan, which is squarely focused on improving reliability and consistent with the recommendations from the Electric Distribution audit completed in 2024, this plan is focused on achieving our goal of reducing the frequency of power outages by 30% and cutting out its duration in half by 2029. As part of this filing, we’re requesting nearly $800 million of distribution investments to be incorporated into the IRM by 2030. This would support consistent, predictable infrastructure investments for our customers and could help delay future rate case filings. Our data center agreements are thoughtfully structured to enhance affordability and protect our customers. As I have already highlighted these, these contracts deliver significant affordability benefits with strong safeguards in place. As the load from these projects ramp, it creates the potential to extend the timing of our next DTE Electric rate case filing, delivering the benefits for our existing customers from these growth opportunities. While we continue to invest in improving reliability, we have proposed a regulatory mechanism in this current case to capture any excess margin from the Oracle Load Ramp above what we have included in our filing. If the Oracle load Ramp comes online by the end of 2027 and we receive other required regulatory approvals, we will refrain from filing another rate request until at least 2028. Looking longer term Our IRP will provide clear visibility into how we will serve growing demand, including the significant data center load. The IRP will lay out our approach to meeting long term generation and capacity needs with the filing expected in the third quarter of 2026. This is a transparent process that allows us to identify the most effective and affordable way to serve customers over time. Taken together, these efforts reflect a coordinated design, disciplined approach to growth, combining thoughtful regulatory filings, well structured large load agreements and long term resource planning to support reliability, affordability and visibility for our customers. So to wrap up, we’re off to a strong start in 2026. We’re executing our plan, making critical infrastructure investments, staying focused on affordability for our customers, delivering reliable, high quality service to communities we serve, and driving continued strong financial performance for our investors. With that, I’ll hand it over to Dave. Dave, over to you.

Dave Rude (Chief Financial Officer)

Thanks Joy and good morning everyone. As Joy mentioned, 2026 is off to a really strong start and we remain well positioned to achieve the high end of our operating EPS guidance this year. Let me start on Slide 9 to review our first quarter financial results. Operating earnings for the quarter were $407 million. This translates into $1.95 per share. You can find a detailed breakdown of EPS by segment, including a reconciliation to GAAP reported earnings in the Appendix. I’ll start the review at the top of the page with our Utilities DTE Electric earnings were $218 million. For the quarter, earnings were $71 million higher than the first quarter of 2025. The main drivers of the variance were timing of taxes, rate implementation and colder weather, partially offset by higher rate base and OM costs on the timing of taxes. If you remember we called out a variance of negative $67 million in the first quarter of last year due to the timing of renewal projects being placed in service, which was a key driver of the variance for the quarter. Moving on to DT Gas, operating earnings were $210 million, $4 million higher than the first quarter of 2025. The earnings variance was driven by colder weather and IRM revenue, partially offset by higher rate base costs. Let’s move to DT vantage on the third row. Operating earnings were $48 million for the first quarter of 2026. This is a $9 million increase from 2025 driven by higher custom Energy solutions and steel related earnings, partially offset by lower renewable earnings. On the next row you can see Energy Training earnings were $59 million lower than the first quarter of 2025. This was primarily driven by expected timing in the first quarter in the Power portfolio. We are highly confident in achieving the high end of the full year guidance range in energy trading as this timing reverses through contracted and hedge positions over the remainder of the year. Finally, Corporate and other was unfavorable by $54 million primarily due to the timing of taxes of $43 million and higher interest expense. Overall, DTE earned $1.95 per share in the first quarter of 2026, which positions U.S. well to achieve the high end …

Full story available on Benzinga.com

This post was originally published here

SanDisk Corporation (NASDAQ:SNDK) shares are surging Thursday. Investors are positioning themselves ahead of the company’s fiscal third-quarter earnings report. The announcement is scheduled for after the closing bell on Thursday.

Analyst Notes Strengthening NAND Market

Wedbush analyst Matt Bryson highlighted a bullish outlook for the memory sector in a Wednesday note. Bryson set a price target of $1,200 for SNDK. He noted the company is “successful in lifting pricing at a faster rate than the broader industry.”

Pricing Beats Initial Guidance

Earlier guidance suggested a 55% pricing increase for the quarter. However, analysts now forecast a 65% uplift. Bryson noted that …

Full story available on Benzinga.com

This post was originally published here

On Thursday, Darling Ingredients (NYSE:DAR) discussed first-quarter financial results during its earnings call. The full transcript is provided below.

This content is powered by Benzinga APIs. For comprehensive financial data and transcripts, visit https://www.benzinga.com/apis/.

The full earnings call is available at https://events.q4inc.com/attendee/712936517

Summary

Darling Ingredients reported a strong first quarter 2026 with a combined adjusted EBITDA of $406.8 million, significantly up from $196 million in the same quarter of 2025.

The company highlighted improved operational excellence and margin expansion, particularly in its core ingredients and feed segments, with a focus on cost reduction and commercial agility.

Future outlook is positive with expectations of continued earnings growth, stronger cash flow, and debt reduction, supported by favorable regulatory changes and increased renewable diesel demand.

Operational highlights include strong performance in the Global Ingredients and Diamond Green Diesel segments, with the latter seeing improved margins due to increased renewable volume obligations.

Management emphasized the strategic focus on capital allocation, operational efficiency, and market agility, expecting tailwinds from higher fat prices and improved regulatory frameworks to benefit performance in 2026.

Full Transcript

OPERATOR

Good morning and welcome to the Darling Ingredients Inc. Conference call to discuss the first quarter 2026 financial results. After the Speaker’s prepared remarks, there will be a question and answer period and instructions to ask a question will be given at that time. Today’s call is being recorded. I would now like to turn the call over to Ms. Sue Ann Guthrie, Senior Vice President of Investor Relations. Please go.

Sue Ann Guthrie (Senior Vice President of Investor Relations)

Thank you for joining the Darling Ingredients first quarter 2026 earnings call. Here with me today are Mr. Randall C. Stewey, Chairman and Chief Executive Officer and Mr. Bob Day, Chief Financial Officer. Our first quarter 2026 earnings news release and slide presentation are available on the Investor page of our corporate website and will be joined by a transcript of this call once it is available. During this call we will be making forward looking statements which are predictions, projections or other statements about future events. These statements are based on current expectations and assumptions that are subject to risks and uncertainties. Actual results could materially differ because of factors discussed in today’s press release and the comments made during this conference call and in the Risk Factors section of our Form 10K, 10Q and other reported filings with the securities and Exchange Commission. We do not undertake any duty to update any forward looking statement. Now I will hand the call over to Randy.

Randall C. Stewey (Chairman and Chief Executive Officer)

Thanks Sue Ann. Good morning everyone and thanks for joining us. Over the last few years, public policy, uncertainty and deflationary and volatile commodity markets created a challenging operating environment. During that time, Darling Ingredients remained laser focused on controlling what we could control. We prioritized operational excellence and maintained strict disciplined capital allocation with a goal to achieve a meaningful debt reduction. Headwinds have now shifted and the results we share today confirm a much more favorable operating environment. We are moving forward with significantly improved earnings power, stronger cash flow potential and a more robust foundation for long term value creation. For the first quarter of 2026 we saw the operating environment allow for expected EBITDA growth and sequential gross margin improvement. Darling’s core ingredients business really delivered this quarter with improved global operations margin expansion and focused commercial execution. Combined adjusted EBITDA for first quarter was 406.8 million including 255.6 million from our Global Ingredients business and 151.2 million from Diamond Green Diesel. Our feed ingredients segment had a fantastic quarter. We saw steady volumes with a strong global poultry volumes offsetting stagnant North American cattle herd. Operational excellence remained a key focus this quarter driving improvements in throughput, cost reduction and product quality that translated into stronger gross margins. At the same time, our Commercial agility allowed us to pivot sales to higher priced markets while fat prices were softer earlier in the quarter. Our disciplined risk management approach combined with spot sales helped us mitigate the typical lag impacts we would see in that environment. The renewable volume obligation announced at the end of March has been extremely constructive for Darling and dgd. We are already seeing a favorable movement on fat prices as renewable diesel demand grows. DGD overcame a shutdown at Port Arthur that briefly interrupted our supply chain. As those dynamics continue to play out, we anticipate this to be a nice tailwind for our feed segment for the remainder of 2026. Turning to our food segment, we’re seeing nice growth in collagen, particularly in Europe and Asia. Sales in both collagen and gelatin improved year over year, reflecting not only increased customer demand, but new applications for collagen and food, nutrition and health products. Our Next Tita glucose control product is currently pending a patent in both in the US for production processes and the use of Next Tita as a dietary supplement ingredient offering a non pharmaceutical option targeting lower blood glucose. With an interest in food as medicine and increased demand for protein, collagen continues to be positioned well for growth. Now, as you can see in our results, our fuel segment is at an inflection point as renewables margins turned a corner. With finalization of the renewable volume Obligation, with a very constructive RVO and now a clear path forward, we expect DGD’s results to continue to strengthen throughout the year. Diamond Green Diesel delivered a strong quarter with 151.2 million of EBITDA or around $1.11 EBITDA per gallon. Our Non DGD green energy businesses continue to deliver stable earnings. We’ll have the opportunity for a slight tailwind due to increased energy prices in Europe. Now with that, I’d like to hand the call over to Bob to take us through some financials. Then I’ll come back and discuss my thoughts on the second quarter. Mom.

Bob Day (Chief Financial Officer)

Thank you, Randy. Good morning everyone. As Randy said, first quarter was very strong across all measures and the Darling platform is poised to move forward with significantly improved earnings. Power for the quarter, Combined adjusted EBITDA was 407 million versus 196 million in first quarter 2025 and 336 million last quarter. Core ingredients Non DGD improved both year over year and sequentially for first quarter 2026 core ingredients EBITDA was 256 million versus 190 million in first quarter 2025 and 278 million last quarter. Total net sales were 1.6 billion versus 1.4 billion. Raw material volume was 3.8 million metric tons, essentially unchanged. Meanwhile, gross margins for the quarter improved to 26.1% compared to 22.6% in the first quarter last year and from 25.1% last quarter. Looking at the feed segment for the quarter, EBITDA improved to 169 million from 111 million a year ago, while total sales were 985 million versus 896 million and raw material volume was flat at approximately 3.1 million metric tons. Gross margins relative to sales improved nicely to 25.3% in the first quarter versus 20.3% in the first quarter from last year and 24.6% in the fourth quarter of 2025. In the Food segment, total sales for the quarter were 405 million compared to 349 million in the first quarter of 2025. Gross margins for the Food segment were 28.9% of sales compared to 29.3% a year ago and raw material volumes were flat at around 330,000 metric tons compared to the same time last year. EBITDA for first quarter 2026 was 81 million versus 71 million in first quarter of 2025 in the fuel segment, starting with Diamond Green Diesel, Darling’s share of DGD EBITDA for The quarter was 151 million, which includes a favorable LCM inventory valuation adjustment of 97 million at the DGD entity level and sales of around 272 million gallons, an average EBITDA margin of 111 per gallon. Darling contributed approximately $190 million to DGD during the quarter, mainly to provide short term working capital, most or all of which is expected to be returned in subsequent quarters. In addition, during the quarter darling monetized 45 million in production tax credit sales, the proceeds of which will be paid in the coming quarters. Other fuel segment sales not including DGD were 160 million for the quarter versus 135 million in 2025 on strong energy and biogas prices in Europe and relatively flat volumes of around 370,000 metric tons combined. Adjusted EBITDA for the full fuel segment including DGD was roughly 180 million for the quarter versus 24 million in the first quarter of 2025. As of quarter end, total debt net of cash was approximately 4 billion versus 3.8 billion ending fourth quarter 2025. The increase in debt results from contributions to DGD mentioned earlier and timing of production tax credit payments, some of which will come in the second quarter. Capital expenditures totaled 95 million in the quarter. Our bank covenant preliminary leverage ratio was 3.17 times as of quarter end versus 2.9 times at year end 2025. In addition, we ended the quarter with approximately $1.1 billion available on our revolving credit facility. We recorded an income tax expense of $38.6 million for the quarter, yielding an effective tax rate of 22%. That rate, excluding the impact of the production tax credit and discrete items was 32% and we paid 20.5 million in income taxes in the first quarter. For 2026, we expect the effective tax rate to be around 25% and cash taxes of approximately 60 million for the remainder of the year. Overall net income was approximately 134 million for the quarter or $0.83 per diluted share, compared to a net loss of 26 million or negative $0.16 per diluted share for the first quarter of 2025. Last quarter we mentioned that we have some assets held for sale that are not considered strategic for our business. Those asset sales continue to move forward but have not yet closed. Of those, we have signed an agreement to sell the majority of our grease trap environmental service assets. The sale is pending some permitting transfers which we expect to be completed in the next few months. We’ll have more to say about the TRAP and other businesses for sale at a later date. With that, I will turn the call back over to Randy.

Randall C. Stewey (Chairman and Chief Executive Officer)

Thanks, Bob. In closing, the progress we shared with you today reflects the discipline and focus we have maintained through a challenging cycle. By controlling what we could control, driving operational excellence, prioritizing capital and focusing on balance sheet strength, we positioned darling ingredients to emerge stronger. With improved but volatile market conditions and a much improved regulatory framework, we believe the company is entering its next phase with momentum that we expect to build as the year progresses. We believe that as the year progresses, we’ll drive improved earnings, stronger cash flow, additional debt reduction and long term value creation for our shareholders. Ultimately, our improved performance will once again provide the company with many opportunities. This confidence is reflected in our core ingredients ebitda guidance for Q2, which we are now setting at 260 to 275 million for the quarter. With that, we’ll go ahead and open it up to Q and A.

OPERATOR

Thank you. We will now begin the Q and A session. If you would like to ask a question, please press STAR followed by one on your telephone keypad. If you would like to remove that question Press star followed by two again. To ask a question, press star one. As a reminder, if you are using a speakerphone, please remember to pick up your handset before asking a question. We will pause here briefly as questions are registered. Our first question comes from the line of Heather Jones with Heather Jones Research llc. Heather, your line is now open.

Heather Jones (Equity Analyst)

Good morning. Thank you for the question. I was just wondering on first of all, on Diamond Green, should we expect the hedging and LIFO losses? Do you expect that to reverse in Q2 or will that take longer throughout the year?

Bob Day (Chief Financial Officer)

Thanks, Heather. This is Bob. So we did realize a lower cost of market benefit in the first quarter. And you know, I think just to make sure everyone’s aware, in order to have the opportunity to realize the benefit and lower of cost of market, you have to have previously taken, taken a loss from that this quarter, that $97 million at the DGD entity level. That exhausts all available lower of cost or market. So going forward, as long as the business is profitable, we do not anticipate any lower of cost or market benefits. And so then to your question of LIFO, you know the LIFO will be based on an average cost paid for feedstock during the period. And as the average price increases, if it increases then then we would realize a LIFO loss that is embedded inside of the results. If feedstock prices on average decrease, then there would be a LIFO gain. So really the answer to your question depends on your view of feedstock prices as the average cost of feedstocks paid and the period in question relative to the period prior. What about on the hedging side? Yeah, yeah. So hedges, I guess what I can say about that is at DGD we do hedge, we’re very disciplined about hedging. There is some flexibility in terms of which instruments we use to hedge our risk and we don’t disclose that for competitive reasons. I think what you can point to this quarter is that clearly we had a significant increase during the period in heating oil futures and crude oil futures in soybean oil,, whatever instrument you’re looking at. And you know, we managed to absorb the cost of whatever hedges we had and still put out a very positive result. And you know, I think it just, it just speaks to the risk management capabilities of the business.

Heather Jones (Equity Analyst)

Okay. And then my follow up is just given the volatility we’re seeing in the energy markets and the feedstock markets, this question seems pretty particularly relevant. So was wondering if you could update us on how we should be thinking about the LAGS in your model, both like, both Core Darling and Diamond Green. I remember at one point it was more like 30 to 60 days, and then I think it increased to 60 to 90. But if you could just update us on how we should be thinking about that.

Randall C. Stewey (Chairman and Chief Executive Officer)

Yeah. Heather, this is Randy. So clearly you’ve kind of framed it pretty well. I mean, what we saw in Q1, remember as we came out of Q4, if, remember we had forward sales into DGD getting ready to run full, that were put on in October as we anticipated the rvo. And then we saw prices softening as the RVO kept getting kind of delayed and delayed. And so ultimately, as we came into Q1, cash prices fob, most of the North American factories were actually flat or lower than Q4. Those have now accelerated. They started to accelerate really here in March. For us, that’ll start to flow through very nicely in Q2. When we look at our global rendering business, what we’ve seen is that the tariffs have impacted Brazil pretty sharply. We’ve had to adjust all of our formulaic or our pricing models down there. What we procure raw material from, that takes 30 to 60 days. So I think we’ve righted that now. So overall, the ingredients business will have a stronger Q2. How much of the acceleration in prices flow through that would be reflected in our kind of our conservative approach to guidance there. Remember, as I was telling the team here, this is the first call we’ve done where we haven’t ever seen, period, one of the next quarter. And we won’t see those numbers here for another week or two, week and a half. And ultimately, so really, we’re looking at basically a March run rate and extrapolating that with some improvement. And so you’ll see that conversely, as DGD has done a very nice job of getting out in front of this. I mean, we’ve had a strong bias that feedstock prices would accelerate once the industry wakes up. And so, you know, that should flow through and much better margins in DGD as we go through Q2 and through the balance of the year.

OPERATOR

Thank you. Our next question comes from the line of Tom Palmer with JP Morgan. Tom, your line is now open.

Tom Palmer (Equity Analyst)

Sorry, was on mute. Good. Hi, it’s Tom. Morning, and thanks for the question. Maybe start out with an industry question, especially when we, I think, think about the biofuel side. There’s probably a good amount of idle capacity. I wonder what you think the US Biofuels industry is. Is capable of producing currently, and then once kind of it fully Ramps and whether that’s going to be enough to kind of fulfill …

Full story available on Benzinga.com

This post was originally published here

SoFi Technologies, Inc. (NASDAQ:SOFI) shares rose Thursday after the digital finance company posted stronger quarterly revenue and record lending activity.

On Wednesday, the company reported first-quarter adjusted earnings of 12 cents per share, matching estimates, while revenue reached $1.08 billion, topping the $1.05 billion Street view.

SoFi generated record loan originations of $12.2 billion during the quarter, driven by personal, student and home loans.

Members increased 35% from a year earlier to 14.7 million. Total products climbed 39% to 22.2 million.

CEO Anthony Noto said SoFi delivered its 18th straight Rule of 40 quarter. He cited 41% revenue growth and 31% adjusted EBITDA margins.

Business Expansion

SoFi highlighted investments in crypto, stablecoin settlement, business banking and its premium SoFi Plus membership.

The company said SoFiUSD could support faster payments across fiat and digital assets …

Full story available on Benzinga.com

This post was originally published here

World Acceptance (NASDAQ:WRLD) reported fourth-quarter financial results on Thursday. The transcript from the company’s fourth-quarter earnings call has been provided below.

This transcript is brought to you by Benzinga APIs. For real-time access to our entire catalog, please visit https://www.benzinga.com/apis/ for a consultation.

View the webcast at https://event.choruscall.com/mediaframe/webcast.html?webcastid=GzwQl9KE

Summary

World Acceptance reported an earnings per share of $7.70 for the fourth quarter of fiscal 2026, with a notable after-tax impact from a senior executive retirement.

Total revenue increased by 7.4%, driven by higher loans outstanding and yields, and a strong tax preparation season with a 13% increase in returns prepared.

Loan growth was 4.4%, coupled with reduced delinquency rates, which is expected to lead to higher revenues and lower charge-offs in future quarters.

The company reduced field personnel by 5% to address service gaps, aiming to lower personnel expenses in upcoming quarters.

Strategic initiatives include relying less on new customers to improve credit metrics and repurchasing $37.8 million in shares, totaling a 16.5% reduction in outstanding shares for the fiscal year.

Management is monitoring the impact of high gas prices on loan demand and credit, but has not observed significant effects yet.

The company plans to maintain mid-single-digit loan growth and has no leverage limitations, balancing this with share repurchases.

Full Transcript

OPERATOR

Good morning and welcome to World Acceptance Corporation’s fourth quarter 2026 earnings conference call. This call is being recorded at this time. All participants have been placed in a listen only mode. Before we begin, the Corporation has requested that I make the following announcement. The comments made during this conference call may contain forward looking statements within the meaning of Section 21E of the Securities Exchange Act of 1934 that represent the Corporation’s expectations and beliefs concerning future events. Such forward looking statements are about matters that are inherently subject to risks and uncertainties. Statements other than those of historical fact as well as those identified by the words anticipate, estimate, intend, plan, expect, believe, may, will and should or any variation of the foregoing and similar expressions are forward looking statements. Additional information regarding forward looking statements and any factors that could cause actual results or performance to differ from the expectations expressed or implied in such forward looking statements are included in the paragraph discussing forward looking statements in today’s earnings press release and in the Risk Factors section of the Corporation’s most recent Form 10-K for the fiscal year ended March 31, 2025 and subsequent reports filed with or furnished to the SEC from time to time. The Corporation does not undertake any obligation …

Full story available on Benzinga.com

This post was originally published here

First Interstate BancSys (NASDAQ:FIBK) reported first-quarter financial results on Thursday. The transcript from the company’s first-quarter earnings call has been provided below.

This transcript is brought to you by Benzinga APIs. For real-time access to our entire catalog, please visit https://www.benzinga.com/apis/ for a consultation.

Access the full call at https://events.q4inc.com/attendee/796780658

Summary

First Interstate BancSys reported net income of $60.2 million, or $0.61 per diluted share, for Q1 2026, a decrease from the prior quarter due to lower net interest income and non-interest income.

The company completed a major redesign of its banking organization, aiming to streamline operations and enhance customer experience, along with branch network optimization including closures and new openings.

Credit quality remained stable, with a modest increase in non-performing loans driven by a single credit issue; however, net charge-offs decreased significantly.

The company remains focused on disciplined growth, with an emphasis on relationship banking, digital channel investments, and leveraging AI for strategic initiatives.

Guidance anticipates sequential improvement in net interest margin and modest loan growth in the back half of the year, with continued share repurchases as a priority.

Full Transcript

Dennis (Conference Operator)

Hello and thank you for standing by. My name is Dennis and I will be your conference operator today. At this time I would like to welcome everyone to the First Interstate BancSys first first quarter 2026 earnings call. All lines have been placed on mute to prevent any background noise. After the speaker’s remarks, there will be a question and answer session. If you would like to ask a question during this time, simply press STAR followed by the number one on your telephone keypad. If you would like to withdraw your question, press STAR one again. I would now like to turn the call over to Nancy Vermeulen. Please go ahead.

Nancy Vermeulen

Thanks very much. Good morning and thank you for joining us for our first-quarter earnings conference call. As we begin, please note that the information provided during this call will contain forward looking statements and actual results or outcomes might differ materially from those expressed by those statements. I’d like to direct all listeners to read the cautionary note regarding forward looking statements contained in our most recent Annual report on Form 10-K filed with the SEC and in our earnings release, as well as the risk factors identified in the Annual report and our more recent periodic reports filed with the SEC. Relevant factors that could cause actual results to differ materially from any forward looking statements are included in the earnings release and in our SEC filings and the Company does not undertake to update any of the forward looking statements made today. A copy of our earnings release which contains non-GAAP financial measures is available on our website at fibk.com information regarding our use of the non-GAAP financial measures may be found in the body of the earnings release and a reconciliation to their most directly comparable GAAP financial measures is included at the end of the earnings release for your reference. Again this quarter, along with our earnings release, we’ve published an updated investor presentation that has additional disclosures that we believe will be helpful. The presentation can be accessed on our Investor Relations website and if you have not downloaded a copy yet, we encourage you to do so. Please also note that as we discuss our financials today, unless otherwise noted, all of the prior period comparisons will be with the fourth quarter of 2025. Joining us from management this morning are Jim Reuter, our Chief Executive Officer, David Delacamera, our Chief Financial Officer and other members of our management team. Now I’ll turn the call over to Jim Reuter.

Jim Reuter (Chief Executive Officer)

Jim thank you Nancy and thank you for joining us on our earnings call today. In the first quarter of 2026, we completed the redesign of our banking organization which was a major step forward in the ongoing strategic focus on full relationship banking. This, along with the expansion of our teams in key markets such as Colorado, is translating into an increase in production as we move into the second quarter. As a reminder, we initiated the redesign in the fourth quarter of last year with the intent of changing our banking organization from a layered structure to a flatter, more streamlined model resulting in a better client experience. We completed the transition in the first quarter successfully integrating top performers from within the company with exceptional external talent to create a more agile structure focused on delivering the full capabilities of the bank. We remain focused on disciplined earning asset growth, supporting earning asset repricing to drive the value inherent in our best in class deposit base. Over the course of 2025, we began reorienting our branch network to geographies that have high growth potential for us, which entailed divestitures of some of our lower density markets and planned branch openings in areas where we have opportunities to gain market share. We completed the previously announced consolidations of four branches in eastern Nebraska, the closures of the single branches in Minnesota and North Dakota, and the opening of an additional branch in Montana in the first quarter. On April 10 after quarter end, we completed the sale of 11 branches in rural Nebraska and later in the month completed a major upgrade of our branch location in Sheridan, Wyoming. We are currently consolidating two locations in Iowa and Oregon which will close early in the third quarter. We have made significant progress optimizing our branch network in the past 18 months and while we believe most of the large activity is behind us, branch optimization will always be an ongoing process to ensure we can serve our customers most effectively and efficiently. Our overall objective is disciplined growth, placing assets on the balance sheet that are accretive to our return profile as we work to unlock the underlying value in our balance sheet. As we focus our capital investment in 2025, we initiated a share repurchase authorization and have purchased about 6 million shares since announcing the program last August. We continue to see value and share buybacks and are in a position to return capital as well as grow organically. Turning to Credit in the first quarter of 2026, credit quality was generally stable with a modest decline in criticized loans. We experienced a modest increase in non performing loans that was driven by one individual credit net charge offs were 6 basis points of average loans. In addition to efforts to optimize our physical branch network mentioned earlier, we are also investing in digital channels to meet customers where they are, whether that be in a branch or online. We have made improvements to our online account opening experience and our Zelle peer-to-peer service. Both of these changes have produced positive results that are supporting our efforts to attract and retain customers. In addition, we are making investments in our management of data to ensure we are able to leverage new technologies and integrate the use of AI, which are key to many of our strategic initiatives. Finally, we brought a new marketing partner on board in the first quarter and this firm is now developing a creative campaign across consumer and business platforms. Given that the transformation at First Interstate is now visible in our footprint, our balance sheet, and our delivery of first class services and products, the timing is right to increase brand presence. You will begin to see that across our footprint over the summer months. And now I will hand the call over to David to discuss our results and our guidance in more detail.

David Delacamera (Chief Financial Officer)

David thanks Jim. I’ll start with our results for the quarter. The company reported net income of $60.2 million, or $0.61 per diluted share in the first quarter compared to $108.8 million, or $1.08 per diluted share in the fourth quarter. Net interest income decreased by $5.7 million compared to the prior quarter, or 2.8% to $200.7 million. This was driven primarily by fewer accrual days in the first quarter compared to the fourth quarter, a reduction in earning assets due mostly to seasonally lower deposits, and a reduction in the yield on earning assets due to fourth quarter rate movement. These impacts were partially offset by a reduction in the cost of interest bearing liabilities. Yield on average loans decreased 7 bps to 5.60% and total deposit costs declined 10 bps compared to the prior quarter. Total funding costs decreased 8 bps compared to the fourth quarter and results were broadly in line with our initial expectations. Shared on the prior earnings call. Our fully tax-equivalent net interest margin was 3.43% for the first quarter compared to 3.38% during the fourth quarter and to 3.22% during the first quarter of 2025. This is the eighth consecutive quarter in which we have seen margin expansion and we continue to anticipate sequential expansion over the near and medium term. Non interest income was $41.1 million, a decrease of $65.5 million from the prior quarter. The decline was driven by a gain on sale of $62.7 million associated with our divestiture from Arizona and Kansas and a $1.4 million gain from the sale of certain equity securities, both of which were recognized in the fourth quarter. The remainder of the decline was generally driven by seasonality in our fee businesses, including payment services. Non interest expense was $157.6 million for the first quarter of 2026, a decrease of $9.1 million from the prior quarter. Severance expense totaled $1.3 million during the quarter and was primarily related to the redesign of the banking organization and branch closures. As a reminder, fourth quarter results included $4.2 million in severance expense, $2.3 million in expenses related to the pending branch closures, and a $1.2 million reversal related to the FDIC special assessment. Accrual results this quarter benefited from medical expense favorability to expectations as well as an OREO valuation adjustment which benefited expenses by just over $1 million. We continue to exhibit discipline across expense categories while reinvesting in areas to support accretive organic growth, including the addition of relationship managers and increased advertising expense which is included in our forward expense guidance. Moving to the balance sheet, loans decreased by $473.2 million in the first quarter, which included $58.1 million of continued amortization of the indirect portfolio and a decline in agricultural loans as well as loan paydowns and payoffs. Total deposits decreased $205.3 million to $21.9 million as of March 31, 2026. Year over year, excluding the impact of the Arizona and Kansas sold deposits, deposits were little changed. Our deposit performance in the first quarter reflected what we view as normal seasonality and was modestly favorable to our initial expectations. We effectively captured beta on our interest bearing deposits with the cost declining 12 bps compared to the prior quarter. The ratio of loans held for investment to deposits was 67.3% at the end of the quarter compared to 68.8% at the end of the prior quarter and 76.4% at the end of the first quarter of the prior year. As a note, the previously disclosed sale of 11 branches in Western Nebraska that closed in April contained approximately $244 million in sold deposits. Turning to credit, net charge offs decreased by $19.7 million in the first quarter to $2.4 million or 6 bps of average loans. Total provision for credit losses was $6.7 million in the first quarter. Criticized loans decreased $18.6 million, or 1.8% from the prior quarter. Our total funded Provision increased to 1.33% of loans held for investment from 1.26% in the fourth quarter. The increase in coverage this quarter broadly …

Full story available on Benzinga.com

This post was originally published here

CNX Resources (NYSE:CNX) released first-quarter financial results and hosted an earnings call on Thursday. Read the complete transcript below.

This transcript is brought to you by Benzinga APIs. For real-time access to our entire catalog, please visit https://www.benzinga.com/apis/ for a consultation.

The full earnings call is available at https://event.choruscall.com/mediaframe/webcast.html?webcastid=Uxdr1R4G

Summary

CNX Resources is continuing its Utica development, with recent well performance aligning with expectations, but detailed production data will be available later in the year.

The company is maintaining a focus on the Marcellus due to existing infrastructure benefits, though a gradual increase in Utica development is anticipated.

CNX Resources remains on track with its new tech business initiatives, with no significant updates and awaiting final guidance on 45Z.

The company has made a positive refinancing move for its 2029 notes with new eight-year notes, maintaining a strategy of extending maturity profiles.

Management expressed optimism about increasing in-basin demand, with expectations of significant gas demand growth in the Appalachian region.

Full Transcript

OPERATOR

Good day and welcome to the CNX Resources First Quarter 2026 Question and Answer Conference Call. All participants will be in listen only mode. Should you need assistance, please signal a conference specialist by pressing the star key followed by zero. After today’s presentation, there will be an opportunity to ask questions. To ask a question, you may press star then one on your telephone keypad. To withdraw your question, please press star then two. Please note this event is being recorded. I would now like to hand the call to Tyler Lewis, Senior Vice President of Finance and Treasurer. Please go ahead.

Tyler Lewis (Senior Vice President of Finance and Treasurer)

Thank you and good morning, everybody. Welcome to CNX’s first quarter Q&A conference call. Today we will be answering questions related to our first quarter results. This morning we posted to our investor relations website an updated slide presentation and detailed first quarter earnings release data such as quarterly EP data, financial statements and non GAAP reconciliations which can be found in a document titled Q1 2026 Earnings Results and supplemental information of CNX Resources. Also, we posted to our investor relations website our prepared remarks for the quarter, which we hope everyone had a chance to read before the call, as the call today will be used exclusively for Q&A. With me today for Q&A are Alan Shepard, our President and Chief Executive Officer, Everett Good, our Chief Financial Officer, and Navneet Bell, our Chief Operating Officer. Please note that the company’s remarks made during this call, including answers to questions, include forward looking statements which are subject to various risks and uncertainties. These statements are not guarantees of future performance and our actual results may differ materially as a result of many factors. A discussion of risks and uncertainties related to those factors in CNX’s business is contained in its filings with the Securities and Exchange Commission and in the release issued today. With that, thank you for joining us this morning and operator, can you please open the call up for Q&A at this time?

OPERATOR

We will now begin the question and answer session. As a reminder to ask a question, you may press star then one on your telephone keypad. If you are using a speakerphone, you will need to pick up your handset before pressing the keys. To withdraw your question, please press Star then two. And our first question will come from Leo Mariani of Roth. Please go ahead.

Leo Mariani (Equity Analyst at Roth)

Yeah, hi, good morning. I was hoping to hear a little bit more about the Utica. I see you guys brought three wells on, you know, here in the first quarter. Any comments on kind of, well, performance or costs? I know you’ve been working hard to kind of continue to improve the play over time, so just wanted to see if there was kind of an update there.

Alan Shepard (President and Chief Executive Officer)

Hey Leo, you know. No, good question. We are continuing to develop the Utica program there. The most …

Full story available on Benzinga.com

This post was originally published here

On Thursday, Willis Towers Watson (NASDAQ:WTW) discussed first-quarter financial results during its earnings call. The full transcript is provided below.

Benzinga APIs provide real-time access to earnings call transcripts and financial data. Visit https://www.benzinga.com/apis/ to learn more.

The full earnings call is available at https://edge.media-server.com/mmc/p/yex8td2f/

Summary

Willis Towers Watson reported 3% organic growth in Q1 2026 with an adjusted operating margin of 22.3% and adjusted diluted earnings per share of $3.72.

Despite slower revenue growth due to geopolitical and economic challenges, the company saw 70 basis points of year-over-year margin expansion.

Strategic initiatives include AI-enabled solutions gaining traction with clients, including the integration of NewFront’s technology to enhance broking platforms.

The company remains confident in mid-single-digit growth and continued margin expansion for the full year, despite headwinds from geopolitical uncertainties, particularly in the Middle East.

Management highlighted the role of AI in driving efficiency, productivity, and new business opportunities, while maintaining the importance of human expertise in client relationships.

Full Transcript

OPERATOR

Good Morning. Welcome to the Willis Towers Watson Earnings Conference Call. Please refer to wtwco.com (note the website URL is correct) for the press release and supplemental information that were issued earlier today. Today’s call is being recorded and will be available for the next three months on Willis Towers Watson’s website. Some of the comments in today’s call may constitute forward looking statements within the meaning of the Private Securities Reform act of 1995. These forward looking statements are subject to risks and uncertainties. Actual results may differ materially from those discussed today and the Company undertakes no obligation to update these statements unless required by law. For a more detailed discussion of these and other risk factors, investors should review the Forward Looking Statements section of the Earnings Press Release issued this morning as well as in the Most recent form 10K and other subsequent Willis Towers Watson SEC filings. During the call, certain non GAAP financial measures may be discussed to provide direct comparability with prior periods. All commentary regarding the Company’s revenue growth results will be on a non GAAP organic basis unless specifically stated otherwise. For reconciliations of the non GAAP measures as well as other information regarding these measures, please refer to the most recent earnings release and other materials in the Investor Relations section of the Company’s website. I will now turn the call over to Carl Hess, Willis Towers Watson’s chief executive officer. Please go ahead. Good morning everyone. Thank you for joining us for Willis Towers Watson’s first quarter 2026 earnings call. Joining me today is Andrew Krasner, our Chief Financial Officer, and Spike Lipkin, our Chief AI Officer, will share his perspective and touch on our integration efforts following our acquisition of Newfront. Julie Gabauer, our President of Health, wealth and Career, and Lucy Clark, our President of Risk and Broking, are also joining us for our Q and A session. As a first order of business, I want to note my deep appreciation for our colleagues in the Middle east who have remained available to address client needs even as their lives have been disrupted by conflict. I also want to express our ongoing commitment to supporting our colleagues and clients as they manage this stressful environment. Now I’ll turn to our results. In the first quarter we delivered 3% organic growth with adjusted operating margin of 22.3% and $3.72 of adjusted diluted earnings per share revenue came in at the low end of our plan as we saw the effects of a more challenging and volatile global market environment during the quarter, particularly considering our meaningful presence in the Middle east region. Despite the slower than expected growth, our ongoing efforts to enhance efficiency helped us generate operating leverage and 70 basis points of year over year margin expansion. External conditions in the first quarter were mixed. We saw high health care inflation, regulatory changes and a higher volume of corporate transactions along with elevated geopolitical risk, economic uncertainty, market volatility and rapid technological change. These conditions created both opportunities and challenges for our business. Throughout the quarter, clients sought our council to better manage cost and risk, asking for advice, contextual judgment and specialized expertise to weather dynamic markets. At the same time, we saw short term headwinds as conditions in the Middle east caused clients in the region to postpone advisory projects. Unfavorable market movements and uncertainty also weighed in on economically sensitive businesses and led some clients to pause more discretionary spending and delay some decisions. Nonetheless, we continue to see solid traction in the market for our solutions. With our strategic focus on specialization, data and analytics and smart connections resonating with clients, we remain confident in our long term outlook and our ability to accelerate performance and drive growth through our investments in our solutions, talent, technology and data. Notably, our AI enabled solutions are gaining scale and generating growth as they deliver better outcomes for clients. For example, in Health, Wealth and Career Rewards AI, which applies generative AI to Willis Towers Watson’s proprietary data for compensation benchmarking, now serves over 2,500 client users. Our HR AI Assistant Expert was named a 2026 Lighthouse Tech Award winner in the category of Practical AI, recognized for delivering measurable efficiency gains and value for HR and benefits teams. And we expect many clients to undertake AI workforce transformation projects that we will deliver with our newly developed WorkView agent which evaluates the automation potential of all roles across an organization in risk and broking. Following two successful pilots in the second half of 2025, we’re implementing an AI powered operating system across the business. This accelerates the core technology that we’ve developed in our Broking platform and integrates our risk and analytics modeling tools into our service platforms. The result is radically improved insight on risk and an expedited placement process. During the first quarter, we also introduced some elements of New Front’s proven technology to enhance the front end and add more agenda capabilities, substantially reducing the administrative burden on our people and transforming our ability to serve our clients in claims. We’re rolling out our digital Global claims platform that builds on our broader Corporate Risk and Broking strategy. The platform uses AI and advanced analytics to reduce process complexity, shorten claims life cycles and improve outcomes for clients. It also gives us better insight into claims performance standards across carriers and geographies. These investments use technology to strengthen and scale our human LED judgment, advocacy and accountability. The same applied innovation mindset also extends to how we’re helping clients manage complex and fast moving risk environments. Recently, our Physical Risk Climate team was recognized for its work with a large semiconductor client for whom we developed new solutions to help manage climate and infrastructure related vulnerabilities across multiple geographies. These capabilities enable clients across the technology industry to quantify and prepare for risks that fall outside traditional frameworks. Against that backdrop, we saw several notable client engagements this quarter that demonstrate how WTW is helping clients navigate complexity by combining data and analytics, insight and technology in health, wealth and career. A large global employer in the consumer cyclical sector selected WTW for support on a quick burn project to prepare for a divestiture. The client valued our divestiture in a box offering that incorporates prepackaged solutions with technology enabled delivery. In another Health, Wealth and Career win, the CHRO of a global technology company recognized that HR needed a trusted partner, a partner with deep expertise on work design, jobs and skills to help them develop an AI strategy they could execute. Our work and rewards and employee experience teams were engaged to build an end to end solution including a talent and skills framework, a transformation roadmap, a process to build newly needed skills and overall change management strategy. Our subject matter expertise and our AI tools differentiated us in risk and broking. We’re particularly proud of the team who recently won all lines for a global Fortune 100 company in the US following a multi stage process that highlighted our analytics expertise and strong global coordination across our specialties. Starting with a comprehensive property and casualty review in the summer of 2025, we delivered actionable insights that established credibility and set us apart in the RFP with our advanced analytics, global connectivity and technology enabled service platform. This win underscores the strength of our globally integrated specialty model and our ability to translate analytics into measurable client value and will result in strong revenue growth for us this year.

Carl Hess (Chief Executive Officer)

Another recent win by our surety team highlighted our global reach and ability to solve complex specialty placements. We were selected by a leading global supplier of nuclear technology to address the consolidation of a fragmented surety program previously managed by two global brokers. Additionally, we were tasked with structuring and executing a major syndicated surety facility designed to support the client’s ambitious $80 billion project pipeline over the next three years, one of the largest non construction surety syndications currently in the market. Securing this mandate positions Corporate Risk and Broking Surety as a key strategic partner and provides a robust platform for our continued growth within the nuclear energy sector where we expect strong growth over the course of 2026 finally, we secured a significant win in the rapidly growing Artificial Intelligence and digital infrastructure industry with one of the leading companies in the construction and operation of advanced data centers. Our team won the entire program from a broker relationship that spanned over 15 years, covering both construction and operations by showcasing our construction specialty and analytics expertise, as well as our ability to advise on complex construction risks in almost every country in the world. Our support for the client extends beyond core services. For instance, we just assisted with a bond required for a project closure in Europe, filling a gap left by their previous surety broker. The client has appointed us on their next three data center projects without a competitive process, and we’ll see that work come through in 2026. Innovation also remains a significant driver of our efforts to enhance efficiency. Wedo, our enterprise delivery organization, continues to support our businesses in deploying automation and Artificial Intelligence and optimizing utilization of our global delivery centers. As Artificial Intelligence adoption rises across the company, we’re seeing increasing benefits to efficiency and productivity. For example, last July we introduced our Call Note Assist tool. Since then, it’s been used to summarize over 1.6 million calls in our outsourcing contact center, enabling a 33% reduction in post call wrap up time. DocLM, our proprietary Artificial Intelligence document ingestion tool, extracts and organizes key terms such as exposures and insurance clauses, significantly streamlining compliance and portfolio oversight. And our Corporate Risk and Broking Affinity team has used Artificial Intelligence to achieve a 90% reduction in endorsement processing time. With that, I want to step back and underline what we’re seeing and expect to see in our business regarding Artificial Intelligence. Clients are not choosing between human expertise or technology. They expect both. They want trusted advice and a trusted partner to help them navigate the complex environment, adding analytical rigor and sound judgment to the decisions they’re facing. And they want applications and platforms that give them real time access to data and insights, regardless of how difficult it might have been to obtain the information or how much effort it would have taken to analyze it previously. This is why I believe WTW will lead and benefit from Artificial Intelligence solutions in the long term. Our position in the industry and our structural advantages give us the opportunity to use Artificial Intelligence to drive growth and efficiencies in ways that newcomers, carriers and clients cannot or do not have the incentive to pursue. Let me explain. First, our services are complex, highly specialized, and mission critical for nearly all companies. Clients value working with trusted advisors like WTW because our guidance comes with real accountability in making complex or important decisions. Expert judgment matters and the potential upside of bypassing experienced, accountable advice is not worth the downside of getting it wrong and dealing with the repercussions. Second, Artificial Intelligence enhances efficiency but does not enhance trust and alignment. Artificial Intelligence streamlines workflows and lowers cost to serve, but it does not deliver the judgment, adequacy and accountability that both clients and carriers expect. Artificial Intelligence can inform decisions, but it does not negotiate with carriers, advocate on behalf of insurance in the claims process, or provide bespoke advice to help navigate through complexity. For buyers of our offerings, the risk of foregoing that value proposition getting wrong is considerable. Third, our structural advantages are hard to replicate. Our aggregated proprietary data, deep relationships and global scale which have been developed over time, create meaningful benefits for clients and carriers. In hwc we have decades of longitudinal workforce data, actuarial IP and deeply embedded outsourcing platforms. In R and B we have proprietary data which encompasses risk and placement insights across carriers and geographies. Finally, Artificial Intelligence itself is increasing demand. In addition to growing client interest in more sophisticated analytics and advice, including guidance about Artificial Intelligence workforce transformation, Artificial Intelligence is creating new Artificial Intelligence related risks and amplifying existing risks in cyber and other markets, fueling demand for novel insurance solutions that we believe we are well positioned to create and implement. To give you deeper insight into this, I’d like our new Chief Artificial Intelligence Officer Spike Lipkin to share some of his thoughts. As you know, with our focus on portfolio optimization, WTW recently acquired NewFront, a San Francisco based startup which grew into the leading Artificial Intelligence powered broking platform. Spike Co founded NewFront, has led its efforts to disrupt insurance broking and is WTW’s chief Artificial Intelligence officer. He’ll help shape how Artificial Intelligence advances WTW’s long term strategy and integrate NewFront’s technology with WCWS to create a true end to end digital ecosystem. His experience building newfront and planning and executing this integration gives him a unique and valuable perspective. With that, I’ll turn it over to Spike.

Spike Lipkin (Chief AI Officer)

Thanks Carl. I’m excited to be here because AI is clearly central to Willis Towers Watson strategy and it will become a key driver of value for both our clients and our business. Gordon Wintrob And I started Newfront in 2017 because we believe that advances in technology would create new risks around cyber IP liability property which would expand broker revenues and at the same time reduce the cost of delivering services. While all of this has happened, there’s even more opportunity ahead and we still believe that insurance brokers, especially those with scale and data like us at wtw, will be massive beneficiaries of AI advances. At newfront, we built infrastructure to take advantage of these developments to provide better client and colleague experiences. The results are clear. Colleagues who use our technology sell about 50% more than those who do not, and our client attrition rate drops by half when clients use our tools compared to those who do not. However, over eight years we found that with highly advanced technology, global reach, expertise and access to proprietary data are still tremendously important. AI is no substitute for Willis Towers Watson’s meaningful influence with carriers to drive better client outcomes. Moreover, AI is most effective when supplied with vast amounts of proprietary data, which Willis Towers Watson has. Our conclusion was obvious. Lasting advantage would accrue to scaled platforms that combined data and specialized expertise with AI to supercharge the entire system. After evaluating a range of options, we made a deliberate decision to move to wtw, where we saw the foundation for that advantage in two ways. First, its position as an industry leader in data and analytics and second, it’s operational agility that comes from being a genuinely integrated enterprise rather than a collection of siloed businesses. This level of integration is uncommon in the industry and critical for success as models become widely available. Much of the business impact will depend on employee adoption and reskilling. This is much more straightforward in an organization with shared processes, consistent standards and aligned incentives based than one fragmented across independent business units. Moreover, the data lives in one place rather than across a series of disconnected platforms. We believe this gives Willis Towers Watson a significant competitive advantage, which is why we chose to join them and build an end to end AI powered broking platform. Together, we’re now working at pace to integrate NewFront’s technology into Willis Towers Watson’s environment to create this intelligence platform that unlocks significant growth and efficiency opportunities for the entire enterprise. Our goal is to allow colleagues to spend more time on client facing work and less time on administrative tasks. We also believe having the leading technology will attract talent to wtw, especially those in search of novel digital tools to deliver better client outcomes. An AI fluent workforce is a massive competitive advantage in this industry which has historically lagged in technology adoption. Our detailed roadmap to integrate NewFront’s existing tech into Willis Towers Watson’s business starts with North America. Several tools are implementation ready and we are embedding engineers with professional teams and seeing early successes. For example, several AI tools are being utilized by client facing teams like Coverage …

Full story available on Benzinga.com

This post was originally published here

Allstate (NYSE:ALL) held its first-quarter earnings conference call on Thursday. Below is the complete transcript from the call.

This transcript is brought to you by Benzinga APIs. For real-time access to our entire catalog, please visit https://www.benzinga.com/apis/ for a consultation.

The full earnings call is available at https://edge.media-server.com/mmc/p/kwnctcyi/

Summary

Allstate reported total revenues of $16.9 billion for the first quarter, a 3% increase year-over-year, with investment income rising nearly 10% to $938 million.

The company saw a 2.5% increase in total policies in force, driven by a 2.3% rise in property liability policies, and a net income of $2.4 billion with an adjusted net income of $2.8 billion.

Strategically, Allstate focused on broadening protection offerings, competitive pricing, and leveraging advanced analytics to optimize growth and profitability.

Market share growth was noted in both auto and homeowners insurance, with significant gains in 29 states for auto insurance and 41 states for homeowners insurance.

Management emphasized the role of advanced analytics and AI in enhancing operational efficiency and customer experience, while maintaining a disciplined approach to capital allocation and share repurchases.

Allstate announced a new $4 billion share repurchase program, with $3.6 billion remaining, reflecting a commitment to returning capital to shareholders.

The company remains optimistic about future growth, particularly in the homeowners insurance sector, and is exploring AI to further improve service and reduce expenses.

Full Transcript

OPERATOR

Thank you for standing by. Welcome to Allstate’s first quarter earnings investor call. At this time, all participants are in listen only mode. After the prepared remarks, there will be a question and answer session. To ask a question during this session, you’ll need to press star 11 on your telephone. If your question has been answered and you’d like to remove yourself from the queue, simply press star one one. Again. Please limit your inquiry to one question and one follow up. As a reminder, please be aware this call is being recorded. And now I’d like to introduce your host for today’s call, Alistair Gobin, Head of Investor relations. Please go ahead, sir.

Alistair Gobin (Head of Investor Relations)

Good morning, everyone. Welcome to Allstate’s first quarter 2026 earnings call. Yesterday, following close of the market, we issued our news release and investor supplement and posted related materials on our website at Allstate Investins. Today, our management team will discuss how Allstate is creating shareholder value. Then we will open up the line for your questions. As noted on the first slide of the presentation the presentation, our discussion will include non GAAP measures for which reconciliations are provided in the news release and investor supplement. We will also make forward looking statements about Allstate’s operations. Actual results may differ materially from those statements. So please refer to our 2025 10K and other public filings for more information on potential risks. Let’s start with three of our recent advertisements and then Tom will be foreign.

Elm

I’m a 200 year old Elm, and while I might be holding up on the outside, on the inside, I’m dead. Oh, man, it feels good to just let go. If you don’t have the right home coverage. Well, this could break your bank. Switch to Allstate and you can save hundreds. Put it on my tab. I’ll show myself out.

Mario

Let’s start with the market share growth on slide 5. Starting on the left, Allstate increased auto insurance market share in 29 states in 2025 that comprise 57% of countrywide premiums. Looking down below, in the 29 states where share increased policies in force increased by 4.3% over the prior year and outpaced vehicle registration growth in those states. That means we increased our share of insurable vehicles in those states which we view as a better indicator of sustainable share growth than the traditional premium based market share metric. In the remainder of the country, policies in force decreased by 0.5% versus an increase in vehicle registration of 0.6%. The decline is heavily impacted by two large states where we have intentionally been reducing share because of profitability challenges. If you look at which companies this growth comes from by dividing the market into the top five market share leaders and the rest of the market. Slightly more comes from the medium sized and smaller carriers. The broad set of competitive tools that Tom referenced also drives growth in homeowners insurance. Homeowners insurance market share grew in 83% of the US market. This was in 41 states which had policy enforced growth of 4.1% in 2025 over the prior year. We have a broad competitive advantage over the companies we compete with in the homeowners insurance market as demonstrated by our ability to profitably gain share. Moving to Slide 6, Allstate’s business model enables us to consistently generate strong returns. On the chart, the blue bars represent the auto insurance underlying combined ratio which averaged 94, 95 and 94 over the last 5 and 10 years. Consistent with our mid 90s target. There was obviously an increase in the combined ratio in 2022 post pandemic which required significant price increases as shown by the light blue line in the middle of this chart. Since then, we have returned to levels at or below our mid-90s target with more modest price increases needed to generate and sustain attractive returns. In the first quarter of 2026, rate changes were implemented in 39 states which included a mix of both rate increases and decreases. These changes had a net overall neutral implemented rate impact across the book. Improving affordability will increase policy and force growth and raise shareholder value as long as the combined ratio continues to perform at or better than target levels. Let me note that these are underlying combined ratios that were reported for these years and as Jess will cover in a few minutes. Favorable subsequent reserve development shows that results for several of these years are actually better than what is shown on the chart. Moving to slide 7, you can see a similar story in the homeowners insurance business which also generates strong returns. Homeowners insurance over the last five and ten years had a recorded combined ratio of 93.5 and 92 respectively, and has generated underwriting income of $3.9 billion and $7.9 billion in those same periods. In the first quarter the combined ratio was 83.5 and average premiums increased 5.7% compared to the prior year quarter, keeping pace with loss costs as you saw this quarter. We also posted the disclosure related to the placement of our comprehensive nationwide reinsurance program which enhances the risk and return profile in the homeowners business by reducing capital requirements associated with catastrophe loss, tail risk and dampening earnings volatility. The homeowners insurance business remains a competitive advantage and growth opportunity for Allstate. Now let me turn it over to Jess.

Jess

All right, thanks Mario. Let’s look at the property liability results in total on slide 8, auto insurance policy growth of 2.6% and homeowners insurance policy growth of 2.5% drove an increase of 2.3% in total policies in force and written premiums earned Premiums increased by 5.5%. The property liability combined ratio was 82.0 as both auto and homeowners insurance profitability was better than our targeted levels. This result was due to strong ongoing performance as well as lower catastrophes and favorable prior year reserve releases, excluding the benefit of reserve changes and lower catastrophes. The auto insurance underlying combined ratio was 89.5, which is 1.7 points better than the prior year. Property liability underwriting income was $2.7 billion in the first quarter. Now turning to Slide 9. As Mario referenced in his comments, auto insurance profitability improved faster than original estimates in 2023 and 2024. The top of the stack bar is the underlying combined ratio as originally reported. The green bars represent the impact of subsequent prior year reserve reestimates. The light blue bars represent the adjusted underlying combined ratio, including the subsequent changes in our estimates of loss costs. As you can see, prior year losses developed more favorably than originally estimated. Reserving is an iterative process with strong governance and oversight. We use consistent practices, multiple analytical methods, and include external reviews by independent actuaries to ensure reserve adequacy as more claims settle. However, estimates each year are revised to reflect actual loss experience. In recent quarters, actual loss experience has outperformed initial expectations. This results in the release of reserves from prior years. The auto combined ratio in 2023 is now estimated at 95.4 and 2024 is estimated at 90.0. Auto insurance profitability improved faster than originally estimated. Slide 10 highlights how we expect to continually improve our strong performance, enhance and enhance competitive position Transformative growth built a comprehensive competitive model. This included new software and adapted legacy systems to build a connected technology ecosystem. The system enables the use of artificial intelligence to improve customer experience and lower costs. We’re leveraging this technology platform in building Allstate’s large language intelligent ecosystem which we call Alli, to harness the power of agentic AI.

John

With that, I’ll turn it over to John. Thanks Jess. Good morning everyone. Moving to Slide 11, the Protection Services business grew to grow continue to grow profitably. This segment is comprised of five businesses shown on the left. Protection Plans, Dealer Services, Roadside erity and Identity Protection. The largest business in this segment is all state protection plans which grew revenue 13.5% versus the prior year quarter. This business provides protection for mobile phones, consumer electronics, major appliances and furniture. Protection plans generated $41 million in adjusted net income for the first quarter, down slightly due to higher claims costs. Arity is our mobile intelligence business. The higher loss this quarter reflects restructuring charge related to a reduced employee count. In total, protection service businesses increased revenue 7.2% from the first quarter of 2025 and generated $47 million in adjusted net income. Let’s turn to Slide 12 to discuss the investment portfolio. Investment income of $938 million increased $84 million or 9.8% compared to the prior year quarter. As shown on the chart on the left, net investment income has grown as the portfolio grew since the first quarter of 2024, portfolio book value has increased 24%, or approximately $17 billion. The increase reflects higher average investment balances from a 15% increase in earned premiums, strong underwriting income and improved fixed income yields. The table on the right side highlights the strength and consistencies of returns across asset classes. Over the last 12 months, the portfolio generated a 4.2% return. Fixed income results over the last five years are top. Quartile returns in our performance based portfolio have been below longer term historic averages over the last one and three years at 7.6% and 5.9% respectively, but remain above industry benchmarks. These results underscore the effectiveness of our active investment management approach. As a result, we increased the capital allocated to the investment portfolio in the first quarter, some of which is carried at the holding company. Let’s move to slide 13 to show that proactive capital management creates shareholder value. Allstate deploys capital in multiple ways which are shown on the left axis. Organic Growth Enhancing existing businesses, growth acquisitions and cash providing to shareholders Using capital for organic growth leverages Allstate’s capabilities and market presence with well understood and attractive risk and return opportunities. This is why we’re focusing on increasing market share in the property liability business. In addition, increasing market share should raise valuation multiples. Over the last three years, $3 billion of economic capital was utilized to support premium growth. As we just discussed, Allstate also deploys capital to support the investment portfolio to generate attractive risk adjusted returns. Capital is also used to strengthen existing businesses such as investments we made in our technology ecosystem or enhancing our independent agent business through the acquisition of national general. SquareTrade was a growth acquisition that leveraged the Allstate brand and capabilities. It also expanded protection offerings to execute the second part of our strategy and brought strong retail distribution partnerships. Since it was acquired, revenues have increased Eightfold and The business generated $175 million of adjusted net income over the last 12 months. Also, Allstate also has a long track record of returning capital to shareholders. In the first quarter, $881 million was returned to shareholders through repurchases and dividends. We completed the former $1.5 billion share repurchase program and launched a new $4 billion share repurchase program, accelerating the pace of repurchases. $3.6 billion remains on the current share repurchase authorization which represents approximately 40% of of holding company assets as of March 31 and 7% of outstanding shares. It’s an interesting observation. If you bought all of Allstate 10 years ago, you would have received 99% of the purchase price back in cash and would have a company that generated $12 billion in net income over the last 12 months. Wrapping up on Slide 14. In summary, Allstate’s broad set of competitive levers delivered strong results in the first quarter.

OPERATOR

Certainly. And our first question for today comes from the line of Mike Zyrimski from bmo. Your question, please.

Jack

Hey, good morning, this is Jack on for Mike. Just first one on the pricing outlook. Given how strong reported loss ratios are across your portfolio, wondering how you’re thinking about the opportunity to lean more aggressively on pricing this year. And does that calculus differ materially across auto, homeowners and bundled customers?

Tom

I would go back to the slide we talked about in terms of growing. We have a wide range of ways in which we grow. Price is certainly important, but it’s not the only one. And I know there’s a question for many. So let me maybe let’s spend a minute to. Because it’s what you described. We do it obviously by product, we do it by state, we do it by coverage. It’s highly complicated. If we think bundled customers lower acquisition costs, we give them a discount if they bundle. So yes, we do all that. But let me go up. So price is obviously important and it’s a key driver of profitability. As a result, we built this system of called operational levers, organizational accountability and sophisticated analytics. And our goal, of course, is to earn attractive margins and grow. And there’s always a plan on prices that looks forward six to 12 months. We’re going to talk about what that plan is here because it’s competitive and it changes all the time, but it’s based on what operational levers we think we can pull. So Jess will describe the system for you and give you a couple examples of how it works. The conclusion, however, is that the system works. It works for auto and it works for homeowners. And you can see that on slide six and seven. Our auto combined ratio is 94 to 95 over the last five and ten years. Homeowners insurance ratio 92 to 93 and a half over the last five and ten years. So the system itself works while price is important at just one component. Jess, why don’t you talk about how it works here and then give a couple examples. Got It So we think about the

Jess

system like a cube that has three elements. And Tom alluded to the three elements. You have operational levers, you have advanced analytics, and then organizational roles and responsibilities. And it’s a bit like a Rubik’s cube where it gives us multiple ways to both identify and address profit and growth opportunities that we have. What I’ll do quickly is go through each component and I’ll give a couple examples of what’s going on, a couple state examples of how the system works. So if you start with the operational lever element of our cube, we kind of covered this on slide 4. Tom went through it. You have new products, broad distribution, marketing. Effectively, we employ these operational levers at the state, individual market and product …

Full story available on Benzinga.com

This post was originally published here

NovoCure (NASDAQ:NVCR) released first-quarter financial results and hosted an earnings call on Thursday. Read the complete transcript below.

Benzinga APIs provide real-time access to earnings call transcripts and financial data. Visit https://www.benzinga.com/apis/ to learn more.

The full earnings call is available at https://edge.media-server.com/mmc/p/zmc3tkut/

Summary

NovoCure reported a strong start to 2026 with double-digit growth in both active patients and net revenues year-over-year.

The FDA approval and U.S. launch of Optune Pax for locally advanced pancreatic cancer were significant highlights, with promising early adoption metrics.

NovoCure updated its full-year revenue guidance to $690 million to $710 million, reflecting 5-8% growth.

The company is making advancements in its GBM and lung cancer programs, with expectations for further insights from the Phase 3 Trident trial in the next quarter.

NovoCure’s strategic focus includes expanding adoption in GBM, maintaining momentum with Optune Pax, and achieving double-digit revenue growth and profitability.

Full Transcript

OPERATOR

Good day and thank you for standing by. Welcome to the Nova Q1 2026 earnings call. At this time, all participants are in listen-only mode. After the speakers’ presentations there will be a question and answer session. To ask a question during the session you will need to press star *1 on your telephone. You will then hear an automated message advising that your hand is raised to withdraw your question. Please press star *1 again. Please be advised that today’s conference is being recorded. I would now like to hand the conference over to your first speaker today, Adam Dainey. Please go ahead.

Adam Dainey

Good morning and thank you for joining us to review NovoCure’s first quarter 2026 financial performance. I’m joined on the phone today by our Executive Chairman Bill Doyle, CEO Frank Leonard, Chief Innovation and Medical Officer Ori Weinberg and CFO Christoph Brockman. Other members of our Executive leadership team will be available for Q and A for your reference slides accompanying this earnings release can be found on our website novacure.com on the investor Relations page under Quarterly Reports. Before we start, I would like to remind you that our discussions during this conference call will include forward looking statements and actual results could differ materially from those projected in these statements. These statements involve a number of risks and uncertainties, some of which are beyond our control and are described from time to time in our SEC filings. We do not intend to update publicly any forward looking statement except as required by law. Where appropriate, we will refer to non-GAAP financial measures to evaluate our business. Specifically adjusted EBITDA, a measure of earnings before interest, taxes, depreciation, amortization and share based compensation. We believe adjusted EBITDA is an important metric as it removes the impact of earnings attributable to our capital structure, tax rate and material noncash items and best reflects the financial value generated by our business. We do not provide forward looking guidance for adjusted EBITDA on a GAAP basis due to the inability to predict share based compensation expenses contained in the reconciled GAAP measure net income without reasonable efforts. Reconciliations of non-GAAP to GAAP financial measures are included in the press release, earnings slides, and in our Form 10Q filed with the SEC today. These materials can all be accessed from the Investor Relations page on our website. Following our prepared remarks, we will open the line for your questions. I will now turn the call over to our Executive Chairman Bill Doyle.

Bill Doyle (Executive Chairman)

Thank you Adam. This morning we reported results for the first quarter of 2026 and I am pleased to say we’ve had a strong start to the year. Both active patients and net revenues grew with double digits rates year over year. Our launch in pancreatic cancer is off to a promising start and we are making progress on our journey to profitability with a number of additional catalysts expected this year. We look forward to building on this strong first quarter. On today’s call, we will begin with a review of our pancreatic cancer program. Frank will then provide an update on our GBM and lung cancer programs. Christoph will conclude with a review of our first quarter financial performance before we open the line for questions. The leading news in the quarter was the FDA approval and subsequent US Launch of Optune PACS for patients with locally advanced pancreatic cancer. Physician feedback has been positive since the PANOVA-3 data were presented and published at ASCO last year. There is broad recognition of the importance of the outcomes observed, including extensions in overall survival and time to pain progression. We believe Optune PACS can play a significant role in the treatment of pancreatic cancer and we are pleased to be bringing Optune PACS to pancreatic cancer patients. The early days of our Optune PACS commercial launch have been encouraging. We received FDA approval on February 11th. In the seven weeks between the approval and quarter end, we certified 868 healthcare providers, 27 of whom are prescribers in academic centers, an exciting development as historically we’ve seen slower adoption of TT fields therapy in academic centers. Through March 31, we’ve received 169 prescriptions and completed 90 patient starts. We ended the quarter with 83 patients on therapy and a backlog of starts in the funnel. We are also pleased to report our first major payer coverage policy for Optimpax. With Elevance Health covering over 30 million lives, it will take a few quarters to fully understand the Optune PACS, adoption curve and reimbursement dynamics, but again, the early signals are very encouraging. During the quarter we also announced top line Data from the Phase 2 PANOVA-4 trial evaluating TT fields therapy together with atezolizumab and gemibraxane in metastatic pancreatic cancer. PANOVA-4 met its primary endpoint with a disease control rate of 74% compared to 48% in the historical control. Median duration of therapy was 25.6 weeks, a strong indication that TT fields therapy is feasible for use in the metastatic population. As the pancreatic cancer treatment landscape evolves, we will evolve with it. After years of limited clinical success in pancreatic cancer, the medical community has seen positive outcomes in the Panova3 and Panova4 trials and positive data from a trial testing the KRAS inhibitor Duraxon racib in second line metastatic pancreatic cancer. RAS inhibitors are likely to be an important backbone therapy in pancreatic cancer in the future and we are working to understand the benefits of their concomitant use with tumor treating fields. Earlier this month, at the American association of Cancer Research or AACR Annual Congress, two posters were presented which evaluated in vitro and in vivo use of TT fields with Diraxone RASIB in pancreatic cancer models. The data presented show that KRAS inhibition, which blocks upstream oncogenic signaling and the DOWN regulation of the c-Myc protein caused by TT fields, produce greater antitumor activity when used together compared to either therapy used alone. These data are promising, warrant clinical investigation and will be important inputs as we consider the next steps in our pancreatic cancer program. Finally, a quick update on our product development initiatives. Over the last year we’ve launched a number of product enhancements aimed at making TT fields therapy easier for patients and prescribers. This includes an HCP portal which simplifies the prescription process. Lighter, more flexible, more comfortable HFE Arrays for optunegia, a mobile app to help patients and caregivers navigate their TT fields experience. We are starting to see the fruits of these enhancements in our 90 day persistent rate which hovered below 70% as recently as 2024. In 2025 we have seen quarterly persistent rates tick up to 73%. Our next major product improvement will be a new array for the torso. We are now finalizing the design which will be compatible with Optune PACS and Optune LUA. The new arrays are designed to make major improvements in comfort and usability. We also expect these arrays to be more cost effective to manufacture. We have completed usability testing in healthy volunteers and are evaluating performance in non small cell lung cancer patients. Our next aim is to have the new arrays available for use in future pancreatic and lung cancer clinical trials by year end. I’ll now pass the call over to Frank for an update on our GBM and lung cancer programs.

Frank Leonard (Chief Executive Officer)

Thank you Bill. Our Optune GEO business remains the core driver of our commercial portfolio. We are off to a strong start to the year with 9% year over year growth in active patients globally. We saw our strongest growth in Japan, Germany and France which contributed 20%, 12% and 9% year over year active patient growth respectively. Our global market segment also had an outstanding quarter with 17% active patient growth driven by a promising launch in Spain. We believe we can maintain low to mid single digit active patient growth in our mature markets and even higher growth in new markets like Spain and Czechia. The next major catalyst in our Glioblastoma Multiforme (GBM) program will be top line data from the Phase three Trident trial expected in the second quarter. The Trident results will provide us with a better understanding of how TT fields can work with radiation therapy. The Trident moves the start of optunegeo earlier in the Glioblastoma Multiforme (GBM) treatment journey, beginning with chemoradiation rather than following chemo radiation. In Trident, the patient population eligible for inclusion is broader than our EF14 trial. In the EF14 trial, patients who progressed in the short time between chemo radiation and screening were not eligible for randomization. In the Trident trial, where randomization occurs prior to the start of chemo radiation, we are able to assess the use of TT fields in this previously ineligible cohort. We expect Trident to give further insight into whether earlier use of TT fields therapy can drive additional survival benefit to a broader population of eligible patients. Turning now to Optune LUA In March we received national reimbursement in Japan and began treating commercial patients. Japan provides a promising market for Optune LUA as our LUNAR clinical Trial data more closely reflect the standard of care in Japan. On March 15th we hosted a symposium with approximately 250 Japanese lung cancer physicians in attendance, including a number of leading key opinion leaders. We are in the early stages of our launch, but we’re encouraged by the physician interest and engagement thus far on the clinical trial front. As I have said from the beginning of my tenure as CEO, we need to update our strategy for the LUNAR 2 trial. We are exploring options now to modify the trial with the goals of compressing the timeline to completion and significantly reducing the cost. We look forward to engaging with regulators to discuss the potential changes and providing a full update later this year. Overall, this was a very strong quarter and we are pleased with our progress. Our commercial focus is on expanding adoption in gbm, maintaining the momentum of our Optune pacs launch, and capturing value in the markets where Optune LUA potential is greatest. We’ve reached a number of exciting commercial and clinical milestones in the first quarter and look forward to sharing more information on additional catalysts throughout the year. Christoph will now walk through our financial results from Q1.

Christoph Brockman (Chief Financial Officer)

Thank you Frank and thank you all for joining us this morning. We had a strong start to the year, continuing our momentum from 2025. Net revenue in the first quarter was $174 million, an increase of 12% year over year. The increase was driven primarily by continued growth in our markets outside the US including increases of 6 million and 5 million dollars from Germany and France respectively. Germany benefited from increased approval rates which provided a one time benefit of $2.5 million and France benefited from contract performance improvement which provided a one …

Full story available on Benzinga.com

This post was originally published here

Albany Intl (NYSE:AIN) reported first-quarter financial results on Thursday. The transcript from the company’s first-quarter earnings call has been provided below.

This transcript is brought to you by Benzinga APIs. For real-time access to our entire catalog, please visit https://www.benzinga.com/apis/ for a consultation.

Access the full call at https://edge.media-server.com/mmc/p/xhxsw747/

Summary

Albany Intl reported first quarter 2026 revenue of $311 million, a 7.8% increase year over year, with adjusted EBITDA of $48 million.

Strategic focus includes operational excellence and safety, with increased demand in weapons programs and new contracts in engineered composites.

Future outlook shows stable demand across segments, with revenue guidance for Q2 2026 between $335 million and $345 million, and anticipated EPS of $0.7 to $0.8.

Full Transcript

Gunnar Cleveland (President and CEO)

Gunnar thank you Karen Good morning and welcome everyone. Thank you for joining our first quarter earnings call. We entered 2026 as a more focused and disciplined organization with a clear strategy centered on our core strengths. Our culture begins with caring for our people and it was an honor to recently have our engineered composites segment recognized as one of America’s safest companies. Safety is a priority at Albany and is embedded in how we design processes and operate each day. And a strong safety culture translates to a strong quality culture. This operational philosophy is also manifested in our outstanding on time delivery performance. Our focus on safety, quality and operational excellence creates a solid foundation for our reliable operations, while our value proposition remains grounded in our shared expertise in industrial weaving and material science which connects our two businesses and differentiates us in the markets we serve. I’d like to take a minute to address the conflict in the Middle East. We’re continuously monitoring and working closely with our suppliers and customers and to date we have not seen any impact and have made only slight adjustments to delivery routes. Raw materials are generally protected by either long term contracts or customer directed contracts. We will continue to monitor and work to minimize any supply chain risk. At the same time, we’re seeing increased demand on our weapons programs and are maximizing production on key programs. In machine clothing. The team did an outstanding job taking corrective actions to make up the downtime of a machine malfunction and we expect debt recovery to be completed in the back half of the year. More broadly, demand conditions across our end markets stabilized in the first quarter in engineered composites. Our focus remains on refining our operating model and prioritizing higher value add applications, particularly within our advanced weaving technologies including 3D weaving, braiding, winding and resin transfer molding that serve end markets such as commercial and defense propulsion systems, missile production and space exploration. We’re seeing volume increase across key programs reflecting both higher production rates and the benefit of the actions we have taken over the past 12 months. Importantly, we’re winning new business with new and existing customers and demand remains strong across defense platforms and the lead production continues to increase. Our current pipeline of new business opportunities remains robust and and continues to expand as we focus on new applications where our expertise and products offer greater strengths and lighter weight solutions. We believe the actions we have taken and the trends we see across both segments position us well to drive strong free cash generation and build on the baseline we established exiting 2025. This provides us with the flexibility to continue allocating capital in a balanced and disciplined manner including reinvesting and in the business to support long term growth while also returning cash to shareholders. Turning to the quarter, we’re off to a Solid start to 2026 with revenue of $311 million up 7.8% year over year, which translated to adjusted EBITDA of $48 million in machine clothing. Revenue for the quarter was $166 million and came in ahead of our expectations across all regions including North America, Europe and China. Despite the recent stabilization in China and improved order rates which are positive developments, visibility beyond the near term remains limited. As we previously disclosed, at the start of the first quarter we experienced an equipment failure at one of our facilities and I’m pleased to report that we were able to recover more of the lost production related to the unplanned downtime that than we initially anticipated in the first quarter. Assuming the equipment continues to operate as expected, we believe we are well positioned to recover the remaining lost volume by the end of the year we’re actively managing this situation and are relocating a machine from a coast facility to have a long term solution in place. By year end, adjusted EBITDA margin for MC was 25.9% on a constant currency. …

Full story available on Benzinga.com

This post was originally published here

Sirius XM Holdings (NASDAQ:SIRI) released first-quarter financial results and hosted an earnings call on Thursday. Read the complete transcript below.

This transcript is brought to you by Benzinga APIs. For real-time access to our entire catalog, please visit https://www.benzinga.com/apis/ for a consultation.

View the webcast at https://event.choruscall.com/mediaframe/webcast.html?webcastid=lWgpRUsT

Summary

Sirius XM Holdings reported a strong start to 2026 with improvements in net subscriber additions, ARPU growth, and reduced churn.

The company announced a landmark partnership with YouTube to enhance advertising capacity and expand reach to 255 million monthly listeners.

Sirius XM Holdings reported a 1% increase in revenue to $2.09 billion, with advertising revenue growing 3% to $407 million.

The company achieved $45 million in cost savings towards its $100 million 2026 target, with a focus on efficiency and long-term value.

Guidance for 2026 includes relatively flat revenue, stable adjusted EBITDA, and modestly lower subscriber trends, with a focus on strong execution and free cash flow growth.

Full Transcript

OPERATOR

Welcome to the Sirius XM Holdings’ first quarter 2026 earnings call. This time all participants will be in listen only mode. The question and answer session will follow the formal presentation. If anyone should require operator assistance, please press star zero from your telephone keypad. As a reminder, this conference is being recorded. It is now my pleasure to introduce Jennifer Degrassia, Senior Vice President of Investor Relations. Thank you, Jennifer. You may begin.

Jennifer Degrassia (Senior Vice President of Investor Relations)

Thank you and good morning everyone. Welcome to Sirius XM Holdings’ first quarter 2026 earnings call. Today’s discussion will include prepared remarks from Jennifer Witts, our Chief Executive Officer, and Zach Coghlin, our Chief Financial Officer. Following their comments, we will open the call for questions. Joining us for the Q&A portion are Scott Greenstein, our President and Chief Content Officer, Wayne Thorsen, our Chief Operating Officer and Scott Walker, our Chief Advertising Revenue Officer. I would like to remind everyone that certain statements made during the call might be forward looking statements as the term is defined in the Private Securities Litigation Reform Act of 1995. These and all forward looking statements are based upon management’s current beliefs and expectations and necessarily depend upon assumptions, data or methods that may be incorrect or imprecise. Such forward looking statements are subject to risks and uncertainties that could cause actual results to differ materially. For more information about those risks and uncertainties, please view SiriusXM’s SEC filings and and today’s earnings release. We advise listeners not to rely unduly on forward looking statements and disclaim any intent or obligation to update them as we begin. I would like to remind our listeners that today’s call will include discussions about both actual results and adjusted results. All discussions of adjusted operating results exclude the effects of stock based compensation. Additionally, please find a supplemental earnings presentation and trending schedule on our investor relations website for your convenience. With that, I’ll turn the call over to Jennifer Witts.

Jennifer Witts (Chief Executive Officer)

Good morning everyone and thank you for joining us today. We are off to a strong start in 2026, executing with focus and discipline against our three strategic priorities we outlined in December 2024 strengthening our subscription business by delivering exceptional in car listening experiences, accelerating growth across our advertising business and leveraging our scaled Sirius XM Holdings portfolio to drive efficiency and long term value in the first quarter. We made meaningful progress across each of these areas, supported by solid performance in our core business and strong operational execution. On the subscriber side, we delivered significant year-over-year improvement in net additions, grew ARPU and achieved the lowest first quarter churn, and highest subscriber satisfaction scores in our history. Through our recently announced landmark partnership with YouTube,. We will significantly enhance our advertising capacity and we continue to expand margins through our enhanced focus on efficiency, capturing $45 million toward our $100 million 2026 cost savings target. Before turning the call over to Zach for a more detailed review of our financials, I would like to offer a few observations starting with our subscription business performance in the quarter was strong with a meaningful year-over-year improvement in self pay, net additions to negative 111,000 and improvement of 192,000. This reflects the growing adoption of companion subscriptions among our most loyal customers, ongoing progress with our continuous service initiative and momentum in our Automotive Dealer Extended Duration plans. Together, These offerings expand Sirius XM Holdings’s presence across multiple vehicles and users within a household and make it easier for subscribers to seamlessly maintain service as they transition between vehicles. Deepening engagement and Reinforcing long term Loyalty While we remain mindful of a more measured auto sales environment and its potential impact on trial volumes, our resilient in car foundation and focus on controllable levers continue to support performance. Churn remained a standout, improving to 1.5% despite our February price increase which contributed to a 1% year-over-year increase in ARPU to $1,499. The combination of pricing discipline supported by continually adding value to our packages and the ongoing impact of our customer experience initiatives underscores the durability of our subscription model. Our strong retention is also supported by high customer satisfaction levels. Our latest study showed year-over-year improvement across all five core metrics satisfaction, perceived value, likelihood to continue, likelihood to recommend and the essentialness of our service. Notably, both loyalty and perception metrics rose in tandem, an important signal of not only current satisfaction but but also growing confidence in the long term value of our offering. We are also seeing traction across key demographics with a majority of the increase in satisfaction being driven by Gen X and Y. Gen X delivered strong gains, particularly in perceived value, intent to continue and essentialness, while Millennials showed meaningful improvement in satisfaction and value, highlighting both the progress we are making and the opportunity that remains. Content is a defining strength of Sirius XM Holdings and a key driver of perceived value and engagement. We continue to expand and evolve our programming in ways that fuel fandom and deepen engagement across music, sports, comedy and culture. In the first quarter we introduced exclusive full time artist led channels from global stars Morgan Wallen and John Summit alongside pop up channels from bts, Luke Combs and Robin, as well as distinctive programming such as John Mayer’s Grateful Dead Listening Party. We deepened our partnership with Metallica with the launch of the live Call in show Talika Talk expanded all 2K to our full subscriber base following eight consecutive quarters of audience growth and broadened our comedy offering with a dedicated 24. 7 channel featuring Sebastian Maniscalco. Our news and talk category is also gaining momentum, with consumption up 15% sequentially. This reflects continued investment in both independent and exclusive voices from the launch of Cuomo Mornings to the strong performance of the Megyn Kelly Channel where listening has grown 28% since its launch in November. We are also creating distinctive high impact moments for listeners, from intimate performances to major cultural events featuring artists like Noah Khan during Super Bowl Week, Hanny Chesney at Florabama, Morgan Wallen in Nashville and a recent SmartList taping in Hollywood. In sports, our offering is unmatched, spanning every major league and premier event from the NFL, MLB, NBA and NHL to college athletics, auto racing, golf and more, making Sirius XM a true year round destination for fans. Our college sports offering continues to build momentum as a core part of our bundle, with listening hours for March Madness and the College Football Championship up 22% and 37% year-over-year respectively. At the same time, our hardware and software evolution continues to enhance the listener experience as 360L expands across nearly all major OEMs lineups, we are driving sustained growth in 360L enabled subscriptions and increasing adoption of more personalized nonlinear listening. This is fueling double digit growth in both usage and time spent with features like extra channels and artist seated stations. Deepening Engagement Turning to our advertising business momentum is accelerating. Advertising revenue grew 3% to nearly $407 million in the quarter, driven by a 37% increase in podcasting advertising revenue. This reflects strong traction in video and social through our Creator Connect strategy as well as accelerating Programmatic demand where revenue more than doubled year-over-year through Google’s DV360. Our partnership with YouTube, marks a significant step forward. As the exclusive US advertising representative for YouTube,’s audio inventory, we are expanding our reach to 255 million monthly listeners, nearly 90% of the US population age 13 and older. For the first time, we will offer advertisers scaled access to premium audio across a wide range of content, from iconic franchises like SNL, to leading creators like Mr. Beast, as well as podcasts beyond our own network and streaming music. Beginning this fall, advertisers will benefit from expanded high quality inventory paired with advanced targeting and measurement capabilities. By combining Sirius XM Holdings Media’s leadership and audio advertising with YouTube, scale and always on engagement. We are delivering high attention inventory through a more seamless buying experience while advancing a more open, connected ecosystem for advertisers. In podcasting, we remain the number one podcast network in the US by Weekly Reach. As a launch partner for Apple’s new video podcasting experience, we are helping shape the next evolution of the medium by unlocking dynamic video ad insertion and expanding access to a significantly larger advertising market. This uniquely positions us to power monetization across audio formats with greater flexibility and optionality for both creators and advertisers. These efforts reflect our commitment to an open podcast ecosystem that enables creators to grow across platforms. Across the portfolio, we are leveraging our scale, data and technology to unlock new growth opportunities and deliver stronger outcomes for advertisers. At the same time, we remain focused on building a high performing future ready organization. We recently welcomed Eve Conston as Chief Legal Officer, bringing deep expertise across media, technology and content and further strengthening our operating discipline in support of our strategic priorities. Our progress is also being recognized externally. We were named by Forbes as one of the best brands for social Impact and by Newsweek as one of America’s greatest workplaces for culture, belonging and community as well as for women. Turning to our outlook, our disciplined approach gives us confidence in delivering on our 2026 full year guidance, relatively flat revenue and stable adjusted EBITDA. While subscriber trends are expected to be modestly lower year-over-year, our focus remains on strong execution and driving continued free cash flow growth. Importantly, the fundamentals of our business remain strong. We have a durable subscription model, predictable and growing cash generation and a unique combination of assets including premium content unmatched in car distribution, scaled audience reach and leading ad technology. We believe These strengths position Sirius XM Holdings well for the future and we remain committed to disciplined execution, thoughtful investment and delivering sustainable long term value for our shareholders. With that, I’ll turn it over to Zach for more detail on the financial results.

Zach Coghlin (Chief Financial Officer)

Thanks Jennifer and thank you everyone for joining us today. We delivered a solid start to the year with three key financial takeaways. First, we delivered revenue of 2.09 billion up 1% year over year, supported by the strength of our subscriber base and continued momentum in advertising where revenue increased 3%. Second, our disciplined cost management and a continued focus on efficiency drove approximately 6% growth in adjusted EBITDA, to 666 million. And third, the strength and stability of our earnings and cash flow continues to create significant shareholder value. With net income up 20% and free cash flow more than tripling year over year to 171 million. Together, these results underscore the steady progress we are making against our long term strategic initiatives to enhance profitability and drive free cash flow generation. Looking first at the top line, consolidated revenue was nearly 2.1 billion including $1.6 billion of subscription revenue, also up approximately 1% year over year. This growth reflects the early benefit of our recent February price increase as well as the full year impact from the 2025 rate adjustment, partially offset by a smaller average subscriber base. Advertising revenue increased 3% to 407 million as strengthened podcasting higher programmatic demand and technology fees more than offset softer demand in streaming music advertising. Turning to profitability, adjusted EBITDA, grew 6% year over year to 666 million with margins expanding, 140 basis points to 31.9%. This improvement was primarily driven by revenue growth complemented by disciplined expense management across our customer service, product and technology and personnel related costs. Importantly, we captured 45 million towards our goal of delivering an incremental 100 million in gross cost savings this year which includes 27 million in operating expense run rate savings and 18 million in CAPEX, savings. As a result, we generated strong bottom line performance with net income improving 20% to $245 million and earnings per diluted share growing 22% to 72 cents. Free cash flow was $171 million more than tripling year over year, primarily driven by higher adjusted EBITDA, and lower capital expenditures. Turning to the segments, Sirius XM Holdings Holdings generated $$1.6 billion in first quarter revenue with subscriber revenue up 1% to $1.5 billion, supported by ARPU, increasing 1% to $14.99. This reflects the benefit of recent pricing actions including the February adjustment and the carryover benefit from the March 2025 change,. Sirius XM Holdings advertising revenue declined, 10% to $35 million primarily due to softness in news, while equipment and other revenue at $41 million and $31 million respectively were relatively flat year over year. Gross profit increased 3% to 966 million with margin expanding to 61% while a softer auto environment, particularly following last year’s tariff driven pull forward in vehicle sales, created headwinds for trial starts. New acquisition programs and retention are supporting healthier subscriber trends. Self pay net additions were negative 111,000, a 192,000 increase versus the prior year period. This was driven in part by growing adoption of companion subscriptions which contributed 124,000 incremental self-pay net additions in the quarter. As a reminder, the companion offering is targeted to our most loyal subscribers and engagement has remained strong with continued marketing support and early indicators showing improved retention among those taking advantage of this benefit. This performance was further supported by continued progress in our continuous service initiative as well as momentum in automotive dealer extended duration plans. More than offsetting lower conversion rates, the stability of our subscriber base remains a core strength reflected in first quarter self paid churn of approximately 1.5%, the lowest first quarter level in our history. Notably, Churn remained resilient despite recent pricing actions as we continue to evolve our packaging and pricing structure to better meet demand across different customer segments. With more than half of our subscribers having been with us for over a decade, we believe this performance underscores the strength of our enhanced value proposition and sustained customer satisfaction. Moving now to the Pandora and Off platform segments, revenue increased 3% to 501 million. Advertising revenue grew 5% year over year to 372 million, driven by a 37% increase in podcasting revenue and higher programmatic demand and technology fees, partially offset by lower advertising demand for streaming music. We continue to expect modest growth in advertising for the full year 2026. Subscription revenue declined 2% to 129 million due to a smaller subscriber base segment. Gross profit for the quarter was 139 million with a margin of approximately 28%, representing a slight decline from 29% in the prior year period. As part of our ongoing efforts to simplify the business and sharpen our focus on higher return initiatives, we recorded a $6 million charge in the first quarter associated with restructuring and severance costs, which compares to 48 million in the prior year period. I’d also like to provide some context on the higher depreciation this quarter. As part of our ongoing portfolio optimization, we have begun decommissioning and planning the deorbit of our FM-6 satellite, reducing its useful life from 15 to 13 years. With XXM10 now in service, this capacity is no longer needed. We expect approximately $60 million of incremental non cash depreciation in 2026, including 3 million in the first quarter. This has no impact on free cash flow, but will reduce reported net Income and EPS. Capital expenditures were 105 million in the first quarter, down from 189 million in the prior year period, primarily reflecting lower satellite spend and the timing of capitalized software and hardware investments. We continue to expect approximately 400 to 415 million in non satellite CAPEX, for the full year. Over time, total CAPEX, should trend lower with variability driven by the satellite replacement cycle. Near term spending remains elevated as we complete our next generation of satellites, after which we expect a step down to more normalized levels. Now moving to the balance sheet. During the quarter, we completed a successful $1.25 billion refinancing, allowing us to retire all 2026 notes and redeemed 250 million of 2027 notes, effectively extending maturities and strengthening our overall capital structure. And we remain on track to achieve our target leverage range of low to mid three times by the end of this year. We also continue to return capital to shareholders, including $91 million in dividends and $21 million in share repurchases. From a financial perspective, we are operating with discipline in a more dynamic macro environment. Our focus remains on what is in our control, driving efficiencies, optimizing the portfolio and prioritizing high return investments. This positions us to reaffirm our 2026 outlook for relatively stable revenue and adjusted EBITDA, modestly lower self paid net additions versus 2025 and continued growth in free cash flow to approximately 1.35 billion with a path to $1.5 billion in 2027. The durability of our subscription model and …

Full story available on Benzinga.com

This post was originally published here

Phathom Pharmaceuticals (NASDAQ:PHAT) released first-quarter financial results and hosted an earnings call on Thursday. Read the complete transcript below.

This content is powered by Benzinga APIs. For comprehensive financial data and transcripts, visit https://www.benzinga.com/apis/.

Access the full call at https://edge.media-server.com/mmc/p/7p8xmx5g/

Summary

Phathom Pharmaceuticals reported a significant year-over-year revenue growth of 104% in Q1 2026, with revenues reaching $58.3 million, indicating strong demand for their gastroenterology-focused product, Voquesna.

The company expanded its sales team by 50 representatives, aiming to enhance its presence in the gastroenterology market. Its strategy focuses on increasing market share among gastroenterologists, targeting a 20-30% share to achieve $1 billion in annual revenue.

Phathom Pharmaceuticals maintained its 2026 revenue guidance at $320 to $345 million, expecting growth to be more pronounced in the second half of the year. The company anticipates achieving operating profitability by Q3 2026 and positive cash flow in 2027.

The company is preparing for potential competition from a new PCAB entrant in 2027 but remains confident in Voquesna’s clinical efficacy and market position.

Phathom Pharmaceuticals plans to leverage its cash flow and strong balance sheet to consider strategic investments and potential M&A opportunities, focusing on complementary GI assets.

Full Transcript

OPERATOR

Hello and welcome to Phathom Pharmaceuticals first quarter 2026 earnings result call. At this time, all participants are in a listen only mode. After the presentation, there will be a question and answer session. To ask a question during the Q and A session, you will need to press Star 11 on your telephone keypad. Please be advised that today’s call is being recorded. With that, I would like to turn the call over to Eric Shkreli, Fathom’s Head of Investor relations. Please go ahead.

Eric Shkreli (Head of Investor Relations)

Thank you Operator. Hello everyone and thank you for joining us this morning to discuss Fathom’s first quarter 2026 results. This morning’s presentation will include remarks from Steve Basta, our President and CEO, and Sanjeev Narula, our Chief Financial and Business Officer. A couple of notes before we get started. Earlier this morning we issued a press release detailing the results we will be discussing during the call. A copy of that press release can be found under the news releases section of our corporate website. Further, the recording of today’s webcast and the slides we’ll be reviewing can also be found on our corporate website under the events and presentations section. Before we begin, let me remind you that we will be making a number of forward looking statements throughout today’s presentation. These forward looking statements involve risks and uncertainties, many of which are beyond Fathom’s control. Actual results may materially differ from the forward looking statements. Any such risks may materially adversely affect our business and results of operations and the trading prices for Fathom’s common stock. A discussion of these statements and risk factors is available on the current safe harbor slide as well as in the risk factors section of our most recent Form 10K and subsequent SEC filings. All forward looking statements made on this call are based on the beliefs of Fathom as of this date and Fathom disclaims any obligation to update these statements. Later in the call we will be commenting on both GAAP and non GAAP financial measures. Specifically in the scope of this discussion when we refer to cash operating expenses, please note we are referring to the non GAAP form of this measure which excludes non cash stock based compensation. As always, detailed reconciliations between our non GAAP results and the most directly comparable GAAP measures are included in this morning’s press release. With that, I will now turn the call over to Steve Bosta, Fathom’s President and CEO to kick us off. Steve.

Steve Basta (President and CEO)

Thank you Eric and thank you everyone for joining our call this morning. Let me start with a few highlights and a bit of perspective on the quarter, we more than doubled revenue from Q1 2025 to Q1 2026. We believe we’re on track to potentially achieving 1 billion in annual revenue from gastroenterology prescriptions with the potential for a second billion from primary care prescriptions as patients cycle back to share their Requesna experience with their pcp and we evolve our sales and marketing focus to include this segment in the future. In 2025, we set our strategy to focus on building toward that first $1 billion target in GI. We’re executing that strategy in Q1 of this year. We expanded our sales team with nearly 50 new sales representatives trained and deployed into the field in recent months. Our sales force alignment to enable high frequency calls on gastroenterologists is complete. We have more than 290 reps in place to start Q2. In parallel, we’re rolling out enhanced HCP marketing programs with several initiatives in the works to support the sales team. Our primary sales and marketing focus is on increasing depth of writing among gastroenterologists and associated providers. We’re encouraged by the impact we’re already having. There are approximately 20 million PPI prescriptions written annually from gastroenterology HCPs and we believe that 20 to 30% market share among this group should get us to the first billion in annual revenue. We previously discussed that as we look at our top 300 gastroenterology writers, they are already averaging about 20% TRX share compared to PPIs. Importantly, when we look at new to brand or NBRX writing among these early adopters, our market share is even stronger. In Q1, Requesna achieved approximately 45% NBRX market share compared to PPIs among this group of 300 writers. This means that our top 300 gastroenterology writers were selecting Requesna for their patients nearly one out of every two times that they switch their patient’s therapy to a new product. In fact, even as you look as deep as our top 3,000 gastroenterology writers in Q1, cumulative NBRX or new to brand prescription market share remains north of 30% in that population of physician writers compared to PPIs. We believe new to brand conversions drive future TRX growth as we expect that many of these patients who are converted to Requesna will elect to remain on Requesna. While Q1 TRX numbers showed expected seasonality, the underlying trends in prescribing behaviors and particularly new to brand switching to Vaquesna reinforce our view that our strategy of going deeper in gastroenterology is starting to show early positive indicators. We’ve transitioned the strategy and profile of this business and we believe the effects of those changes are still getting underway. I’d like to briefly discuss key financial highlights for the quarter and then Sanjeev will provide further commentary during his portion of the call with more detail. Net revenues were 58.3 million for Q1 compared to 28.5 million for the same quarter last year. We believe we’re seeing similar early year revenue patterns compared to last year, with late March and early April prescription trends indicating the growth going into Q2. We are thus maintaining our revenue guidance for the year. Cash operating expenses excluding stock based compensation were 56.2 million for Q1. Our team continues to exercise fiscal discipline in our operations and lastly, our net cash usage for Q1 operations was approximately 15 million. A few quick notes on commercial metrics for Q1 through April 17, about 1.35 million VaqDNA prescriptions have been filled with covered prescriptions increased about 5% during the most recent four week period compared to the prior four week period, signaling that growth that I previously described in recent weeks going into Q2. Of the approximately 268,000 prescriptions that were filled in Q1, about 168,000 were covered prescriptions representing approximately 63% of the total, while about 100,000 were filled as cash pay. The incremental IQVIA reporting gap mentioned on our previous call was resolved by mid March and the TRX numbers we are reporting today include the prescriptions that IQVA has not captured. On a year over year basis. Covered prescriptions grew about 91% and total prescriptions filled grew about 115%. The higher growth in total prescriptions reflects the impact of introducing the cash pay option for Medicare patients. As of April 2025, weekly TRX in March approached the previous December highs and now as we begin Q2, we’ve seen two of the first three weeks in April reach new all time prescription highs for covered prescriptions. I mentioned earlier that we view NBRX prescription growth as an early indicator of how our strategy is playing out. We believe NBRX writing is the leading signal for a growing patient base as it represents a patient being switched to Requesna prescriptions for the first time. Ultimately, many of these new to brand prescriptions progressed to consistent refill prescriptions in future quarters, thus driving growth. In Q1. We saw covered NBRX grow approximately 11% over Q4 of 2025, signaling that we are continuing to see a solid rate of new patient starts on Requesna the proportion of NBRX being written by gastroenterologists versus other specialties has increased over the last few quarters, indicating the early effect of our strategy focus on gastroenterology. Introducing more new patients with GERD Faquesna is the first step to drive durable growth. Persistent refills for these patients then contribute to growth in future quarters. Among the cohort of patients that started Requesna in 2024, we saw an average of approximately six bottles worth of Requesna dispensed over a subsequent 12 month period. One note on this analysis is that the analysis may actually understate persistence to some degree as an additional 18% of the patients who had stopped Requesna through that analysis actually restarted therapy within 12 months of their original prescription. Lastly, we’ve recently been hearing questions from investors about a possible new PCAB entrant into the US market. Internally, we’re preparing for a potential second PCAB approval in the US in 2027. Last week, two Tegoprazan abstracts related to the Erosive Esophagitis Phase 3 trial for this product were released ahead of this year’s DDW conference where the data will be presented next week. The abstracts provide a preliminary summary of the data. As anticipated, the tagoprazan results support the effectiveness of PCABs as a class, while cross trial comparisons have inherent limitations and the studies were not a head to head evaluation. It may be helpful to our investors to note that in Our Requesna Phase 3 Erosive Esophagitis trial, approximately 93% of patients in all categories of erosive esophagitis achieved healing of their erosions by eight weeks. In the separate recently reported Tagoprazan study, approximately 85% of patients in all categories of erosive oesophagitis achieved healing of their erosions by eight weeks. We continue to feel confident in Requesna’s robust clinical data profile and are executing our commercial strategy in the GERD market. Overall, we remain confident in our outlook for 2026. Our foundation is strong, the sales force is implementing our gastroenterology focused strategy and new patients continue to start therapy. We are fully in execution mode as we continue to work to drive TRX and sales growth. I’ll now turn the call over to Sanjeet to take you through our financial updates.

Sanjeev Narula (Chief Financial and Business Officer)

Thank you Steve and hello everyone. We have a lot to cover so let’s jump right into our Q1 results. Revenues for quarter one were 58.3 million reflecting year on year growth of 104% and a sequential growth of 1% over Q4 2025. Our Q1 2026 revenue was somewhat light compared to our internal expectation due to market access, seasonality and other factors like winter storm and deployment timing of new salesforce team members. However, with recent weekly prescriptions demonstrating growth relative to early Q1 and our extended sales force in place, we remain confident in our outlook for Requesna in 2026. Our gross-to-net discount for Q1 came in at the lower end of our 55 to 59% guidance range because of channel mix for CODIS prescription. Our gross margin was in line with our guidance at approximately 80% for quarter one as described during last quarter’s call. This now reflects certain third party fulfillment costs being accounted for as cost of goods sold instead of gross-to-net adjustments. Q1 cash operating expenses were about 56.2 million reflecting continued disciplined expense management. This sequential step up was anticipated and tied to three main drivers expansion of our sales force, our annual national sales meeting in February and the ramp up of our Phase two EOE trial. In fact, I’m pleased to report that the EOE trial is enrolling ahead of schedule and as a result we’re anticipating top line Data by late Q4 2026 or early Q1 2027. Importantly, we continue to demonstrate expense discipline across the organization. With the year on year cash operating expenses down about 43% compared to Q1 2025. We reported a loss from operation excluding stock based compensation of approximately 9.9 million. We ended the quarter with about $181 million in cash and cash equivalent which reflects roughly 15 million used in Q1. After netting out the flows from our equity raise and debt amendment, the increase in cash Usage compared to Q4 2025 was driven by the timing of our annual corporate bonus payout and changes in the working capital due to timing of certain payments. We anticipated these dynamics and remain confident in our path to operating profitability and cash flow positivity. Overall, our balance sheet remains strong and as a result of our operations and the deliberate capital structure enhancement we did at the start of the year. Based on our current operating plan, we believe our cash on hand along with the anticipated future cash generated from operations will be sufficient to invest in our business, satisfy all outstanding debt obligations at all times without the need for another debt or equity raise. Now let me speak about our financial guidance for 2026. We’re maintaining all guidance ranges and estimates provided during last quarterly call. We continue to anticipate 2026 net revenue between 320 to 345 million. We continue to believe our gross-to-net discount will be within the 55 to 59% range and gross margin will be approximately 80%. As for spend, we anticipate that cash operating expenses excluding stock based compensation will be between 235 to 255 million. As we think about cadence, we continue to believe revenues will be more heavily weighted towards the back half of the year. We expect expenses to modestly step up in Q2 reflecting full quarter’s worth of cost of the expanded sales force. Lastly, we continue to anticipate achieving operating profitability excluding stock based compensation by Q3 and for full year 2026 with positive cash flow in 2027. We remain focused on executing with discipline and we feel confident in our ability to deliver on our GI focused strategy. We ended the quarter with strong balance sheet and believe we will strengthen our financial position as revenues grow. In summary, our priorities remain clear. First, drive efficient growth towards achieving 1 billion from GI prescriptions. Second, support strategic investments where needed while continue to be disciplined on spend as we look ahead. I am encouraged by the efforts and dedication of our commercial and R and D teams. We’re energized by the opportunity in front of us and we believe our internal metrics show the momentum is building. With that, I will now turn the call back to Steve for his closing remarks. Steve?

Steve Basta (President and CEO)

Thank you Sanjeev for the detailed financial review. With an expanded and trained sales force executing our gastroenterology focused strategy and continued expense discipline, we believe we have a clear path to strengthening the revenue trajectory and achieving operating profitability in …

Full story available on Benzinga.com

This post was originally published here

Winners to be revealed on May 14 at the Awards Dinner during Chief Marketer Summit and Alpha Edge Americas in Fort Lauderdale.

NEW YORK, April 30, 2026 /PRNewswire/ — Institutional Investor (II), the award-winning finance and investment news publisher and industry-leading sponsor of investment conferences, today announced the finalists for the inaugural Institutional Investor Marketing Awards. The program recognizes the asset management industry’s most effective marketing campaigns and the leaders behind them, with winners to be unveiled at an awards dinner during the Chief Marketers Summit and Alpha Edge Americas, May 14 at The Ritz-Carlton, Fort Lauderdale.

The Institutional Investor Marketing Awards were established to spotlight the marketing strategies, creative work, and leadership shaping how asset managers connect with investors, advisors, and wider sector. Finalists were selected by a panel of senior industry judges based on strategic clarity, creative quality, measurable impact, and contribution to the broader practice of marketing in institutional finance.

These awards were created to reflect how institutional marketing operates today, as a discipline shaping growth, positioning and competitive advantage. What …

Full story available on Benzinga.com

This post was originally published here

On Thursday, Camping World Holdings (NYSE:CWH) discussed first-quarter financial results during its earnings call. The full transcript is provided below.

Benzinga APIs provide real-time access to earnings call transcripts and financial data. Visit https://www.benzinga.com/apis/ to learn more.

Access the full call at https://events.q4inc.com/attendee/625621973

Summary

Camping World Holdings reported a first-quarter revenue of $1.35 billion, with declines in new and used unit sales partially offset by a 4% increase in new vehicle average selling prices.

The company reduced SG&A expenses by more than $29 million, reflecting a significant improvement in operating efficiency, which included a $19 million reduction in compensation.

Camping World Holdings reiterated its full-year 2026 adjusted EBITDA guidance range of $275 million to $325 million, citing strong operational performance and strategic initiatives in inventory management and exclusive brand strategies.

The company reported a $28 million adjusted EBITDA for the first quarter, slightly down from the previous year, but with improved cash flows and a reduction in net debt leverage ratio from 8.1 times to 5.6 times.

Management highlighted strategic focus on AI initiatives for cost savings and efficiency improvements, and progress in its Good Sam ERP overhaul expected to drive future growth.

Full Transcript

OPERATOR

Good morning and welcome to the Camping World Holdings conference call to discuss financial Results for the first quarter ended March 31, 2026. At this time, all participants are in listen only mode and later we will conduct a question and answer session and instructions will follow at that time. Please be advised that this call is being recorded and the reproduction of the call in whole or in part is not permitted without written authorization from the company. Joining on the call today are Matthew Wagner, Chief Executive Officer and President Tom Kern,, Chief Financial Officer Lindsey Kristen,, Chief Administrative and Legal Officer Brett Andreas,, Senior Vice President in Investor Relations. I will now turn the conference call over to Lindsey Kristen,, Chief Administrative and Legal Officer. Please go ahead.

Lindsey Kristen (Chief Administrative and Legal Officer)

Thank you and good morning everyone. A press release covering the company’s first quarter ended March 31, 2026 financial results was issued yesterday afternoon and a copy of that press release can be found in the Investor Relations section on the Company’s website. Management’s remarks on this call may contain forward looking statements within the meaning of the Private Securities Litigation Reform act of 1995. These remarks may include statements regarding our business plans and goals, macroeconomic and industry trends, customer trends, inventory strategy, future growth of operations and market share, capital allocation, and future financial results and position. Actual results may differ materially from those indicated by these statements as a result of various important factors, including those discussed in the Risk Factors section in our Form 10K, our Form 10-Qs and other reports on file with the SEC. Any forward looking statements represent our views only as of today and we undertake no obligation to update them. Please also note that we will be referring to certain non GAAP financial measures on today’s call, such as EBITDA, adjusted EBITDA and Adjusted Earnings per Share diluted, which we believe may be important to investors to assess our operating performance. Reconciliations of these non GAAP financial measures to the most directly comparable GAAP financial measures are included in our earnings release and on our website. All comparisons of our 2026 first quarter results are made against the 2025 first quarter results unless otherwise noted. I’ll now turn the call over to

Matt

Matt Good morning everyone and thank you for joining our first quarter 2026 earnings call. I’m pleased to report that despite a challenging RV industry backdrop, we delivered a first quarter that demonstrates the discipline and operating leverage we discussed in our last call. These results are validation of the steps we believe will grow Adjusted EBITDA and generate strong free cash flow for the full year. Market conditions came in softer than expected, but the underlying quality of this quarter is what I want you to take away from this call. On a year over year basis, we reduced SG&A by more than $29 million or 7.5%. Improved our SG&A as a percentage of gross profit by 135 basis points. This is the transformation showing up in the numbers on this call. We’ll walk through the three priorities I laid out to start the year. Growing new and used unit share, driving SG&A efficiency and accelerating. Good Sam. Then I’ll close with our outlook for the year. Our new unit sales outpaced the industry According to SSI. New unit retail sales through February were tracking down in excess of 15%. We believe we outperformed the broader new RV sales market in every major category, driven largely by our exclusive brand strategy. Within the new fifth wheel segment, we were up nearly 10% year to date, driven by the introduction of private label products that hit compelling price points with unique features. On the used side, SSI data shows that the used RV industry has grown in six of the last eight months through February, reinforcing our strategic focus on this end market. While we saw positive signs of growth within certain categories, our same store used sales were down 2.6% in the quarter. We attribute the decline to January and February weather disruptions that limited our ability to aggressively move assets. More importantly, the year over year trajectory of our new and used volume improved as we move through March with new and used units in April trending to end the month slightly positive year over year. Moving to inventory and SG&A. Our message has been simple, disciplined execution drives profitability and our metrics at the end of April reflect that focus. As of today, our total same store RV unit inventory is down over 10% year over year and we have purchased over 20% less units year to date year over year. Even on fewer units in inventory. Our daily sales velocity for the month of April is positive versus last year. Our new model year 2025 inventory now sits at roughly 8% of total new inventory, down over 50% in units versus the same time last year on SG&A. I’m very pleased with our progress. The 135 basis point improvement in SG&A to gross profit and the $29 million reduction reflect a fundamentally lower cost basis, not one time savings. This includes $19 million of compensation reduction in the quarter and the consolidation of 13 store locations over the last year that sharpened the efficiency of our footprint on top of $29 million SG&A reduction fully realized in the quarter. We also executed about $10 million of additional annualized cost rationalization, bringing our year to date total to nearly $35 million of annualized cost savings. Looking ahead, we see the potential for significant cost takeout opportunities from the AI initiatives we’re rolling out across the enterprise with the bulk of that opportunity sitting within our IT spend. We expect these initiatives to drive material hard dollar savings and improvements in dealership productivity and the customer experience. Longer term, we believe we are building a leaner, stronger company with greater operating leverage and we expect that to translate into enhanced earnings and free cash flow. Good Sam. also made great progress in the quarter, continuing at top line growth pace while stabilizing margins to roughly flat year over year. We expect to complete our Good Sam. ERP overhaul in the second quarter which will allow us to accelerate entry into adjacent marketplaces and using AI. We have developed and deployed a custom in house CRM solution specifically for our extended service plan business and it’s already showing early signs of productivity conversion and revenue uplift. Good Sam remains a cornerstone of our long term growth and the early margin stabilization we are seeing reinforces our conviction in the opportunity ahead. Less than four months into this year, we believe the new RV industry is likely tracking towards the lower end of our 2026 retail outlook calling for 325,000 to 350,000 units, while the used RV industry is likely playing out towards the midpoint of our range which is between 715,000 to 750,000 units. We believe that the momentum we have built on new market share, on inventory, on SG&A and on Good Sam keeps us on track to grow Adjusted EBITDA year over year. Today we are reiterating our full year 2026 Adjusted EBITDA guidance range of 275 million to $325 million. With that, I will turn the call over to Tom to walk you through our financial results in more detail.

Tom

Thanks Matt. For the first quarter we recorded revenue of $1.35 billion.. New and used unit declines were partially offset by a richer mix with new vehicle average selling prices up approximately 4% year over year. On the new side specifically, we believe our unit volumes outpaced the industry in the quarter. As expected, vehicle gross margins were under pressure in the first quarter as we moved through assets in certain aging buckets. New vehicle gross margin declined 148 basis points to 12.2% and used vehicle gross margin declined 91 basis points to 17.7%. We expect this gross margin trend to continue through the second quarter, consistent with our commentary on last quarter’s call. Before beginning to improve in the back half of 2026 as we expect velocity and aging improvements to take hold. New ASPs should also continue to increase at a similar rate year over year as we progress through the second quarter. Within Good Sam, we were pleased by the sequential improvement in Gross margin from Q4, which is consistent with our expectations to yield returns on the significant operational investments we’ve made over the past 18 months. We believe Good Sam margins should show year over year improvements through the balance of the year. Our first quarter adjusted EBITDA of $28 million compared to 31.2 million in the first quarter of 2025. The decline in gross profit was largely mitigated by the $29 million SG&A reduction. We ended the quarter with $200 million of cash on the balance sheet and our net debt leverage ratio improved to 5.6 times compared to 8.1 times at the end of the first quarter of 2025. Our cash flows from operating and investing activities improved markedly year over year as we remain focused on our inventory turn goals and capex restraint. We also paid down $56 million of debt in the quarter. Our capital deployment framework continues to focus on strengthening the balance sheet while retaining growth capital within the business. With that, I will turn it back to Matt.

Matt

Thanks Tom. I’ll close with this. This was my first full quarter as CEO since stepping into the role at the top of the year, and while we’re still in the early innings of the plan we laid out on last quarter’s call, I am proud of what our team has accomplished so far. We took share, we pulled down cost, and we strengthened our balance sheet. Operator, we’re now ready to take your questions.

OPERATOR

Thank you ladies and gentlemen. We’ll now begin the question and answer session. Should you have a question, please press the star followed by the one. On your touchtone phone. You will hear a prompt that your hand has been raised. Should you wish to decline from the polling process, please press the star followed by the two. If you are using a speakerphone, please lift the handset before pressing any keys. One moment please for your first question. Your first question comes from Brett Jordan from Jefferies. Please go ahead.

Tasher Buckley

Hey good morning guys. This is Tasher Buckley on for Brett. Thanks for taking our questions. Certainly. I’m the F&I per unit. It looked like a pretty healthy step up. Could you talk a bit more about the dynamics there and what drove that and maybe the outlook more Yeah, it’s been a really fascinating dynamic where historically speaking, when our average sale price goes up that F&I penetration typically goes down a little bit and oftentimes it’s an immaterial amount, maybe you know, 25 to 50 basis points. But we have seen some interesting dynamics recently within the F&I segment. Specifically, we’ve been tracking the amount of down payment that consumers are coming into the finance office with, and therefore they also are looking to add on a number of different finance products in the back end. More specifically, we’ve recognized a pattern that those consumers that are buying more expensively priced assets, oftentimes in excess of $50,000 average sale price, are actually coming down with a higher down payment than we’ve seen historically. Whereas those consumers that are buying lower priced assets oftentimes under say, $25,000, they’re actually coming down, coming to the finance office with a little bit lower down payment amount. In either cohort though, we’re still seeing a higher product attachment. That is all the Good Sam Affinity products that we offer, be it roadside assistance, extended service plans, tire wheel protection, et cetera. So largely our inventory strategy has been derived from these trends that we’ve been seeing not only over the last few months, but even leading into this year, that there’s clearly this K-shaped economy that’s forming here. And those customers that are oftentimes buying those higher average sale price assets do have …

Full story available on Benzinga.com

This post was originally published here

FTAI Aviation (NASDAQ:FTAI) held its first-quarter earnings conference call on Thursday. Below is the complete transcript from the call.

This content is powered by Benzinga APIs. For comprehensive financial data and transcripts, visit https://www.benzinga.com/apis/.

Access the full call at https://edge.media-server.com/mmc/p/bjog6i8e

Summary

FTAI Aviation reported strong financial performance in Q1 2026, with adjusted EBITDA of $325.6 million, marking a 17% increase from the previous quarter.

The company is focusing on accelerating its market share growth in aerospace products, expanding production capacity, and launching new strategic capital vehicles.

FTAI Aviation provided a positive future outlook, reaffirming their EBITDA outlook of $1.625 billion for 2026, and announced a dividend increase.

Operational highlights include a significant increase in module production and a joint venture agreement with Jarrah Group for the power business.

Management expressed confidence in their strategic initiatives amid a challenging geopolitical environment, emphasizing strong demand and execution capabilities.

Full Transcript

OPERATOR

Good day and thank you for standing by. Welcome to the first quarter 2026 FTAI Aviation earnings Conference Call. At this time, all participants are listen-only mode. After the speaker’s presentation, there will be a question and answer session. To ask a question during the session, you will need to press star 1-1 on your telephone. You will then hear automated messages when your hand is raised to withdraw your question, please press star 1-1 again. Please be advised that today’s conference will be recorded. I would like to hand the conference over to your first speaker today, Alan Andrini, Investor Relations. Please go ahead.

Alan Andrini (Investor Relations)

Thank you Marvin. I would like to welcome you all to the FTAI Aviation first quarter 2026 earnings call. Joining me here today are Joe Adams, our Chief Executive Officer, David Marino, Our president, Nicholas McLease, Our chief financial Officer and Stacy Kuperis, our Chief Operating Officer. We have posted an investor presentation and our press release on our website which we encourage you to download if you have not already done so. Also please note that this call is open to the public in listen-only mode and is being webcast. In addition, we will be discussing some non-GAAP financial measures during the call today, including EBITDA. The reconciliation of those measures to the most directly comparable GAAP measures can be found in the Earnings Supplement. Before I turn the call over to Joe, I would like to point out that certain statements made today will be forward looking statements including regarding future earnings. These statements by their nature are uncertain and may differ materially from actual results. We encourage you to review the disclaimers in our press release and investor presentation regarding non-GAAP financial measures and forward looking statements and to review the risk factors contained in our quarterly report filed with the SEC. Now I would like to turn the call over to Joe.

Joe Adams (Chief Executive Officer)

Thank you Alan. The first quarter was a solid start to the year for us and we’d like to begin this morning by highlighting the key objectives for each of our businesses in 2026 and the progress we made during this first quarter across Aerospace products, strategic capital and power. We are scaling platforms with strong structural demand in a disciplined manner and deploying capital to support growth where we see the most attractive long term returns. I’ll start with aerospace products first. A top priority for us in 2026 is to focus on accelerating our market share growth as our production capabilities, parts procurement strategies and overall MRE customer adoption reach an inflection point. Now is the time for us to take full advantage of our competitive moat and focus on market share growth. As a reminder, we’re only five years into building our aerospace products business and as the business continues to mature and grow, we have the opportunity to leverage our our enhanced execution capabilities to take more market share more quickly from traditional engine maintenance shops. Second, as the market for the CFM56 and V2500 engines continues to mature, we’ve seen a notable increase in demand for leased engine solutions from top tier airlines, even those with in house engine MRO capabilities. We offer flexibility, customized pricing and scale that no one else can fulfill and these large programs are very sticky. It’s a key priority for us in 2026 to win more of this business. Third is production. We’ve always talked about expanding production capacity well ahead of growth, as well as adding maintenance facilities in parts of the world where we see strong traction with our customer base. It’s notable today that when you look at the map, we have no major maintenance facilities east of Rome, Italy. I’d expect this to look different when we are on next year’s first quarter call Turning to results Aerospace products results support the objective I just outlined, with top line revenue growth accelerating both year over year and quarter over quarter up 104% year over year and 32% quarter over quarter respectively. First quarter adjusted EBITDA of 223 million is an increase of 70% year over year and up 14% from 195 million in Q4 of 2025. EBITDA margins for the quarter of 30% are indicative of an increased mix of deals with large airline customers and a larger mix of full performance restoration shop visits. We expect this to be the trend line going forward as our capabilities have been built out and we’re able to bring volumes to the market that others simply cannot. Shifting now to strategic capital where our top priority is completing the deployment of the 2025 special purpose vehicle (SPV) or special purpose vehicle. Our deployment pace for the first vehicle has been strong and our engine maintenance focused approach to adding value to aircraft ownership has been well received by the market. As we approach the end of the second quarter, the 2025 special purpose vehicle (SPV) will be fully invested and we will shift from the deployment period to the harvest period where quarterly distribution will now begin. David will share more with you about the goals for adding value to the portfolio during this phase. As an active asset manager, we’re always pursuing ways to enhance the returns above what is the contractual lease stream. Our second area of focus for strategic capital is the launch of the 2026 special purpose vehicle (SPV). We continue to plan to have a first close at the end of the second quarter and we’ll start acquiring aircraft in the third quarter of this year. The investment strategy, 12 to 15 month deployment period and size of the vehicle will be consistent with the 2025 special purpose vehicle (SPV). Last to support the build of the strategic capital business, we’ve added to the team and now have over 40 dedicated individuals focused on sourcing, underwriting and servic the portfolio across offices in Dublin, Dubai, Cardiff and New York. The growth ambitions and differentiated strategy around engine maintenance has resonated in the market and we’ve been able to attract great talent to supplement our existing team and scale the platform. Finally, the F type power business continues to make strong progress towards its commercial launch in the fourth quarter of this year. This week we signed an important joint venture agreement with the Jarrah Group for packaging and customer conversions that are in advanced stages, both of which David will share more details about. Shortly before I pass it over to David, I want to address the conflict in the Middle east that began at the end of February. In the broader geopolitical environment our industry is navigating today, we are hopeful for a peaceful resolution and a return to more normal energy trading and prices, but we’re also realistic about some of the challenges of today’s environment beginning with aerospace products. Our exposure to the Middle east is limited. Less than 3% of our global current gen narrow body fleet is based in the region and we have very little customer exposure. More generally, we’ve not seen any meaningful change in shop visit demand to date. That said, elevated oil prices and fuel prices do negatively impact our customers financial situation and while this can create some volatility, it’s the exact environment where our FTI value proposition becomes even more critical to the customer. When an airline is facing a multimillion dollar engine shop visit in comparison to a faster lower cost engine exchange with fti, the decision is even easier to make when liquidity is top of mind. It’s also worth remember that airlines cannot meaningfully change their fleets in response to short term volatility. New aircraft orders are locked in for the next four to five years and the current generation aircraft will continue to be a vital part of the global fleet for many, many years. In short market share gains in aerospace products are much more consequential to us and compared to overall market growth. For strategic capital, periods of volatility create opportunities investment opportunities. When liquidity is tight, sale leaseback transactions help raise funds and avoid future shop visits. As the only lessor in the world that covers all engine maintenance for its aircraft portfolio, we are uniquely positioned to help airlines in this manner. And lastly for power Our business is largely insulated from the geopolitical dynamic today. The Mod one Our product runs predominantly on natural gas and to the extent we see additional aviation retirements, it will just provide additional feedstock to grow our conversion efforts. So I will now hand it over to David Moreno.

David Marino (President)

Thanks Joe. I will start by providing an update on aerospace products production. We refurbished 270 CFM56 module this quarter across our four facilities, an increase of 96% compared to Q1 2025. This is a good start to our 2026 production goal of 1,050 modules and continues to reflect the hard work of our fast growing team. As Joe mentioned, we have built a strong aerospace products foundation over the last five years and we are ready to further accelerate our market share growth. From a commercial perspective, we are seeing customer engagements expand to larger, more programmatic partnership as airline adoption accelerates. This is driven by both the overall market tightness as well as FTAI’s capabilities continuing to broaden to now include engine and module exchanges, engine leasing and aircraft leasing. We can’t emphasize enough the stickiness that that’s created. As our relationships with airlines and asset owners expand, we become a solution provider that is integrated into the operational plans for the airline’s future growth. Our close relationship with airline customers is something we are very proud of and we believe this will continue to accelerate our market share in the years to come. Next, I’ll share a further update on our strategic capital to support the full deployment of the 2025 SPD, we upsized the vehicle’s warehouse debt facility at the end of March, adding 1 billion of committed capacity. This facility is now 3.5 billion in size across 10 lenders, creating a strong roster of partners for our significant debt capital needs in the business going forward. As we mentioned last quarter, capital deployment for the 2025 is largely complete. We have closed 165 aircraft as of the end of Q1 and after we sign a few LOIs that are in process, all new aircraft will go into the 20. All new future aircraft will go into the 2026 special purpose vehicle (SPV). With the 2025 special purpose vehicle (SPV) transitioning from investment mode to harvest mode, we are very focused on maximizing the value of potential cash flows for our investors. We do this through active management of maintenance events, both airframe and engines, as well as through lease extensions. We continue to see strong desire from our airlines to fly current gen aircraft as long as possible, especially when they do not have to worry about engine shop visits. Our all in one solution of combining leasing and engine maintenance has resulted in many lease extensions and we believe this will continue to be an important trend in the portfolio. Finally, on FTI Power, I want to share updates on the timing of our commercial launch, our packaging integration and progress with customers. First, we remain firmly on track to commercially launch the Mod one in the fourth quarter and our prototype testing is actually running ahead of schedule. We have completed all the major mechanical testing milestones including testing our redesigned Mod 1 fan stage at synchronous speed and we expect to wrap up final testing in the third quarter. The results to date have exceeded our expectations. We have been also hosting customers on site to observe the MOD1 prototype directly and that has become an important part of how we sell this product. Second, as Joe mentioned, we signed a joint venture agreement with Jarrah Group, one of the leading packagers for mobile gas turbines. This is a foundational step for the program as Jarrah will be our primary partner responsible for taking our turbine and combining it with the mobile package that includes the key components like the generator and gearbox. Through the joint venture, we will draw on Jarrah’s manufacturing footprint across the United States, the uae, Canada and China, which gives us scale, geographic reach and a clear path to global product rollout. The joint venture de risks our supply chain, accelerates our speed to market and aligns the incentives of both parties across the long term success of the platform. Third, we are building a customer base committed to the long term deployment of the Mod one. The customer momentum we discussed last quarter has accelerated meaningfully. We are in deep and active negotiations with leaders across the energy and digital infrastructure landscape and every one of these deals is anchored by Long Term Service Agreement or LTSA on the turbine. One exciting element is that customers are coming to us with a range of commercial structures in mind from outright purchase to lease, which speaks to the flexibility of our model and the strength of the underlying demand. The interest in lease structure in particular fits naturally with our Strategic Capital Initiative and gives us the ability to offer customers a sought out after leasing solution while preserving capital efficiency. Several of these conversations are framed around multi year multi block deployment plans which gives us visibility well beyond 2027. Last, what has resonated most with customers is the maintenance model. The ability to swap a turbine in place in just two days rather than take the unit offline for an extended overhaul is a capability that power the industry. The power industry has not had to before and it translates directly into a lower levelized cost of energy or LCOE for the customer. Based on these conversations stand today we expect to be mostly sold out of our 2027 target production in the near term with a meaningful portion of 2028. Spoken for. Before I hand it over to Nicholas, I want to take a moment to congratulate him on his promotion to CFO as well as Mike Hazan on his promotion to cao. Both Nicholas and Mike have been key contributors to our operational success and their new leadership roles. They are positioned to have a large impact on our future success. With that, I’ll now hand it over to Nicholas to talk through the first quarter numbers in more detail.

Nicholas McLease (Chief Financial Officer)

Thanks David. The key metric for us is adjusted EBITDA. We started 2026 with adjusted EBITDA of 325.6 million in Q1 of 2026, which represents a 17% increase compared to 277.2 million in the fourth quarter of 2025. The $325.6 million EBITDA number was comprised of $222.6 million from our Aerospace Products segment, $153 million from our Aviation Leasing segment, negative $50 million from Corporate and other, including interest segment eliminations and startup expenses associated with our Power initiative. Aerospace Products delivered another good quarter with 222.6 million of EBITDA and an overall EBITDA margin of 30%. This is up 14% sequentially from 195 million in Q4 of 2025 and up 70% year over year compared to 131 million in Q1 of 2025, reflecting continued momentum from production growth and operating leverage. Turning to aviation leasing, the segment continued to perform well, generating approximately $153 million of EBITDA in the first quarter. This included $45 million of insurance recoveries, $12 million in gains on sale, $25 million from 2025 SPV management fees and co investment returns, and $71 million from leasing assets held on our balance sheet for insurance recoveries. In addition to the $45 million recognized in the …

Full story available on Benzinga.com

This post was originally published here

Editor’s Note: This article has been updated to correct the previously reported earnings per share (EPS) figure.

Sirius XM Holdings Inc. (NASDAQ:SIRI) released its first-quarter 2026 financial results Thursday morning. The satellite radio giant showcased resilient subscriber loyalty.

Revenue Beats While Earnings Face Slight Miss

The company reported quarterly sales of $2.091 billion. This figure surpassed the analyst consensus estimate of $2.070 billion. It also marked an increase over the $2.068 billion reported in the prior-year period.

On the bottom line, Sirius XM posted earnings of 72 cents per share. This beat the analyst consensus estimate of 67 cents. It represented a year-over-year increase from the 59 cents per share earned last year.

Profitability Surges

Net income rose 20% to $245 million. Adjusted earnings before interest, taxes, depreciation, and …

Full story available on Benzinga.com

This post was originally published here

Laureate Education (NASDAQ:LAUR) reported first-quarter financial results on Thursday. The transcript from the company’s first-quarter earnings call has been provided below.

Benzinga APIs provide real-time access to earnings call transcripts and financial data. Visit https://www.benzinga.com/apis/ to learn more.

Access the full call at https://edge.media-server.com/mmc/p/5xfu9y4q/

Summary

Laureate Education reported a strong start to 2026, with new enrollment growth of 13% in Peru and 4% in Mexico, aligning with their expectations.

The company reaffirmed its full-year guidance for enrollments, revenue, and adjusted EBITDA, and increased its guidance for adjusted earnings per share due to $105 million in share buybacks.

Mexico’s economic outlook is expected to improve in the second half of 2026, whereas Peru benefits from strong domestic demand and a business-friendly environment.

The first quarter revenue was $273 million with an adjusted EBITDA of negative $2 million, both ahead of guidance due to favorable FX rates and timing of expenses.

Laureate Education maintains a strong balance sheet with a net debt position of $60 million, and plans to continue returning excess capital to shareholders.

Full Transcript

Operator

Good day and thank you for standing by. Welcome to the Q1 2026 Laureate Education Inc. Earnings Conference call. At this time all participants are in a listen only mode. After the speaker’s presentation, there will be a question and answer session. To ask a question during the session, you’ll need to press star 11 on your telephone. You will then hear an automated message advising your hand is raised to withdraw your question. Please press star 11 again. Please be advised that today’s conference is being recorded. I would now like to hand the conference over to your first speaker today, Adam Morse, Senior Vice President of Finance. Please go ahead.

Adam Morse (Senior Vice President of Finance)

Good morning and thank you for joining us on today’s call to discuss Laureate Education’s first quarter 2026 results. Joining me on the call today are Iliff Sirkansen, President and Chief Executive Officer and Rick Buzkirk, Chief Financial Officer. Our earnings press release is available on the Investor Relations SECtion of our websitelaureate.net. we have also posted a supplementary presentation to the website which we will be referring to during today’s call. The call is being webcast and a complete recording will be available after the call. I would like to remind you that some of the information we are providing today, including but not limited to our financial and operational guidance, constitutes forward looking statements within the meaning of applicable US SECurities laws. Forward looking statements are subject to risks and uncertainties that may change at any time and therefore our actual results may differ materially from those we expected. Important factors that could cause actual results to differ materially from our expectations are disclosed in our Annual report on Form 10K filed with the U.S. SECurities and Exchange Commission, our 10Q filed earlier this morning, as well as other filings made with the SEC. In addition, all forward looking statements are based on current expectations as of the date of this conference call and we undertake no obligation to update any forward looking statements. Additionally, non GAAP measures that we discuss including and among others adjusted EBITDA and its related margin, adjusted net income, adjusted earnings per share, total debt, net of cash and cash equivalents and free cash flow are also detailed and reconciled to their GAAP counterparts in our press release or supplementary presentation. Let me now turn the call over to Iliff.

Iliff Sirkansen (President and Chief Executive Officer)

Thank you Adam and Good morning everyone. 2026 is off to a good start and we are encouraged by the results from our recently completed enrollment intake cycles which included Peru’s primary intake and a smaller secondary intake for Mexico. Enrollment results came in line with our expectations for both markets with year over year new enrollment growth of 13% in Peru and 4% in Mexico through completion of the intake cycles by the middle of April. With the intake snow finalized, we have good visibility into the remainder of the year and we are reaffirming our full year guidance for enrollments, revenue and adjusted EBITDA. We are increasing our guidance for adjusted earnings per share to reflect the $105 million in share buybacks completed during the first quarter, and we anticipate further share buybacks through the remainder of 2026 as return of excess capital remains a priority for the company. The enrollment intake results for the first cycle were in line with the macroeconomic trends we discussed during our last call for both Mexico and Peru. In addition, Peru is benefiting from continued strong penetration for our online offerings for working adult students. As a reminder, our business model is loosely correlated with economic cycles in periods of robust GDP growth, such as the current environment in Peru. We have historically benefited from strong enrollment momentum during a softer macroeconomic backdrop, as we are currently experiencing in Mexico. Our growth tends to moderate a bit, but we are still doing well as families continue to prioritize spending on higher education. Due to this strong value proposition in Mexico, GDP growth for 2026 is expected to remain relatively modest, albeit slightly better than 2025. President Scheinbron’s pragmatic leadership has helped preserve stability in the US Mexico relationship, providing for a constructive backdrop for the upcoming USMCA trade negotiations. Many economists are projecting an increase in economic activity for Mexico starting in the second half of 2026, setting the stage for more robust GDP growth in 2027. In Peru, the economy continues to perform solidly, bolstered by robust domestic demand, new mining projects and strong commodity prices. The Peruvians just elected a new Congress which reaffirmed a business friendly centre right majority and their presidential run of election is set for June. Regardless of the outcome of the presidential election, Peru has historically demonstrated economic strength and stability underpinned by strong underlying governmental institutions, a representative Congress, an independent central bank and a history of strong fiscal discipline. The foundation of our strong track record of performance is our mission, a mission to deliver affordable, high quality education to prepare students for successful career and lifelong achievement or while building pride, trust and respect within the communities we serve. We remain committed to transparency and accountability, measuring the outcomes that matter most and continuously improving how we track and report these results to all of our stakeholders. Earlier this month we published our 2025 impact report. I encourage you to visit our website and download a copy to learn more about the impact of the outstanding work of our students, faculty and institutions are currently doing in their communities throughout Mexico and Peru. Let me briefly highlight some of the most important measurable outcomes we delivered. Half of our newly enrolled students are first generation university attendees for whom a degree leads to their first professional role and a long term economic upward mobility for their families. 9 out of 10 of our job seeking graduates secure employment within 12 months of graduation, underscoring the relevance of our programs, strong alignment with industry needs and the expertise and commitment of our faculty and staff to prepare students for successful careers. And graduates of laureate universities in on campus programs recover the nominal cost of their education in approximately three years through increased earnings compared to high school graduates of the same age, and the payback period is even shorter for working adults in our fully online programs. These measurable outcomes align perfectly with our mission which is focused on quality, affordability and lifelong achievement. This concludes my prepared remarks and I will now turn the call over to Rick Boskirk for a more detailed financial overview of our first quarter performance as well as further details on our 2026 full year outlook.

Rick Boskirk (Chief Financial Officer)

Rick thank you Iliff. Before I discuss our financial performance for the quarter, let me provide a few important reminders on seasonality. First, campus based higher education is a seasonal business. The first and third quarters represent our two largest intake periods, which traditionally …

Full story available on Benzinga.com

This post was originally published here

Iron Mountain (NYSE:IRM) released first-quarter financial results and hosted an earnings call on Thursday. Read the complete transcript below.

This transcript is brought to you by Benzinga APIs. For real-time access to our entire catalog, please visit https://www.benzinga.com/apis/ for a consultation.

Access the full call at https://events.q4inc.com/attendee/171810269

Summary

Iron Mountain reported exceptional first-quarter 2026 results with a 22% year-over-year increase in revenue, adjusted EBITDA, and AFFO, driven by growth in data center, ALM, and digital businesses.

The company achieved 17% organic growth, the highest in over 25 years, with significant contributions from data center revenue, which rose 47%, and ALM business revenue, which increased by 92%.

Iron Mountain increased its full-year financial outlook, anticipating sustained revenue and earnings growth, and highlighted notable wins in government and commercial sectors, including a major contract with the U.S. Department of Treasury.

The digital solutions business saw over 20% growth, and the company was recognized as a Google Partner of the Year in Media and Entertainment.

The company continues to expand its government business, supported by achieving FedRAMP high authorization for its digital services suite, enabling pursuit of high-value federal contracts.

Management expressed confidence in continued double-digit growth, highlighting strong customer engagement in data centers and significant leasing activities.

Iron Mountain reported a record first-quarter operating cash flow, raised its projection for retained cash flow, and declared a quarterly dividend, maintaining a strong balance sheet and leverage ratio.

Full Transcript

OPERATOR

Good morning and welcome to The Iron Mountain first quarter 2026 earnings conference call. All participants will be in listen only mode. Should you need assistance, please signal a conference specialist by pressing the star key followed by zero. After today’s presentation, there will be an opportunity to ask questions. To ask a question, you may press star then one on your telephone keypad and to withdraw your question, please press star then two. We will limit analysts to one question and you can rejoin the queue. Please note this event is being recorded. I would now like to turn the conference over to Mark Roop, Senior Vice President of Investor Relationship. Please go ahead.

Mark Roop (Senior Vice President of Investor Relations)

Thanks, Rocco. Good morning, everyone and welcome to our first quarter 2026 earnings conference call. Joining us today are Bill Meaney, our President and Chief Executive Officer, and Barry Heitman, our Executive Vice President and Chief Financial Officer. After our prepared remarks, we’ll open the lines for Q and A. Today’s call will include forward looking statements which are subject to risks and uncertainties. For a discussion of the major risk factors that could cause our actual results to differ from these statements, please refer to today’s earnings materials, including the Safe harbor language on slide 2 of the earnings presentation and our annual and quarterly reports on Form 10K and 10Q. Each of these items, as well as reconciliations of non GAAP financial measures referenced during this call can be found on our investor relations website.

Bill Meaney (President and Chief Executive Officer)

With that, I’ll turn the call over to Bill. Thank you Mark and thank you all for joining us today to discuss our fInternal Revenue Servicest quarter results. As you saw in this morning’s release, we are off to an incredibly strong start to 2026. Our fInternal Revenue Servicest quarter results were exceptional above our expectations with 22% year over year growth for revenue adjusted EBITDA and AFFO, our team’s execution of our growth plans and consistent delivery of value to our customers and continues to drive the record performance across our business. FInternal Revenue Servicest quarter organic growth of 17% is the highest rate we’ve achieved in more than 25 years. The outstanding results were driven by our growth business of data, data center, Asset Lifecycle Management (ALM) and digital, which grew more than 50% in the quarter and now exceed more than 30% of our total revenue. Moreover, our highly recurring physical records storage business delivered its best quarterly growth in years and is well on track to deliver its 38th consecutive year of organic storage rental growth. I’m also impressed with our commercial team’s progress in accelerating cross selling efforts in Asset Lifecycle Management (ALM) and digital. We had a very strong quarter of bookings across the business which sets us up well for the balance of the year. Following this strong performance and continuing the momentum into the second quarter, we are pleased to increase our full year financial outlook. Let me now share some of the highlights from the quarter and the confidence this provides as we look to sustain industry leading revenue and earnings growth in 2026 and beyond. Data center revenue increased 47% in the fInternal Revenue Servicest quarter. Industry demand remains very strong with hyperscalers continue to build out inference and cloud capacity. This has led to significant customer engagement across our portfolio and given our 400 megawatts of available to lease capacity energized over the next 24 months. We leased approximately 22 megawatts in the fInternal Revenue Servicest quarter and another 10 megawatts in April, positioning us at 32 megawatts leased year to date. We drove substantial growth in our asset lifecycle management business in the fInternal Revenue Servicest quarter with a 92% increase in revenue. This was fueled by a strong showing in both our enterprise and and decommissioning businesses, the later of which was mainly pricing beyond the favorable component price envInternal Revenue Serviceonment. The underlying strength of our business is being driven by our compelling and differentiated customer value proposition which continues to yield new customer wins and deeper expansion within our existing base. Our digital solutions business achieved record fInternal Revenue Servicest quarter revenue growing greater than 20% year over year. We continue to win traditional projects and new contracts across industry verticals for DXP, our AI powered digital solutions platform. Additionally, we won another Google Partner of the Year this month for Media and Entertainment, adding to the 2018 Google Partner of the Year award for AI and Machine learning and we also executed very well operationally. We drove expanded profitability across the business. We with adjusted EBITDA increasing 22%, we are still in the early phases of our long term growth journey and our opportunity has never been more clear and tangible. We operate in large and Growing markets with $170 billion Total addressable market and we continue to invest and execute growth strategies to fully capitalize on our opportunity. Now let me share some recent wins that illustrate the strength of our synergistic business model and commercial momentum. I want to start with providing an update on our government business. From the outset, we fInternal Revenue Servicemly believe that Iron Mountain was positioned to be a major beneficiary of efficiency and productivity efforts for governments across the world. Building on last year’s important award from the Department of Treasury, I am pleased to share that fInternal Revenue Servicest quarter bookings in the public sector were our second best in our company’s history. We are significantly expanding our government business across the world and and especially here in the US Let me highlight two of these wins. For one agency we will provide advanced digitization solutions to process millions of records and we will also securely manage over 29,000 cubic feet of physical documents. And for another agency, we are providing services for pathology operations including storage and tracking claims folders. We are just getting started and the outlook for additional government wins is promising. Our positive trajectory is supported by the federal certification for our Digital Services suite through the achievement of Federal Risk and Authorization Management Program (FedRAMP) high authorization for Insight. This will fundamentally shift our competitive stance for digital services within the US Public sector allowing us to pursue high value mission critical workloads across the federal landscape. To be sure our commercial momentum is in recent wins extend far beyond the government sector. Let me share some other wins across our business in records management, our insurance team signed a new deal with a Canadian insurance company to deploy our Smart Reveal solution where we will process more than 1 million files currently stored with us. We also signed a new multi year agreement with a global law fInternal Revenue Servicem to deploy our SmartSort solution across six US locations. We will process more than 2 million files and onboard an additional 60,000 cubic feet of physical storage, ensuring the customer effectively manages its complex compliance and fiduciary requInternal Revenue Serviceements. In digital solutions, we won an important new multi year agreement with a leading Brazilian clinical diagnostics fInternal Revenue Servicem. Iron Mountain’s DXP platform, leveraging AI capabilities will process over 20 million medical records. DXP will be fully integrated with the customer systems to reduce manual efforts, eliminate errors and ensure compliance for time sensitive clinical results. And we won a new contract with a US Healthcare center to improve patient data visibility. The win cuts across multiple lines of our services including SmartSort for more than 600,000 medical records and in digital solutions for nearly 12 million images. In our data center business, we cross sold to an existing Asset Lifecycle Management (ALM) decommissioning customer and leased to them our entInternal Revenue Servicee 16 megawatt Miami site as part of a 10 year contract to support expansion of its cloud platform. We also leased approximately 6 megawatts to enterprise customers in Q1 and in April we are pleased to have leased 10 megawatts in Amsterdam to a major global cloud player who is new to our portfolio and with whom we are having encouraging discussions regarding interest across our data center footprint. Turning to asset lifecycle management business, we are uniquely positioned as the industry leader with strong competitive advantages including our full service capabilities, unmatched global scale, reputation for security and ability to deliver exceptional value to our customers. This is translating into growth in the number and size of deals we are winning across our enterprise. In our data center decommissioning business. Let me highlight some of our wins A new multi year agreement with a global advertising company that consolidated its highly fragmented vendor base and selected Iron Mountain as its sole enterprise wide Asset Lifecycle Management (ALM) services partner. As part of the deal we will manage and secure decommissioning and remarketing of IT assets across more than 30 countries. We cross sold to one of our existing data center customers working to Recycle and reuse 75,000 IT hardware items across the US, Europe and APAC. And we signed a multi year agreement with a global technology leader to securely decommission, sanitize and remarket 60,000 drives. In conclusion, our team is delivering exceptional results. We are still in the early phases of our tremendous long term growth opportunity. Our set of services delivering differentiated value to our customers gives us high confidence in continued double digit consolidated top and bottom line growth across cycles. I would like to express my gratitude to my global colleagues for theInternal Revenue Service unwavering commitment and to our customers. I especially want to thank our colleagues in the Middle east who demonstrate the best of the Mountaineer culture as they navigate a challenging time in keeping themselves and families safe whilst continuing to serve our customers in the region. The exceptional stewardship provided by our Mountaineers to more than 240,000 customers remains a cornerstone of our ongoing success. With that, I’ll turn the call over

Barry Heitman (Executive Vice President and Chief Financial Officer)

to Barry Thanks Bill and thank you all for joining us to discuss our results. As you’ve heard this morning, we’re off to a strong start to the year. Our team delivered record first quarter performance across all of our key financial metrics, underscoring the significant momentum we have in the business in terms of the first quarter. Revenue of $1.94 billion was up $344 million year on year. This this was well ahead of the projection we provided on our last call, driven by continued strength across our business as compared to last year. Revenue increased 22% on a reported basis, 19% on a constant currency basis and 17% on an organic basis, while the change in foreign exchange (FX) rates contributed approximately $40 million in revenue year on year. I would like to note that this was slightly below what we had assumed in our outlook as the dollar strengthened following our last call. Looking at the $80 million revenue upside in the quarter, this was driven by outperformance in our ALM records management and data center businesses. Total storage revenue was $1.1 billion, up $146 million or 15% year on year. Total service revenue was $841 million, up $197 million or 31% from last year. Adjusted Earnings Before Interest, Taxes, Depreciation, and Amortization (EBITDA) of $708 million increased $128 million or 22% year over year. This exceeded the projection we provided on our last call by $23 million, driven by the revenue upside and operational efficiency. Adjusted Earnings Before Interest, Taxes, Depreciation, and Amortization (EBITDA) margin was 36.6%, an increase of 20 basis points from last year. Our margin performance was particularly impressive, especially when considering the substantial growth in our services revenue which naturally drives a mix headwind. Adjusted Funds From Operations (AFFO) was $426 …

Full story available on Benzinga.com

This post was originally published here

CCC Intelligent Solutions (NASDAQ:CCC) held its first-quarter earnings conference call on Thursday. Below is the complete transcript from the call.

This content is powered by Benzinga APIs. For comprehensive financial data and transcripts, visit https://www.benzinga.com/apis/.

The full earnings call is available at https://edge.media-server.com/mmc/p/uyqapt5m

Summary

CCC Intelligent Solutions reported a strong start to 2026 with total revenue growing by 12% year-over-year to $281 million, surpassing guidance. Adjusted EBITDA rose to $120 million with a margin expansion of 300 basis points to 43%.

The company emphasized its strategic positioning in an AI-driven world, highlighting significant adoption of its AI solutions, which contributed to one-third of its year-over-year growth. AI solutions now account for approximately 10% of total revenue.

A major renewal and expansion with a top five US auto insurer was secured, covering both traditional and AI products, showcasing strong revenue momentum. Additionally, the company made significant strides in the casualty segment, with new multi-year agreements with large insurers like Allstate.

The company continues to focus on expanding its product offerings and AI capabilities, with a strategic emphasis on solving rising complexity in the insurance economy, which is viewed as a key long-term growth driver.

Financial guidance for Q2 2026 anticipates revenue of $283 to $285 million, and full-year 2026 revenue guidance is raised to $1.155 to $1.163 billion, reflecting ongoing business momentum and strategic initiatives.

Full Transcript

OPERATOR

Good day and thank you for standing by. Welcome to the CCC Intelligence Solutions First Quarter Fiscal 2026 Earnings Call. this time, all participants are in a listen only mode. After the speaker’s presentation, there’ll be a question and answer session. To ask a question during the session, press star 11 on your telephone. You will then hear an automated message device and your hand is raised to withdraw your question. Please press Star one one again. Please be advised today’s conference is being recorded. I would now like to hand the conference over to your speaker today, Bill Warmington, Vice President of Investor Relations. Please go ahead.

Bill Warmington (Vice President of Investor Relations)

Thank you operator Good morning and thank you all for joining us today to review CCC’s first quarter 2026 financial results which we announced in the press release issued earlier this morning. Joining me on the call are Gitesh Ramamurthy, CCC’s chairman and CEO, Brian Herb, CCC’s CFO and Tim Welsh, CCC’s president. The forward looking statements we make today about the Company’s results and plans are subject to risks and uncertainties that may cause the actual results and the implementation of the Company’s plans to vary materially. These risks are discussed in the earnings releases available on our Investor Relations website and under the heading Risk factors in our 2025 Annual Report on Form 10K filed with the SEC. Further, these comments and the Q and A that follows are copyrighted today by CCC Intelligence Solutions Holdings Incorporated. Any recording, retransmission or reproduction or other use of the same for profit or otherwise without prior consent of CCC is prohibited and a violation of United States copyright and other laws. Additionally, while we will provide a transcript of portions of this call and we’ve approved the publishing of a transcript of this call by a third party, we take no responsibility for inaccuracies that may appear in the transcripts. Please note that the discussion on today’s call includes certain non GAAP financial measures as defined by the SEC. The Company believes these non GAAP financial measures provide useful information to management and investors regarding certain financial and business trends relating to the Company’s financial condition and the results of operations. A reconciliation of GAAP to non GAAP measures is available in our earnings release that is available on our Investor Relations website. Thank you. And now I’ll turn the call over to Gatesh.

Gitesh Ramamurthy

Thank you Bill and thanks to all of you for joining us today. We had a strong start to 2026 driven by continued customer demand and adoption. The first quarter total revenue grew 12% to $281 million above the high end of our guidance adjusted EBITDA was $120 million, also above the high end of our guidance and adjusted EBITDA margin expanded approximately 300 basis points year-over-year to 43%. We are now more than a year past the acquisition of EvolutionIQ and we continue to see strong momentum across the combined business. Today I want to focus on three themes that frame both our near term momentum and our long term opportunity. First, why CCC’s position to thrive in an AI driven world. Second, how their positioning is translating into strong tangible revenue momentum with several of the biggest companies in the world increasing their commitments to both our core and AI solutions. And third, why solving the problems caused by rising complexity for our customers in the insurance economy is a durable long term growth driver for ccc. Let me start with why CCC is positioned to thrive in an AI driven world. We can do this by first understanding the work our customers need to get done. The insurance economy spans many thousands of companies conducting hundreds of billions of dollars in commerce across tens of millions of unique claim events every year. They operate in a complex, highly regulated industry and may interact with dozens of other companies for any given claim. And the work they need CCC to help them get done are the things that directly drive the operating performance of their business. Take auto insurers for example, who on average pay out about 75% of their revenues on claims. They use the decision engines built into our solutions, uniquely configured for their specific needs to help them pay what they owe. They use the CCC network to activate the tens of thousands of companies they need to integrate with to get consumers back to their lives. And they use the CCC platform to manage that work end to end. In effect, they rely on CCC to manage the most complex, mission critical and consequential work they do. This is true not only across our auto insurance customers, but also each of the more than 35,000 businesses we work with. That translates to CCC’s economic model. We price our products on the measurable value we provide, typically on a five to one ROI basis. We have cumulatively invested billions of dollars in our platform and have deep industry leading functionality. But customers buy our technology because of the real world outcomes they’re able to achieve only by using our solutions to impact the hundreds of billions of dollars we help them process annually. CCC’s data is unique in its combination of scale, depth and recency. We have over $2 trillion of historical data that simply does not exist anywhere else. The data is broad, deep and continuously updated in real time, allowing us to provide benchmarks customers use to assess their operations and to provide hyper local up to the minute inputs that inform hundreds of billions of dollars in individual payouts and repairs. We also take special pride in the trust our customers place in us as partners in their business. Our role connecting the ecosystem has been built on decades of consistent, high quality execution where each participant can feel confident in being able to deliver the best outcome for them and the consumer. Importantly, the outputs generated using our solutions are already accepted and embedded in the core operations of their trading partners. It is therefore no surprise that customers are increasingly looking to accelerate their AI ambitions by leveraging the CCC Intelligent Experience Cloud. Our AI solutions have been the fastest growing part of our portfolio for some time with a scale that has few equals in vertical software. In Q1, our AI based solutions drove approximately one third of our overall year over year growth, growing at roughly 3.5 times the total company growth rate. AI solutions are now approximately 10% of revenue or about $120 million in run rate. These solutions are entirely incremental to our core products with discrete value propositions and ROI that customers validate through intense piloting and testing, demonstrating both the durability of our core solutions and the rapid adoption of our AI tools. While we are tremendously excited about the growth in our AI products, the benefits of marrying AI with deterministic software are becoming increasingly evident to customers. It’s not an either or, it is an and. Governance and trust are bedrock principles in our industry and the efficiency of the CCC platform is particularly well suited to helping customers manage AI at scale. Our systems efficiently process almost 6 billion transactions per day, giving customers a battle tested platform that flexibly handles volume spikes and constant adjustments to their operating rules. To summarize our first theme, CCC is positioned to thrive in an AI driven world because we combine unique real time data embedded workflows and a trusted scale platform that allows customers to deploy AI safely, govern it effectively and realize measurable economic value. My second theme is the strong tangible revenue momentum across the business as several of the biggest companies in the world increase their commitments to both our traditional and AI products. CCC’s customer base includes 27 of the top 30 auto insurers in the US by 2024 direct written premium as well as multibillion dollar repair facility chains. These are some of the largest and most discerning companies in the world with incredible access to leading edge technology capabilities. We are thrilled that one of the top five auto insurers in the US by direct written Premium renewed and extended its partnership with CCC through a new multi year enterprise agreement. This agreement covers our entire auto physical damage suite as well as our entire portfolio of AI solutions related to auto fiscal damage. Following an extensive two year test of those capabilities, the insurer consolidated its APD business onto CCC several years ago and this new agreement both renews the core software relationship and adds the full AI layer, resulting in a meaningful step up in the value of the partnership. Our largest and most sophisticated customers are also deepening their commitment to the CCC platform by expanding the scope of their relationship into casualty. Casualty remains one of the largest growth opportunities for CCC. Our acquisition of EvolutionIQ expanded our capabilities in this area through the creation of medhub for Auto Casualty, an AI documents insight solution now embedded within the CCC platform. Medhub adds meaningful new functionality that is helping customers manage complex casualty workflows and is helping to advance our pipeline. Last quarter we announced at Liberty Mutual, the sixth largest auto insurer in the United States and one of the largest PNC insurers globally selected US. They have since begun deploying a significant portion of their casualty business on the CCC platform. In April we signed a multi year agreement with Allstate for their third party casualty business. All of these wins are validation of large customers increasingly recognizing that CCC’s platform and comprehensive suite of solutions represent their best path to embracing an AI driven future. This dynamic is playing out across our entire business, including on the repair facility side. Adoption of our core and AI solutions in the market continues to grow with more than 6,500 repair facilities now using our AI-estimating capability. our industry conference next month, we plan to introduce even more exciting innovations for the repair facilities. In summary, we are seeing this differentiated positioning translate into tangible revenue momentum as some of the largest insurers and repair organizations in the world deepen and expand their relationships with CCC across both our core software and AI solutions. My third theme is how solving for rising complexity is expanding CCC’s value proposition and driving long term growth. The most important structural trend in the insurance economy is rising complexity. Vehicles are more sophisticated, medical and casualty claims are more involved, regulatory requirements continue to increase. Every claim requires more decisions, more coordination and more judgment all the time. We see advancing vehicle technology as a significant tailwind for CCC over time with many new product possibilities on the horizon. The multi decade trend in advancing vehicle safety technology has shown a repeated pattern of frequency reductions being more than offset by increases in severity to fix these systems when they are damaged that causes claim dollars and complexity to rise, which grows the industry and creates additional growth opportunities for ccc. Over the past decade, personal auto claim counts declined by less than 1% annually while average dollars per claim grew approximately 6% per year, driving about 5% annual growth in total claims dollars paid. We believe that going forward, claims cost growth is going to outpace claim frequency moderation and our insurance customers will be managing an increasing level of total claim spend. That means our software and AI capabilities remain mission critical as customers manage growing claim complexity and spend over time. The rising complexity inherent in our industry combined with the growing appetite across our customer base to adopt both our core and AI solutions gives us confidence in our long term growth outlook. Stepping back the common thread across all three themes is rising complexity. As claims become more complex and customer appetite for AI increases, CCC’s platform data and workflows become even more essential, giving us confidence in a long term growth opportunity. To help us navigate towards that future, we have added another experienced technology leader to our Board of Directors, John Schweitzer. John brings more than three decades of leadership experience across enterprise technology and global go to market organizations including senior roles at Salesforce, Informatica, SAP and Oracle. With the addition of John, Neil DeCresenzo and Barack Elam over the last 18 months, we have deliberately strengthened our board to support platform strength, AI innovation and durable value creation while preserving neutrality across the ecosystem we serve. We are pleased with our strong start to the year and continue to be incredibly excited by our near term momentum and the long term opportunity in front of us. With that, I’ll turn the call over to Brian who will walk you through our results in more detail.

Brian Herb (Chief Financial Officer)

Thanks Gitesh. As Gitesh outlined, Q1 was a strong start to the year with revenue growth and profitability ahead of expectations, increasing adoption of our AI solutions across our largest and most sophisticated clients, and continued execution on our capital allocation priorities including return of capital to shareholders. Now let’s turn to the numbers. I’ll review our first quarter 2026 results and then provide guidance for the second quarter and the full year. Total revenue in the first quarter was $281 million, up 12% from the prior year period and above the high end of our revenue range. Please note that all this growth is organic. Of the 12% growth, 9% was driven by cross sell upsell and the adoption of solutions across our existing client base. Approximately three points of growth came from new logos within this position. We did see more than a point of impact from a combination of timing and one time items including true ups on subscription contracts and transactional strength in casualty. In the quarter, Emerging Solutions contributed about 4 points of growth. Primarily driven by EvolutionIQ are AI based APD solutions, diagnostics and build sheets. Emerging Solutions continue to represent an important and expanding part of the portfolio, accounting for approximately 11% of the total revenue in the first quarter of 2026 and growing approximately 50% year over year with the largest contribution from our AI Solutions. Turning to our key metrics of Software Gross dollar Retention or GDR in software Net dollar Retention or mdr, GDR captures the amount of revenue retained from our client base compared to the prior year period. In Q1 2026 our GDR was 98% down from 99% last quarter. Please note that since we started reporting this …

Full story available on Benzinga.com

This post was originally published here

Chinese President Xi Jinping has called upon the nation to step up its efforts in research and innovation.

Xi, while addressing a symposium in Shanghai on Thursday, underscored the importance of basic research as the cornerstone of the entire scientific system, reported the South China Morning Post. 

He pointed out that global tech rivalries are increasingly centered on basic and frontier fields, making “original and disruptive innovation” essential.

Xi also called for increased funding for basic research and the development of a more diversified investment landscape. He demanded better conditions for researchers and a stronger innovation environment that is “open, inclusive and tolerant of failure”.

In 2025, Beijing spent about 280 billion yuan ($41 billion) on R&D, as national R&D spending rose steadily to over 3.92 trillion yuan ($570 billion).

data-variant=”card”
data-news-mode=”manual”

>


Read Also:

Scott Bessent Blasts Bernie Sanders For Hosting Chinese Scientists For …

This post was originally published here

PBF Energy (NYSE:PBF) released first-quarter financial results and hosted an earnings call on Thursday. Read the complete transcript below.

Benzinga APIs provide real-time access to earnings call transcripts and financial data. Visit https://www.benzinga.com/apis/ to learn more.

The full earnings call is available at https://events.q4inc.com/attendee/105930101

Summary

PBF Energy reported an adjusted net loss of $0.88 per share and adjusted EBITDA of $68.7 million for the first quarter, with notable disruptions from the Martinez refinery and global oil market conditions.

The Martinez refinery is in the final stages of its restart, expected to fully resume operations by the weekend, contributing positively to the company’s future output.

Management highlighted the strategic importance of U.S. refining infrastructure amid global disruptions, with a focus on leveraging coastal complexity and ensuring reliable operations.

The company achieved its 2025 target of $230 million in annualized savings from its Refining Business Improvement program and is on track for $350 million by the end of 2026.

Future capital allocation priorities include deleveraging the balance sheet and focusing on shareholder returns, especially given the anticipated strong market conditions.

Full Transcript

OPERATOR

Good day everyone and welcome to the PBF Energy First Quarter 2026 Earnings Conference Call and webcast. At this time, all participants have been placed in a listen only mode and the floor will be open for questions following management’s prepared remarks. If anyone should require operator assistance during the conference, please press Star0 on your telephone keypad. Please note that this conference is being recorded. It is now my pleasure to turn the floor over to Colin Murray of Investor Relations. Sir, you may begin. Thank you.

Colin Murray (Investor Relations)

Angeline. Good morning and welcome to today’s Call. With me today are Matt Lucey, our President and CEO, Mike Bukowski, our Senior Vice President and Head of Refining, Joe Marino, our CFO and several other members of our management team. Copies of today’s earnings Release and our 10Q filing, including supplemental information, are available on our website. Before getting started, I’d like to direct your attention to the Safe harbor statement contained in today’s press release. Statements that express the company’s or management’s expectations or predictions of the future are forward looking statements intended to be covered by the Safe harbor provisions under federal securities laws consistent with our prior periods. We’ll discuss our results excluding special items which are described in today’s press release. Also included in the press release is forward looking guidance information. For any questions on these items or other follow up questions, please contact Investor Relations after today’s call. I’ll now turn the call over to Matt Lucey.

Matt Lucey (President and CEO)

Thanks Colin. Good morning everyone and thank you for joining the call. Indeed, today is a moment with the disruption in the Middle East. The world is in greater need of the products we produce and therein lies the momentous opportunity for our company to perform and reward our shareholders for owning such critical infrastructure. Within pbf, the spotlight is squarely on Martinez. We are bringing Martinez back online and will shortly be supplying the California market with our full capabilities. This could not be coming at a better time for the West Coast California markets. There are three main areas of focus in terms of the restart at Martinez. The Cat Feed Hydrotreater, the Alkylation unit and the fcc. The Cat Feed hydrotreater and ALKI are up and both are running with the fcc. We expect to be making finished products this weekend. While the rebuild effort was completed in February, there is no question the restart took longer than expected. It was critical for us to ensure that all the work accomplished at Martinez over the last 14 months was capped off with a safe restart. Moving on to the broader environment, the events in the Middle east have caused the largest disruption ever in the oil markets. And the effects are indeed dramatic and constructive for PBF. Initially, approximately 15 million barrels per day of crude and 5 million barrels per day of product were trapped inside the Straits of Hormuz. The loss of crude barrels was most acutely felt in Asia. But the shortages have cascaded to other markets. 80% of the crude flowing through the Straits was destined for Asian refineries and those refineries in turn supplied products to many markets, including the US West Coast. As refining roads in Asia have been rationed due to lack of inputs, the loss of products has affected every market. Compounding this impact, the products stranded in the Arabian Gulf have tightened markets in Europe and subsequently the Atlantic Basin. In the near term, the markets will continue to adjust in real time to demand signals for both crude and products. Global pricing will dictate trade patterns. Increasingly, markets are calling for both US crude and US products to meet demand. While the US has been somewhat insulated, there are signs that demand is being impacted globally by both pricing supply issues. It has never been more evident that US refining is critical infrastructure. And this is most apparent in regions like the like the west coast and east coast that are short refined capacity and rely on imports from unstable sources to meet demand. It will take some time for trade patterns to normalize both during and and post the conflict in the Middle East. Refining fundamentals should remain strong throughout, supported by tight refining balances coupled with low product inventories around the world. Prior to this event, refining balances look constructive and the inevitable restocking should provide a favorable backdrop for quarters to come. PBF remains focused on controlling the aspects of our business that we can control. To be successful and enhance value for our investors, we must operate safely, reliably and responsibly, and we must do it as efficiently as possible. And with that, I’ll turn the call over to Mike Wachowski.

Mike Bukowski (Senior Vice President and Head of Refining)

Thank you, Matt. Good morning, everyone. Before updating on the progress of our refining business improvement program, I’ll provide a few comments on first quarter operations and our Martinez refinery status. Outside of the west coast, our refining system ran reasonably well. All of our refineries navigated record cold temperatures with minimal disruptions on the West Coast. As Matt mentioned, Martinez is in the final stages of its phased restart. The process to restore it has been methodical and required many levels of safety and process checks to ensure that all equipment was correctly manufactured and installed. Before we introduced hydrocarbons, the cat feed, hydrotreater and alkylation unit have been operating and producing finished products as well as the intermediates required for the startup of the fluid catalytic cracking unit this weekend. The Martinez team and a supporting cast too numerous to mention worked tirelessly to get us to this point. My thanks to all involved in the project. Additionally, while Martinez operations were being restored, Torrance underwent a turnaround early in the first quarter and with that event complete as a clean Runway for the remainder of 2026. I’m happy to report that we’re seeing progress from our RBI program. We achieved our 2025 target of $230 million of annualized run rate savings. This goal includes approximately $160 million of OpEx reductions against our 2024 benchmark and is incorporated in our full 2026 budget. While the ongoing Martinez process is causing some noise with the first quarter results, we are very comfortable in meeting or even exceeding our stated targets. While we are improving our maintenance and operational efficiency and reducing energy consumption, our main priority will always be to focus on safe, reliable and responsible operations across our system. With that, I’ll now turn the call over to Joe Varino for our financial overview.

Joe Varino

Thanks, Mike for the first quarter excluding special items, we reported adjusted Net loss of $0.88 per share, an adjusted EBITDA of $68.7 million. Our discussion of first quarter results excludes the net effect of special items, including $11.5 million in incremental OpEx related to the Martinez refinery incident, a $106.5 million gain on insurance recoveries, $313 million LCM inventory adjustment, a $9.4 million gain relating to PBS, 50% share of SBR’s LCM adjustment for the quarter, and approximately $9.4 million of charges associated with the RBI initiative, as well as other items detailed in the reconciling tables in today’s press release. PBS results reflect several unfavorable conditions that manifested in the first quarter both operationally and commercially. Capture rates for the quarter were negatively impacted by west coast operations, the higher flat price environment increasing the headwind of low value products, higher RINS expense and derivative losses recognized in the quarter. These capture headwinds more than offset benefits from the improving jet to diesel spreads and certain crew diffs. Operationally, our Torrance refinery was in planned turnaround during January and February, while our Martinez refinery restart was delayed. We built up inventory levels in the first quarter primarily in anticipation of the planned restart of Martinez. This occurred as global pricing for hydrocarbon surged on the back of the conflict in the Middle east, resulting in losses in our typical hedge program. Our results for the quarter reflect an aggregate derivative loss of a little over $200 million. Approximately half of this loss related to unrealized amounts expected to be mostly offset in the second quarter as the physical barrels run through our refining system. The $106.5 million gain on insurance recoveries related to the Martinez fire is a result of the fourth unallocated payment agreed to and received in the first quarter. This brings our total insurance recoveries to $1 billion net of our deductibles and retention, including the amounts received in 2025. Important to note, while the bulk of the spending related to Martinez is behind us, the claim is ongoing and we expect to recover incremental funds as we continue to work with our insurance providers towards potential additional interim payments and finalization of the claim in an expeditious manner, shifting back to our normal quarterly results. Discussion Also included in our results is an approximate $8 million EBITDA benefit excluding LCM Impacts related to PBS equity investment in St. Bernard Renewables FDR produced an average of 16,700 barrels per day of renewable diesel in the first quarter. FDR’s production was as expected, but results reflect the impact of improving market conditions in the renewable fuel space with the finalization of the RVO in March. With the setting of the 2026-27 RVO, the markets now have the ability to stabilize and should result in favorable margins. PBF’s cash used in operations for the quarter was $324 million, which includes a working capital draw of approximately $340 million, mainly due to movements in inventory and the impact on our net payable position as a result of rapidly moving commodity prices. On our last call we mentioned our expectations for elevated first quarter CapEx and working capital outflows primarily related to the Martinez restart and normal seasonal inventory patterns. The capital spending for the Martinez rebuild is essentially behind us and we expect working capital normalize as operations restart and full cash Invested in consolidated CapEx for the quarter was $320 million which includes refining, corporate and logistics. This amount excludes first quarter capital of approximately $189 million related to the Martinez incident. On the surface, the Q1 figure might be slightly higher than expected and this is because it includes approximately $100 million of net carryover from 2025 that had not been cash settled at year end. The balance is our normal quarterly incurred amount including including the turnaround at Torrance. Given that and the noise related to the Martinez rebuild, it would be helpful to more broadly consider the 2025 and 2026 capital programs over a two year period. We ended the quarter with $542 million in cash and approximately $2.3 billion of debt to debt. At quarter end, our net debt TO cap was 36% and our current liquidity is approximately $2.4 billion. Based on current commodity prices, cash and borrowing capacity. Under our abl, our net debt increased in the first quarter due to planned capital expenditures, continued spend on the Martinez restart and working capital outflows, primarily related to a build in inventory going forward. Inventory should normalize as operations ramp up and we should see a resulting tailwind in working capital cash flows. Additionally, with our capital spend for the Martinez rebuild predominantly behind us, we expect to further progress our Martinez insurance claim and receive additional payments once realized. These factors alone should principally offset the increase in net debt experienced in Q1. Maintaining our firm financial footing and a resilient balance sheet remain priorities as we look ahead. We expect to use periods of strength to focus on reducing both our gross and net debt Operator, we completed our opening remarks and we’d be pleased to take any questions.

OPERATOR

Thank you. In a moment we will open the call to questions. The company requests that all callers limit each turn to one question …

Full story available on Benzinga.com

This post was originally published here

Diebold Nixdorf (NYSE:DBD) held its first-quarter earnings conference call on Thursday. Below is the complete transcript from the call.

This transcript is brought to you by Benzinga APIs. For real-time access to our entire catalog, please visit https://www.benzinga.com/apis/ for a consultation.

Access the full call at https://events.q4inc.com/attendee/130415367

Summary

Diebold Nixdorf reported strong financial performance for Q1 2026 with a 6% increase in revenue to $888 million and a 14% rise in adjusted EBITDA to $99 million.

The company saw significant growth in its retail segment, especially in North America with a 70% increase and strategic wins in electronic point of sale and self-checkout deployments.

Free cash flow more than tripled year over year to $21 million, marking the sixth consecutive quarter of positive cash flow, with expectations to maintain this trend.

Strategic initiatives in banking focused on expanding ATM and branch automation solutions, with notable wins in teller cash recyclers and branch network upgrades.

Management highlighted ongoing operational improvements, including a lean approach to cost reduction and enhancements in service operations, contributing to margin expansion.

Future guidance remains positive with projected revenue between $3.86 billion and $3.94 billion for 2026, and continued commitment to shareholder returns through a $200 million share repurchase program.

Full Transcript

OPERATOR

Hello, good day and welcome to Diebold Nixdorf’s first quarter 2026 earnings call. My name is Carli and I will be coordinating today’s call and our speaker’s remarks. There will be a question and answer session. In order to ask a question, please press STAR followed by the number one on your telephone keypad. I’d now like to turn the call over to our host, Maynard, Vice President of Investor Relations. Maynard, please go ahead.

Maynard (Vice President of Investor Relations)

Hello and welcome to our first quarter 2026 earnings call. To accompany our prepared remarks, we posted our slide presentation to the Investor Relations section of our website. Before we start, I’ll remind all participants that you will hear forward looking statements during this call. These statements reflect the expectations and beliefs of our management team at the time of the call, but they are subject to risks that could cause actual results to differ materially from these statements. You can find additional information on these factors in the company’s periodic and annual filings with the SEC Participants should be mindful that subsequent events may render this information to be out of date. We will also discuss certain non GAAP financial measures on today’s call. As noted on slide three, reconciliations between GAAP and non GAAP financial measures can be found in the supplemental schedules of the presentation. With that, I’ll turn the call over to Octavio who will begin on slide four. Thank you, Maynard.

Octavio

Good morning everyone and thank you for joining us. The first quarter was a strong start to the year and another quarter of delivering on our commitments. Continuing the operating momentum we have built. We grew revenue 6% year over year to 888 million and adjusted. EBITDA increased 14% to 99 million. At the same time, backlog grew sequentially to approximately 790 million, reinforcing the underlying demand we’re seeing across both banking and retail. In banking we continue to build on the strength of our core ATM franchise while expanding our role inside the branch. We are seeing good momentum in Teller, cash recyclers and broader branch automation which are increasing our relevance with customers and expanding our opportunity set. In retail, we’re seeing growth accelerate as we expected with revenue up double digits. In North America we’re gaining critical mass with a large and growing pipeline of deals and had important wins in electronic point of sale and in the fuel and convenience space and with a regional grocer and in self checkout we delivered initial deployments with a large pharmacy chain. In Europe, we had a large number of electronic point of sale wins that drove growth. Free cash flow continues to be a clear point of strength. We generated 21 million in Q1 more than tripling year over year. This marks our sixth consecutive quarter of positive free cash flow and and we expect to remain consistently positive each quarter going forward. We maintained our fortress balance sheet, ending the first quarter with a net debt leverage ratio of 1.2 times while remaining fully committed to returning the majority of our free cash flow generation to shareholders through our $200 million share repurchase program. We had a strong quarter, we did what we said we would do and importantly, this performance reflects the continued compounding of the strategic and operational improvements we have implemented. Let’s now turn to Slide 5 to review our banking strategy. In banking, we continue to see supportive secular tailwinds. Financial institutions are investing in their branch networks to improve efficiency and enhance the customer experience, while at the same time referring to remaining under pressure to lower the cost to serve. Importantly, in the US we’re seeing a shift from prior years with leading financial institutions actively expanding their branch footprints. That is creating a clear need for solutions that both improve the customer experience and structurally reduce the operating cost. Our strategy is built for that environment. We go beyond the ATM to help banks automate and run the entire branch ecosystem, combining hardware, software and services to improve customer experience, employee efficiency and overall branch economics. The objective is straightforward take costs out while improving service levels. Our integrated ecosystem optimizes how cash moves through the branch, reducing the need for cash in transit activity and the expense that comes with it. Because the best cost is no cost, this is a key differentiator in how we approach the market. We use technology to eliminate costs and improve the customer experience, not just to manage or reallocate it. We’re seeing that the strategy translates into results across three areas. First, in our core self service business, recycling ATMs continue to gain momentum across customer segments and geographies. In the US we won a full network upgrade with a major credit union based in the Southeast with more than 1 million members, deploying over 200 EM Series cash recyclers across their footprint. This is a strong proof point that recyclers are gaining traction across a broad range of institutions. Second, inside the branch, we’re expanding our footprint with telecast recyclers and branch automation solutions. During the quarter we secured a significant competitive displacement with one of the largest financial institutions in the US winning 100% of their teller cash recycler installed there. In addition, we were selected by Forex as the single trusted partner to manage and optimize their ATM network end to end, reinforcing our ability to deliver both operational efficiency and service performance at scale. At the same time, we’ve grown our pipeline and backlog in India for our fit for purpose devices and we have plans to expand this product family into additional markets across Asia. We also plan to extend our teller cash recycler footprint into international markets, further broadening our addressable opportunity. Third, we are increasingly orchestrating how transactions are processed and routed across multiple customer touchpoints. During the quarter, we won a major engagement with a leading US Financial institution to modernize transaction processing across thousands of branches. Our platform supports transactions not only at the atm, but also at the teller and across digital channels, enabling banks to manage and optimize transaction flow across both physical and digital environments. And importantly, these are not standalone wins. They are part of a broader strategy to increase our integration and wallet share within the branch and transaction ecosystem. When customers deploy across ATMs, seller cash recyclers and software, it creates a natural path to broader branch automation, spinning our relationships and expanding our role over time. Stepping back, we’re executing well. We’re strengthening our core, expanding inside the branch and using technology to structurally improve cost and performance for our customers while also extending our reach into new geographies. Now moving to slide 6 turning to retail, we delivered a very strong Q1 with revenue growth north of 25% year over year and we continue to see strong momentum building across the business as we move through the year. In North America, the traction we’re building continues to strengthen. About a year ago we identified our top 40 target accounts and today we have active projects with the vast majority of them. Our pipeline has grown approximately threefold over that period and that momentum is converting into wins. During the quarter we secured a major deployment with the top 10 fuel and convenience retailer for thousands of point of sale units. In addition, we won an initial self checkout deployment with a leading pharmacy chain and scored an electronic point of sale win with a regional grocer in the U.S. both of those opportunities create pathways for much larger rollouts over time. We’re encouraged by the quality of the opportunities in front of us and increasingly confident in our ability to convert that pipeline into meaningful growth. As the year progressed in Europe, we continue to see strong execution with solid point of sale performance and wins across multiple markets. Now turning to Smart Vision AI, we are positioning Smart Vision as a platform that supports multiple use cases across the store. It delivers strong ROI by reducing, shrink, improving operational efficiency and enhancing the checkout experience. What started at the self checkout has now expanded across additional parts of the store from the aisle to demand checkout, demonstrating the flexibility and scalability of the platform, we are already seeing early adoption. One of the largest retailers globally has deployed Smart Vision in several stores to address shrink across both the aisle and the point of sale. And strategically, this platform is opening doors. It allows us to engage earlier with customers, often starting with a targeted use case and then expanding into broader discussions around self checkout, point of sale and software. That creates a natural path to larger, more strategic programs over time. This also aligns well with where the market is going. Retailers, particularly in North America, are increasingly prioritizing open modular solutions. That’s the model we’ve already proven in Europe. We’re pleased with the strong momentum we’re seeing across retail. Our focused account strategy is working, our pipeline is building and our platform approach is positioning us to continue expanding share turning to slide 7 in services, we’re making solid progress as we previously indicated. Margins are modestly down year over year as we continue to invest in the business to strengthen execution and service quality. However, these investments are progressing as planned and positioning us for sequential margin expansion. As we move through the year, these investments are delivering results. We are now achieving some of the highest service levels in our history in North America with meaningful improvements in SLA and overall availability. That level of performance is critical as it drives customer satisfaction, supports product growth and increases service attach rate over time. At the same time, as we expand our installed base across banking and retail, we’re increasing service density which drives incremental, highly recurring revenue without the proportional increase in cost. We’re also entering the next phase of our efficiency journey with the rollout of our field technician software. We now have much more granular visibility into operation, allowing us to optimize dispatch routing and parts management. For example, in Chicago, a cross functional team used these tools to redesign service zones, improving first time fixed rates, reducing drive time and lowering dispatcher requirements. We’re now scaling those learnings across additional markets so overall we’re seeing the right progression, stronger execution, a growing install base and increasing opportunities to drive efficiency and margin expansion. Now let’s turn to slide 8. Our approach to continuous improvement is now a core part of how we operate the business and has become a meaningful competitive advantage in how we execute. This is not just a set of initiatives, it is an operating rhythm and cultural shift across the organization. Were focused on identifying incremental improvements, scaling them across the enterprise and compounding those gains over time to drive margin expansion and reduce complexity. We are seeing that translate into tangible results. During the quarter we held Kaizen events across Our Asia Pacific Service and logistics operations focused on improving repair cycles, dispatch efficiency and billing capture. These efforts are generating both cost savings and incremental revenue and more importantly, they are repeatable and scalable across our network. In manufacturing, we’re also driving meaningful improvements. In North Kansas we reduced our sub assembly footprint by about 40%, freeing up space for additional future production capacity. Similarly, in Brazil we redesigned our manufacturing process, reducing footprint by approximately 50% while increasing capacity and reinforcing our local for local strategy. These are good examples on how we’re simplifying the business, improving productivity and structurally strengthening margins. To put that in context, remember when I first took over as CEO and prior to launching lean product banking margins were in the low teens. This quarter they were above 30%. Lean has been a key driver of the margin profile you’re seeing today. During the quarter we received multiple global banking and finance awards recognizing innovation and the strength of our end to end banking solutions and we were added to the S and P small cap 600 index earlier this month. That inclusion reflects the consistency of our execution, the discipline we’ve built into the …

Full story available on Benzinga.com

This post was originally published here

Trinet Group (NYSE:TNET) reported first-quarter financial results on Thursday. The transcript from the company’s first-quarter earnings call has been provided below.

This transcript is brought to you by Benzinga APIs. For real-time access to our entire catalog, please visit https://www.benzinga.com/apis/ for a consultation.

Access the full call at https://events.q4inc.com/attendee/214291011

Summary

Trinet Group reported a strong Q1 2026 with a 25% increase in adjusted EPS due to disciplined health fee repricing and expense management.

The company completed its health fee repricing, expecting improved retention and sales growth, supported by new initiatives like the Cocoon acquisition and partnerships for global and IT services.

TriNet sees AI as a significant opportunity, with AI tools like TriNet Assistant improving operational efficiency and customer engagement.

Despite a 5% decline in total revenue to $1.2 billion, the insurance cost ratio improved to 84% due to effective pricing and lower health costs.

The company maintains its 2026 revenue guidance of $4.75 to $4.9 billion, with adjusted EBITDA margin and EPS targets aligning with the favorable end of their guidance.

Full Transcript

OPERATOR

Good day and welcome to the TriNet Group, Inc. First Quarter 2026 Earnings Conference Call. All participants will be in listen only mode. Should you need assistance, please do a conference specialist by pressing the star key. Follow a zero after today’s presentation there will be an opportunity to ask questions. To ask a question, you press star then one on your telephone keypad. To withdraw your question, please press Star then two. Please note this event is being recorded. I would now like to turn the conference over to Alex Bauer, Head of Investor Relations. Please go ahead. Thank you and good afternoon everyone. Joining me today are Irving Tan, WD’s chief executive officer and Chris Senecal, WD’s chief financial officer. Before we begin, please note that today’s discussion will contain forward looking statements based on management’s current assumptions and expectations which are subject to various risks and uncertainties. Thank you. Please stand by. The conference will resume. The speakers are live. I have connected speakers. Good morning everybody. Sorry for the technical snafu. My name is Alex Bauer. I’m head of TriNet’s investor relations. Thank you for joining us and welcome to TriNet’s first quarter conference call and webcast. I am joined today by our President and CEO Mike Simons and our CFO Mala Murthy. Before we begin, I would like to preview this morning’s call. First, I will pass the call to Mike for his comments regarding our first quarter performance. Mala will then review our Q1 financial performance in greater detail and comment on our 2026 financial guidance and outlook. Please note that today’s discussion will include our 2026 full year financial Outlook and other statements that are not historical in nature or predictive in nature, or depend upon or refer to future events or conditions such as our expectations, estimates, predictions, strategies, beliefs or other statements that might be considered forward looking. These forward looking statements are based on management’s current expectations and assumptions and are inherently subject to risks, uncertainties, changes in circumstances that are difficult to predict and that may cause actual results to differ materially from statements being made today or in the future. Except as may be required by law, we do not undertake to update any of these statements in light of new information, future events or otherwise. We encourage you to review our most recent public filings with the SEC, including our 10K and 10Q filings, for a more detailed discussion of the risks, uncertainties and changes in circumstances that may affect our future results or the market price of our stock. In addition, our discussion today will include non GAAP financial measures including our forward looking guidance for adjusted EBITDA margin and adjusted Net income per diluted share. For reconciliations of our non GAAP financial measures to our GAAP financial results, please see our earnings release, 10Q filings or 10K filing, which are available on our website or through the SEC website. Please also note that going forward, these filings may be released up to 48 hours after our earnings release. With that, I will turn the call over to Mike thank you Alex and good morning everyone. I’m pleased with our start to 2026. In the first quarter, the TriNet team kept our clients as our first priority, navigating a volatile business and geopolitical environment. For today’s call, I’ll start with our first quarter performance, then highlight the actions we’re taking to drive growth, and finally discuss the potential impacts of AI, a widely discussed subject during the quarter. Our strong first quarter adjusted earnings per share, up 25% over prior year, reflect our disciplined approach to both repricing health fees and managing our expenses. Health fee repricing over the last year created a headwind for new sales and retention, including our January 2026 renewal where attrition was about 2 points worse than prior year. Our pricing addressed both heightened medical cost trend and a cohort of underpriced business. With our January renewals complete, all cohorts within our customer base are now priced in line with more historical practices and despite the impact of our January repricing, we expect overall 2026 retention to be better than than full year 2025. We’re already seeing a tangible improvement here in the second quarter where attrition due to health pricing has already declined by 30%, a trend we expect to continue throughout 2026. New sales grew modestly year over year in the first quarter. The increasingly volatile business environment pressured March close rates for sales opportunities. In the post proposal stage, we saw the time to close extend by about 15%. However, given pipeline visibility, our pricing position relative to the market, and several sales initiatives that are coming online, which I’ll talk about in just a minute, we expect a solid full year sales growth for 2026 on insurance performance improved as we benefited from stable health cost trends and disciplined pricing, resulting in an 84% insurance cost ratio. A feature of our model is our ability to quickly respond to changes in insurance outcomes. We responded quickly to rising cost trends and will do so again if and when trends moderate. We remain disciplined on expenses, aligning the business to its current scale, automating processes, and advancing our talent optimization strategy. As a result, we delivered strong earnings and profitability in Q1 and we believe earnings are now tracking to the top half of our annual guidance. Our strong operating performance enables us to invest further in our products and services. Through acquisition partnerships and internal build efforts. We’re extending our value prop on issues our clients care about. These new capabilities in combination with our investment in sales capacity represent important steps in our return to sustainable growth. During the quarter we completed the acquisition of Cocoon, an industry leading employee leave management application. Aligned with our Compliance first approach, Cocoon should integrate seamlessly into our platform and address a significant customer pain point with an automated leave of absence solution. We expect improved NPS scoring and increased retention along with further competitive differentiation in our PEO and ASO offerings. Next, we announced partnerships powering Trinet Global and TriNet IT. TriNet Global, powered through our partnership with Multiplier, delivers global workforce visibility, compliance built workflows and localized support enabling our clients to expand internationally with confidence. TriNet IT, powered through our partnership with Electric AI, embeds device and asset management into HR workflows, reducing IT effort, lowering costs and improving security. We remain on track to deliver our new benefit bundles, simplifying the buying process and aligning the right set of plans with client needs. As benefit bundles are released during the second quarter, we expect to benefit from their impact during the fall selling season. Alongside these investments in our offering, we continue to invest in our go to market capacity. Our broker strategy is increasingly driving deal flow and sales opportunities. Broker RFPs grew by nearly 12% year over year in Q1 and we’re seeing Q2 broker RFPs accelerate off that number. We improved our broker experience with automated Trusted Advisor status and enhanced renewal access. In addition, we grew our most senior and productive sales reps by 10% year over year in Q1. Our Ascend program graduates its first class, which will represent over 10% of our sales focus this fall, and with more than 100 trainees in the pipeline by year end, we believe we can sustainably grow our sales force in 2027 both in terms of number and in terms of quality. In summary, we’re improving our product services and go to market capabilities. We’ve brought health fees in line with risk and increased the accuracy of our pricing processes going forward. As a result, we expect improved conversion rates on new business and higher retention rates in the client base. We’re moving quickly on numerous fronts, which is a testament to my colleagues across the company. Increasingly, their efforts are being enabled by investments in AI, which brings me to the last topic I wanted to touch on before turning things over to Mala. We certainly understand that AI is an important topic for all of our stakeholders and we see AI’s impact across two dimensions. First, its impact on Trinet’s operations sales service model and second, the external impacts on our client base and industry. Starting internally this March, we launched Trinet Assistant, an AI tool giving our customers and colleagues access to our HR expertise whenever and wherever needed. Already, Trinet Assistant is proving its impact. We just navigated tax season historically, a period that sees a significant spike in inbound volume. Between March 31 and April 16, inbound volumes typically increase on average by 12%. TriNet Assistant successfully handled much of that demand, driving a 6% reduction in inbound contacts through the busy period, delivering timely, accurate responses and improving overall service productivity. Trinet Assistant will continue to evolve, broaden and become more effective with increased utilization. Similar examples of AI have emerged in our product development processes where 30% of code and 50% of our test cases are now AI generated and moving directly into peer review for production deployment. Sales agents are supporting our prospecting, quoting and closing processes. AI is supporting our colleagues on client engagements, capturing notes, suggesting answers and automating correspondence. As we have talked about on this call for the past few years, Trinet has operated with excellent client facing technology but many manual processes behind the scenes. The Runway for AI to drive real improvement in client outcomes and efficiency is substantial and we’re excited about the capacity it creates for our colleagues to focus on what matters most, working directly with our clients. The ability to apply judgment, build relationships, manage risk is where my colleagues stand out and where I believe the resilience of our business model lies. During the first quarter, there’s been robust discussion about the long term threats of AI. TriNet sits at the intersection of employers, employees and government, where AI supports rather than replaces the human responsibilities we take on behalf of our customers. Things like handling payroll, human resources, insurance, taxes, compliance and more. Our customers aren’t just buying software or knowledge, they’re transferring risk and liability to Trinet. Further, they’re buying real and human expertise to step in at high stakes moments, ensuring employees get paid when problems occur, that health care coverage is there when needed, and having someone in their corner when regulators inquire. As for AI’s impact on SMBs, it’s early and still very uncertain. We believe SMBs will be impacted differently across the various industry verticals. In verticals where AI adoption is highest, such as technology, client hiring has not changed materially over the past two years, suggesting AI is creating as much opportunity as it’s replacing. There also seems to be a growing correlation between AI adoption and faster new business formation. As small businesses do what they always do, move quickly to innovate and take advantage of new opportunities, rest assured that Trinet will be there to capture our share of this market. So in summary, AI is undoubtedly driving changes, but given our business model, we see AI as a positive opportunity to serve more SMBs and serve them better overall. We are off to a strong start successfully navigating a difficult operating and business environment. Pricing is normalizing, expenses are managed and we’re trending toward the favorable end of our 2026 financial guidance. We see significant AI opportunities across our operations and product and we are pursuing them. There’s more work ahead, but momentum is building and we look forward to updating you as the year progresses. With that, I’ll pass the call to

Mala Murthy (Chief Financial Officer)

Mala Mala thank you, Mike While the macro environment in the first quarter was uneven, Trinet’s solid financial results were driven by disciplined pricing, better than expected insurance performance, and strong execution over multiple cycles. We repriced our health fees in a disciplined and measured way. The impact on new sales and retention was considerable. I’m pleased to say that our trend plus price increases concluded with our January 1st renewal and our retention outlook is improving. Furthermore, in the first quarter we saw health costs materialize lower than forecast, which when combined with our disciplined pricing drove improved ICR performance. Our discipline extended to expense management. We made difficult decisions in the quarter which resulted in meaningful run rate cost savings. Expenses are increasingly aligned with the scale …

Full story available on Benzinga.com

This post was originally published here
Xerox Holdings Corp. (NASDAQ:XRX) released its first-quarter 2026 results on Thursday.

The stock surged over 16%, as high short interest—exceeding 28% of the float—likely acted as a catalyst, amplifying buying pressure and accelerating the rally.

Revenue Surpasses Estimates Amid Earnings Miss

Xerox reported quarterly sales of $1.846 billion. This figure beat the analyst consensus estimate of $1.747 billion. It marks a significant increase from the $1.457 billion reported in the same period last year.

However, the company posted adjusted quarterly losses of 43 cents per share. This missed the analyst consensus estimate of a 27-cent loss. This result represents a wider loss compared to the 6 …

Full story available on Benzinga.com

This post was originally published here
On CNBC’s “Mad Money Lightning Round,” Jim Cramer said there is no reason to buy Flagstar Bank, National Association (NYSE:FLG).

“There’s nothing special,” he said. “It’s not making all that much money, it doesn’t have that big of a dividend.”

On the earnings front, Flagstar Financial, on April 24, posted first-quarter adjusted earnings of 4 cents per share, beating market estimates of 3 cents per share. The company’s sales came in at $498.00 million, missing expectations of $520.49 million.

When asked about Monarch Casino & Resort, Inc. (NASDAQ:MCRI), Cramer said he does not know that casino.

Monarch Casino & Resort, on Tuesday, reported better-than-expected first-quarter financial results.

Cramer said Ciena Corporation

Full story available on Benzinga.com

This post was originally published here
On CNBC’s “Halftime Report Final Trades,” Malcolm Ethridge, managing partner at Capital Area Planning Group, named Amazon.com, Inc. (NASDAQ:AMZN) as his final trade.

After the closing bell on Wednesday, Amazon reported upbeat financial results for the first quarter. Amazon also said it expects second-quarter revenue to be between $194 billion and $199 billion, versus estimates of $188.87 billion.

Stephen Weiss, chief investment officer and managing partner of Short Hills Capital Partners, recommended QXO, Inc. (NYSE:QXO).

Supporting his view, Oppenheimer analyst Scott …

Full story available on Benzinga.com

This post was originally published here
Chevron Corporation (NYSE:CVX) will release earnings for its first quarter before the opening bell on Friday, May 1.

Analysts expect the company to report quarterly earnings of 97 cents per share. That’s down from $2.18 per share in the year-ago period. The consensus estimate for Chevron’s quarterly revenue is $52.7 billion. It reported $47.61 billion last year, according to Benzinga Pro.

Ahead of quarterly earnings, Scotiabank analyst Paul Cheng, on April 22, maintained Chevron with a Sector Perform and raised the price target from $168 to $187.

With the recent buzz around Chevron, some investors may be eyeing potential gains from the company’s dividends too. As of now, Chevron has an annual dividend yield of 3.70%, which is a quarterly dividend amount of $1.78 per share ($7.12 a year).  

So, how can investors exploit its dividend yield …

Full story available on Benzinga.com

This post was originally published here

General Motors Co. (NYSE:GM) and Ford Motor Co. (NYSE:F) could risk backlash from President Donald Trump after reporting tariff relief at the companies’ first-quarter 2026 earnings calls.

Tariff Relief Could Invite Ire

The decision to ask for refunds could invite trouble from the Trump administration following a U.S. Supreme Court decision to strike down some of Trump’s tariffs, Reuters reported on Thursday.

data-variant=”card”
data-news-mode=”manual”

>


Read Also:

US Rejects 15% Of Tariff Refund Claims As Companies Navigate New CAPE Portal

This post was originally published here

JPMorgan Chase & Co. (NYSE:JPM) CEO Jamie Dimon has issued a stark warning about the trajectory of the global economy, pointing to rising government deficits and sticky inflation as a toxic combination that could trigger a future “bond crisis” and the worst-case scenario of stagflation.

The Worst-Case Economic Scenario

Speaking at the NBIM’s Investment Conference in Oslo on the confluence of global risks, Dimon cautioned that the broader market might be dangerously underestimating the threats posed by massive government spending, global re-militarization, and the massive infrastructure needs of the world.

Emphasizing that persistent inflation remains the “skunk at the party” threatening long-term economic stability, Dimon noted that on his list of potential outcomes, “the worst case is stagflation.”

“I don’t know how the world running deficits like this isn’t inflationary,” Dimon stated. “That die may have been cast. It just hasn’t happened yet. And so when I look at scenarios, I’m looking for early indicators, but it is possible that inflation ticks up and that will catch a lot of people off guard.”

data-variant=”card”
data-news-mode=”manual”

>


Read Also:

Jamie Dimon Dared Crypto Firms To ‘Be …

This post was originally published here

During times of turbulence and uncertainty in the markets, many investors turn to dividend-yielding stocks. These are often companies that have high free cash flows and reward shareholders with a high dividend payout.

Benzinga readers can review the latest analyst takes on their favorite stocks by visiting Analyst Stock Ratings page. Traders can sort through Benzinga’s extensive database of analyst ratings, including by analyst accuracy.

Below are the ratings of the most accurate analysts for three high-yielding stocks in the health care sector.

AbbVie (NYSE:ABBV)

  • Dividend Yield: 3.39%
  • Piper Sandler analyst David Amsellem maintained an Overweight rating and cut the price target from $299 to $294 on April 23, 2026. This analyst has an accuracy rate of 76%
  • Canaccord Genuity analyst Gary Nachman initiated coverage on the stock with a Buy rating and a price target of $262 on April 21, 2026. This analyst has an accuracy rate of 59%.
  • Recent News: On April 29, AbbVie posted better-than-expected first-quarter earnings.
  • Benzinga Pro’s real-time …

Full story available on Benzinga.com

This post was originally published here
U.S. stock futures were higher this morning, with the Nasdaq 100 futures gaining around 100 points on Thursday.

Shares of Meta Platforms Inc (NASDAQ:META) dipped 8.2% to $613.75 in pre-market trading following first-quarter results.

Meta reported better-than-expected financial results for the first quarter on Wednesday after the bell. The company anticipates full-year capital expenditures of $125 billion to $145 billion, up from prior guidance of $115 billion to $135 billion.

Meta shares dipped 8.2% to $613.75 in pre-market trading.

Here are some other stocks moving lower in pre-market trading.

  • Check Point Software Technologies Ltd

Full story available on Benzinga.com

This post was originally published here
Estee Lauder Companies, Inc. (NYSE:EL) shares fell Thursday as investors positioned ahead of the company’s third-quarter earnings report due on Friday.

Estee Lauder Invests In 111SKIN

Separately, the company announced a minority investment in luxury clinical skincare brand 111SKIN, founded by Dr. Yannis Alexandrides. Terms were not disclosed.

The move targets rising demand for science-backed, treatment-inspired skincare. Known for its NAC Y2 technology, 111SKIN offers premium products priced between $50 and $1,000 and sells through luxury retail, e-commerce, and spa channels globally.

The brand generates about 20% of sales from direct-to-consumer channels and has a strong presence in North America, China, Europe, and Asia-Pacific.

Dr. Alexandrides will continue leading the company, while Estee Lauder aims to expand its global reach and strengthen its position in clinical skincare.

Technical Analysis

Estee Lauder Companies is sitting well off its 52-week high of $121.64 and closer to the lower half of its $56.66–$121.64 range, which is consistent with a longer repair phase after a big drawdown.

The stock is trading 1.8% above its 20-day simple moving average (SMA) but 22% below its 100-day SMA, a mix that points to a short-term bounce inside a …

Full story available on Benzinga.com

This post was originally published here

American Eagle Outfitters Inc.‘s (NYSE:AEO) stock has entered the top 10% of undervalued stocks, with its Benzinga Edge value score rising from 88.54 to 91.37 on a week-over-week basis.

Despite the launch of a new summer denim campaign featuring actress Sydney Sweeney, analysts warn the brand’s momentum may be slowing, though its discounted stock price remains a focal point for investors.

Metrics Flash ‘Undervalued’

The retailer’s leap into the top value tier comes as AEO shares trade at a price-to-earnings ratio of approximately 15.706 times. This valuation sits below the industry average of 17.120x, according to Benzinga Pro.

The Benzinga Edge Stock Rankings‘ value metric evaluates a stock’s relative worth by comparing its market price against fundamental measures like the company’s assets, earnings, sales, and operating performance. Additionally, the stock carries a growth score of 60.32 and a quality score of 26.44.

Benzinga Edge Stock Rankings for AEO.

This post was originally published here

Semiconductor companies are tightening their grip on the U.S. equity market, reaching record levels of dominance within the technology sector.

Chip Stocks Command Unprecedented Market Share

According to a Wednesday post on X by The Kobeissi Letter, “The S&P 500 semiconductor industry now accounts for a record 41.9% of the total market cap of the information technology sector.”

This has more than doubled since the 2022 bear market and represents a massive jump from less than 10% in 2013, highlighting the sector’s rapid ascent over the past decade.

Semiconductors: The Cornerstone of AI Growth

This trend of semiconductor dominance aligns with insights from analysts like Adam Parker, who recently emphasized that strong AI-driven earnings are particularly bolstering …

Full story available on Benzinga.com

This post was originally published here
On Thursday, Lanvin Gr Hldgs (NYSE:LANV) discussed full-year financial results during its earnings call. The full transcript is provided below.

This transcript is brought to you by Benzinga APIs. For real-time access to our entire catalog, please visit https://www.benzinga.com/apis/ for a consultation.

View the webcast at https://event.choruscall.com/mediaframe/webcast.html?webcastid=glpMDf2X

Summary

Lanvin Gr Hldgs reported a revenue decline of 18% year-over-year to 240 million euros for 2025, primarily due to external market pressures and internal restructuring.

The company improved its operational efficiency, reflected in a gross margin of 58% and a 12% reduction in operating expenses.

Key strategic initiatives included streamlining the retail footprint, adopting an asset-light model, and optimizing the brand portfolio by carving out Caruso.

Lanvin and Wolford showed sequential improvement in the second half of the year, signaling positive effects of strategic actions.

Leadership changes were made to strengthen brand management, with new CEOs appointed at St. John and Wolford.

Regionally, North America outperformed, while Greater China faced significant challenges due to weaker consumer sentiment.

Lanvin Gr Hldgs aims to continue its transformation journey into 2026, focusing on sustainable profitability and further recovery of its brands.

Full Transcript

OPERATOR

Thank you for joining us and welcome to the Lanvin Gr Hldgs’ Fiscal Year 2025 financial results conference call. All participants will be in listen only mode. Should you need assistance, please signal a conference specialist by pressing the star key followed by . After today’s presentation, there will be an opportunity to ask questions. Please note this event is being recorded now. Please take a moment to review the disclaimers. During this presentation, the Company will be making certain forward looking statements, including but not limited to future performance and industry outlook. Forward looking statements are inherently subject to risks, uncertainties and other factors and they are not guarantees of performance. For today’s presentation, I would like to introduce Andy Liu, Executive President of Lanvin Group and Ray Han, CFO of Lanvin Group. I will now turn it over to Andy to start the presentation.

Andy Liu (Executive President)

Good evening, good afternoon and good morning to everyone joining us today. Thank you for taking the time to participate in Lanvin Gr Hldgs’ full year 2025 results presentation. We truly appreciate your continued interest and support. Today we will walk you through our financial and operational performance for 2025, discuss the progress we have made on our transformation journey and share our outlook as we move into 2026. It has been a year of disciplined execution and important structural changes for the Group and we are pleased to begin sharing the story with you. 2025 was a year defined by both external challenges and internal transformation. On the one hand, the global luxury market remained under pressure, particularly in Greater China with softer consumer demand and macroeconomic uncertainty. On the other hand, we continue to take deliberate actions to reshape our business, streamlining operations, optimizing our retail footprint and reinforcing our focus on core brands. For fiscal year 2025, Lanvin Gr Hldgs reported revenue of 240 million euro, down 18% year over year. While the top line reflects these headwinds and strategic adjustments, we are encouraged by the progress we made beneath the surface. We saw sequential improvement in performance during the second half of the year, particularly at Lanvin and Wolford, which indicates that our actions are starting to take effect. We continue to streamline our retail footprint, focusing on our core business units in key regions. This has enhanced operational efficiency and allowed us to improve EBITDA despite lower revenue. We also accelerated our portfolio optimization efforts in 2025. As part of this, we completed the carve out of Caruso in the beginning of 2026 and enabling us to concentrate resources on our core brands, leverage external partnerships and further advance our Asset light operating model. And finally, we strengthened brand leadership through continuous team upgrades, ensuring we have the right capabilities in place to support long term strategic execution. Overall, while the environment remains challenging, we have made meaningful progress in reshaping businesses and building a stronger foundation for the future. Page six highlights several key metrics. We landed with a gross margin of 58% in 2025, demonstrating resilience in pricing and inventory mix management despite lower volumes. We have also made meaningful progress in optimizing our cost base, achieving approximately 12% savings in operating expenses compared to the prior year. The number of directly operated stores was reduced to 174, reflecting a deliberate shift toward higher quality, more productive locations. At the same time, we’re increasingly adopting an asset light model, allowing us to improve flexibility and capital efficiency. Encouragingly, contribution margin improved significantly in the second half of the year, increasing by 40% compared to the first half, reflecting the early impact of these initiatives. Page 7 provides a deeper look at our half year performance and improving trajectory we began to see during 2025. Gross profit showed improvement in the second half of 2025 since first half 2024, reflecting better product availability, improving sell through and more disciplined inventory management. At the same time, we continue to reduce operating expenses through structural cost optimization and improve the efficiency across the organization. This combination stabilizing gross profit and lower operating costs has started to improve our operating leverage. While we are still in a transition phase, these trends reinforce our confidence that the actions we have taken are moving us in the …

Full story available on Benzinga.com

This post was originally published here

General Motors Co. (NYSE:GM) will be investing nearly $1 billion in strengthening its gasoline vehicle lineup, with over $340 million in new investments aimed at bolstering its U.S. manufacturing plants.

GM Bullish On Gasoline

The $340 million investment includes a $300 million commitment towards the Romulus, Michigan, plant, while the plant in Toledo, Ohio, will get an extra $40 million, Business Insider reported on Wednesday. Both plants manufacture key elements of GM’s Internal Combustion Engine (ICE) efforts, including a 10-speed transmission.

data-variant=”card”
data-news-mode=”manual”

>


Read Also:

GM Slips Despite Q1 Beat As Analysts Stay Bullish, Raise Targets

This post was originally published here

Alphabet Inc. (NASDAQ:GOOG) (NASDAQ:GOOGL) board member and Google co-founder Sergey Brin, who is also a former resident of California, has warned that the state risks becoming a socialist system like the Soviet Union, as he escalates a $57 million campaign against the proposed billionaire tax.

From Soviet Refugee To Billionaire Combatant

“I fled socialism with my family in 1979 and know the devastating, oppressive society it created in the Soviet Union,” Brin said in a rare statement to The New York Times. “I don’t want California to end up in the same place.”

Once a Democratic donor who backed former President Barack Obama, Brin relocated to Nevada before the Dec. 31 deadline to avoid the proposed tax, following fellow Google co-founder Larry Page, who also left California ahead of the same deadline.

He has since personally contributed $57 million to Building a Better California, a nonprofit targeting “any and all new taxes …

Full story available on Benzinga.com

This post was originally published here

In the fast-paced and cutthroat world of business, conducting thorough company analysis is essential for investors and industry experts. In this article, we will undertake a comprehensive industry comparison, evaluating NVIDIA (NASDAQ:NVDA) in comparison to its major competitors within the Semiconductors & Semiconductor Equipment industry. By analyzing crucial financial metrics, market position, and growth potential, our objective is to provide valuable insights for investors and offer a deeper understanding of company’s performance in the industry.

NVIDIA Background

Nvidia is a leading developer of graphics processing units. Traditionally, GPUs were used to enhance the experience on computing platforms, most notably in gaming applications on PCs. GPU use cases have since emerged as important semiconductors used in artificial intelligence to run large language models. Nvidia not only offers AI GPUs, but also a software platform, Cuda, used for AI model development and training. Nvidia is also expanding its data center networking solutions, helping to tie GPUs together to handle complex workloads.

Company P/E P/B P/S ROE EBITDA (in billions) Gross Profit (in billions) Revenue Growth
NVIDIA Corp 42.70 32.33 23.75 31.11% $51.28 $51.09 73.21%
Broadcom Inc 79.04 24.03 28.89 9.12% $11.15 $13.16 29.47%
Micron Technology Inc 24.47 8.07 10.11 21.0% $18.48 $17.75 196.29%
Advanced Micro Devices Inc 129.16 8.72 15.92 2.44% $2.86 $5.58 34.11%
Texas Instruments Inc 46.02 14.60 13.32 9.35% $2.42 $2.8 18.58%
Analog Devices Inc 71.17 5.63 16.39 2.46% $1.52 $2.04 30.42%
Qualcomm Inc 16.77 6.10 3.80 13.57% $4.11 $6.68 5.0%
Marvell Technology Inc 51 9.57 16.62 2.79% $0.75 $1.15 22.08%
Monolithic Power Systems Inc 118.73 21.24 26.43 4.95% $0.21 $0.41 20.83%
NXP Semiconductors NV 27.65 6.68 5.82 10.69% $1.7 $1.79 12.2%
ON Semiconductor Corp 340.90 5.07 6.79 2.33% $0.45 $0.55 -11.17%
GLOBALFOUNDRIES Inc 39.46 2.89 5.16 1.68% $0.73 $0.51 0.0%
Astera Labs Inc 161.35 24.73 41.46 3.41% $0.07 $0.2 91.77%
Credo Technology Group Holding Ltd 96.58 17.54 30.56 10.03% $0.16 $0.28 201.49%
Tower Semiconductor Ltd 102.67 7.70 14.45 2.78% $0.2 $0.12 13.69%
First Solar Inc 13.41 2.15 3.93 5.62% $0.7 $0.67 11.15%
MACOM Technology Solutions Holdings Inc 122 14.95 19.80 3.64% $0.07 $0.15 24.52%
Lattice Semiconductor Corp 5783.50 22.17 30.56 -1.08% $0.01 $0.1 24.16%
Average 424.93 11.87 17.06 6.16% $2.68 $3.17 42.62%

Full story available on Benzinga.com

This post was originally published here
In today’s rapidly changing and fiercely competitive business landscape, it is vital for investors and industry enthusiasts to carefully evaluate companies. In this article, we will perform a comprehensive industry comparison, evaluating Advanced Micro Devices (NASDAQ:AMD) against its key competitors in the Semiconductors & Semiconductor Equipment industry. By analyzing important financial metrics, market position, and growth prospects, we aim to provide valuable insights for investors and shed light on company’s performance within the industry.

Advanced Micro Devices Background

Advanced Micro Devices designs a variety of digital semiconductors for markets such as PCs, gaming consoles, data centers (including artificial intelligence), industrial, and automotive applications. AMD’s traditional strength was in central processing units and graphics processing units used in PCs and data centers. However, AMD is emerging as a prominent player in AI GPUs and related hardware. Additionally, the firm supplies the chips found in prominent game consoles such as the Sony PlayStation and Microsoft Xbox.

Company P/E P/B P/S ROE EBITDA (in billions) Gross Profit (in billions) Revenue Growth
Advanced Micro Devices Inc 129.16 8.72 15.92 2.44% $2.86 $5.58 34.11%
NVIDIA Corp 42.70 32.33 23.75 31.11% $51.28 $51.09 73.21%
Broadcom Inc 79.04 24.03 28.89 9.12% $11.15 $13.16 29.47%
Micron Technology Inc 24.47 8.07 10.11 21.0% $18.48 $17.75 196.29%
Texas Instruments Inc 46.02 14.60 13.32 9.35% $2.42 $2.8 18.58%
Analog Devices Inc 71.17 5.63 16.39 2.46% $1.52 $2.04 30.42%
Qualcomm Inc 16.77 6.10 3.80 13.57% $4.11 $6.68 5.0%
Marvell Technology Inc 51 9.57 16.62 2.79% $0.75 $1.15 22.08%
Monolithic Power Systems Inc 118.73 21.24 26.43 4.95% $0.21 $0.41 20.83%
NXP Semiconductors NV 27.65 6.68 5.82 10.69% $1.7 $1.79 12.2%
ON Semiconductor Corp 340.90 5.07 6.79 2.33% $0.45 $0.55 -11.17%
GLOBALFOUNDRIES Inc 39.46 2.89 5.16 1.68% $0.73 $0.51 0.0%
Astera Labs Inc 161.35 24.73 41.46 3.41% $0.07 $0.2 91.77%
Credo Technology Group Holding Ltd 96.58 17.54 30.56 10.03% $0.16 $0.28 201.49%
Tower Semiconductor Ltd 102.67 7.70 14.45 2.78% $0.2 $0.12 13.69%
First Solar Inc 13.41 2.15 3.93 5.62% $0.7 $0.67 11.15%
MACOM Technology Solutions Holdings Inc 122 14.95 19.80 3.64% $0.07 $0.15 24.52%
Lattice Semiconductor Corp 5783.50 22.17 30.56 -1.08% $0.01 $0.1 24.16%
Average 419.85 13.26 17.52 7.85% $5.53 $5.85 44.92%

Full story available on Benzinga.com

This post was originally published here
In today’s fast-paced and highly competitive business world, it is crucial for investors and industry followers to conduct comprehensive company evaluations. In this article, we will delve into an extensive industry comparison, evaluating Amazon.com (NASDAQ:AMZN) in relation to its major competitors in the Broadline Retail industry. By closely examining key financial metrics, market standing, and growth prospects, our objective is to provide valuable insights and highlight company’s performance in the industry.

Amazon.com Background

Amazon is the leading online retailer and marketplace for third party sellers. Retail related revenue represents approximately 74% of total, followed by Amazon Web Services (17%), and advertising services (9%). International segments constitute 22% of Amazon’s total revenue, led by Germany, the United Kingdom, and Japan.

Company P/E P/B P/S ROE EBITDA (in billions) Gross Profit (in billions) Revenue Growth
Amazon.com Inc 31.46 6.40 3.84 5.43% $46.76 $103.43 13.63%
MercadoLibre Inc 44.85 13.28 3.10 8.62% $1.07 $3.78 44.56%
eBay Inc 23.97 10.54 4.15 11.31% $0.8 $2.12 14.97%
Coupang Inc 184.64 7.94 1.09 -0.56% $0.17 $2.54 10.92%
Dillard’s Inc 15.43 4.93 1.34 10.66% $0.3 $0.72 -3.03%
Global E Online Ltd 80.51 5.65 5.74 6.69% $0.13 $0.15 28.05%
Ollie’s Bargain Outlet Holdings Inc 21.95 2.76 1.99 4.6% $0.13 $0.31 16.82%
Macy’s Inc 8.32 1.05 0.24 11.04% $0.9 $2.97 -1.14%
Kohl’s Corp 5.87 0.39 0.10 3.13% $0.39 $1.85 -4.15%
Savers Value Village Inc 58.79 2.92 0.80 5.28% $0.07 $0.26 15.59%
Hour Loop Inc 38.70 9.73 0.48 -8.96% $-0.0 $0.03 3.03%
Average 48.3 5.92 1.9 5.18% $0.4 $1.47 12.56%

Full story available on Benzinga.com

This post was originally published here
 Jamie Dimon, CEO of JPMorgan Chase (NYSE:JPM), emphasized the importance of international relations and geopolitics for the U.S. amid his steadfast belief in America’s economic potential.

“I don’t worry about the U.S. economy,” said Dimon in a live podcast with Nicolai Tangen on Tuesday at Norges Bank Investment Management’s Conference in Oslo. He compared the economy to the weather, implying it will eventually get “better.”

However, he stressed the significance of geopolitics for the future of the free and democratic world, citing conflicts in Ukraine and Iran, and the need for a robust NATO.

Dimon underscored the importance of collaborating with trading partners to maintain unity in the Western world. He warned against “fragmentation,” stating that “economic relations are not just tariffs” …

Full story available on Benzinga.com

This post was originally published here

Shares of Qualcomm Inc (NASDAQ:QCOM) rose sharply in pre-market trading after the company reported better-than-expected second-quarter financial results.

Qualcomm reported second-quarter revenue of $10.60 billion, down 2% year-over-year. The revenue total beat a Street consensus estimate of $10.59 billion according to data from Benzinga Pro. Adjusted earnings per share were $2.65 for the quarter, beating a Street consensus estimate of $2.56.

Qualcomm shares jumped 10.6% to $172.50 in pre-market trading.

Here are some other stocks moving in pre-market trading.

Gainers

  • Abits Group Inc (NASDAQ:ABTS) gained 46% to $1.62 in pre-market trading after the company reported a year-over-year increase in its FY25 sales results.
  • Akanda Corp (NASDAQ:AKAN) gained 33.2% to $34.65 in pre-market trading after jumping 49% on Wednesday. The U.S. Department of Justice placed state-regulated medical marijuana under Schedule III. An expedited process for broader reclassification is now underway.
  • VS Media Holdings Ltd (NASDAQ:VSME) rose 29.2% to $1.20 in pre-market trading after the investment holding company filed a Securities and Exchange Commission disclosure regarding a debt-to-equity restructuring.
  • OSR Holdings Inc (NASDAQ:OSRH) rose 28.2% to $0.59 in pre-market trading after announcing a global exclusive license agreement with Switzerland-based life sciences investment entity BCM Europe AG for its Phase 3-ready oral …

Full story available on Benzinga.com

This post was originally published here

U.S. stock futures were mixed on Thursday morning, following Wednesday’s largely lower close as only tech stocks ended on a positive note.

Following the Federal Reserve’s decision to keep the interest rates steady at 3.50%-3.75%, Jerome Powell said during his speech that he plans to remain on the Board of Governors, despite his term ending on May 15.

Meanwhile, President Donald Trump is reportedly scheduled to review potential military strategies from CENTCOM Commander Adm. Brad Cooper for Iran on Thursday, signaling a possible return to significant combat operations, as per Axios. The U.S. is reportedly considering a “short and powerful” strike campaign on Iran targeting infrastructure to break the stalemate in negotiations and push Tehran back to the nuclear bargaining table.

The 10-year Treasury bond yielded 4.41%, and the two-year bond was at 3.91%. The CME Group’s FedWatch tool‘s projections show markets pricing a 98.8% likelihood of the Federal Reserve leaving the current interest rates unchanged during June’s meeting.

Index Performance (+/-)
Dow Jones -0.42%
S&P 500 -0.01%
Nasdaq 100 0.22%
Russell 2000 -0.03%

The SPDR S&P 500 ETF Trust (NYSE:SPY) and Invesco QQQ Trust ETF (NASDAQ:QQQ), which track the S&P 500 and Nasdaq 100, respectively, were mixed in premarket on Thursday. The SPY was down 0.021% at $711.43, while the QQQ advanced 0.13% to $662.43.

data-variant=”card”
data-news-mode=”manual”

>


Read Also:

Will S&P 500 Open Up Or Down On April 30? Here’s How Polymarket Traders Lean As Trump’s Naval Blockade Sends Brent Crude Near $115

This post was originally published here

The S&P 500 closed lower on Wednesday, slipping to 7,135.95 as investors balanced a pivotal day of megacap tech earnings against an escalating geopolitical standoff and the Federal Reserve’s decision on interest rates.

The Polygon-based (CRYPTO: POL) Polymarket crowd is slightly bearish heading into Thursday’s open. The April 30 market shows a 47% chance of an “Up” open. Early trading volume for the Thursday bet currently sits at $26,434.

data-variant=”card”
data-news-mode=”manual”

>


Read Also:

Oil Surges 6%, S&P 500 Wobbles Before Fed And Tech Earnings: Stock Market Today

This post was originally published here
Could Ford Motor Co. (NYSE:F) be mulling an entry into the Robotaxi race? CEO Jim Farley, during the automaker’s first-quarter 2026 earnings call, hinted at the possibility.

Jim Farley’s Cryptic Response

During Ford’s earnings call, Farley was asked about whether the automaker had any plans for Robotaxis with companies like Uber Technologies Inc. (NYSE:UBER) and Nvidia Corp. (NASDAQ:NVDA) investing heavily in the sector. Farley shared that Robotaxis are something that Ford has been “watching carefully as it evolves.”

data-variant=”card”
data-news-mode=”manual”

>


Read Also:

GM To Roll Out Google Gemini AI Across 4 Million Cars: Here’s What Owners Need To Know

This post was originally published here

Anthropic is in discussions with investors about new financing that could value the company at $900 billion, more than doubling its $380 billion valuation in February, according to a report.

If the talks turn into a deal, the maker of Claude could surpass rival OpenAI to become the most valuable AI startup.

According to a Livemint report, Anthropic is evaluating investor proposals, though no proposal has been accepted.

Anthropic Valuation Could Skyrocket Soon

As Anthropic continues to gain momentum, it is intensifying competitive pressure on OpenAI, which is reportedly preparing for a public listing later this year and was valued at $852 billion in a March funding round, the report said, citing Bloomberg. The ChatGPT maker was unable to meet its set targets for revenue and new users.

OpenAI missed its targets for one billion weekly ChatGPT users and annual revenue, largely due to strong competition from Alphabet’(NASDAQ:GOOGL(NASDAQ:

Full story available on Benzinga.com

This post was originally published here

The CNN Money Fear and Greed index showed almost no change in the overall market sentiment, while the index remained in the “Greed” zone on Wednesday.

U.S. stocks settled mostly lower on Wednesday, with the Dow Jones index falling more than 250 points during the session, recording losses for the fifth straight session. Crude prices rose again on Wednesday amid renewed Hormuz disruption fears.

In earnings, Automatic Data Processing (NASDAQ:ADP) reported better-than-expected third-quarter financial results. Brinker International Inc. (NYSE:EAT) reported upbeat third-quarter earnings on Wednesday.

On the economic data front, U.S. wholesale inventories rose by 1.4% month-over-month to $932.8 billion in March, compared to a revised 0.9% gain in February. The goods deficit increased to $87.9 billion in March from $83.5 …

Full story available on Benzinga.com

This post was originally published here
Avis Budget Group Inc. (NASDAQ:CAR) CEO Brian Choi addressed the recent dramatic swings in the company’s stock price, attributing the market chaos to a massive short squeeze and vowing legal action to protect shareholders from opportunistic trading.

‘Aggressively Pursue’ Rights

During the company’s first-quarter 2026 earnings call, Choi directly addressed the “excess volatility” surrounding CAR stock.

Following reports of a massive short squeeze allegedly manufactured by major hedge funds holding a concentrated available float, Choi noted that Pentwater Capital disclosed the sale of 4.3 million shares for gross proceeds of $1.75 billion over just two days.

Pentwater acknowledged the sale was, at least in part, violative of SEC Section 16 short swing profit rules.

In response, Choi promised strict accountability to investors. “Avis has requested Pentwater furnish all relevant information concerning the trades, and Avis will aggressively pursue all rights on behalf of our stockholders,” Choi stated firmly.

data-variant=”card”
data-news-mode=”manual”

>


Read Also:

Avis …

This post was originally published here

Amid the buzz around its IPO, SpaceX has reportedly revealed that CEO Elon Musk can only be fired from his position at the top of the commercial space flight giant by one person: Musk himself.

Dual-Class Framework

On Wednesday, Reuters reported that it had accessed filings by SpaceX that revealed Musk could only be removed from his role by Class B shareholders, which hold the voting power of 10 votes. A dual-class framework involves companies issuing two classes of shares, Class A shares with 1 vote and Class B shares with 10 votes.

SpaceX didn’t immediately respond to Benzinga‘s request for comment.

Companies like Meta Platforms Inc. (NASDAQ:META) and Alphabet Inc. (NASDAQ:GOOGL) (NASDAQ:GOOG), as well as investor Warren Buffett‘s Berkshire Hathaway Inc. (NYSE:BRK) (NYSE:BRK), …

Full story available on Benzinga.com

This post was originally published here

Oil prices are ripping higher, with Brent oil topping $122 per barrel and logging a sharp 20% weekly surge, according to economist Mohamed A. El-Erian, pointing to escalating Middle East tensions, shrinking global inventories and mounting Gulf supply risks as the key forces driving the rally.

He also warned that volatility may continue, and the rally in oil prices could extend further if those risks intensify.

Oil Spikes 20% In A Week

Erian, on Wednesday’s X post, said that Brent oil surpassed $122 per barrel, representing a “staggering 20% increase in just one week.”

Erian pointed out the three key drivers behind the latest spike, which are as follows:

Stalemate In The Middle East War

The first is “the stalemate in the Middle East War, with the balance of risk shifting toward escalation.”

Earlier on Wednesday, Donald Trump said the blockade would …

Full story available on Benzinga.com

This post was originally published here

With U.S. stock futures trading lower this morning on Thursday, some of the stocks that may grab investor focus today are as follows:

  • Wall Street expects Apple Inc (NASDAQ:AAPL) to report quarterly earnings at $1.95 per share on revenue of $109.66 billion after the closing bell, according to data from Benzinga Pro. Apple shares rose 0.3% to $270.95 in after-hours trading.
  • Alphabet Inc (NASDAQ:GOOGL) (NASDAQ:GOOG) reported better-than-expected first-quarter financial results and raised its quarterly dividend. Alphabet shares gained 7.2% to $375.29 in the after-hours trading session.
  • Analysts are expecting Caterpillar Inc

Full story available on Benzinga.com

This post was originally published here
Eli Lilly and Company (NYSE:LLY) will release earnings for its first quarter before the opening bell on Thursday, April 30.

Analysts expect the Indianapolis, Indiana-based company to report quarterly earnings of $6.79 per share. That’s up from $3.34 per share in the year-ago period. The consensus estimate for Eli Lilly’s quarterly revenue is $17.8 billion (it reported $12.73 billion last year), according to Benzinga Pro.

As per the recent news, Profluent has entered a multi-program strategic research collaboration with Eli Lilly to develop and commercialize custom site-specific recombinases to treat genetic diseases.

Shares of Eli Lilly fell 2.6% to close at $851.21 on Wednesday.

Benzinga readers can access the latest analyst ratings on the Analyst Stock Ratings page. Readers can sort by stock ticker, company name, analyst firm, rating change or other variables.

Let’s have a look at how …

Full story available on Benzinga.com

This post was originally published here
Mastercard Incorporated (NYSE:MA) will release earnings for its first quarter before the opening bell on Thursday, April 30.

Analysts expect the Purchase, New York-based company to report quarterly earnings of $4.41 per share. That’s up from $3.73 per share in the year-ago period. The consensus estimate for Mastercard’s quarterly revenue is $8.26 billion (it reported $7.25 billion last year), according to Benzinga Pro.

As per the recent news, Mastercard, on March 17, announced a definitive agreement to acquire BVNK, a leader in stablecoin infrastructure, for up to $1.8 billion.

Shares of Mastercard gained 3.5% to close at $525.23 on Wednesday.

Benzinga readers can access the latest analyst ratings on the Analyst Stock Ratings page. Readers can sort by stock ticker, company name, analyst firm, rating change or other variables.

Let’s have a look at how Benzinga’s …

Full story available on Benzinga.com

This post was originally published here

On Wednesday, Alphabet Inc. (NASDAQ:GOOG) (NASDAQ:GOOGL) CEO Sundar Pichai said that Google’s ownership of nearly every layer of the artificial intelligence ecosystem gives it a distinct advantage over rivals.

Google’s Full-Stack AI Strategy Powers Competitive Advantage

During the first-quarter earnings call, Pichai spoke about the tech giant’s control across the AI ecosystem — including custom chips, Gemini models, cloud infrastructure, developer tools and security.

“We are genuinely differentiated,” Pichai said during the company’s first-quarter earnings call, describing Google’s “vertically optimized AI stack” as a key factor helping it stay ahead in a rapidly intensifying AI race.

Pichai added that Google’s control over both silicon and software allows it to scale AI efficiently while protecting margins and maintaining security.

data-variant=”card”
data-news-mode=”manual”

>


Read Also:

Google Unveils …

This post was originally published here

On Wednesday, President Donald Trump touted the federal government’s investment in Intel Corp. (NASDAQ:INTC) as one of America’s most lucrative strategic bets.

Trump Celebrates Massive Intel Windfall

In a post on Truth Social, Trump said the government’s equity position in Intel had generated enormous returns since his administration authorized the investment last summer.

“I’m very proud of that Company in that I am responsible for making the United States of America over 30 Billion Dollars in the last 90 days on that stock alone,” Trump wrote.

He added, “There are others that, likewise, I have been very successful with by taking pieces of the Equity for support.”

How The US Government’s Intel Investment Grew

The U.S. government acquired a 10% stake in Intel in August, purchasing 433.3 million shares at $20.47 per share for roughly $8.9 billion.

The funding included $5.7 billion from the CHIPS and Science Act and $3.2 billion from secure semiconductor initiatives.

With Intel stock …

Full story available on Benzinga.com

This post was originally published here

Sen. Elizabeth Warren (D-Mass.) reignited allegations of insider trading against President Donald Trump and the White House on Wednesday amid escalating tensions in the Middle East, which have sent oil prices surging.

Americans Deserve Answers

In a post on X, Warren criticized Trump, saying that “Millions in oil futures” were traded just before the Iran ceasefire. “The White House had to remind staff not to trade on insider info,” Warren said, demanding a “full investigation” into the insider trading angle. “The American people deserve answers,” she said.

data-variant=”card”
data-news-mode=”manual”

>


Read Also:

Gavin Newsom Slams Trump’s ‘Reckless’ Iran War As Gas Prices Surge, Accuses White House Of Derailing California’s Clean Energy Projects

This post was originally published here
Viavi Solutions Inc. (NASDAQ:VIAV) shares are trending on Wednesday night.

On Wednesday, VIAV shares jumped 25.17% to $56.99 after the bell after the network and optical technology company delivered fiscal third quarter results where earnings beat analyst estimates by 22.73% and revenue by 3.32%.

The results reported are for the period ended Mar. 28.

What Q3 Data Tells

Viavi’s net revenue in the third quarter hit $406.8 million, up 42.8% year-over-year. Non-GAAP earnings per share came in at $0.27, up 80% YoY, while non-GAAP operating margin expanded 430 basis points to 21.0%.

The network and service enablement segment led growth, surging 54.4% YoY to $321.5 million.

As of March 28, the company had $508 million in cash and short-term investments.

CEO Oleg Khaykin said, “VIAVI’s financial performance for the third quarter has exceeded our expectations, driven by strong growth in the data center and aerospace and defense end markets.”

Bullish Q4 Guidance …

Full story available on Benzinga.com

This post was originally published here

VS Media Holdings Ltd. (NASDAQ:VSME) soared 48.72% to $1.38 in after-hours trading on Wednesday after the investment holding company filed a Securities and Exchange Commission disclosure regarding a debt-to-equity restructuring.

On April 27, VS Media and Singapore-based steel sourcing and project management firm S T Meng Pte. Ltd. executed a debt conversion and share subscription agreement converting a $3.8 million convertible promissory note originally issued in August 2025 into equity at $74.70 per S T Meng share, terminating the original note’s conversion mechanics entirely.

According to the SEC filing, post-conversion, VSME now holds 41.52% of the voting rights in S T Meng, securing a controlling minority stake while fully extinguishing the principal obligation.

What Investors Need To Know

A Debt Conversion and Share Subscription Agreement is a legally binding contract in which a …

Full story available on Benzinga.com

This post was originally published here

On Wednesday, United Parcel Service Inc. (NYSE:UPS) and FedEx Corp. (NYSE:FDX) said they plan to pass along tariff reimbursements to customers after a court fight knocked out a set of import duties tied to President Donald Trump‘s use of the International Emergency Economic Powers Act.

According to a court filing cited by The Hill, about 330,000 importers paid more than $166 billion tied to the disputed tariff program.

According to the report, UPS told Nexstar it is coordinating with Customs and Border Protection (CBP), which is taking refund applications through an online system.

On the other hand, FedEx, which filed a lawsuit earlier this year to recover import taxes, said it has already begun submitting claims through CBP.

Are UPS And FedEx Ready For This Challenge?

UPS said the initial phase will cover “certain tariff payments made starting Jan. 30, 2026, in addition to pending tariff payments”.

A UPS spokesperson, Natasha Amadi, said to The Hill that the company is already processing refunds for shipments where it acted as …

Full story available on Benzinga.com

This post was originally published here

Entergy (NYSE:ETR) reported first-quarter financial results on Wednesday. The transcript from the company’s first-quarter earnings call has been provided below.

This transcript is brought to you by Benzinga APIs. For real-time access to our entire catalog, please visit https://www.benzinga.com/apis/ for a consultation.

Access the full call at https://events.q4inc.com/attendee/703279949

Summary

Entergy Corp reported a strong financial performance for Q1 2026, with adjusted earnings per share of $0.86 and an 8.5% growth in retail sales.

The company launched the Fair Share+ pledge to ensure data centers contribute to infrastructure costs, securing agreements with Meta for new data centers, which are expected to generate $7 billion in benefits.

Entergy Corp raised its capital plan to $57 billion, driven by new electric service agreements and growth in industrial sales, with an anticipated 8.5% compound annual growth in retail sales through 2029.

Operational highlights include the first fire milestone of the Orange County Advanced Power Station and capital savings in transmission projects, while expanding renewable and storage capacity with active RFPs for over 4,500 megawatts.

Future outlook remains positive with strong growth prospects, supported by strategic investments and robust customer agreements, with plans to provide more details at an upcoming Investor Day.

Full Transcript

OPERATOR

Good Morning, My name is John and I will be your conference operator today. At this time I would like to welcome everyone to Entergy’s first quarter 2026 earnings call and teleconference. All lines have been placed on mute to prevent any background noise. After the speaker’s remarks, there will be a question and answer session. If you would like to ask a question during this time, simply press Star followed by the number one on your telephone keypad and if you would like to withdraw your question, press Star one again. I will now turn the call over to Liz Hunter, Vice President of Investor Relations for Entergy Corporation.

Liz Hunter (Vice President of Investor Relations)

Liz, Good morning. Thank you John and thanks to everyone for joining this morning. We will begin today with comments from Entergy’s Chair and CEO Drew Marsh and then Kimberly Fontan, our CFO will review results in today’s call. Management will make certain forward looking statements. Actual results could differ materially from these forward looking statements due to a number of factors which are set forth in our earnings release, our slide presentation and our SEC filings. Entergy does not assume any obligation to update these forward looking statements. Management will also discuss non-GAAP financial information reconciliations to the applicable GAAP measures measures are included in today’s press release and slide presentation, both of which can be found on the Investor Relations section of our website. And now I will turn the call over to Drew.

Drew Marsh (Chair and CEO)

Thank you Liz Good morning everyone. We had a productive first quarter in which we delivered strong financial results. We launched our Fair Share plus pledge and we advanced customer initiatives with the execution of several electric service agreements, including the one with META that improve our financial outlook well into the future.. Beginning with financial results today we are reporting first quarter adjusted earnings per share of $0.86. 2026 guidance remains on track and we are increasing our already strong adjusted EPS outlook driven by 8.5% retail sales growth. Now I’ll cover the business updates in the quarter and as always, I’ll start with the customer. For several years we have worked with stakeholders to recruit data centers and capture the transformative impact they can have on our communities and through investment, jobs and other support, all at the same time protecting and benefiting existing customers. Earlier this year we formalized that commitment with the launch of our Fair Share+ pledge. The Fair Share+ pledge is a set of guiding principles that ensures that data centers pay their fair share for the power they consume plus additional benefits for customers and communities. Our pledge aligns with the Ratepayer Protection Pledge that our customers signed with the White House. Fair Share is achieved in several ways. Minimum bills and contract length cover incremental costs, termination provisions ensure current customers avoid unneeded costs, clean energy terms support a potential future transition, and strong credit terms give us confidence in all of it. Fair share also means that data centers cover their portion of fixed costs that our current customers pay for today. The fair share portion alone is the source of the estimated $7 billion of benefits we have highlighted, and current customers bills will be lower than they otherwise would have been because data centers are paying for the incremental infrastructure they need as well as their share of fixed costs. The plus component is all of the community benefits originally envisioned by our state and local leaders, including well paying jobs and targeted workforce development a substantial influx of new support for schools, nonprofits and other state and community needs and multiplier effects from new businesses and employment opportunities that come about because of the data centers. The plus component also includes a stronger electric system with reliability and resilience benefits, lower average fuel costs driven by more efficient generation, and specific customer benefits like low income or energy efficiency support. The plus component is clearly valuable and it is in addition to our estimated $7 billion in customer benefits. We’re proud that the framework we committed to more than two years ago is already providing significant benefits for our customers and communities, and those benefits will compound well into the future.. I cannot say enough about the tremendous work our employees have done to create this transformative opportunity for our communities while also providing so much value for our existing customers. And we aren’t done yet. In late March, we announced a new electric service agreement with MEDA for another data center in North Louisiana. The fair share value from this agreement alone is expected to be $2 billion, which is included in the $7 billion I mentioned in the plus category. Over the next 20 years, MEDA has made other commitments $140 million for energy efficiency programs and $60 million for our Power to Care program. Entergy Louisiana will match power to CARE funding, bringing the increase to $120 million. For context, that is a five times annual increase for 2025 levels that will meaningfully improve outcomes for our most vulnerable customers. Shortly after executing the agreement, Entergy Louisiana filed an application with the Louisiana Public Service Commission requesting approval for assets needed as a result of adding the new META data center to the system. The investment includes seven new combined cycle units, transmission infrastructure and battery storage facilities. The cost of the proposed facilities will be covered by payments from meta, whether from their tariff or other contributions. Yet all customers will realize reliability and resilience benefits and lower fuel costs from these investments. We also agreed to pursue another 2 1/2 gigawatts of Renewables and further investigate CCS, nuclear upgrades and new nuclear to support META’s clean energy goals. We’ll add projects to the plan as assets are identified. This month, the Commission affirmed that our request falls under their new Louisiana Lightning Initiative, and they directed that the procedural schedule should support a decision at the December B and E meeting. The Commission’s Lightning Initiative is part of Governor Landry’s Project Lightning Speed to support economic development that provides significant benefits to state and local communities. We are requesting approval for more than $15 billion in capital with about $14 billion in our four year plan. As a result of the agreement and pending the approval request, we’re also raising our sales and adjusted EPS outlook. Kimberly will discuss in more detail beyond the META agreement. So far this year we have signed ESAs totaling over 1,000 megawatts. These agreements were from multiple industries across all our operating companies and they indicate that customer growth beyond data centers remains robust in our region. We also continue to receive data center interest within our service area. After all agreements signed to date, including the recent agreement with META, we still have a pipeline of 7-12 GW of potential data center customers that are not in our plan. Moving beyond the customer growth update, I’d like to cover a few more items. Operational excellence remains a key focus area and we will talk in more detail about that at Investor Day. For today, I’ll share a couple of highlights. Orange County Advanced Power Station achieved its first fire milestone, bringing it one step closer to delivering reliable power for our customers in Texas. We expect the plant to be fully online in late summer. Recently, our power delivery team identified more than $30 million in capital savings on the Commodore to Churchill 230kV project. Our engineers developed a solution which improved the design, lowered materials cost and enabled faster customer delivery. Importantly, the improvement can be applied to future large transmission projects. This kind of innovative thinking, combined with the scale of our capital plan will continue to lower costs for customers and unlock additional customer investment opportunities. Entergy Texas is working to expand its spending generation capacity to serve a growing customer base. Following the Commission’s feedback, they issued an RFP in February for combined cycle capacity and energy across our system. We continue to expand our Renewables portfolio driven by our customers desire for clean energy options. We have active RFPs for more than 1,600 megawatts of Renewables and storage and we have over 4,500 megawatts of Renewables and storage in various stages of negotiation. After selections from prior RFPS in Arkansas, Louisiana and Mississippi. Roughly two thirds of the megawatts in negotiation would be owned. In addition, we are actively managing proposals through Louisiana’s accelerated Renewable review process. These are important tools to help us identify projects supporting customers Clean Energy Goals as we indicated on the previous earnings call, Energy Arkansas filed its base rate case in late February requesting a $45 million rate change which is less than 2%. Because bill impacts vary by customer type, the residential impact would be less than 1%. Some of the features that we requested include an optional time of use rate that provides residential customers with the opportunity to lower bills by shifting energy use to lower cost hours and low income rates that provide a 50% discount on the customer charge for households that qualify for LIHEAP assistance. We also elected to resume Entergy Arkansas Forward Test Year FRP after the rate case is resolved. Entergy Mississippi filed its annual formula rate plan with no change requested. Arkansas and Mississippi both have mechanisms that provide cash allowance for funds used during construction for investments to support significant economic development projects. To that end, Entergy Arkansas filed its first annual Generating Arkansas Jobs act rider in March and Entergy Mississippi updated its interim facilities rate adjustment in January. One additional comment about Mississippi the state recently passed legislation authorizing securitization of costs associated with Winter Storm. Fern Kimberly will provide additional details on that as well Beyond Fair Share plus Our employees continue to work every day for the benefit of the communities we serve. We recently participated in the industry’s LIHEAP Action day in Washington, D.C. to advocate for energy affordability for our customers in need. Congress approved an appropriations package that includes a $20 million increase for LIHEAP, which reflects growing recognition of the program’s importance. For more than 15 years, Entergy has also provided free tax preparation for low to moderate income customers at sites throughout Entergy’s region. In 2025, we helped customers receive $54 million in earned income tax credits, putting money directly into our customers pockets. Finally, we are very excited about our upcoming Investor Day in June. Plan to walk through the clear line of sight for our multi year strategy and outlooks in detail and you’ll hear directly from our leadership team on the opportunities ahead. Highlights will include a conversation with large customers on how we partner together to create better outcomes for our key stakeholders, a view into our operational strategy to successfully execute on the large build cycle ahead of us, a discussion of the work we are doing to unlock additional capital deployment opportunities, a review of our approach to maintaining financial discipline, and finally, a deeper dive into the significant near and long term customer growth opportunities to sustain our strong growth well beyond our five year outlook. We had a productive start to 2026 with solid progress and execution across the business and by continuing to put our customers first, we will deliver premium value to each of our key stakeholders. We look forward to discussing this in more detail with you at our Investor Day. I’ll now turn the call over to Kimberly for the financial update.

Kimberly Fontan (Chief Financial Officer)

Thank you Drew. Good morning everyone. I’ll now review our financial results and provide an update on our long term outlooks. Our results for the quarter were straightforward. Our adjusted EPS was $0.86 as shown on slide 4. The primary drivers were from the effects of investments made for our customers, including regulatory actions net of higher depreciation expense taxes other than income taxes and interest expense from financing capital expenditures. The per share increase was partially offset by a higher share count from settling equity forwards. Industrial sales growth was very strong at 15% as new and expansion projects continue to ramp up their operations. Overall retail sales increased 6%. The earnings contribution from retail sales growth was essentially neutral as higher revenue from the industrial growth was offset by the effects of weather, including positive weather in the first quarter of last year. As Drew discussed, the MEDA contract creates significant customer and community benefits. In addition, we are refreshing our outlooks to reflect the new agreement and other minor updates. The highlights are summarized on slide 5. This agreement further strengthens our retail sales outlook. We now expect approximately 8.5% compound annual retail sales growth through 2029 driven by 16%. Industrial growth data centers continue to be a significant driver along with growth from a variety of traditional Gulf south industries including lng, industrial gases, petrochemicals, agricultural chemicals and primary metals. As a reminder, we only add hyperscale data centers to our plan once we have a signed electric service agreement and then we include them at minimum bill levels. This conservative approach ensures that we can count on the revenue that we’ve included in our plan. Our customer centric four year capital plan is now $57 billion, which is 14 billion higher than our plan quarter. The increase includes the investment needs resulting from the new customer agreement, primarily seven new CCCTs as well as battery storage projects. All seven CCCTs have in service dates in 2030 and 2031 such that not all of the capital for these units is in our four year horizon. For the transmission investments in the filing, we’ve made a conservative assumption not to include them as we work through financing options. We have also not yet included the renewables or Riverbend nuclear upgrade investments discussed in our filing. These would be added to the plan as specific projects are firmed up. The equity associated with our four year plan is now $6.6 billion at the lower end of our target range of 10 to 15% of the total capital plan. Our strategy to be proactive in addressing our equity needs provides certainty and flexibility, giving us ample time to raise. We have successfully sold forward contracts through our robust ATM program as well as the block transaction we executed last March. The agreements we have in place cover about 30% of our four year need with 1.9 billion already contracted. That leaves $4.7 billion to be sourced which is not expected to be needed until late 2027 through 2029. Our forecast also includes $3 billion of hybrid instruments at parent slide 6 summarizes our credit ratings and affirms that our credit metric outlooks remain better than rating agency thresholds. Our plan reflects FFO to debt at or above 15% from Moody’s metric throughout …

Full story available on Benzinga.com

This post was originally published here

Highwoods Props (NYSE:HIW) held its first-quarter earnings conference call on Wednesday. Below is the complete transcript from the call.

This transcript is brought to you by Benzinga APIs. For real-time access to our entire catalog, please visit https://www.benzinga.com/apis/ for a consultation.

The full earnings call is available at https://events.q4inc.com/attendee/653907737

Summary

Highwoods Properties Inc reported strong leasing activity, increasing its leased rate by 50 basis points for in-service properties and 800 basis points for development properties.

The company invested $108 million in properties in Dallas and Raleigh while selling $42 million of non-core properties in Richmond, improving portfolio quality.

FFO was reported at $0.84 per share, and the company maintained its annual outlook, with expectations of significant NOI and cash flow growth as occupancy increases.

Highwoods Properties Inc plans to sell $200 million of additional non-core assets by mid-year and may use proceeds for share buybacks or further investments.

Management highlighted strong leasing performance in key markets like Dallas and Charlotte, driven by favorable demographic trends and limited new office supply.

Full Transcript

OPERATOR

Good morning and welcome to the Highwoods Properties Inc first quarter 2026 earnings call. All participants are in a listen only mode. After the speaker’s remarks, we will conduct a question and answer session. To ask a question at this time, you’ll need to press STAR followed by the number one on your telephone keypad. As a reminder, this conference call is being recorded. I would now like to turn the call over to Brendan Mayarana, Executive Vice President and Chief Financial Officer. Thank you. Please go ahead.

Brendan Mayarana (Executive Vice President and Chief Financial Officer)

Thank you operator and good morning everyone. Joining me on the call this morning are Ted Klink, our Chief Executive Officer and Brian Leary, our Chief Operating Officer. For your convenience, today’s prepared remarks have been posted on the web. If you have not received yesterday’s earnings release or supplemental, they’re both available on the Investors section of our website at highwoods.com on today’s call, our review will include non GAAP measures such as FFO, NOI and EBITDAIR. The release and supplemental include a reconciliation of these non GAAP measures to the most directly comparable GAAP financial measures. Forward looking statements made during today’s call are subject to risks and uncertainties. These risks and uncertainties are discussed at length in our press releases as well as our SEC filings. As you know, actual events and results can differ materially from these forward looking statements and the Company does not undertake a duty to update any forward looking statements. With that, I’ll turn the call over to Ted.

Ted Klink (Chief Executive Officer)

Thanks Brendan and good morning everyone. We had an excellent quarter executing on our key initiatives. Leasing volume was strong across our in service and development properties. This is clear from the 50 basis point increase in our leased rate on our in service portfolio. An 800 basis point increase in our lease rate on our developments. Both of these will deliver meaningful upside in NOI cash flow and FFO over the next few years as occupancy ramps. During the quarter we invested 108 million in best in class commute worthy properties in locations in Dallas and Raleigh through joint ventures and sold 42 million of non core properties in Richmond. All of this activity improves our portfolio and further cements the foundation for pushing our growth rate and cash flows meaningfully higher and will result in long term value creation for our shareholders. Even with our strong performance in the quarter, we recognize the broader narrative that advances in AI could reshape the workforce and therefore affect long term office demand. The range of potential outcomes is wide and varied and at this point there are many unknowns. What we do know however is that customers and prospects haven’t diminished their appetite for space and are making long term commitments to their in office strategies. Activity across our portfolio, our markets and our is strong. Leasing was solid in the quarter. Our leasing pipeline remains robust, high quality space across our is dwindling and there’s little to no new supply expected during the foreseeable future. This flight to quality dynamic creates a strong backdrop for occupancy gains and rent growth both of which we experienced in the first quarter. Additionally, credit worthy customers are willing to make long term commitments as evidenced by our weighted average lease term on second gen lease volume of seven and a half years more than one year longer than our recent average lease term. Further, demographic trends across our footprint are favorable with business relocations and expansions reaccelerating driving healthy population and job growth. We firmly believe high quality commute worthy properties and locations owned by well capitalized landlords are best positioned to capture increasing demand and improving economics. Turning to the quarter, we delivered solid financial performance with FFO of $0.84 per share and we maintained our outlook for the year. Our leasing performance was Excellent. We signed 958,000 square feet of second gen leases including over 300,000 square feet of new leases. We delivered gap rent growth of 19.4% and cash rent growth of 4.8%. Net effective rents were the second highest in company history and 9% higher than the prior five quarter average expansions which we include as renewals outpace contractions at a ratio of nearly 2 to 1. In addition, we signed 107,000 square feet in the first gen leases across our development properties. Customers and prospects recognize the blocks of high quality located office space with well capitalized owners are diminishing across our footprint which gives us strong pricing power in the best sub markets. We placed in service more than 200 million of 87% leased development properties during the quarter. Glen Lake 3, which comprises 203,000 square feet of office and 15,000 square feet of retail is now 94% leased. Across the street we delivered Glen Lake 2 retail which is 100% leased to Crooked Hammock Brewery. The addition of 24,000 square feet of food and beverage options elevates Glen Lake’s offerings and complements the nearly 1 million square feet of office we have here. This has supported our ability to push rents across this park in West Raleigh. We also placed in Service Granite Park 6 and Dallas’s Legacy. This 422,000 square foot best in class office property is 80% leased. We also made strong progress leasing up our two remaining development properties 23 Springs, our 642,000 square foot development project in Uptown Dallas continues to garner strong activity with the least rate now 83% up from 75% last quarter and 62% 12 months ago. We have strong prospects to bring our leased rate at 23 Springs into the 90s. In Tampa’s West Shore, our 143,000 square foot Midtown east development is now 95% leased, up from 76% last quarter and 39% 12 months ago. The office component at Midtown east is 100% leased on a combined basis. The properties placed in Service during the first quarter and in our remaining development pipeline for 86% leased but only 48% occupied. As the leases commence, we will capture significant growth in NOI cash flow and FFO. We are starting to receive interest from build to suit and sizable anchor prospects for potential new development. It’s still early and it’s hard to say whether any of these discussions will result in new projects, but the increased interest is encouraging and signifies the limited inventory companies face when searching for large blocks of high quality space. On the disposition front, we sold a non core portfolio in Richmond for 42 million. As reflected in our outlook, we expect to sell roughly 200 million of additional non core assets by the middle of this year and are marketing other assets for sale. We believe we will be able to redeploy capital from non core asset and land sales on a leverage neutral basis that will further strengthen our cash flows and result in higher growth. As we announced last week, we may also use non core disposition proceeds to repurchase up to 250 million of outstanding shares of our common stock on a leverage neutral basis. We continue to evaluate acquisition opportunities and highly pre leased developments, but repurchasing our shares is another capital deployment option we now have in our arsenal. Before turning the call over to Brian, I want to reiterate the priorities we have highlighted over the past few years that will drive long term value creation for our shareholders. First, we will continue to drive occupancy towards stabilized levels in our operating portfolio. Second, we will deliver and stabilize our development pipeline. Third, we will improve our portfolio quality and long term growth rate by recycling out of non core capex intensive assets in non locations and invest in properties with better cash flows and higher long term growth rates. And fourth, we will do all this while maintaining a strong and flexible balance sheet. We made meaningful progress on each of these priorities during the first quarter. We believe the focus on these 4 areas combined with a strong fundamental backdrop in our core due to the healthy demand and limited new supply will drive significant growth in cash flow and long term value over the next several years.

Brian Leary (Chief Operating Officer)

Brian thanks Ted and good morning everyone. Our operating results continue to reflect the advantage of owning commute worthy amenitized assets in the best business districts of high growth Sunbelt metros. Fundamentals across our markets continue to improve as evidenced by vacancy rates and sublease space. Declining rents are up which combined with steady concession packages has resulted in higher net effective rents. As far as supply goes, the best of the best and the best of the rest are in high demand. With office construction at historic lows or non existent in many markets, new office inventory is in scarce supply with demolitions outpacing deliveries nationwide. The flight to quality has become in many cases an all out sprint to quality with users proactively inquiring for early extensions to lock in location and terms. A common theme across our markets is that office rents pale in comparison to the investment customers have in their people and that exceptional environments and experiences yield superior results when their people are in the office and being better together. Customers are choosing well located, highly amenitized Class A buildings with well capitalized owners and customer centric operations and they are willing to pay for it. They are moving to metros that continue to win people and companies with the highest quality of life and most business friendly outlooks. This is the Highwoods Portfolio. This is the Highwoods team and these are our Sunbelt markets and BBDss. Starting with Dallas, the Metroplex remains one of the country’s premier destinations for corporate headquarters and expansions, which shouldn’t be a surprise at this point considering it is Site Selection Magazine’s number one city for headquarter relocations and as in the state Chief Executive Magazine has deemed as the best for business 21 consecutive years from 2018 through 2024, Dallas landed roughly 100 headquarter relocations, with 11 more in 2025. The region continues to attract diverse firms across financial and professional services, advanced manufacturing, logistics and life sciences seeking a central location, business friendly environment and a deep labor pool. That macro story is consistent with the office fundamentals you see in the Q1 broker data. According to Cushman and Wakefield, VFW recorded 117,000 square feet of positive net absorption in the first quarter of 2026, its fifth consecutive positive quarter, with nearly 340,000 square feet of positive absorption in Class A. As Class B continues to shed space, our Dallas portfolio is in Uptown, Legacy and Preston center which is the tightest submarket in the region with less than 6% vacancy and is home to one of our latest acquisitions, the terraces. These BBDss are squarely in the path of demand. The mark to market we’re realizing via second generation leasing both at McKinney and Olive and the Terraces is significant, generating gap rent spreads of 27%. Turning to Charlotte, the city is increasingly recognized as a strategic hub that’s being validated by headline corporate decisions. Among the 104 metros that Cushman and Wakefield tracks, Charlotte was number one for job growth. To that end and subsequent to our most recent earnings call in February, three global financial institutions have made major new job announcements already with an established home in Charlotte South Park DBD, where we have almost 800,000 square feet. JP Morgan recently announced plans for an eventual 1,000 job regional hub with 400 of those to be hired by 2028. Two new entries to the market include Capital Group’s Plan New Home in Uptown with 600 new employees and after a nationwide search, Sumitomo Mitsui Banking Group, one of Japan’s largest banks, selected Uptown as well for a second US headquarters, creating 2,000 jobs by the end of 2032, with an average salary for these 2,000 jobs projected to be over $165,000 a year. This macro backdrop aligns perfectly with Q1 office fundamentals. CBRE noted approximately 410,000 square feet of positive net absorption in the first quarter and total leasing volume of roughly 1.4 million square feet up nearly 74% year over year, with about 70% of that volume in …

Full story available on Benzinga.com

This post was originally published here

Since the establishment of Modern Portfolio Theory in the 1950s, the 60/40 portfolio has been the “set it and forget it” gold standard of investing. Its logic was simple – when stocks took a tumble, bonds acted as the shock absorber.

But, in 2026, that spring has gone damp. Bonds are no longer behaving like the defensive anchor they once were.

Recent research from KKR confirms what investors might already have suspected – a fraying relationship between stocks and bonds. Instead of moving in opposite directions, the two asset classes are becoming increasingly positively correlated. When the “risk-off” switch is flipped, both sides of the traditional portfolio are now bleeding at the same time.

The Great Repositioning

This shift isn’t just a theoretical headache for retail investors; the world’s biggest “smart money” players have been front-running this reality for years.

Norway’s $2.1 trillion Sovereign Wealth Fund, the world’s largest, has slowly rewritten its playbook. Once a conservative giant with roughly 40% in equities in the late 2000s, the fund has pushed its equity exposure as high as 70%.

Yet, despite …

Full story available on Benzinga.com

This post was originally published here

SNDL Inc (NASDAQ:SNDL) shares are trading lower on Wednesday afternoon after reporting first-quarter financial results that featured a revenue miss. Here’s what investors need to know.

SNDL Q1 Financial Performance and Segment Data

The company posted a net loss of four cents per share, which was in line with analyst expectations, but its net revenue of $195.9 million fell short of the estimated $210.3 million.

This performance represents a 4.4% revenue decrease from the same period in the prior year, a decline primarily driven by market headwinds impacting both the liquor and cannabis segments.

The liquor retail division saw revenue slide 4.9% to $104.1 …

Full story available on Benzinga.com

This post was originally published here

Families of victims involved in a mass shooting on Feb. 10 in Tumbler Ridge, British Columbia, sued Sam Altman and OpenAI in San Francisco federal court.

The plaintiffs claim that OpenAI’s chatbot, ChatGPT, failed to alert authorities to the mass shooting.

The mother of one of the victims, a 12-year-old girl who remains in the ICU, filed the first lawsuit. Another mother, whose child was killed, filed a second lawsuit. Other victims and their families plan to file more lawsuits in the coming weeks, The Guardian reported.

The shooter, identified as 18-year-old Jesse Van Rootselaar, carried out a mass shooting at Tumbler Ridge Secondary School. Eight people died. The victims included Van Rootselaar’s mother and stepbrother before the shooting, as well as six others at a school. Five of the victims were children. More than two dozen additional people were injured.

Van Rootselaar was found dead at the scene from what investigators believe was a self-inflicted gunshot wound.

OpenAI employees flagged the shooter’s account eight months before the …

Full story available on Benzinga.com

This post was originally published here

Rush Enterprises (NASDAQ:RUSHB) held its first-quarter earnings conference call on Wednesday. Below is the complete transcript from the call.

Benzinga APIs provide real-time access to earnings call transcripts and financial data. Visit https://www.benzinga.com/apis/ to learn more.

Access the full call at https://edge.media-server.com/mmc/p/rc4sc8fa/

Summary

Rush Enterprises Inc reported first quarter 2026 revenues of $1.68 billion, with net income of $61.5 million or $0.77 per diluted share.

The company declared a quarterly cash dividend of $0.19 per share, emphasizing its commitment to returning value to shareholders.

Despite a challenging commercial vehicle market, the company expects the first quarter to be the trough and anticipates improvement driven by increased order activity and customer optimism.

Aftermarket services, leasing, and rental businesses remained strong and contributed significantly to profitability, with the aftermarket business accounting for 66% of gross profit.

Strategic initiatives included signing an agreement to acquire Peterborough dealerships in Louisiana and Mississippi, expected to close in June.

Management highlighted the importance of emissions regulations and the anticipated impact on future truck sales, with a focus on maintaining inventory levels and managing costs effectively.

The company expects gradual improvement in truck sales and aftermarket performance, supported by improving freight conditions and customer sentiment.

Full Transcript

OPERATOR

Good day and thank you for standing by. Welcome to Rush Enterprises Inc’s first quarter 2026 earnings conference call. At this time, all participants are in a listen only mode. After the speaker’s presentation, there’ll be a question and answer session. To ask a question during the session, you’ll need to press star 11 on your telephone. You will then hear an automated message advising your hand is raised to withdraw your question. Please press star 11 again. Please be advised that today’s conference is being recorded. I would now like to turn the conference over to your speaker for today, Rusty Rush, Chairman, CEO and President. Please go ahead.

Rusty Rush (Chairman, CEO and President)

Well, good morning and welcome to our first quarter 2026 earnings release call. With me on the call this morning are Steve Keller, Chief Financial Officer, Jody Pollard, Chief Operating Officer, Jay Hazelwood, Vice President Controller, and Michael Goldstone, Senior Vice President, General Counsel and Corporate Secretary. Before I get started, Steve will say a few words regarding forward looking statements.

Steve Keller (Chief Financial Officer)

Certain statements we will make today are considered forward looking statements as defined in the Private Securities Litigation Reform act of 1995. Because these statements include risks and uncertainties, our actual results may differ materially from those expressed or implied by such forward looking statements. Important factors that could cause actual results to differ materially from those expressed or implied by such forward looking statements include but are not limited to or those discussed in our annual report on Form 10-K for the year ended December 31, 2025 and in our other filings with the Securities and Exchange Commission.

Rusty Rush (Chairman, CEO and President)

Thank you Steve and thanks everyone for joining us today. As we reported yesterday, we generated revenues of $1.68 billion in the first quarter with net income of $61.5 million or 77 cents per diluted share. We also declared a quarterly cash dividend of $0.19 per share, which reflects our continued focus on returning value to shareholders. Now, stepping back for a minute, the first quarter was still a tough environment for the commercial vehicle market industry wide. Retail sales for new trucks remained at historically low levels and we’re still working through the effects of the freight recession, excess capacity and general economic uncertainty. That said, we do believe this quarter represents the trough of the cycle and more importantly, we’re starting to see some early signs that things are moving in the right direction. Freight rates improved a bit, miles driven began to pick up, and customer sentiment started to feel a little more optimistic. As a result, we saw increased quoting activity and order intake as the quarter progressed, especially from our large fleet customers. That hasn’t translated into sustained strength in truck sales yet, but it’s a good leading indicator and gives us Confidence that demand is starting to come back. One thing that stood out again this quarter is the strength of our business model. Even with soft truck sales, our aftermarket leasing and rental businesses, along with disciplined expense management, helped us stay very profitable and perform well overall. We also stayed focused on growing the business. During the quarter, we signed an agreement to acquire Peterbilt dealerships in southern Louisiana and Mississippi. We expect to close that deal and begin operating those locations as Rush Truck Centers in June. So even in a down cycle, we continue to invest in the business, expanding into new markets and positioning ourselves for long term growth. Our aftermarket business continues to be a key strength for us. It made up roughly 66% of our gross profit in the quarter and generated 627 million in revenue, up slightly year over year. Demand was still soft in some segments, excuse me, especially for some of our over the road customers. But overall we were able to deliver growth, which speaks to the strength of our relationships and our execution. We also started seeing to starting to see some positive indicators here. More freight activities and more miles being driven, which should translate into stronger parts and service demand as customers begin catching up on deferred maintenance. Our aftermarket strategic initiatives are also making a difference. Our inspection processes and parts delivery optimization have gained traction across our network and are delivering incremental revenue, increasing uptime for our customers and delivering a better experience overall. Looking ahead, we expect the aftermarket to gradually improve as we move through the year and continue to be a key driver for our performance. Turning to truck sales, the market was still very tough in the first quarter with Class 8 truck sales at their lowest level since COVID But even in that environment, we performed well. We sold 2,964 Class 8 trucks in the US and captured a 7.2% market share. That really comes down to execution, having the right inventory and the diversity of our customer base. As I mentioned earlier, we saw solid order activity and increased engagement from customers during the quarter. We think that’s being driven by improving freight conditions and customers beginning to plan for 2027 engines. Emissions emissions regulations Class 4 through 7 truck sales saw the worst demand since 2015, but our results were more about timing than demand. Some large fleet customers pushed deliveries until later in the year, so we expect that to benefit benefit us in the coming quarter. Used truck demand improved as we move through the quarter and we’re seeing better conditions tied to improving spot rates and tighter capacity. So overall, while the first quarter was slow, we expect sales to improve gradually in the second quarter and then pick up in the second Pick up more in the second half of the year. Renewal leasing continue to be strong and growing part of our business. Revenue was 92 million in the quarter, up a little over 2%. Year over year. Leasing demand remains strong as customers look to replace aging equipment and get ahead of cost increases tied to the upcoming emissions regulations. Rental is below where we’d like it to be, driven by current market conditions, but it did improve as the quarter progressed, and we expect the utilization to continue trending up through the year. Overall, rush truck leasing continues to generate consistent reoccurring revenue and remains an important contributor to our performance. So to wrap it up, the first quarter reflected the ongoing pressure from the freight recession and weak truck demand. But we delivered solid earnings and profitability. That speaks to the strength and balance of our business. We believe we’re at the bottom of the cycle and we’re encouraged by early signs we are seeing whether that’s freight customer activity or order trends. As conditions continue to improve, we believe we’re well positioned to capture that demand and grow the business. Before I close, I want to thank our employees across the company. Their focus, discipline and commitment to our customers continue to drive our performance, especially in a very challenging environment like this. With that, I’ll take your questions.

OPERATOR

Thank you. As a reminder, if you’d like to ask a question, please press Star one one on your telephone. You’ll hear the automated message advising your hand is raised. We also ask that you please wait for your name and company to be announced before proceeding with your question. One moment while we compile the Q and A roster, our first question for the day will be coming from the line of avi. Audrey Lashwin of ubs. Your line is open.

Audrey Lashwin (Equity Analyst at UBS)

Hey, good morning, guys. So glad to see that the year is still on track for improvement sequentially. But, you know, just thinking about the second half year, it sounds like there’s still a decent amount of uncertainty around the pre buy for this year on just a number of fronts. Whether the OEMs (Original Equipment Manufacturers) are going to have new engines ready and how the rules are going to be enforced and the demand dynamics around that. Can you just give us a rundown on how those different moving parts are shaping your expectations??

Rusty Rush (Chairman, CEO and President)

Well, that’s a good statement there, avi. It’s kind of crazy, isn’t it? We’re. What are we? We’re April 30 tomorrow. We got eight months left in the year and we still don’t have definitive regulations printed. Okay, now, when I’m talking about emissions regulations, they have sent out signals and told People the EPA has of what they’re going to do, right, they’re going to keep supposedly at 0.35, but they have not clarified about credits, et cetera. If there’s going to be NCPs (Noncompliance Penalties), things like that, we’re probably still 60 days away from it. But regardless of that, we do know that there are going to be new emissions regulations, you know, so I think that’s spurred customers to go ahead. You know, order activity, as you can see starting in December has been up dramatically from where it was the prior seven or eight months from order intake. So you know, even with that uncertainty, you know there is certainty of something going down. Exactly what it is we’re not exactly sure because it hasn’t been posted by the EPA yet. So you know, we’ll still have to follow that and see. We hope to know within the next 45 to 60 days. But if I had been, if I told you that 45 days ago and held my breath, I wouldn’t be in very good shape because I told you I’d known by now. So it keeps getting, the candy is keep getting kicked down the road a little bit. So I think the most important thing is that, you know, customers, business is people are more optimistic finally because of the contraction on the supply side, right, of taking trucks out, whether it was through non domicile building less trucks in the back half of last year, building less trucks in the first quarter of this year, we slowed the intake down so the supply side squeezed down. Customers are more optimistic about rates coming in. If you’d asked me three or four months ago, everybody said, I know this is one of your questions, but you know me, I’m going to ramble on that, you know, we’re going to be flat to low singles and it was mid singles and now people look at maybe high single digit increases. So people are optimistic at the same time to your point about emissions not knowing clear, not knowing clearly what it’s going to be, what the state is. But we do know it’s going to be worse whether there would be NCPs (Noncompliance Penalties) and the cost would go up dramatically or the total enforcement of what’s out there for EPA. January 27th. So that’s about the best thing I can tell you is there’s still uncertainty but you know, something’s coming down the tracks. Right. You just don’t know exactly what. Got it.

Audrey Lashwin (Equity Analyst at UBS)

Appreciate that Rusty. And just to follow on a point there. So thinking about the improving conditions within the freight market, as you just noted, really more driven by supply reductions, capacity reductions that doesn’t necessarily help the parts and service side as much as improving freight activity. So what are you seeing there and when do you think we might see parts and service volumes inflect positively?

Rusty Rush (Chairman, CEO and President)

Yep. You know, it’s funny, people, theoretically, you know, people believe that when truck sales go down,, okay, that you’re going to get more parts than service. Well, that’s not really actually the case because people are cutting back their budgets and things. And that’s what we’ve seen. Right. That’s why we’ve been fairly flat over the last couple three quarters. Right. We’ve even in spite of inflation, we’ve had, we’ve remained flat. And that’s because people have tightened their belts. The best thing I can see is for their business to get better. Right. Historically, when customers feel better about looking forward and more optimistic, there will be no postponement of any maintenance or repairs because it’s just like anything, you know, when your income level goes down, you learn how to take your outcome, what you spend down too. It’s no different than you as a person managing your household. So that’s what customers have done. The most encouraging thing for me is going to be hopefully seeing second and third quarter releases and listen and hearing about contract rates going up. So that optimistic, that optimism that we see out there, you know, comes to fruition is the best way I can describe it. We expect, I would tell you this, we’ve been going slightly, I’m not happy with it, but we have gradually gone January. February was better than January, March was better than February, and April looks like it’s going to be a little …

Full story available on Benzinga.com

This post was originally published here

On Wednesday, Rush Enterprises (NASDAQ:RUSHA) discussed first-quarter financial results during its earnings call. The full transcript is provided below.

Benzinga APIs provide real-time access to earnings call transcripts and financial data. Visit https://www.benzinga.com/apis/ to learn more.

The full earnings call is available at https://edge.media-server.com/mmc/p/rc4sc8fa/

Summary

Rush Enterprises Inc reported first quarter 2026 revenues of $1.68 billion with a net income of $61.5 million or $0.77 per diluted share. A quarterly cash dividend of $0.19 per share was declared.

The company noted challenges in the commercial vehicle market due to a freight recession and economic uncertainty but observed early signs of recovery with improved freight rates and increased customer sentiment.

Strategic growth included signing an agreement to acquire Peterborough dealerships in Louisiana and Mississippi, expected to be operational in June.

Aftermarket business remained a key strength, contributing 66% of gross profit with $627 million in revenue, showing slight growth year-over-year despite soft demand in some segments.

Truck sales were impacted with Class 8 sales at their lowest since COVID, but the company maintained a 7.2% market share, and improved order activity was noted, especially from large fleet customers.

Leasing and rental businesses continued to perform well, with leasing revenue up over 2% year-over-year.

Management expressed optimism for gradual improvement in sales and parts and service demand throughout the year, citing improving freight conditions and upcoming emissions regulations as drivers.

The company focused on disciplined expense management, maintaining solid earnings and profitability despite market pressures.

Full Transcript

OPERATOR

Good day and thank you for standing by. Welcome to Rush Enterprises Inc’s first quarter 2026 earnings conference call. At this time, all participants are in a listen only mode. After the speaker’s presentation, there’ll be a question and answer session. To ask a question during the session, you’ll need to press star 11 on your telephone. You will then hear an automated message advising your hand is raised to withdraw your question. Please press star 11 again. Please be advised that today’s conference is being recorded. I would now like to turn the conference over to your speaker for today, Rusty Rush, Chairman, CEO and President. Please go ahead.

Rusty Rush (Chairman, CEO and President)

Well, good morning and welcome to our first quarter 2026 earnings release call. With me on the call this morning are Steve Keller, Chief Financial Officer; Jody Pollard, Chief Operating Officer Jay Hazelwood, Vice President and Controller and Michael Goldstone, Senior Vice President, General Counsel and Corporate Secretary. Before I get started, Steve will say a few words regarding forward looking statements.

Steve Keller (Chief Financial Officer)

Certain statements we will make today are considered forward looking statements as defined in the Private Securities Litigation Reform act of 1995. Because these statements include risks and uncertainties, our actual results may differ materially from those expressed or implied by such forward looking statements. Important factors that could cause actual results to differ materially from those expressed or implied by such forward looking statements include but are not limited to or those discussed in our annual report on Form 10K for the year ended December 31, 2025 and in our other filings with the securities and Exchange Commission (SEC).

Rusty Rush (Chairman, CEO and President)

Thank you Steve and thanks everyone for joining us today. As we reported yesterday, we generated revenues of $1.68 billion in the first quarter with net income of $61.5 million or $0.77 per diluted share. We also declared a quarterly cash dividend of $0.19 per share., which reflects our continued focus on returning value to shareholders. Now, stepping back for a minute, the first quarter was still a tough environment for the commercial vehicle market industry wide. Retail sales for new trucks remained at historically low levels and we’re still working through the effects of the freight recession, excess capacity and general economic uncertainty. That said, we do believe this quarter represents the trough of the cycle and more importantly, we’re starting to see some early signs that things are moving in the right direction. Freight rates improved a bit, miles driven began to pick up, and customer sentiment started to feel a little more optimistic. As a result, we saw increased quoting activity and order intake as the quarter progressed, especially from our large fleet customers. That hasn’t translated into sustained strength in truck sales yet, but it’s a good leading indicator and gives us Confidence that demand is starting to come back. One thing that stood out again this quarter is the strength of our business model. Even with soft truck sales, our aftermarket leasing and rental businesses, along with disciplined expense management, helped us stay very profitable and perform well overall. We also stayed focused on growing the business. During the quarter, we signed an agreement to acquire Peterborough dealerships in southern Louisiana and Mississippi. We expect to close that deal and begin operating those locations as Rush Truck Centers in June. So even in a down cycle, we continue to invest in the business, expanding into new markets and positioning ourselves for long term growth. Our aftermarket business continues to be a key strength for us. It made up roughly 66% of our gross profit in the quarter and generated 627 million in revenue, up slightly year over year. Demand was still soft in some segments, excuse me, especially for some of our over the road customers. But overall we were able to deliver growth, which speaks to the strength of our relationships and our execution. We also started seeing to starting to see some positive indicators here. More freight activities and more miles being driven, which should translate into stronger parts and service demand as customers begin catching up on deferred maintenance. Our aftermarket strategic initiatives are also making a difference. Our inspection processes and parts delivery optimization have gained traction across our network and are delivering incremental revenue, increasing uptime for our customers and delivering a better experience overall. Looking ahead, we expect the aftermarket to gradually improve as we move through the year and continue to be a key driver for our performance. Turning to truck sales, the market was still very tough in the first quarter with Class 8 industry sales at their lowest level since COVID But even in that environment, we performed well. We sold 2,964 Class 8 trucks in the US and captured a 7.2% market share. That really comes down to execution, having the right inventory and the diversity of our customer base. As I mentioned earlier, we saw solid order activity and increased engagement from customers during the quarter. We think that’s being driven by improving freight conditions and customers beginning to plan for 2027 engines. Emissions emissions regulations Class 4 through 7 truck sales saw the worst demand since 2015, but our results were more about timing than demand. Some large fleet customers pushed deliveries until later in the year, so we expect that to benefit benefit us in the coming quarter. Used truck demand improved as we move through the quarter and we’re seeing better conditions tied to improving spot rates and tighter capacity. So overall, while the first quarter was slow, we expect sales to improve gradually in the second quarter and then pick up in the second Pick up more in the second half of the year. Renewal leasing continue to be strong and growing part of our business. Revenue was 92 million in the quarter, up a little over 2%. Year over year. Leasing demand remains strong as customers look to replace aging equipment and get ahead of cost increases tied to the upcoming emissions regulations. Rental is below where we’d like it to be, driven by current market conditions, but it did improve as the quarter progressed, and we expect the utilization to continue trending up through the year. Overall, rush truck leasing continues to generate consistent reoccurring revenue and remains an important contributor to our performance. So to wrap it up, the first quarter reflected the ongoing pressure from the freight recession and weak truck demand. But we delivered solid earnings and profitability. That speaks to the strength and balance of our business. We believe we’re at the bottom of the cycle and we’re encouraged by early signs we are seeing whether that’s freight customer activity or order trends. As conditions continue to improve, we believe we’re well positioned to capture that demand and grow the business. Before I close, I want to thank our employees across the company. Their focus, discipline and commitment to our customers continue to drive our performance, especially in a very challenging environment like this. With that, I’ll take your questions.

OPERATOR

Thank you. As a reminder, if you’d like to ask a question, please press Star one one on your telephone. You’ll hear the automated message advising your hand is raised. We also ask that you please wait for your name and company to be announced before proceeding with your question. One moment while we compile the Q and A roster, our first question for the day will be coming from the line of Avi Audrey Lashwin of ubs. Your line is open.

Avi Audrey Lashwin

Hey, good morning, guys. So glad to see that the year is still on track for improvement sequentially. But, you know, just thinking about the second half year, it sounds like there’s still a decent amount of uncertainty around the pre-buy for this year on just a number of fronts. Whether the Original Equipment Manufacturers (OEMs) are going to have new engines ready and how the rules are going to be enforced and the demand dynamics around that. Can you just give us a rundown on how those different moving parts are shaping your expectations?

Rusty Rush (Chairman, CEO and President)

Well, that’s a good statement there, avi. It’s kind of crazy, isn’t it? We’re. What are we? We’re April 30th tomorrow. We got eight months left in the year and we still don’t have definitive regulations printed. Okay, now, when I’m talking about emissions regulations, they have sent out signals and told People the Environmental Protection Agency (EPA) has of what they’re going to do, right, they’re going to keep supposedly at 0.35, but they have not clarified about credits, et cetera. If there’s going to be NCPS, things like that, we’re probably still 60 days away from it. But regardless of that, we do know that there are going to be new emissions regulations, you know, so I think that’s spurred customers to go ahead. You know, order activity, as you can see starting in December has been up dramatically from where it was the prior seven or eight months from order intake. So you know, even with that uncertainty, you know there is certainty of something going down. Exactly what it is we’re not exactly sure because it hasn’t been posted by the Environmental Protection Agency (EPA) yet. So you know, we’ll still have to follow that and see. We hope to know within the next 45 to 60 days. But if I had been, if I told you that 45 days ago and held my breath, I wouldn’t be in very good shape because I told you I’d known by now. So it keeps getting, the candy is keep getting kicked down the road a little bit. So I think the most important thing is that, you know, customers, business is people are more optimistic finally because of the contraction on the supply side, right, of taking trucks out, whether it was through non domicile building less trucks in the back half of last year, building less trucks in the first quarter of this year, we slowed the intake down so the supply side squeezed down. Customers are more optimistic about rates coming in. If you’d asked me three or four months ago, everybody said, I know this is one of your questions, but you know me, I’m going to ramble on that, you know, we’re going to be flat to low singles and it was mid singles and now people look at maybe high single digit increases. So people are optimistic at the same time to your point about emissions not knowing clear, not knowing clearly what it’s going to be, what the state is. But we do know it’s going to be worse whether there would be NCPS and the cost would go up dramatically or the total enforcement of what’s out there for Environmental Protection Agency (EPA). January 27th. So that’s about the best thing I can tell you is there’s still uncertainty but you know, something’s coming down the tracks. Right. You just don’t know exactly what. Got it.

Avi Audrey Lashwin

Appreciate that Rusty. And just to follow on a point there. So thinking about the improving conditions within the freight market, as you just noted, really more driven by supply reductions, capacity reductions that doesn’t necessarily help the parts and service side as much as improving freight activity. So what are you seeing there and when do you think we might see parts and service volumes inflect positively?

Rusty Rush (Chairman, CEO and President)

Yep. You know, it’s funny, people, theoretically, you know, people believe that when truck sales go down, okay, that you’re going to get more parts and service. Well, that’s not really actually the case because people are cutting back their budgets and things. And that’s what we’ve seen. Right. That’s why we’ve been fairly flat over the last couple three quarters. Right. We’ve even in spite of inflation we’ve had, we’ve remained flat. And that’s because people have tightened their belts. The best thing I can see is for their business to get better. Right. Historically, when customers feel better about looking forward and more optimistic, there will be no postponing of any maintenance or any repairs because it’s just like anything, you know, when your income level goes down, you learn how to take your outcome, what you spend down too. It’s no different than you as a person managing your household. So that’s what customers have done. The most encouraging thing for me is going to be hopefully seeing second and third quarter releases and listen and hearing about contract rates going up. So that optimistic, that optimism that we see out there, you know, comes to fruition is the best way I can describe it. We expect, I would tell you this, we’ve been going slightly, I’m not happy with it, but …

Full story available on Benzinga.com

This post was originally published here

Old Dominion Freight Line (NASDAQ:ODFL) reported first-quarter financial results on Wednesday. The transcript from the company’s first-quarter earnings call has been provided below.

Benzinga APIs provide real-time access to earnings call transcripts and financial data. Visit https://www.benzinga.com/apis/ to learn more.

The full earnings call is available at https://event.choruscall.com/mediaframe/webcast.html?webcastid=D3KvR7xX

Summary

Old Dominion Freight Line Inc reported a 2.9% year-over-year decline in revenue for Q1 2026, totaling $1.33 billion, despite an improvement in LTL volumes later in the quarter.

The company maintained a 99% on-time service and a claims ratio below 0.1% while focusing on yield management to support strategic investments.

Old Dominion Freight Line Inc plans to invest $265 million in 2026, continuing its strategy to prepare for future growth and handle increased volumes.

The company’s operating ratio increased by 80 basis points to 76.2% due to higher overhead costs, though direct operating costs improved.

Management expressed confidence in market share growth, supported by a strong service proposition and continued investment in employee development and infrastructure.

April 2026 revenue per day showed improvement despite a 6.5% decrease in LTL tons per day, indicating potential for sequential growth in Q2.

Old Dominion Freight Line Inc highlighted its strategic focus on maintaining superior service and cost discipline, with expectations of benefiting from improved demand and market share gains.

Full Transcript

OPERATOR

Good day and welcome to the Old Dominion Freight Line Inc first quarter 2026 earnings conference call. All participants will be in listen only mode. Should you need assistance, please signal a conference specialist by pressing the star key followed by zero. After today’s presentation, there will be an opportunity to ask questions. To ask a question, you may press star then one on a touchtone phone. To withdraw your question, please press Star then two. Please note this event is being recorded. I would now like to turn the conference over to Jack Atkins. Please go ahead.

Jack Atkins

Thank you, Dorwin. Good morning, everyone, and welcome to the first quarter 2026 conference call for Old Dominion Freight Line Inc. Today’s call is being recorded and will be available for replay beginning today and through April 29, 2026 by dialing 1-855-669-9658, access code 769-9494. The replay of the webcast may also be accessed for 30 days at the company’s website. This conference call may contain forward looking statements within the meaning of the Private Securities Litigation Reform Act of 1995, including statements, among others, regarding Old Dominion’s expected financial and operating performance. For this purpose, any statements made during this call that are not statements of historical fact may be deemed to be forward looking statements. Without limiting the foregoing, the words believes, anticipates, plans, expects and similar expressions are intended to identify forward looking statements. You are hereby cautioned that these statements may be affected by the important factors, among others, set forth in Old Dominion’s filings with the Securities and Exchange Commission and in this morning’s news release. Consequently, actual operations and results may differ materially from the results discussed in the forward looking statements. The Company undertakes no obligation to publicly update any forward looking statements, whether as a result of new information, future events or otherwise. Finally, before we begin, we note that we welcome your questions today, but ask that you limit yourselves to just one question at a time before returning to the queue. Thank you for your cooperation. At this time for opening remarks, I’d like to turn the conference call over to our President and Chief Executive Officer, Marty Freeman. Marty, please go ahead.

Marty Freeman (President and Chief Executive Officer)

Good morning and welcome to our first quarter conference call. With me on the call today is Adam Satterfield, our CFO. After some brief remarks, we will be glad to take your questions. Our first quarter results reflect a continuation of the encouraging trends that started to develop late last year. While our first quarter revenue declined on a year over year basis, demand for our service improved as the quarter progressed. This contributed to the acceleration in our LTL volumes during the quarter with strong sequential tonnage growth in February and March. Importantly, during the quarter, our team continued to deliver best in class service to our customers and maintained our disciplined approach to yield management. Providing our customers with superior service at a fair price is the cornerstone of our strategic plan. The consistency of our service performance day in and day out creates significant value for our customers and is something that we take significant pride in. As a result, we were pleased to once again deliver 99% on time service and a claims ratio below 0.1% in the first quarter. The strength of our unmatched value proposition has differentiated us from our competition and allowed us to win more market share than any other LTL carrier over the last 10 years. Our value proposition will continue to support our ability to grow our business in the years ahead and we continue to believe that we will be the biggest market share winner over the next 10 years. As a result, our best in class service also supports our yield management initiatives. Our long term disciplined approach to pricing is designed to offset our cost inflation and support our ability to make strategic investments back into our business. These investments will allow us to stay ahead of our anticipated growth curve to help us ensure that we’ll always have the capacity we need to grow. Our ability to say yes when a customer needs needs us the most is the hallmark of our industry. Leading customer service business levels in the LTL industry can change very quickly and being able to respond to growth opportunities in an improving demand environment is one of the primary areas that differentiate us from our competition. We believe it is important to consistently invest throughout the economic cycle despite the short term cost headwinds associated with this strategy. This is why despite a challenging operating environment, we invested nearly 2 billion capital expenditures over the past three years and why we plan to invest an additional 265 million in 2026. We’ve also continued to invest in the most important component of our long term success which is our OD family of employees. Our people and our unique culture are truly what sets us apart at Old Dominion. As a result, we have worked to ensure that we are providing a competitive wage and benefit package as well as various internal developmental programs like our in-house driver training schools and our management training program. These programs not only provide important opportunities for career advancements for our team, but they help ensure that our company is ready to respond when our customers need us the most. While we were always focused on long term, it is critical that we remain diligent in controlling our cost and continue to operate as efficiently as possible without compromising our superior service standards that remained the case in the first quarter as we continued to find ways to maximize our operating efficiencies and control our discretionary spending. We continue to believe that our business model contains significant operating leverage which has been enhanced by our ongoing investments in our technologies and continued focus on business process improvements. We produced solid results in the first quarter by continuing to execute our strategic plan, and I want to thank the entire OD family of employees for their unwavering dedication to our customers and to our company. Due to our consistent execution and investment, we are uniquely positioned to effectively handle incremental volume opportunities as the demand environment improves. As a result, we remain confident in our ability to win market share, generate profitable revenue growth, and increase shareholder value over the long term. Thank you very much for joining us this morning and now Adam will discuss our first quarter in greater detail.

Adam Satterfield (Chief Financial Officer)

Thank you Marty and good morning. I’m a little under the weather today, so I’d like to ask you all to bear with me as we get through this call Old Dominion’s revenue totals $1.33 billion dollars for the first quarter 2026, which represents a 2.9% decrease from the prior year. Our revenue Results include a 7.7% decrease in LTL tons per day that was partially offset by a 5.7% increase in our LTL revenue per hundredweight. Excluding fuel surcharges, our LTL revenue per hundredweight increased 4.4% compared to the first quarter 2025, which reflects our long term disciplined approach to yield management. On a sequential basis, our revenue per day for the first quarter increased 0.5% when compared to the fourth quarter of 2025 with LTL tons per day decreasing 0.4% and LTL shipments per day decreasing 0.7%. For comparison, the 10 year average sequential change for these metrics includes a decrease of 2.8% in revenue per day, a decrease of 2.5% in LTL times per day, and a decrease of 1.6% in LTL shipments per day. The monthly sequential changes in LTL tons per day during the first quarter were as January decreased 3.4% as compared to December, February increased 4.9% as compared to January, and March increased 4.6% as compared to February. The comparative 10 year average change for these respective months is a decrease of 3.1% in January, an increase of 1.0% in February and an increase of 4.5% in March. While there are still a couple of workdays remaining in April, our month to date revenue per day has increased by approximately 7.0% when compared to April 2025. This includes a decrease in our LTL tons per day of approximately 6.5% and an increase in our revenue per hundredweight excluding fuel surcharges of 4 to 4.5%. As usual, we will provide the actual revenue related details for April in our first quarter form 10-Q. Our operating ratio increased 80 basis points to 76.2% for the first quarter 2026 as the increase in overhead cost as a percent of revenue more than offset the improvement in our direct cost. Our overhead cost increased as a percent of revenue primarily due to the deleveraging effect associated with the decrease in our revenue as well as an increase in our general supplies and expenses. This resulted in the 60 basis point increase in our general supplies and expenses and 40 basis point increase in our depreciation cost as a percent of revenue. All of our other combined costs improved as a percent of revenue for the quarter on a net basis. The improvement in our direct operating cost as a percent of revenue was primarily due to our continued focus on revenue quality and operating efficiencies despite the lack of density on our network associated with the decrease in our volumes. Our team did a nice job of matching our labor costs with current revenue trends and this will be a key focus for us over the balance of the year. That said, we currently believe we have an appropriately sized workforce to handle a sequential increase in volumes during the second quarter. Old Dominion’s cash flows from operations totaled $373.6 million for the first quarter and capital expenditures were $62.6 million. We utilized $88.1 million for our share repurchase program during the first quarter and our cash dividends totaled $60.5 million. Our effective tax rate for the first quarter 2026 was 25.0% as compared to 24.8% in the first quarter 2025. We currently expect our effective tax rate to be 25.0% for the second quarter of 2026. This concludes our prepared remarks this morning. Operator will be happy to open the floor for questions at this time.

OPERATOR

We will now begin the question and answer session. To ask a question, you may press star then one on your touchtone phone. If you are using a speakerphone, please pick up your handset before pressing the keys. If at any time your question has been addressed and you would like to withdraw your question, please press star then two. At this time, we will pause momentarily to assemble our roster. The first question comes from Jordan Aliger with Goldman Sachs.

Jordan Aliger (Equity Analyst)

Please Go ahead. Yeah, hi, morning everyone. Thanks for the update. I guess sort of in the context of, you know, some of those trends you’ve been seeing, maybe continue on the trend thought and share some color or thoughts on direction of or trends as we move from the Q1 to Q2. Thank you.

Adam Satterfield (Chief Financial Officer)

Yeah, the 10 year average change for the operating ratio is 300 to 350 basis point improvement from the first to the second quarter and we’re comfortable with that range in the second quarter this year. Assuming that we do see some sequential improvement our volumes from here. And that’s what we’d anticipate. But obviously there’s a lot going on in the world right now. But based on what we’re currently seeing, we’re expecting that increase in volumes and I think we’re comfortable with hitting that normal sequential range as a result. If we do so, that’d be the fourth straight quarter that we’ve been able to be in or at least beat what our normal sequential change would be.

Jordan Aliger (Equity Analyst)

Thanks. And I don’t know if I could ask a follow up, but just sort of related to that, have you seen been a shift in sort of that excess terminal capacity? Has it come in a little bit? As we’ve seen volumes look a little better in terms of our capacity?

Adam Satterfield (Chief Financial Officer)

Yeah, I think you’ve been at like 30, 35% terminal capacity excess. I’m just sort of curious if that’s changed at all. Yeah, we’re, we’re still a little north of 35%. Their volumes are still down on a year over year basis. And obviously this is the slower time of the year in the first quarter. But you know, that’s something that we continue to see as an opportunity and will drive. Part of that operating ratio improvement is we can continue to see sequential volume improvement and then leveraging, you know, those fixed costs, those investments that we’ve made and that depreciation headwind that we’ve been facing. So leveraging those and some of our other fixed overhead costs. But you know, that benefit of density driving improvement in both our direct operating cost as well as some of those overhead costs. Thank you.

OPERATOR

The next question is from Jason Seidel with TD Cowan.

Jason Seidel (Equity Analyst)

Please go ahead. Thanks, operator. Morning, Marty. Adam and Jack. And Adam, I hope you feel better. I’m going to stick on the OR topic a little bit here. You know, as we think about your commentary for the normalized sequential moves from 1Q to 2Q, can you help us frame up the impacts in 1Q for

Adam Satterfield (Chief Financial Officer)

both fuel as well as weather? So we could figure out sort of where in the range we might want to be. Yeah, the. Glad you asked that. Figured fuel would be a topic of conversation, but it’s come up a few times. Yeah, exactly. You know, fuel is part of our yield management strategy we’ve always talked about we want fuel, which is just a variable component of pricing, to really be indifferent if fuel goes up or if it goes down. You know, essentially we want the bottom line to be the same and that’s how we look at things on individual account profitability type basis. And I think when you look at what happened from the fourth quarter to the first quarter of this year, we outgrew our normal sequential trend with tonnage by about 200 basis points. And that’s really the story of the quarter in the sense of the strong operating ratio performance that we had there. But when you just look, our shipments per day from the fourth quarter to the first quarter were essentially the same. And when you look at fuel was, was up 10%, deal counts, consistent profitability is relatively consistent, a little bit better overall, but obviously there’s other things going on. And when I compare that back to the first quarter of 2023 compared to the second quarter 2023, a lot of similar circumstances. Bill count was the same between those two periods. Fuel was down 10% between those two periods, but. So you had revenue impact on the downside of fuel, but profitability was consistent between those two periods. So obviously there’s always a lot of fluctuations. But I think those two sequential periods, when you’ve got similar bill count, similar mix of freight, kind of shows that fuel can go up or down 10% and overall profitability stay the same. Now, obviously we’re looking at a much larger increase in fuel and I would probably just point everybody back to the second quarter 2022. I think this first quarter to second quarter of 26 is probably going to have a lot of similarities to that first quarter to second quarter 22 period when we saw the fuel shock and all the other inflationary impact that that drives. That’s very helpful.

OPERATOR

And that was my one. Appreciate it, guys. The next question is from Chris Weatherby with Wells Fargo.

Chris Weatherby (Equity Analyst)

Please go ahead. Hey, thanks guys. Good morning. Wanted to get your sense on how you feel about, I guess, demand and then ultimately how you’re faring from a market share perspective as you think about coming out of the really strong performance in February and then what you’ve seen so far in March and April. Just kind of curious if some improvement has continued or you feel like there’s

Adam Satterfield (Chief Financial Officer)

been more Steady demand, just kind of get a sense of how you’re thinking about things. Yeah, it definitely feels like it’s continued to improve and go back to last year. We’ve had essentially through March is five months of normal sequential trends for us. And obviously like I mentioned earlier, it’s through a slower part of the year. But we felt like we started seeing a lot of and hearing optimism from customers and from our sales team late last year and we started seeing that return to seasonality. We’ve seen a pickup in our wait for shipment and in fact in April our weight for shipment is up on a year over year basis a little over 1%. So you know, that’s usually a leading indicator of an improving demand environment. So all those things, the positive ISM trends that we’ve seen and we’d expect another positive ism for April, I think those have all been consistent. The retail side of the sector has probably been driving more the volume performance at this point and we’re looking for the industrial sector to start contributing as well. That usually starts performing on a lag basis after you see that positive ISM performance. And I think that what we seem to hear right now, obviously there’s some geopolitical risk to everything right now, but it seems …

Full story available on Benzinga.com

This post was originally published here

Expedia Group (NASDAQ:EXPE) shares are up on Wednesday as the company is expanding into travel through a partnership with Uber Technologies, Inc. (NYSE:UBER).

This collaboration allows Uber users to book hotels directly in the Uber app, enhancing the travel experience amid rising demand as summer approaches.

The partnership between Uber and Expedia Group aims to simplify travel booking for users, integrating hotel reservations directly into the Uber app.

This initiative comes at a time when travel demand is surging, with consumers seeking more efficient ways to manage their trips.

The broader market is experiencing mixed performance, with the Nasdaq down 0.26% while the S&P 500 and Dow Jones are down 0.21% and 0.61%, respectively.

Despite the positive news for Expedia, the stock’s gains occur as broader market indicators show a decline, suggesting that company-specific factors may be influencing its performance.

Technical Analysis

Expedia is currently trading within a strong range, with a 12-month return of 54.66%.

The stock is trading 1.2% above its 20-day simple moving average (SMA), indicating short-term bullish momentum, while it sits 1.7% below …

Full story available on Benzinga.com

This post was originally published here

Yum! Brands (NYSE:YUM) shares are up, up 3.24%, on Wednesday as the company reported strong first-quarter results, with Taco Bell achieving an impressive 8% same-store sales growth.

This positive performance comes amid broader market pressures, as the Consumer Discretionary sector is currently down 0.71%, contributing to a mixed market day.

• Yum! Brands stock is showing exceptional strength. Why is YUM stock surging?

Quarterly Details

The company reported first-quarter adjusted earnings per share of $1.50, beating the analyst consensus estimate of $1.38. Quarterly sales of $2.059 billion outpaced the Street view of $2.042 billion.

Worldwide system sales grew 6% excluding currency impact, while unit count rose 5% with over 1,000 new openings.

GAAP operating profit increased 17% and core operating profit grew 6%, as digital system sales neared $11 billion with a record 63% mix.

KFC Division opened 648 gross new restaurants across 45 countries, while Taco Bell Division opened 30 gross new restaurants across eight countries. Pizza Hut Division opened 346 gross new restaurants across 27 countries.

Outlook

The company targets long-term average unit growth of 5% and system sales growth of 7%, excluding currency impact.

It also aims to deliver at least 8% core operating profit growth over the long term.

The broader market is experiencing a slight downturn, with major indices such as the S&P 500 and Dow Jones both posting losses. This backdrop …

Full story available on Benzinga.com

This post was originally published here

Akanda Corp. (NASDAQ:AKAN) stock surged on Wednesday. The move follows a massive multi-day rally in the cannabis sector.

Speculative momentum remains high after U.S. regulators moved to reclassify marijuana products.

Regulatory Shifts Fuel Optimism

The U.S. Department of Justice placed state-regulated medical marijuana under Schedule III. An expedited process for broader reclassification is now underway.

A new administrative hearing is scheduled for June 29.

Shareholder Meeting Adjourned

The company officially adjourned its Special Meeting of Shareholders today. The delay stemmed from a lack of quorum.

Despite this, investors focused on …

Full story available on Benzinga.com

This post was originally published here

Super Micro Computer Inc. (NASDAQ:SMCI) shares are falling on Wednesday afternoon. The Nasdaq is up 0.17% while the S&P 500 has shed 0.28%.

• Super Micro Computer shares are retreating from recent levels. What’s behind SMCI decline?

Oracle Cancels Massive Server Order

According to Bluefin Research on Thursday, Oracle Corp. (NYSE:ORCL) reportedly canceled an order for 300 to 400 NVIDIA Corp. (NASDAQ:NVDA) GB300 NVL72 racks.

Each rack costs $3.5 million. This represents a contract loss between $1.1 billion and $1.4 billion. Bluefin estimates SMCI shipped only 100 to 200 racks before the termination.

Legal Headwinds …

Full story available on Benzinga.com

This post was originally published here

JP Morgan analysts maintain a positive outlook on Mastercard Inc. (NYSE:MA) following strong second-quarter results from rival Visa Inc. (NYSE:V).

In a research note released Tuesday, analyst Tien-tsin Huang indicated that Visa’s performance offers a “mildly positive risk-reward” for Mastercard heading into its earnings report this Thursday.

Visa Results Signal Healthy Global Environment

Visa reported better-than-expected results and raised its second-half guidance. Cross-border volume performed better than many feared, while currency volatility provided a tailwind.

JP Morgan noted that Visa’s global and U.S. volumes exceeded expectations. This suggests a stable operating environment for the broader payments sector.

“Visa’s April cross-border results were substantially better than feared and showed only a slight deceleration, which should ease concerns for Mastercard,” the analysts …

Full story available on Benzinga.com

This post was originally published here

Central Pacific Financial (NYSE:CPF) held its first-quarter earnings conference call on Wednesday. Below is the complete transcript from the call.

This content is powered by Benzinga APIs. For comprehensive financial data and transcripts, visit https://www.benzinga.com/apis/.

View the webcast at https://events.q4inc.com/attendee/325405077

Summary

Central Pacific Financial reported strong earnings in Q1 2026 with net income of $20.7 million and EPS of $0.78, reflecting a 20% increase from the previous year.

The company maintained healthy credit quality and capital strength, with a return on average equity of 13.90% and a net interest margin of 3.53%.

Loan growth was driven by commercial real estate, while deposits increased by $90 million, with core deposits making up over 90% of total deposits.

Central Pacific Financial was named Hawaii’s US Small Business Administration Lender of the Year for 2025, highlighting its commitment to local businesses.

Management expects modest loan and deposit growth for 2026, with net interest income projected to rise by 4-6% over the prior year.

The company plans to continue returning capital to shareholders through dividends and share repurchases, with $44.5 million remaining under the share repurchase program.

The outlook includes maintaining a strong balance sheet and focusing on disciplined and sustainable growth strategies amid a resilient Hawaiian economy.

Full Transcript

OPERATOR

Good afternoon ladies and gentlemen. Thank you for standing by and welcome to the Central Pacific Financial Corp. First quarter 2026 earnings conference call. During today’s presentation, all parties will be in a listen only mode. Following the presentation, the conference will be open for questions. This call is being recorded and will be available for replay shortly after its completion on the company’s website at www.cpb.bank. i’d now like to turn the call over to Mr. Gerald Rubago, Senior Strategic Financial Officer. Please go ahead.

Gerald Rubago

Thank you Rob and thank you all for joining us today as we review Central Pacific Financial Corp’s. Financial results of the first quarter of 2026. Joining me this morning are Arnold Martinez, Chairman, President and Chief Executive Officer David Morimoto, Vice Chairman and Chief Operating Officer Ralph Mesic, Senior Executive Vice President and Chief Risk Officer and Dana Matsumoto, Executive Vice President and Chief Financial Officer. We have prepared a supplemental slide presentation with additional details on our earnings release. The presentation is available in our Investor Relations section of our website@ir.cpb.bank during today’s call, management may make forward looking statements. These statements are based on current expectations and assumptions and are subject to risks and uncertainties that could cause actual results to differ materially. For a complete discussion of these risks related to our forward looking statements, please refer to slide two of our presentation. With that, I will now turn the call over to our Chairman, President and CEO Arnold Martinez. Thank you Gerald and Aloha to everyone joining us today. joining us today. The first quarter represented a strong start to 2026 with solid earnings performance and continued execution across our franchise. We delivered growth in both loans and core deposits, maintained strong credit quality and continued to operate from a position of capital strength. This momentum reflects the strength of our relationship focused banking model and our continued commitment to serving the people, businesses and communities of Hawaii. Our results also demonstrate the durability in organic earnings power of the franchise. With return on equity above 13% and robust capital levels, we remain focused on disciplined sustainable growth and thoughtful capital allocation. From a shareholder perspective, we remain committed to deploying capital in ways that enhance long term value. This includes supporting organic growth, maintaining a strong balance sheet, returning capital through dividends and share repurchases, and preserving flexibility to respond to market opportunities. We were also pleased that CPB was named the Hawaii US Small Business Administration Lender of the Year for 2025. This marks the 17th time CPB has received this recognition and reflects our long standing commitment to Hawaii’s small business community. Turning to the broader environment, Hawaii’s economy remained resilient during the first quarter, visitor arrivals and spending increased and the state’s unemployment rate remained exceptionally low at 2.3%. While oil prices have increased due to the conflict in the Middle east, the direct impact on Hawaii’s economy has been limited to date and we continue to monitor conditions closely. At the same time, Hawaii continues to benefit from ongoing construction activity, military spending and a resilient local economy. Recent storm activity and flooding, including impacts from the Kona Lo, caused isolated but significant damage in parts of the state. We remain committed to supporting affected customers and communities as they recover and rebuild. Against this backdrop, our strategy remains consistent. Support local businesses through prudent lending, grow and deepen core deposit relationships, invest thoughtfully in our franchise and manage risk with discipline through the cycle. With that, I will turn the call over to Dana.

Arnold Martinez (Chairman, President and Chief Executive Officer)

Thanks, arnold for the first quarter, net income was $20.7 million and earnings per diluted share was $0.78. Return on average assets was 1.12% and return on average equity was 13.90%. Compared to the year ago quarter, our eps increased by 20% reflecting revenue growth and expense discipline as we continue to successfully execute on our strategy. Net interest income totaled $61.4 million and net interest margin remained healthy at 3.53% compared to the prior quarter. Results reflected typical seasonal factors and balance sheet timing including lower day count and lower average loan balances. The decline in our loan yields were partially offset by the improvement in our deposit costs. For the second quarter. We are projecting NIM of 3.50 to 3.55%. Our guidance for full year net interest income remains at a 4 to 6% increase over the prior year. Across a range of potential rate environments. Our balance sheet positioning and funding mix continue to provide meaningful resilience. Total other operating income was 11.6 million and declined from the prior quarter by $2.6 million. In the prior quarter we had one time BOLI death benefit income of $1.4 million. Current quarter BOLI income was further impacted by equity market volatility. Additionally, Q1 seasonality typically results in lower levels of fee income in the mortgage, banking and wealth areas. We continue to expect our full year other operating income to increase modestly over normalized priority. Prior year total other operating expense was $43.7 million and declined by $2.0 million from the prior quarter. The decline was primarily driven by higher incentive accruals in the prior quarter and lower deferred compensation expense this quarter. We expect our expenses to increase over the year, but our full year expense Growth is still expected to be modest and at 2.5 to 3.5% from 2025 normalized in the first quarter, we paid a cash dividend of $0.29 per share and repurchased approximately 321,000 shares for a total of $10.5 million. With our strong earnings and capital position, our board declared a second quarter cash dividend of $0.29 per share. We had 44.5 million remaining available under our share repurchase program as of March 31st and we plan to continue to utilize it as part of our capital allocation strategy. I will now turn the call over to David.

Dana Matsumoto (Executive Vice President and Chief Financial Officer)

Thank you, Dana. During the first quarter, our total loan portfolio grew by $31 million, bringing total loans to $5.3 billion at quarter end. The majority of the loan growth came near the end of the first quarter. Therefore, we will see the benefit in our net interest income in …

Full story available on Benzinga.com

This post was originally published here

Hyperliquid is publicly testing a plan to add prediction markets to its platform in a direct challenge to Polymarket.

The proposal, known as HIP-4, would allow traders to buy fully collateralized binary contracts on real-world outcomes within the same margin account they use for crypto perpetual futures.

Former Barclays CEO Bob Diamond chairs Hyperliquid Strategies Inc. (NASDAQ:PURR), the largest Nasdaq-listed way to bet on the exchange.

PURR holds more than 17 million HYPE tokens, has filed an S-1 to raise up to $1 billion more, and last closed near $6. Maxim Group initiated coverage on Friday with a Buy rating and a $10 price target.

Kalshi Is Inside The Tent

The HIP-4 proposal was co-authored by John Wang, head of crypto at Kalshi, and the two companies …

Full story available on Benzinga.com

This post was originally published here