
The New York City penthouse that acted as the fictional home of financial fraudster Jordan Belfort in the 2013 film “The Wolf of Wall Street” is back on the market. Located on the 32nd floor of the Midtown East condo building Milan at 300 East 55th Street, the luxurious, 2,700-square-foot penthouse serves as the setting of a pivotal scene where an associate of Belfort, played by Leonardo DiCaprio, dangles a butler over the balcony. The scene shows off the very real sweeping city views, especially of the Chrysler Building, from the three-bedroom home, which just hit the market for $4,950,000.

As reported by Mansion Global, the real-life owner is Bert E. Brodsky, who leads the real estate development and investment firm BEB Capital. Brodsky paid $4.5 million for the apartment in 2005. He doesn’t live there full-time, telling Mansion Global: “I don’t use it as a residence,” Brodsky said. “I use it more for showering and meeting people.”

The home, which has been used as a filming location for “Gossip Girl,” “The Good Wife,” and “Blue Bloods,” was first listed for $6.25 million in 2024 and then taken on and off the market a few times before listing for $4.95 million this week.

A large entry foyer leads to an expansive great room, measuring over 36 feet long and wrapped in floor-to-ceiling windows. Two terraces sit on either side of the living and dining area; there’s also a tucked-away wet bar for easy entertaining.

The open chef’s kitchen features custom European cabinetry and Viking appliances.

On the other end of the apartment, the massive primary suite features a corner fireplace, two walk-in closets, and a spa-like bath. The two additional bedrooms also have their own en-suite baths and extra closet space.

The glass-clad tower was built in 2004. Amenities at the building include a 24-hour doorman and concierge, a landscaped garden, a fitness center, an on-site garage, a residents’ lounge, and a two-story lobby with a zen garden designed by Ken Smith.

[Listing details: Milan, 300 East 55th Street, #PHC at CityRealty]

[At Compass by Boris Fabrikant and Collin Bond of The Fabrikant Bond Team]

RELATED:

The post Midtown East penthouse seen in ‘Wolf of Wall Street’ lists for $4.95M first appeared on 6sqft.



This post was originally published here

Among the oldest surviving wooden homes in Brooklyn Heights, this Federal-style home at 25 Cranberry Street was built around 1790 as a farmhouse. Beginning in 1995, preservation-minded residents carefully stripped away the layers to reveal many of the home’s original details that lay hidden for generations, from painted plaster to wood-plank flooring. Now asking $4.9 million, the four-story, 3,200-square-foot home is ready for 21st-century owners to appreciate the history behind its walls.

As Brownstoner reported, the street names and numbers of Brooklyn have changed over the years. The home at 25 Cranberry Street actually was 45 Cranberry Street until it was renumbered in the 1870s.

The townhouse offers four floors of living space containing 10 rooms, including four bedrooms. Details like wood-burning fireplaces provide the same warmth and beauty as they did centuries ago, though multi-zone recirculating hot water heat assures modern comfort.

The original layout has been retained; the home’s lower floors include a library and kitchen on the garden level. On the parlor floor are a more formal dining room and parlor.

Bedrooms occupy the top two floors. The primary chamber is on the second floor, along with a full bath. Every corner of the home gets sunlight from northern and southern exposures. There also is the option of raising the rear roof on the top floor for a unique sky view.

A quaint covered porch offers shelter and a view of the garden, where boundary stones remain from the original farmhouse. The coveted “fruit street” location has some of the city’s most breathtaking sunset views of the Manhattan skyline.

[Listing details: 25 Cranberry Street by Joan Goldberg of Brown Harris Stevens]

RELATED: 

The post One of the oldest wood-frame houses in Brooklyn Heights asks $4.9M first appeared on 6sqft.

This post was originally published here

Plenty of familiar names show up year after year in the top tier of the RealTrends Verified Rankings. But beyond that shared visibility, the similarities start to fade pretty quickly. These firms aren’t running the same playbook — not even close.

From cloud-based brokerages to global franchise networks, and from niche specialization strategies to sprawling referral ecosystems, today’s top performers reflect a wide spectrum of business models. That diversity is a defining feature of how success is being built in modern real estate.

To better understand what’s driving that success, HousingWire spoke with leadership at LeadingRE and eXp Realty. Their perspectives shed light on how fundamentally different approaches — from independently owned networks to fully virtual brokerages — are shaping agent productivity, broker growth and long-term competitiveness.

LeadingRE leads with a network approach

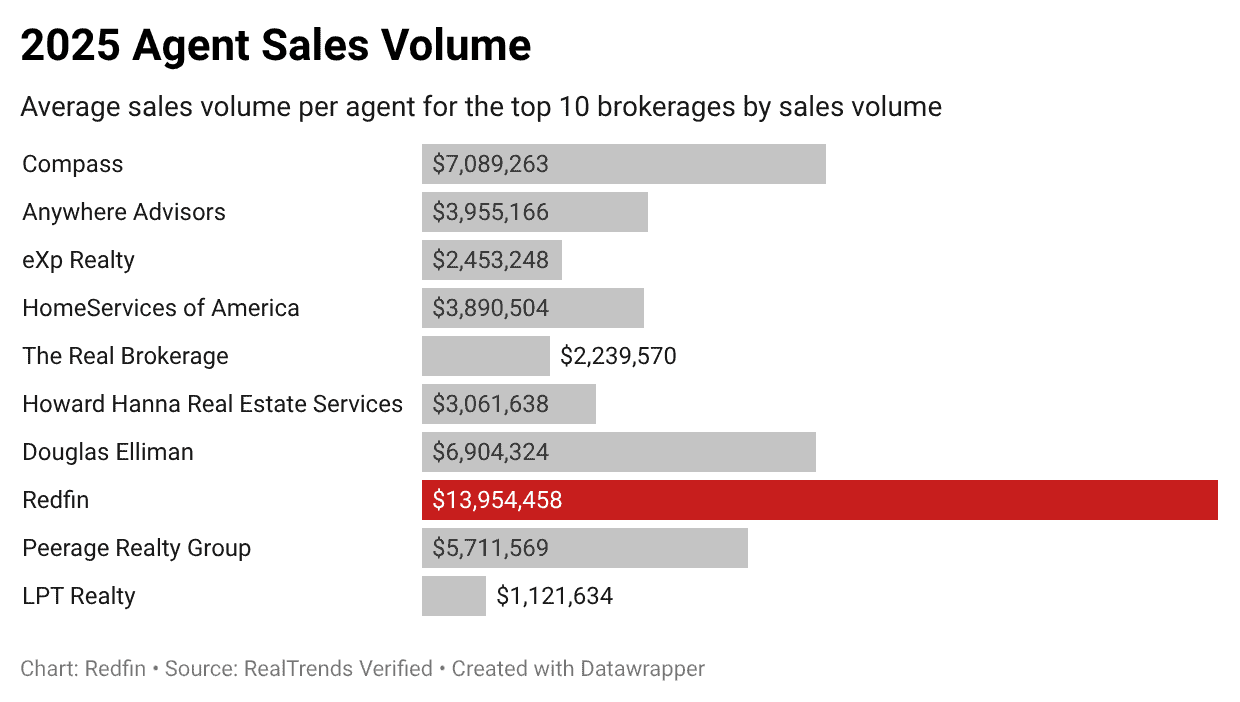
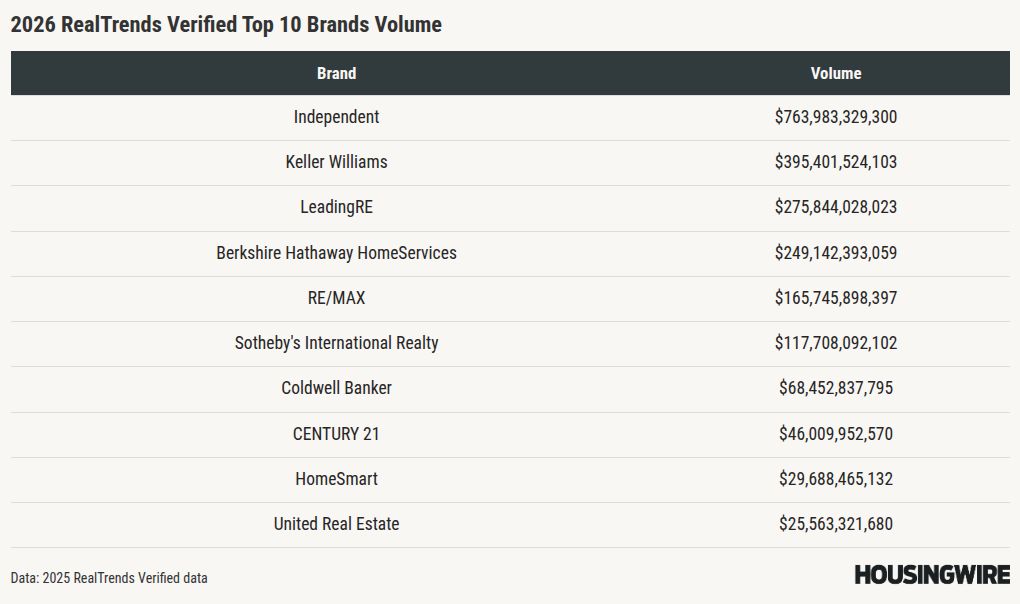
After the independent brokerages within its network closed 462,910.4 transaction sides totaling $275.844 billion in sales volume in 2025, LeadingRE saw itself jump from the No. 5 brand in 2025 to the No. 2 brand [after independents] in the 2026 RealTrends Verified Rankings. 

visualization

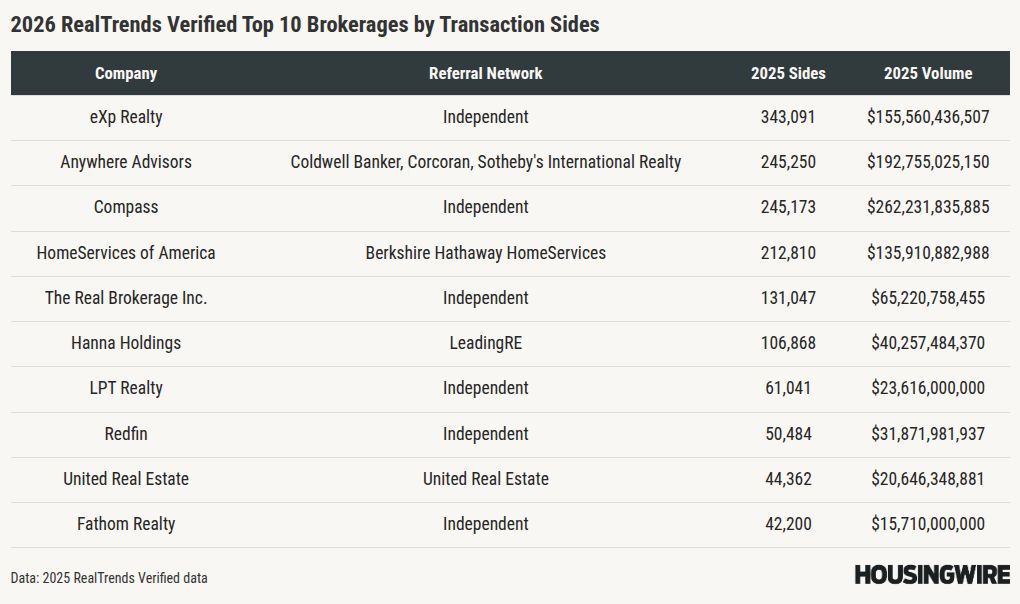
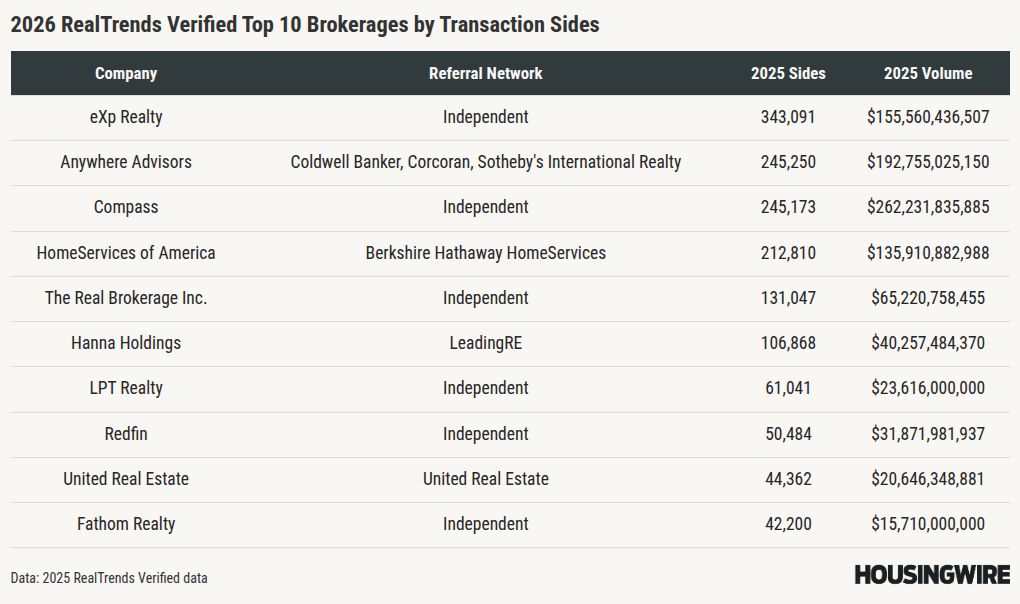
With a network made up of many top-performing firms, including Hanna Holdings, which ranked No. 6 by both sides and volume, William Raveis Real Estate, John L. Scott Real Estate, Brown Harris Stevens, The Keyes Company/Illustrated Properties, Baird & Warner and FirstTeam Real Estate, Kate Reisinger, the chief operating officer of LeadingRE, said her firm provides their brokers with a variety of services and support to allow them to best support their agents and consumers.

At the core of LeadingRE, Reisinger said, is the belief that these disparate independent firms and brokers are experts and leaders in their local markets, but that they are stronger if they work together. 

“The network was created to allow independent brokers to refer clients across their markets with complete confidence that those clients would be taken care of by a firm that reflects the same level of service, professionalism, trust and standards,” Reisinger said. “That referral network is still the lifeblood of LeadingRE, but over time, the network has built a much broader ecosystem.” 

Today, Reisinger said LeadingRE provides members with everything from marketing and branding resources, to global events that bring together professionals from across LeadingRE’s network, enabling them to learn from each other and share best practices. 

“They are elevating each other and creating opportunities for mutual success that’s really who LeadingRE is,” she said. “We support these leaders in operating at their highest level, while connecting them with other deeply rooted local market leaders. This exchange allows them to learn from one another and extend their reach globally, all while maintaining their strong local presence. It creates something incredibly powerful because that hyperlocal expertise is now extended across 70 countries.” 

It is this support that has attracted some of the top performing firms to the LeadingRE network and that has continued to empower them to achieve top results in the RealTrends Verified Rankings. 

eXp reaches for the sky with a cloud-based model

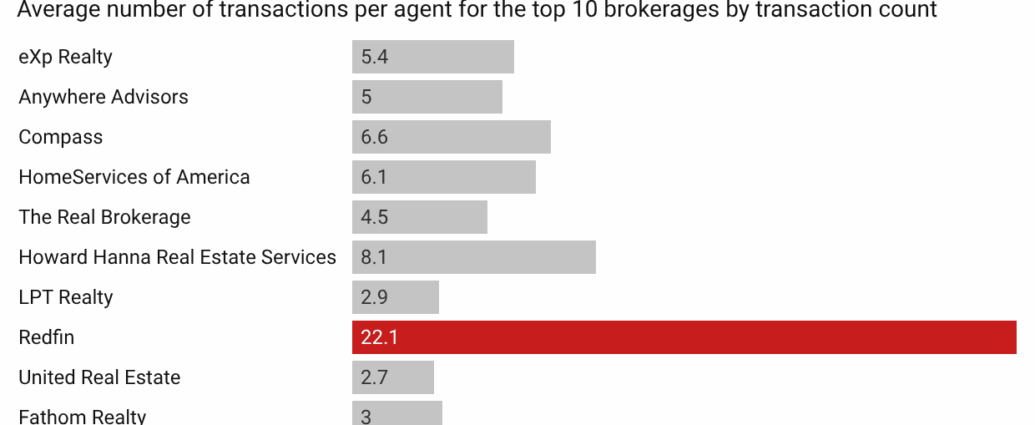
There is no denying that eXp Realty is one of the most prominent and successful cloud-based real estate firms. The Glenn Sanford-founded firm has held the No. 1 spot for transaction side count in the RealTrends Verified Rankings since 2022. In 2025, agents and brokers at eXp closed a whopping 343,091 transaction sides, nearly 100,000 more transaction sides than the second place firm, Anywhere Advisors

“When I look at our performance, I think it is a true testament to how our agents come together and support each other in the community we have built,” Holly Mabery, the chief brokerage officer at eXp Realty, said. “We’ve designed everything across our platform so agents can connect because we are truly borderless. Our clients don’t see restrictions on where they can move, so why would we restrict our agents in where they can operate. I think that is the secret sauce in how we operate and provide opportunity for our agents.” 

eXp Realty’s lack of borders comes from the firm’s cloud-based nature, with all brokerage operations happening within the firm’s metaverse. 

“I think being cloud-based, connecting without borders is part of our DNA,” Carrie Lysenko, the firm’s chief technology officer, said. “We have never been another way.”

Lysenko believes that borderlessness fosters a belief in the firm’s agents that they shouldn’t set limits on their business or on what they can achieve.

“Whether you believe a brick-and-mortar approach is actual or theoretical, we feel that living in a world where we don’t set limits with physical walls, or geography or team type or agent type, we attract agents who really just want to continue growing and building their businesses,” Lysenko said. 

When it comes to helping those agents to build their businesses, Lysenko and Mabery said the firm’s cloud-based model allows it to reinvest more of the firm’s income into its agents as it isn’t spending money on brick-and-mortar infrastructure. 

“I think a lot of times real estate agents are thought of as lone wolves that are out there pounding the pavement for business. While there are parts of an agent’s business that reflect that, we have found that our agent productivity continues to grow the more we continue to invest in events and experiences for our agents that bring them together,” Lysenko said. 

Mabery added that the company’s structure allows agents to learn from their peers and other mentors across the globe, enabling them to learn from someone they truly connect with. 

“We were built for the future,” Mabery said. “We were built for how people come together and connect today. Clients expect things to be online and for that service to come to them, so why wouldn’t we, as a brokerage, provide the same for our agents. We can provide them with value in the palm of their hand, and they don’t have to drive across town to an in-person meeting for connection and value.” 

For eXp’s agents this level of digital connectivity has certainly paid off, but as the rankings data illustrated it is not the only way for a company to win. 

Both eXp and LeadingRE have embraced non-traditional models on their journey to the top, but that doesn’t mean that firms with more traditional brokerage models can’t succeed in today’s environment.

Ultimately, the RealTrends Verified Rankings make one thing clear: there’s no single blueprint for success in today’s real estate landscape. Whether built on global referral networks, fully virtual platforms or more traditional structures, top-performing firms are winning by leaning into what they do best — and by staying aligned with how agents and consumers want to work. The models may differ, but the focus on growth, connectivity and adaptability is shared.

This post was originally published on here

Fidelity National Financial (FNF) is appealing a federal judge’s decision to uphold the Financial Crimes Enforcement Network (FinCEN)  Anti-Money Laundering Regulations for Residential Real Estate Transfers Rule (AML rule).

The title firm filed its appeal of the summary judgement ruling on Friday in the Eleventh Circuit Court of Appeals. 

Filed in May 2025, the lawsuit lists FinCEN and its director Andrea Gacki, as well as the Department of the Treasury and its secretary Scott Bessent, as defendants. In the lawsuit, FNF claims that the rule, which was promulgated under the Biden administration, is “arbitrary and capricious,” and that the rule will cause “irreparable harm.” 

The rule requires title firms to report specific details on all-cash home purchase transactions. These include the names, addresses, dates of birth, citizenship status and ID numbers of all people involved — including minors, payment details and information about trusts and entities that are purchasing the property.

In February, Judge Wendy Berger of U.S. District Court in Jacksonville, Fla., adopted a report and recommendation filed in early December by Magistrate Judge Samuel Horovitz, granting FinCEN’s cross motion for summary judgement, ultimately upholding the rule.

Due to this ruling, the rule went into effect on March 1, as scheduled. However, in mid-March, a federal judge in Texas struck down the rule, finding that FinCEN had exceeded its statutory authority with the AML rule. This decision vacated the rule entirely, restoring the status quo that existed before the regulation took effect nationwide. 

That lawsuit was filed by Flowers Title Companies, LLC., which challenged the rule under the Administrative Procedure Act, arguing that FinCEN lacked authority under the Bank Secrecy Act to impose such sweeping reporting requirements.

“The fact that some bad actors have conducted non-financed real estate transactions does not make such transactions categorically ‘suspicious,’” U.S. District Judge Jeremy Kernodle of the Eastern District of Texas wrote in his ruling. “If it did, then nearly every type of transaction imaginable would be ‘suspicious.’”

The judge noted that by FinCEN’s own estimates, the rule would have covered between 800,000 and 850,000 transfers annually at a compliance cost of up to $690 million.

This ruling directly conflicts with Magistrate Judge Horovitz’s report, in which he concluded that under the Bank Secrecy Act, FinCEN has the clear authority to create rules designed to prevent money laundering at the federal level. Additionally, he found that FinCEN has shown that the rule is needed based on its experience with the prior Geographic Targeting Orders, and that despite FNF’s pushback, “suspicious transactions” is a defined category and not overly broad. Magistrate Judge Horovitz also found that the law-enforcement-related benefits of the rule outweighed the costs of compliance.

Earlier this month, FinCEN proposed a new anti-money laundering rule that would seek to reform how financial institutions build AML and countering the financing of terrorism (CFT) programs under the Bank Secrecy Act. FinCEN said proposed changes aim to reduce the compliance burden by “promoting risk-based and reasonably designed programs” — and create greater consistency in how banks are evaluated for effectiveness. Additionally, the rule would revise FinCEN’s regulations to reflect changes from the Anti-Money Laundering Act of 2020 — and fully replace a prior proposed rule published July 3, 2024, which FinCEN is withdrawing.

Public comment on the rule is open through mid-June. 

FNF did not immediately return HousingWire’s request for comment on its decision to appeal the summary judgment ruling.

This post was originally published on here

Presidio Investors has taken a strategic stake in Minnesota-based mortgage brokerage platform Edge Home Finance, the firms announced Monday. Financial terms and ownership structure were not disclosed.

The Austin, Texas-based private equity firm said the deal will support Edge’s technology roadmap, operations and potential acquisitions. Edge will continue to operate with the same platform, leadership team and broker-focused model.

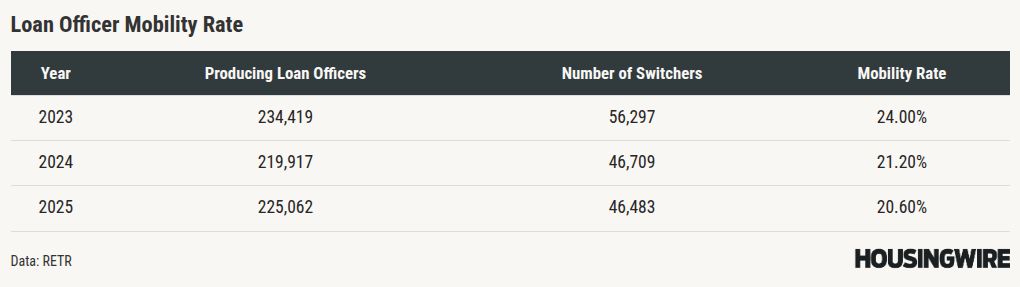
Edge originated about $8.6 billion in mortgages over the past 12 months, mainly in Texas, Florida and Minnesota, according to mortgage platform RETR. The company had 1,295 sponsored loan officers as of Monday, per the Nationwide Multistate Licensing System.

“Edge Home Finance’s platform, track record and broker-focused approach aligns perfectly with our vision of fostering excellence and growth,” Victor Masaya, a partner at Presidio Investors, said in a statement.

Brokers have grown market share in recent years, reaching about 20.7% in the fourth quarter of 2025, according to Inside Mortgage Finance. They emphasize pricing transparency and consumer choice but face rising fixed costs for compliance, technology and marketing, like other originators.

Access to private equity capital, like Presidio’s investment in Edge, can give broker platforms more scale to negotiate with wholesale lenders, invest in borrower-facing digital tools and pursue roll-up acquisitions of smaller shops.

Tom Ahles, president of Edge Home Finance, said the partnership is intended to accelerate Edge’s expansion and technology plans. “Presidio brings the technology vision and strategic guidance we need to expand our reach and further elevate our service delivery,” Ahles said in a statement.

Presidio focuses on lower middle-market companies and counts businesses such as Bravas, a provider of home automation solutions, and Hellas Verona FC, an Italian professional football club, in its portfolio. The Edge deal adds a fee-based housing and mortgage services business rather than a balance sheet-intensive mortgage banking operation.

Flávia Furlan Nunes reported and wrote this article with drafting assistance from HousingWire Automation, an editorial tool that helps transform announcements and industry data into HousingWire-style news coverage.

This post was originally published on here

Dangerous wildfire conditions have spread across the country, reaching deeper into hurricane-prone regions like Florida and the Gulf Coast as the weather grows hotter, drier, and windier.

That expanding threat is reshaping how communities and insurers assess fire risk in places long defined by storm surge rather than flames.

To address the threat, the Insurance Institute for Business & Home Safety, a nonprofit supported by insurers and reinsurers, is extending its Wildfire Prepared program to Florida and nine other states. The program, first launched in 2022, will now be available in 14 states, up from four.

The program gives homeowners, builders and neighborhoods research-backed steps to build fire resilience and reduce risk. Third-party inspectors verify properties for one of two designations: Wildfire Prepared Home or Wildfire Prepared Home Plus. Standards focus on blocking wind-driven embers, limiting radiant heat and reducing direct flame exposure, and include a neighborhood designation to prevent structure-to-structure spread.

“Wildfire doesn’t stop at a property line,” IBHS CEO Roy Wright said in a statement announcing the expansion. “Once it enters a neighborhood, the built environment can either slow it down or help it spread.”

Wright said the expansion reflects rising demand for proven mitigation in regions where fire was once seasonal or localized.

Rising wildfire risk across expansion states

IBHS started with California, Nevada, New Mexico and Oregon – states that rank among the highest for acreage burned. Last January, wildfires swept through the Los Angeles area, causing billions in damage.

The program now covers Arizona, Colorado, Florida, Idaho, Montana, Oklahoma, Texas, Utah, Washington and Wyoming. They are also among the top states for acres burned annually, according to the Insurance Information Institute.

The L.A. fires drew major attention because of the neighborhoods destroyed and the ongoing rebuilding effort. Still, National Centers for Environmental Information data show total acres burned nationwide last year fell below the 7 million annual average.

Forecasters, however, see potential trouble ahead this year. The National Interagency Fire Center predicts above-normal fire potential this spring across much of the West and South. Exceptional warmth, record-low snowpack and expanding drought are rapidly scorching vegetation from California and the Great Basin into the Southwest and Rockies.

The center’s April report noted that “dry and abnormally warm conditions in March brought intensifying drought to large parts of the region, boosting wildfire activity late in the month while hinting at some of the concerns that could stick around until consistent heavy rainfall returns.”

If drought lingers and early tropical storms miss the Gulf Coast, the report concluded, East Texas through Florida could face unusually intense summer wildfire activity.

Florida is already experiencing wildfires

Florida’s inclusion comes as more than 1,600 drought-fueled wildfires have burned statewide through March, according to state officials. That pace would push Florida past 6,400 wildfires by year’s end – more than double last year’s total. In March, a 500-acre Calhoun County blaze destroyed 16 homes when high winds met dry vegetation.

“These fires, with the wind we’ve had and the freezes, are a perfect recipe for a major system,” state Agriculture Commissioner Wilton Simpson said at a press briefing two weeks ago.

April through June is Florida’s peak fire season. Simpson called the current drought the worst in more than a decade. The Florida Forest Service has added firefighters, helicopters, drones and bulldozers to combat more blazes across the state’s forests and wetlands.

A push for verified fire risk mitigation

Expanding development in fire-prone areas has pushed officials and insurers toward building standards and neighborhood-scale mitigation to curb losses. IBHS is betting verified mitigation can keep communities ahead of a growing threat. The designations are voluntary but complement land-use planning, firefighting investments and homeowner education already underway in many states.

For Florida homeowners, the expansion offers a template for hardening homes before peak season. For policymakers from the Gulf Coast to the Rockies, it signals that wildfire resilience is now a year-round concern.

This post was originally published on here

Pending home sales rose slightly in March, jumping 1.5% month-over-month, according to data released Tuesday by the National Association of Realtors (NAR). 

In March, the Pending Home Sales Index came in at a reading of 73.7, up from February’s reading of 72.1, but down 1.1% annually.

An index reading of 100 is equal to the level of contract activity in 2001.

“Contract signings rose in March despite higher mortgage rates, pointing to pent-up housing demand,” Lawrence Yun, NAR’s chief economist, said in a statement. “A greater supply of inventory will help translate that demand into more home sales.”

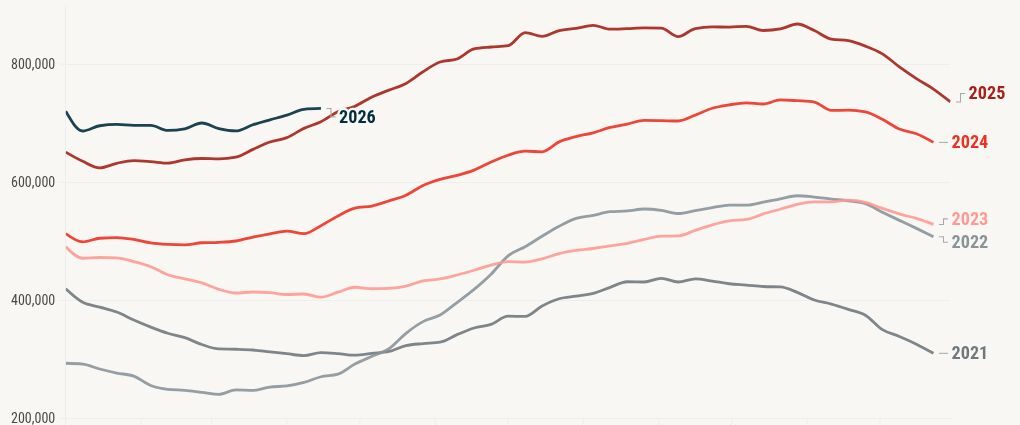
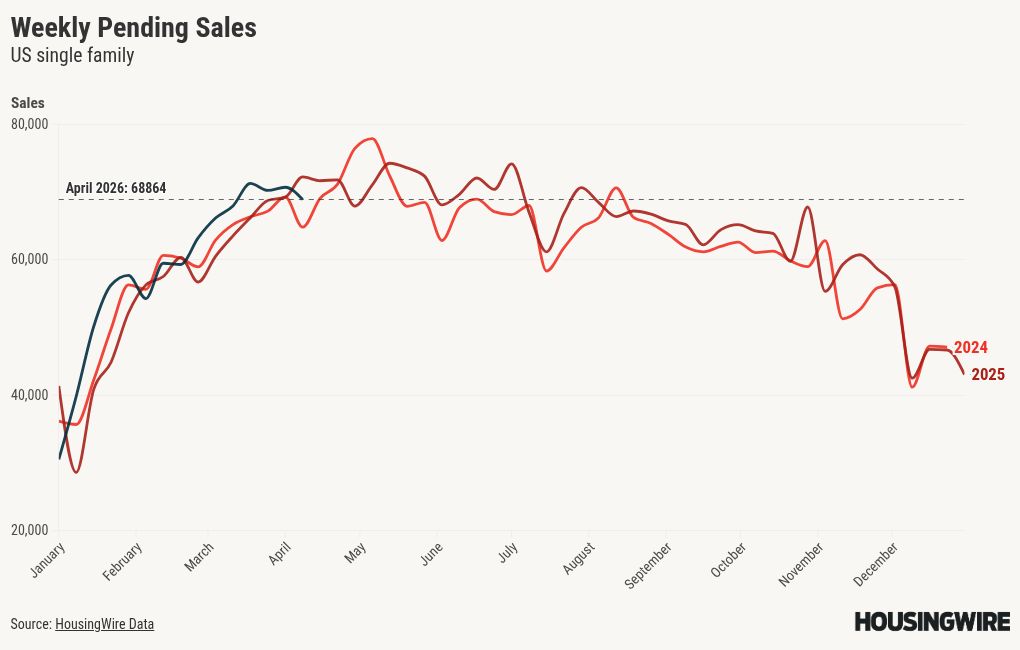
HousingWire Data shows that during the last week of March 2026, there were 70,676 new pending home sales, up from 69,183 new pending home sales at the end of March 2025. During the week ending on April 16, there were 73,241 new pending home sales up from 71,775 new pending home sales a year ago. Overall, HW data shows that pending inventory as of mid-April is at 392,173, up 0.2% compared to a year ago. 

Regionally, NAR’s data shows that pending home sales were up on a monthly basis in the Northeast (58.5) and South (91.6), jumping 4.4% and 3.9%, respectively, while dropping 1.3% and 2.6% in the Midwest (73.9) and West (56.9), respectively. Year-over-year, pending home sales were down in the Northeast (-6.5%), Midwest (-3.1%) and West (-1.7%), but up 2.3% in the South. 

Among the 50 largest metro areas, Kansas City, MO-KS, reported the largest annual increase in pending home sales, jumping 14.9% compared to March of 2025. The Milwaukee–Waukesha, WI (+13.5%), Austin–Round Rock–San Marcos, TX (+12.8%), Phoenix–Mesa–Chandler, AZ (+12.1%) and Raleigh–Cary, NC (+10.0%) metro areas also posted double-digit year-over-year increases. 

“A good number of markets in the South experienced price cuts over the past year but recorded the strongest job growth,” Yun added. “That combination should lead to stronger housing market activity in the South this year.”

Mike Miedler, the president and CEO of CENTURY 21 Real Estate, also warned that due to these regional differences, agents and consumers should not read national headlines and assume those statements apply to their neighborhood. 

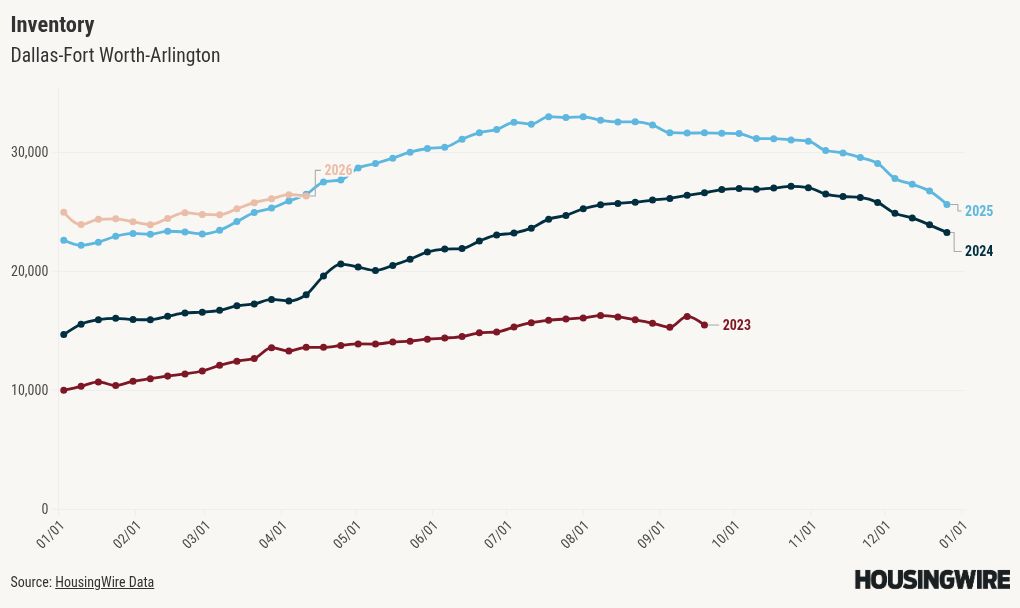
“Texas looks very different from Massachusetts right now. Dallas already has fewer single family homes for sale than this time last year,” Miedler said in a statement. “A buyer in Connecticut is in a completely different market than one in Houston or San Antonio. The national number tells you the weather. Your local agent tells you whether to bring an umbrella.”

This post was originally published on here

About 85% of homeowners with mortgages say there is something they wish they had known before starting the homebuying process, according to a new national survey of New American Funding (NAF) servicing customers, released Tuesday.

The biggest blind spot is down payments. Roughly 20% of respondents said they wish they had known about down payment assistance programs before buying, and another 13% did not realize a 20% down payment was not required to purchase a home.

“The long-held belief that you need a 20% down payment to purchase a home is simply not true. When someone assumes they need that much, it can be discouraging. But the reality is much different,” New American Funding President Christy Bunce said in the company’s announcement. “Homebuyers have a significant number of options when it comes to loan programs that could cut that percentage dramatically.”

The online survey, conducted in November and December 2025, collected responses from 1,056 homeowners whose loans are serviced by NAF.

Most buyers put down 10% or less

Despite persistent misconceptions, the data shows most buyers are purchasing with far less than 20% down. Overall, 72.6% of respondents reported putting down 10% or less on their homes.

Baby boomers were the most likely to make a down payment of more than 20%, at 18.1%. At the other end of the spectrum, low-down-payment financing was common for younger buyers: 59.6% of Gen Z buyers and 44.8% of millennials put down 3.5% or less.

Meanwhile, 18.1% of baby boomers, 15.5% of Gen X, 10.1% of Gen Z and 9.9% of millennials said they put down 0%.

NAF noted that buyers who reported 0% down likely used a zero-down loan, down payment assistance or financial gifts from family and friends.

Regionally, knowledge gaps around down payments varied. Homeowners in the Northeast (17.9%) were roughly twice as likely as those in the West (8.9%) to say they wish they had known they didn’t need a 20% down payment. The share of buyers who reported putting 0% down was highest in the South (17.7%), compared with 13.4% in the West, 9.7% in the Midwest and 7.4% in the Northeast.

Beyond down payments, many respondents said they wished they had understood other aspects of the transaction before entering the market. Over 10% (10.6%) of recent homeowners said they wish they had known they could negotiate more with sellers, and 9.9% said they would have liked to know about minimum credit score requirements to qualify for a mortgage earlier in the process.

These findings point to continued confusion over buyer leverage and qualifying standards, particularly in a higher-rate environment where sellers may be more flexible on concessions and rate buydowns in some markets.

Affordability remains the top challenge

Finding a home they could afford was the hardest part of the process for 44% of respondents, the survey found. The affordability strain persisted even with outside help. About one-third of Gen Z and millennial buyers reported receiving financial assistance from family or friends, yet nearly three-quarters of all recent homeowners (71.7%) said they did not receive any such support.

Regionally, Northeastern homeowners were most likely to receive family or friend assistance, with 32.1% saying they got help up to 20% of the sale price. That compared with 21.3% in the South and 20.7% in both the Midwest and West.

Cost surprises did not end at the closing table. The survey found 17.1% said the actual cost of homeownership was higher than they anticipated, 16.4% bought a home that needed more work than expected and 13% felt they overpaid for their home.

When asked which ongoing expenses were higher than expected, respondents cited maintenance and repair costs (37.2%), property taxes (25.4%) and utility bills (22.3%).

Despite affordability pressures and higher-than-expected expenses, most respondents remain committed to their purchase. Nearly three-quarters (72.9%) said they would buy the same home again if given the chance.

About 24.8% of recent homeowners plan to stay in their homes for the rest of their lives. Baby boomers were the most likely to want to “age in place,” at 38.1%, followed by Gen X at 31.6%, millennials at 18.5% and Gen Z at 11%.

“In today’s housing market, buyers should take advantage of money-saving opportunities. Down payment assistance programs, negotiating with sellers, and loans that allow lower down payments are powerful tools that can make the difference between waiting on the sidelines and securing your home,” Bunce said. “At New American Funding, our loan officers partner with homebuyers to help them navigate the process with confidence.”

This article was generated using HousingWire Automation and reviewed by a HousingWire editor before publication. The system helps convert company announcements and industry data into HousingWire-style news coverage.

This post was originally published on here

Mortgage rates continued to move lower this week as financial markets digested the latest geopolitical activity, but a number of factors could prompt investor fears to rise again this week.

Mortgage News Daily reported Monday that 30-year fixed rates averaged 6.30%. That was down 9 basis points from a week earlier and 57 bps lower than a year ago. MND based its rates on best-execution pricing from lender rate sheets.

At HousingWire‘s Mortgage Rates Center, 30-year conforming loan rates averaged 6.42% on Tuesday, down 5 bps from one week ago. Rates for 30-year loans through the Federal Housing Administration (FHA) dropped 3 bps to 6.15% and rates for jumbo loans fell 4 bps to 6.29%.

The recent downward movement in rates is being driven in part by a ceasefire in the U.S.-Iran conflict, but that agreement is set to expire Wednesday. Multiple outlets say that an extension of the ceasefire is unlikely, with The Associated Press reporting that mediators are meeting in Pakistan and leaders of both countries are prepared to resume military action. Interest rates could rise again if a truce does not materialize.

While the Federal Reserve meets again next week, a rate cut is all but off the table. Investor sentiment and rates are more likely to move in tandem with Tuesday’s Senate hearing for Kevin Warsh — President Donald Trump‘s choice to replace Jerome Powell as the central bank’s chair. The Fed’s two-day meeting that concludes April 29 will be Powell’s last in charge.

Measured return to the market

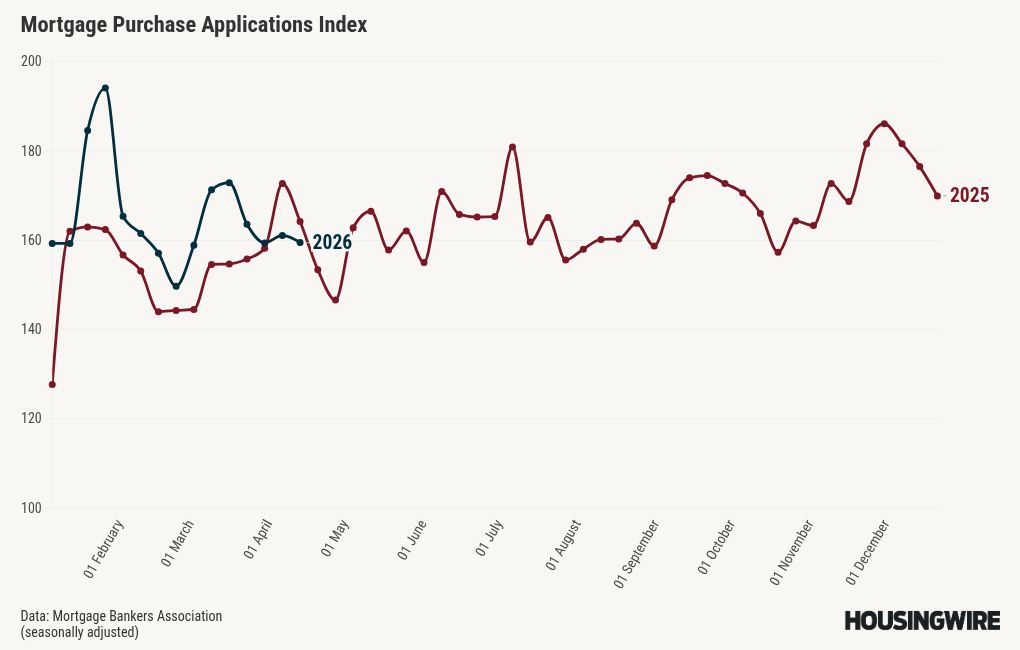
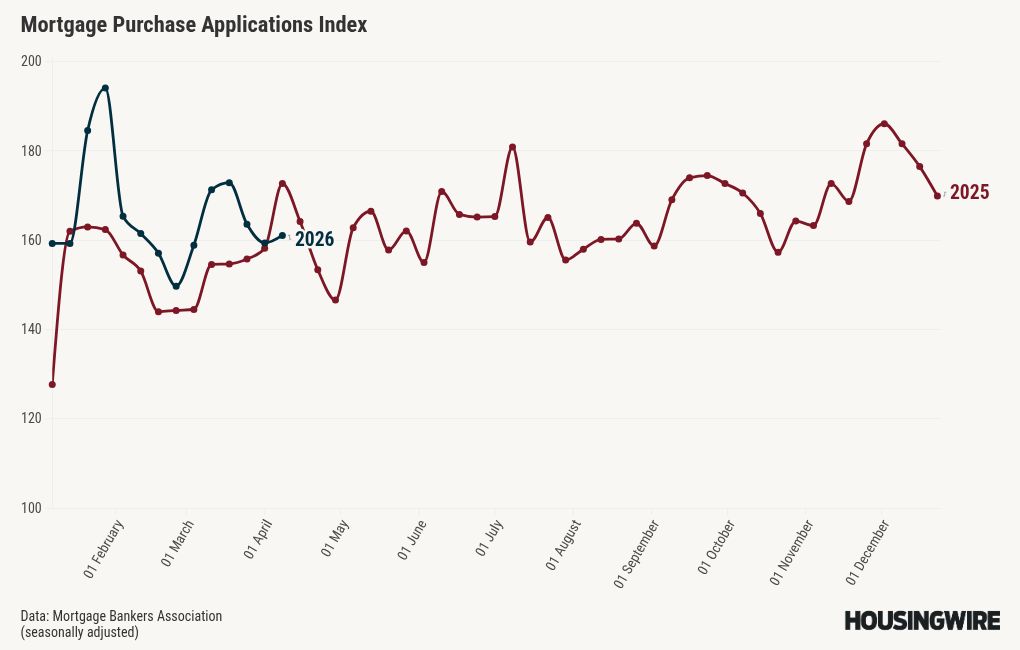
Cooling rates during the ceasefire have had a positive impact on home purchase and refinance demand, with the Mortgage Bankers Association (MBA) reporting last week that total applications were up 1.8% on a weekly basis, led by a 5% jump in refi applications.

“Mortgage applications increased modestly as a decline in mortgage rates led to a boost in activity for the first time in five weeks,” Bob Broeksmit, the MBA’s president and CEO, said in a statement. “Refinances were up on a weekly and annual basis, but purchase activity remains subdued, with applications below year-ago levels for the second straight week as economic uncertainty and affordability pressures continue to affect homebuyer demand.”

Kyle Bass, production business manager at Refi.com — an affiliate of Mortgage Research Center and Veterans United Home Loans — said that the “modest” declines in rates have been enough to catch the attention of prospective borrowers.

“Homeowners are beginning to re-engage after a period of waiting on the sidelines. This isn’t a surge driven by urgency, but more of a measured return, where borrowers are reassessing their options and paying closer attention to how current rates compare to what they have today,” Bass said in a statement.

“At Refi.com, we’re seeing that shift play out in real time Borrowers aren’t rushing to act, but they are becoming more aware of the opportunity. If rates continue to trend in this direction, even gradually, this kind of early re-engagement can build into more meaningful refinance activity in the weeks ahead.”

‘More careful in pulling the trigger’

This week’s HousingWire Housing Market Tracker also shows positive growth in pending home sales, a leading indicator for closed transactions. Nationally, pending sales were up 6.4% week over week and 2% higher year over year.

On Tuesday, monthly data from the National Association of Realtors (NAR) showed more mixed results for March, with pending sales up 1.5% monthly but down 1.1% annually.

“Demand sensitivity to mortgage rates is greatest among first-time buyers, particularly younger buyers,” NAR chief economist Lawrence Yun said. “As a result, boosting supply and new-home construction should focus on smaller, more affordable homes.

“A good number of markets in the South experienced price cuts over the past year but recorded the strongest job growth,” Yun added. “That combination should lead to stronger housing market activity in the South this year.”

Bright MLS chief economist Lisa Sturtevant cautioned last week that spring housing market conditions appeared to be something of a “toss-up.”

“The ceasefire announcement earlier this month may have temporarily eased mortgage rates; however, right now, the outlook for the spring market is still unclear,” Sturtevant said. “Mortgage rates are probably going to remain volatile as there is still significant uncertainty about a long-term resolution of the conflict with Iran. In addition, inflation in March rose to 3.3% and this higher inflation, which was tied heavily to energy and global shipping, means lower rates are unlikely in the short term. 

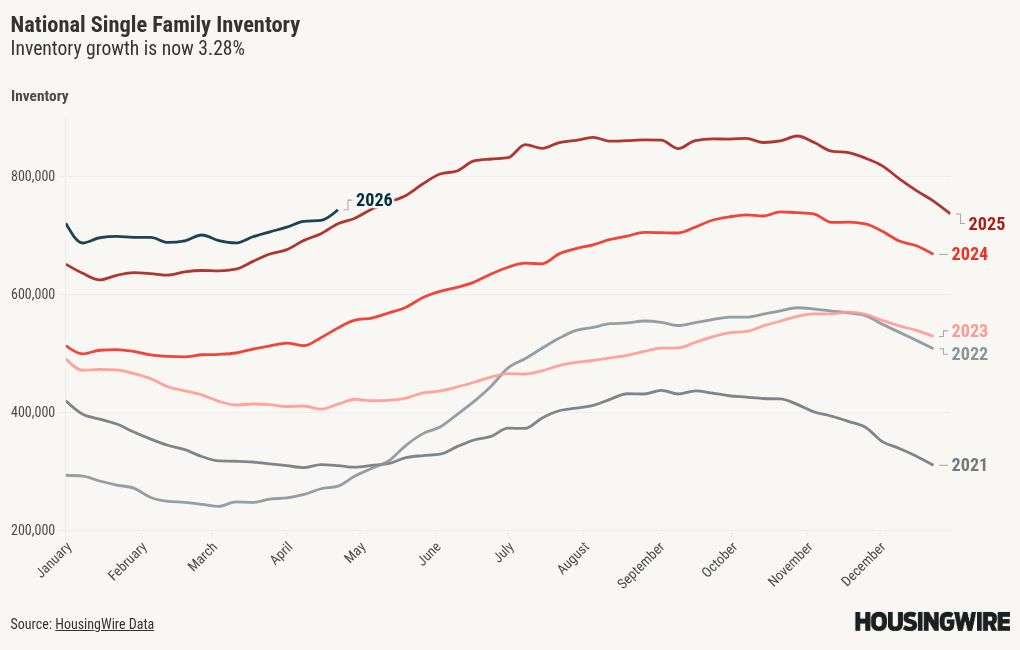
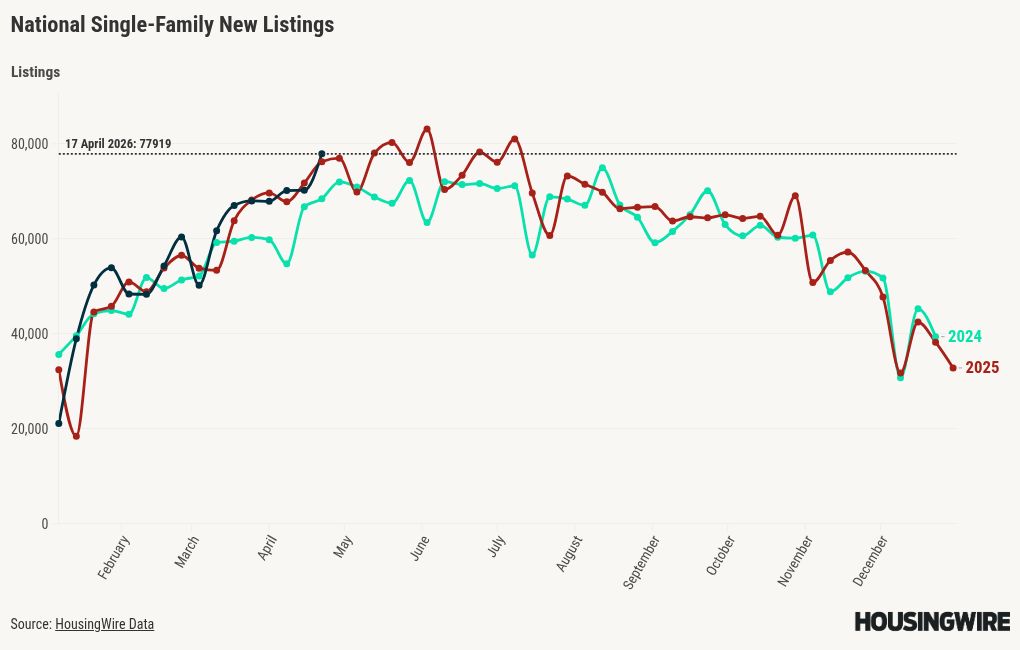
“… New listings increased in March, signaling sellers are gearing up for the spring. However, we’re not sure if the higher inventory will be enough to entice buyers into the market. Higher rates continue to erode buyer purchasing power and uncertainty continues to give prospective buyers pause.” 

Melissa Cohn, regional vice president for William Raveis Mortgage, pointed to the University of Michigan’s consumer sentiment index for April as a cause for concern. It fell to a low point in the 70-year history of the survey. And these feelings are translating to a more measured approach to homebuying.

“People are much more careful in pulling the trigger,” Cohn says. “I have a large number of people who continue to extend their preapproval letters. … If you feel confident in your situation, and you see something that’s a good opportunity, and it’s a home that you want to have, and you’ll be sorry you missed out on it, then buy it now.” 

This post was originally published on here

GreenPath Financial Wellness — a nonprofit approved by the U.S. Department of Housing and Urban Development (HUD) and the National Foundation for Credit Counseling — reviewed data from its reverse mortgage counseling clients over the past two years. It found that more older homeowners are turning to home equity to close widening monthly budget gaps.

In 2025, 21.1% of GreenPath’s reverse mortgage clients entered counseling with a deficit in their monthly budget, nearly double the 12.2% share in 2024, according to the organization’s internal client data. The average monthly shortfall also grew, from $1,498 in 2024 to $1,793 in 2025.

“These are not small gaps,” said Jennifer Fraser, director of stakeholder engagement and grants at GreenPath. “Budget shortfalls of this size often mean struggling to afford essential living costs like housing, healthcare, utilities and food. Since funds from a reverse mortgage can be used for almost anything, it becomes a lifeline in times of financial hardship.”

Reverse mortgages, primarily Home Equity Conversion Mortgages (HECMs) insured by the Federal Housing Administration (FHA), have long been used as a retirement income tool for homeowners 62 and older. The GreenPath data suggests that for many seniors with limited or fixed incomes, the product is increasingly functioning as a last-resort cash-flow strategy rather than a discretionary planning option.

Income profiles for counseling clients underscore how financially fragile many reverse mortgage prospects are. In 2025, half of GreenPath’s reverse mortgage clients lived on less than 50% of their area median income (AMI), the analysis found.

Across 2024 and 2025 combined, roughly 23% of clients fell into the very low-income category, with household income below 30% of AMI. These levels are commonly used by federal housing programs to identify households with the greatest affordability challenges.

For lenders, servicers and housing counselors, these income benchmarks matter because they signal that a growing segment of potential reverse mortgage borrowers may have little margin for error if housing costs, medical bills or other essentials increase. That heightens the importance of counseling and clear communication about ongoing obligations such as property taxes, homeowners insurance and maintenance.

“Reverse mortgages go beyond a retirement planning tool to be a strategy to make ends meet for many households,” GreenPath said in summarizing the data.

Financial strain deepens with age

The nonprofit’s data also points to a strong age-based pattern. Budget deficit rates increased for older age groups, with the share of clients 80 and older who reported a budget deficit more than doubling — from 12.6% in 2024 to 25.8% in 2025.

As seniors age, fixed income streams often fail to keep pace with rising living and health care expenses, leaving fewer levers to address shortfalls. Among GreenPath’s 80-plus cohort, 58.8% live on less than 50% of AMI, compounding the risk that unexpected costs or market changes could quickly erode their financial position.

For the reverse mortgage sector, this trend intersects with broader demographic shifts. The U.S. population is aging, many retirees have limited retirement savings, and housing costs have outpaced income growth in many markets. Reverse mortgages can unlock housing wealth but also introduce long-term obligations and complexity, making suitability analysis more critical as borrowers get older and more income-constrained.

To respond to rising demand and deeper financial strain among clients, GreenPath said it received a supplementary award under HUD’s Comprehensive Housing Counseling grant program.

The $455,000 award will fund HECM reverse mortgage counseling sessions through September 2026 or until funds are exhausted. The organization said the grant will allow it to provide the required counseling at no cost to seniors nationwide who are facing increased financial hardship.

“Many seniors have spent their lives working hard to own a home, so drawing on its equity can seem like an obvious choice. But there are a lot of pros and cons to consider first. This grant helps ensure that older adults living on strained incomes don’t have to navigate complex financial decisions alone,” Fraser said.

Under HUD rules, most HECM borrowers must complete independent counseling before moving forward with a loan. For low-income seniors, counseling fees can be a barrier to accessing that advice. Grant-funded counseling can help ensure that financially vulnerable borrowers receive objective guidance on reverse mortgage terms, alternatives and potential long-term impacts before committing.

GreenPath said its counselors work with seniors to review budgets, explain reverse mortgage structures and discuss other options that may help stabilize housing and household finances.

This article was generated using HousingWire Automation and reviewed by a HousingWire editor before publication. The system helps convert company announcements and industry data into HousingWire-style news coverage.

This post was originally published on here

Tranquility and light are the main elements you’ll notice in this pretty co-op at 1110 Caton Avenue. The pre-war apartment has the generously-sized rooms of its era, with the timeless design update of a recent renovation. Asking $675,000, it’s currently configured as a one-bedroom home, but can easily become a two-bedroom with a dedicated home office. Prospect Park and the Parade Grounds are just steps away, providing a 585-acre front yard.

The apartment overlooks a verdant courtyard and gets lots of sunlight in its large, open rooms. while five closets provide clutter control. Joining considered details like custom radiator covers, high-tech upgrades include smart lighting throughout, and a keyless entry system.

The living room, dining room, and adjacent spaces flow together for effortless entertaining. A second bedroom will fit in easily here (it’s a legal two-bedroom) while still leaving plenty of room for dining and dancing.

A design-forward kitchen features a farmhouse sink and a suite of capable Bosch appliances. Penny tile flooring adds a vintage feel to clean, simple custom cabinetry. An LG washer and dryer are integrated here for maximum convenience.

A corner bedroom gets a large closet. Adjacent to the bedroom, a vintage-inspired bath combines octagon tile, subway tile, and a classic Kohler pedestal sink.

The pet-friendly building is part of a cooperative community that includes 5 Stratford Road for a total of 32 apartments. Perks for residents include two landscaped outdoor spaces, additional storage, and bike storage.

[Listing details: 1110 Caton Avenue, #11C at CityRealty]

[At The Corcoran Group by Steven Segretta]

RELATED:

The post This $675K Flatbush co-op has a clean Scandinavian vibe and a flexible layout first appeared on 6sqft.

This post was originally published here

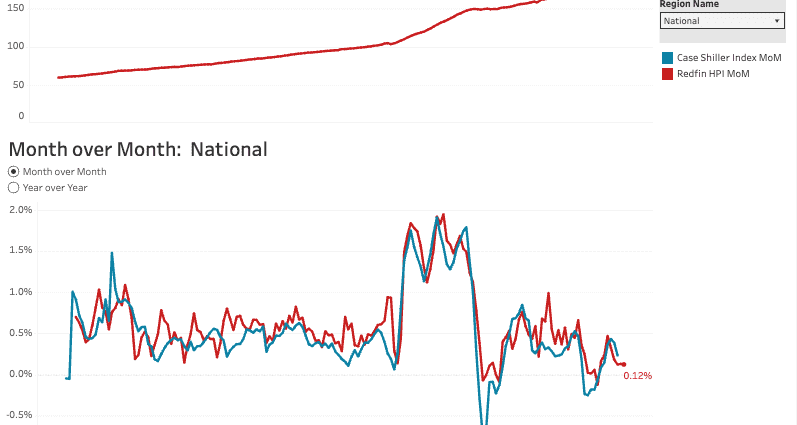
    • Home prices ticked up 0.1% month over month on a seasonally adjusted basis. 
    • Prices rose 1.9% on a year-over-year basis–the slowest growth rate on record. 
    • On a local level, prices fell in 13 major metros month over month, with the biggest declines in Texas and the biggest increase in San Francisco. 

U.S. home prices inched up 0.1% month over month in March on a seasonally adjusted basis, the third straight month of the same increase. 

Prices rose 1.7% from a year earlier, the slowest year-over-year growth rate in records dating back to 2012. Home-price growth has been slowing since the start of 2025. 

This is according to the Redfin Home Price Index (RHPI), which uses the repeat-sales pricing method to calculate seasonally adjusted changes in single-family home prices. The RHPI measures how sale prices of homes have changed since their previous sale—similar to the S&P Cotality Case-Shiller Home Price Indices—but is reported about a month earlier. March data covers the three months ending March 31, 2026. Read the full RHPI methodology here.

Home-price growth has slowed this year on a year-over-year basis because demand is tepid. Many would-be buyers have backed off due to high mortgage rates and uncertainty about the U.S. economy and the Iran war. Mortgage rates rose from 6% to 6.4% in March, largely because the Iran war pushed up oil prices and pushed markets into turmoil. 

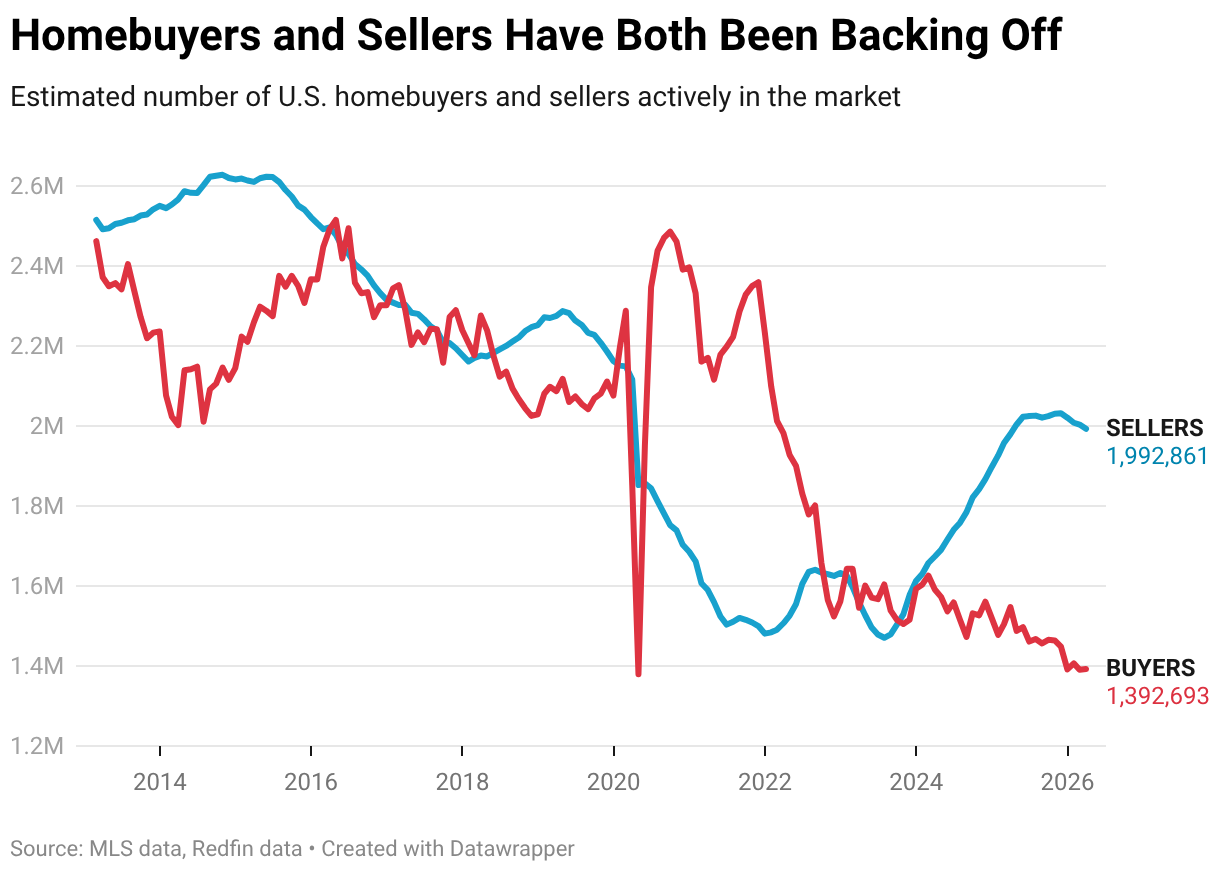
But prices are still rising, not falling, because new listings of homes for sale are declining. There are still hundreds of thousands more home sellers than buyers in the market, but now some homeowners are opting to stay put rather than list their home into a soft market. 

“Price growth is losing steam, with the slowest annual gains we’ve seen in a decade–in line with our expectations for the year,” said Chen Zhao, Redfin’s head of economics research. “High mortgage rates and global uncertainty are causing some would-be buyers to back off, which is putting a lid on home prices. While that can be frustrating for homeowners hoping to sell, it’s the start of a reset for the housing market as a whole, and may ultimately bring homebuying costs down enough to bring some house hunters back.”

Home Prices Are Falling in 13 Major Metros, Led by Fort Worth and Austin


Home prices fell in 13 major U.S. metros month over month on a seasonally adjusted basis in March. Redfin analyzed the 50 most populous metro areas and included in this analysis the 46 with sufficient data.

The biggest declines were in Fort Worth, TX (-0.8%) and Austin, TX (-0.7%). Next come Nashville, TN (-0.6%), Oakland, CA (-0.6%) and Phoenix (-0.3%). The biggest increases were in Pittsburgh (2.8%), West Palm Beach, FL (2.1%), Nassau County, NY (1.4%), Chicago (1.3%) and San Francisco (1.2%). 

The biggest year-over-year price declines were in San Antonio (-4.1%), Jacksonville, FL (-3.5%) and Austin (-3%). The biggest gains were in San Francisco (13%), Chicago (10.7%) and New York (9.2%). Prices are soaring in San Francisco largely because of the AI boom

Metro-Level Summary: Redfin Home Price Index, March 2026
U.S. metro area Month-over-month change (seasonally adjusted) Year-over-year change
Anaheim, CA 0.2% 3.2%
Austin, TX -0.7% -3.0%
Baltimore, MD 0.8% 2.9%
Boston, MA 0.5% 3.6%
Chicago, IL 1.3% 10.7%
Cincinnati, OH 0.6% 3.9%
Cleveland, OH 0.5% 5.9%
Columbus, OH 0.1% -0.4%
Dallas, TX 0.0% -2.9%
Denver, CO 0.1% -0.3%
Detroit, MI -0.1% 6.2%
Fort Lauderdale, FL 1.2% 2.2%
Fort Worth, TX -0.8% -0.4%
Houston, TX 0.3% -1.6%
Indianapolis, IN 0.2% 0.8%
Jacksonville, FL 0.3% -3.5%
Las Vegas, NV 0.0% -0.6%
Los Angeles, CA 0.7% 0.2%
Miami, FL 0.5% 2.1%
Milwaukee, WI 0.5% 9.1%
Minneapolis, MN 0.3% 1.2%
Montgomery County, PA 0.8% 7.1%
Nashville, TN -0.6% -0.3%
Nassau County, NY 1.4% 7.9%
New Brunswick, NJ 1.1% 7.6%
New York, NY 0.9% 9.2%
Newark, NJ 0.8% 7.2%
Oakland, CA -0.6% 1.1%
Orlando, FL -0.1% -0.6%
Philadelphia, PA -0.1% 6.2%
Phoenix, AZ -0.3% -0.9%
Pittsburgh, PA 2.8% 5.6%
Portland, OR -0.1% -0.4%
Providence, RI 1.0% 4.9%
Riverside, CA 0.2% -1.2%
Sacramento, CA -0.2% -0.6%
San Antonio, TX -0.2% -4.1%
San Diego, CA 0.7% 1.4%
San Francisco, CA 1.2% 13.0%
San Jose, CA 0.5% 2.7%
Seattle, WA 0.5% -0.3%
Tampa, FL 0.3% 2.5%
Virginia Beach, VA 0.7% 4.3%
Warren, MI -0.3% 4.2%
Washington, DC 0.2% 0.8%
West Palm Beach, FL 2.1% -0.9%

The post U.S. Home Prices Inched Up 0.1% in March appeared first on Redfin Real Estate News.

This post was originally published here

PennyMac Financial Services Inc. has launched a specialized mortgage program for Team USA athletes, aiming to address the unique income and qualification challenges that Olympians and Paralympians face when buying or refinancing a home.

The “Welcome Home: Athlete Mortgage Program,” announced Tuesday, builds on PennyMac’s role as the official mortgage provider of Team USA and the 2028 Olympic and Paralympic Games in Los Angeles, according to the company announcement.

The initiative offers Team USA athletes access to dedicated home lending experts, exclusive loan benefits and targeted education, the company said. The goal is to create a structured path to homeownership for athletes, who often have nontraditional income streams, short peak-earning windows and frequent relocation — factors that can complicate underwriting under standard agency and investor guidelines.

“At Pennymac, we believe greatness begins at home — Team USA athletes, much like the families we serve, deserve a solid foundation to reach their full potential,” Doug Jones, president and chief mortgage banking officer at PennyMac, said in a statement.

“Through ‘Welcome Home,’ we’re proud to provide these athletes with mortgage expertise, guidance and a tech-forward experience, ensuring the tenacity they bring to the Olympic and Paralympic Games is rewarded with the stability of a permanent place to call their own.”

The program is being launched as the mortgage industry continues to navigate a high-rate, low-inventory environment that has made affordability a central concern for all borrowers. For self-employed or gig economy workers like athletes, documenting income and meeting debt-to-income thresholds can be even more complex, prompting some lenders to develop niche offerings and dedicated support teams.

The PennyMac initiative also highlights how major originators are using affinity and sponsorship channels to reach narrowly defined borrower segments while still operating within existing product and credit frameworks. For real estate agents working with Olympians and Paralympians, a specialized program can provide a clearer path to prequalification and underwriting, potentially reducing fallout and contract delays.

PennyMac’s program is anchored by three primary components:

  • Dedicated lending support: Team USA athletes receive access to loan specialists who are trained on athlete-specific financial profiles, including fluctuating earnings and endorsement income.
  • Exclusive home loan benefits: The companies are offering a menu of savings opportunities and loan options tailored to this borrower group, although specific pricing and credit parameters were not disclosed.
  • The Home Team Training Center: Athletes can access educational content, webinars and tools focused on building credit, understanding mortgage products and planning for long-term housing stability.

“We are incredibly thankful to have a partner like Pennymac that is deeply committed to supporting the Team USA athlete community,” said Sarah Hirshland, CEO of the U.S. Olympic & Paralympic Committee. “After witnessing the meaningful impact Pennymac has already made with athlete homeowners this past year, we are thrilled to build on that momentum with the launch of the ‘Welcome Home’ program and support even more athletes in the years to come.”

Pennymac said it has already worked with multiple Team USA athletes on their homeownership journeys. They include U.S. Olympic freeski halfpipe gold medalist Alex Ferreira; Olympic gold medalist speedskater Erin Jackson; Paralympic snowboarder and five-time Paralympic medalist Brenna Huckaby; and track and field athletes Hunter Woodhall, a five-time Paralympic medalist, and Olympic gold medalist Tara Davis-Woodhall.

“Home is my sanctuary; it’s where I reset, and Pennymac understood that,” Ferreira said in the announcement. “They were looking out for me from the start, reaching out directly to make sure I was locked into the best possible rate. Knowing my mortgage is in good hands gave me the peace of mind to focus more on what I care about most — staying 100% dialed in on my goals on and off the mountain.”

The program is being rolled out in partnership with the U.S. Olympic & Paralympic Committee and is intended to support the broader Team USA athlete pool in the run-up to the 2028 Olympic and Paralympic Games in Los Angeles. PennyMac said it plans to evolve the offering as it receives feedback from participating athletes and as market conditions change.

For housing professionals, the “Welcome Home” effort is another example of how large lenders are segmenting outreach and marketing around specific affinity groups, from veterans and first responders to education and health care workers. These partnerships can generate new purchase and refinance volume while also differentiating lenders in a commoditized rate environment.

This post was originally published on here

Costs are climbing faster than many operators expected, and teams are actively trying to figure out how to keep up without creating new problems in the process.

The Federal Reserve Bank of Minneapolis found that more than half of all operating expense (OpEx) inflation since 2020 ties back to property insurance, with premiums roughly doubling between 2021 and 2024. At the same time, rent growth has slowed in many markets, so passing those costs on to residents just isn’t as simple as it used to be.

For years, the playbook was simple: raise rents when possible, cut where needed, and delay anything nonessential. That approach held up when demand stayed strong and residents had fewer alternatives. But that’s not the environment operators are working in today, and leading with cuts usually creates bigger issues than it solves.

The problem with cutting your way to profitability

When budget cuts start to show up in the resident experience, renewals drop. That leads to higher turnover, and the cost of turning a unit quickly erases whatever savings you thought you were creating.

According to the National Apartment Association, over half of property management firms report average turn costs between $1,500 and $3,500 per unit, with 20% coming in even higher. Across a portfolio, that adds up fast.

Operators see it play out in real time. You pull back in one area, something else slips, and now you’re spending more to fix it than you saved in the first place.

That’s why the conversation is shifting from what to cut to what’s actually worth keeping. But you can’t answer that without data.

Understanding what performs

Operators need to know which amenities are used consistently, what’s actually reducing staff workload, and where time and money are going with little return. The good news is that data already exists in resident surveys, usage patterns and service logs.

Regularly reviewing that data helps teams move away from assumptions that may not hold up anymore. Something that worked two lease cycles ago might not make sense today.

It also changes how you think about underused spaces. An empty business center doesn’t necessarily mean residents don’t need it. It might just mean it no longer fits how they live or work.

At the same time, some amenities show steady, repeat usage because they’ve become part of daily life. Pet amenities and package lockers are good examples. Residents rely on them and have built routines around them.

Before making changes, operators need to understand what’s driving both outcomes. Sometimes the right move is to improve or reposition. Sometimes it’s to remove something entirely. But those decisions should come from real behavior, not gut instinct.

Holding amenities and technology to a higher standard

Operators have always applied clear return on investment (ROI) standards to utilities and capital decisions. Now, amenities and technology are getting that same level of scrutiny.

Some investments are easy to justify. Smart locks reduce service calls and eliminate key management. Package lockers solve a daily pain point and save staff time. You see the value almost immediately.

But not everything holds up the same way. Adding technology without a clear purpose is how properties end up with expensive features no one really uses.

Fitness spaces tell that story well. A basic equipment room was enough a decade ago. Now, residents are looking for spaces that support how they actually live. Group fitness, wellness-focused areas and flexible layouts are now the expectation. The need didn’t disappear. It evolved.

Operators who catch those shifts early can adjust before a space stops making sense for the community.

Retention as an operating strategy

When turning a unit costs thousands of dollars, retention becomes a financial lever, not just a leasing metric.

Every renewal has a direct impact on net operating income (NOI). On a 200-unit property, a five-point lift in retention can translate into tens of thousands of dollars in avoided turnover costs. That’s real impact on the bottom line.

Operators are starting to act on that.

Some portfolios are pushing turnover to historic lows, while some are holding steady in a tougher environment. What matters isn’t the exact number. It’s the approach behind it.

The teams getting results are protecting the experiences residents rely on, keeping operations consistent and avoiding cuts that create more problems later.

Market conditions are helping, too, since homeownership is out of reach for many renters, and uncertainty is keeping people in place longer. But that won’t last forever.

Operators who use this window to build stronger systems and retention habits will be in a much better position when conditions shift again.

The operating model that holds up

The pressure on margins isn’t going away. Since 2021, expenses have been rising at a pace the industry hasn’t had to manage in a long time.

But these conditions also create an opportunity to be more intentional about how the business runs.

The strongest teams are looking closely at how every part of the operation performs. They’re using data to understand what drives satisfaction and renewals, treating retention as a core lever, and applying the same discipline to amenities and services as they would to any other investment.

At the end of the day, every operating dollar needs to earn its place. That’s what cost discipline looks like in practice.

Jeff Lail is the CEO of WithMe, Inc.
This column does not necessarily reflect the opinion of HousingWire’s editorial department and its owners. To contact the editor responsible for this piece: zeb@hwmedia.com.

This post was originally published on here

Every day, about 10,000 Americans turn 65. That pace is expected to continue for another seven to eight years. Collectively, senior homeowners are sitting on a record $14.6 trillion in housing wealth. That’s not a niche. It’s a wave of new business that most purchase-loan originators are overlooking as a component of their pipeline — largely invisible to the originators who need it most.

Reverse mortgages aren’t rate-and-payment products. They’re liquidity and cash flow tools for the fastest-growing segment of the mortgage market. Unlike purchase lending, they’re far less vulnerable to rate cycles, which means originators who build a reverse vertical aren’t just adding a product; they’re adding business stability.

The biggest barrier to entry isn’t licensing or guidelines. It’s misinformation. Here are the 10 myths most originators believe, and what the reality looks like.

MYTH #1 “Reverse mortgages are only for financially struggling seniors.”

Today’s reverse borrower is often equity-rich but has limited liquid savings. They are motivated by a desire for control and flexibility, rather than desperation. The most common use cases are:

  • Cash-flow management in retirement (multiple payout options, like a line of credit or term payments, provide financial flexibility, making mortgage payments optional, turns elimination of a mortgage into an immediate cash flow boost)
  • Lifestyle sustainability (maintaining the retirement they worked for rather than quietly downgrading it)
  • Portfolio preservation (tapping home equity instead of selling investments in a down market may be a legitimate financial strategy)

MYTH #2 “The lender owns the home.”

Borrowers retain title. Full stop. A reverse mortgage is a lien against the property, with the same structure as a forward mortgage. As Finance of America’s Jonathan Scarpati explains, “If you understand how a traditional mortgage works, you already understand 80% of a reverse. The biggest difference is simply the repayment timing shifts.” The loan is repaid when the borrower sells, moves out or passes away, not before.*

* The reverse mortgage borrower must meet all loan obligations, including living in the property as the principal residence and paying property charges, including property taxes, fees, and hazard insurance. The borrower must maintain the home. If the borrower does not meet these loan obligations, then the loan will need to be repaid.

MYTH #3 “It’s too small a niche to matter.”

With senior homeowners holding more than $14 trillion in home equity, reverse mortgages aren’t a niche, they’re an underpenetrated market. The reason volume is relatively modest is simple: they aren’t offered at the point of sale often enough. Start with your own past clients. Borrowers you helped buy their first home 15 to 20 years ago may be a potential reverse candidate today. And when you close a loan for a 45-year-old, ask about their parents — many adult children are quietly supplementing their parents’ retirement income.

MYTH #4 “It’s too complex to learn.”

Reverse mortgages are not complex; they are just unfamiliar. The terminology sounds intimidating (UPB, principal limit, financial assessment), but these are straightforward concepts in industry jargon. As Scarpati phrases it, “This isn’t apples to oranges – it’s Gala to Fuji.” The real learning curve is the mindset shift: instead of leading with rate and payment, you lead with retirement income planning. Scarpati’s three starting concepts for forward originators: cash-flow durability, retirement income planning and education-first selling.

MYTH #5 “The rates don’t compare well.”

Comparing a reverse mortgage rate to a 30-year fixed is the wrong benchmark. The right question isn’t “what’s the rate?” — it’s “what does access to home equity without a required monthly mortgage payment* do for this borrower’s retirement runway?” For wealthier borrowers, strategically tapping home equity during a market downturn instead of liquidating a portfolio is a compelling wealth-management move.

* The reverse mortgage borrower must meet all loan obligations, including living in the property as the principal residence and paying property charges, including property taxes, fees, and hazard insurance. The borrower must maintain the home. If the borrower does not meet these loan obligations, then the loan will need to be repaid.

MYTH #6 “Heirs inherit a problem.”

HECMs are non-recourse loans. Involving families early in the conversation could resolve this concern and help avoid unnecessary stress or delays later in the process. When the loan comes due, heirs have clear options: sell the property and keep any remaining equity, refinance the balance to retain the home or walk away if the loan exceeds the property’s value — with zero liability beyond the home itself. The loan cannot chase other assets. 

MYTH #7 “Partners won’t be interested.”

They will when you speak their language. For real estate professionals, a 62+ buyer using Reverse for Purchase could bring a stronger down payment with no monthly mortgage obligation, making them more competitive, provided they continue to meet loan requirements such as living in the home as their primary residence, paying property charges including property taxes, fees and hazard insurance and maintaining the home. If the homeowner does not meet these loan obligations, then the loan will need to be repaid. For elder-law attorneys: long-term care funding, silver divorce asset division and housing stability.

MYTH #8 “It’s mostly a refinance product.”

Reverse for Purchase is becoming an increasingly attractive tool for seniors looking to purchase a home without the burden of a monthly mortgage payment in or near retirement. The 55+ demographic is still one of the largest home-purchase markets in the country, whether it be for downsizing after 30 years in the family home, relocating near grandchildren or buying into a 55+ community. Agents who leverage Reverse for Purchase have a meaningful edge in this key market.

MYTH #9 “The regulatory structure makes it risky.”

The guardrails are the point. The modern FHA reverse mortgage, Home Equity Conversion Mortgage, requires independent counseling, comprehensive disclosures and a financial assessment to confirm the loan is a sustainable long-term solution. Today’s regulatory structure creates transparency and borrower protection that should give both originators and clients confidence. Some of the early issues that dogged this product have been systematically addressed and resolved to enhance customer confidence.

MYTH #10 “It’s a one-time transaction.”

LOs who build sustainable reverse businesses treat it as a vertical rather than a product. They develop realtor partnerships built around the 55+ segment, and systematically review their existing client database. Through regular education events and building relationships with financial advisors and estate attorneys, they build a steady pipeline. As Scarpati frames it, offering reverse mortgages simply equips partners with another tool to better serve their clients: “You’re like a sporting goods store that doesn’t sell anything basketball-related — you’re excluding something extremely relevant in the market today.”

Reverse mortgages are best understood as planning tools. When originators can explain them simply and confidently, families engage — and so do the partners who serve those families. The demographic tailwind isn’t slowing down. The originators who build this vertical now won’t be scrambling to catch up later.

Click Here

Paid for by Finance of America.

For business and professional use only. Not for consumer distribution.

Finance of America is a division of Finance of America Reverse LLC which is licensed nationwide | Equal Housing Opportunity | NMLS ID # 2285 (www.nmlsconsumeraccess.org) | 8023 East 63rd Place, Suite 700 | Tulsa, OK 74133 | AZ Mortgage Banker License #0921300 | Licensed by the Department of Financial Protection and Innovation under the California Residential Mortgage Lending Act | Georgia Residential Mortgage Licensee #23647 | Kansas Licensed Mortgage Company | Massachusetts Lender/Broker License MC2285: Finance of America Reverse LLC | Licensed by the N.J. Department of Banking and Insurance | Licensed Mortgage Banker — NYS Department of Financial Services | Rhode Island Licensed Lender | Not all products and options are available in all states | Terms subject to change without notice | For licensing information go to: www.nmlsconsumeraccess.org

The company does not do business as Finance of America in CA, NM, NY, and OK. 

This post was originally published on here

This Week In A Nutshell: Mortgage-rate volatility has moderated as the United States and Iran near a peace agreement, but succession drama at the Federal Reserve may amp up uncertainty once again as Fed chair nominee Kevin Warsh has his confirmation hearing.

Upcoming Attractions


Retail sales data for March will be released on Tuesday. While it provides a key window into the financial health of consumers and is expected to strengthen marginally, the series is noisy and unlikely to move markets much. As usual for the past seven weeks, markets will be most sensitive to the outcome of the peace talks between the U.S. and Iran and any change in the odds that the Strait of Hormuz will open soon. And this week, there is other drama that will be playing out as Fed chair nominee Kevin Warsh has his confirmation hearing before the Senate on Tuesday. He is caught in the middle of a most unusual standoff between the Fed and the White House that threatens to delay his confirmation past May 15th when Jay Powell’s term as chair ends. More on this below.

Last Week’s Highlights


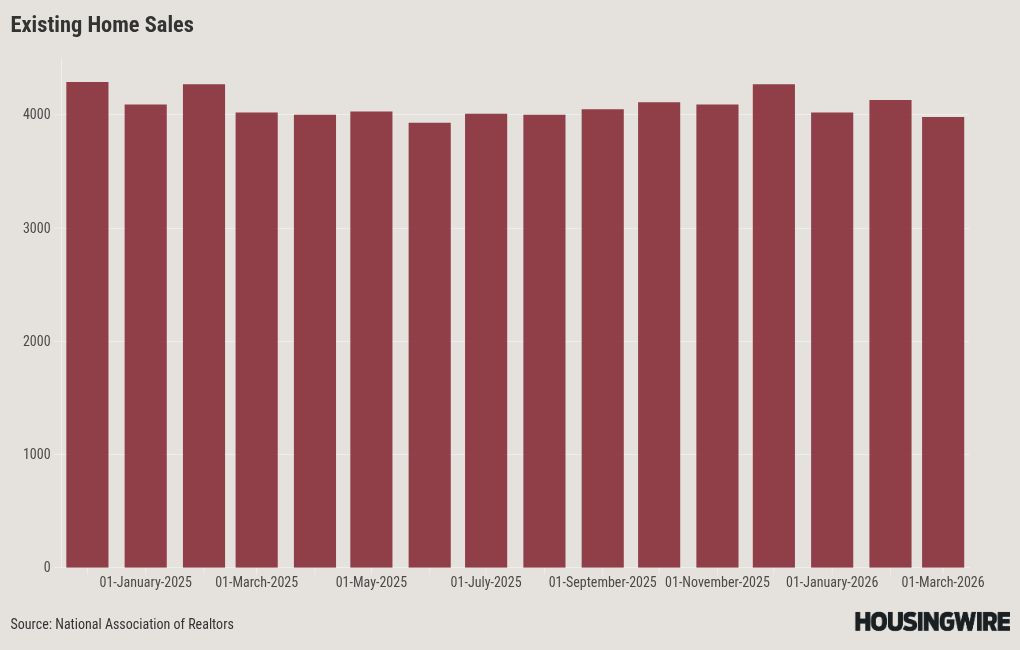
Last week, mortgage rates ended the week slightly lower with the highlight being Friday’s announcement from Iran’s foreign minister that, following a 10-day ceasefire between Israel and Lebanon, the Strait of Hormuz was “completely open”. That turned out to not be completely true as the U.S. continued its blockade over the weekend. In economic data, the producer price index (PPI) came in slightly lower than expected, but overall inflation data for the month points to inflation remaining firm. The Fed’s preferred measure of inflation, core personal consumption expenditures (PCE), is now estimated to show annual inflation of about 3.2% in March, the highest since early 2024. And finally, housing continues to bounce along the bottom as March existing home sales fell 3.6% to an annual rate of 3.98 million.

Diving a Little Deeper


Republican Senator Tillis, who sits on the Senate Banking Committee,  has pledged to block Kevin Warsh’s confirmation for Fed chair until the Department of Justice drops its investigation of current Fed Chair Powell. President Trump has remained resolute so far in saying the investigation should continue. Betting markets now show only a 36% probability that Kevin Warsh will be confirmed before May 15, when Powell’s term ends. What happens if he is not and how will that affect housing?

  • Chair Powell has stated that he would stay on as chair pro tempore, which has past precedent, but in those cases the chair did not face opposition from the president. President Trump has stated that he would fire Powell should he stay on after May 15. The committee that sets the Fed’s policy rate, the Federal Open Market Committee (FOMC), elects its own chair and would likely elect Powell. However, the President could appoint another existing governor on the Board of Governors to be Fed chair. That would be the first time the Fed chair and the FOMC chair were not the same person. Importantly, while the FOMC sets interest rate policy, the Board of Governors actually controls something called interest on reserve balances (IORB), which is how the Fed enacts interest rate policy.
  • Should we enter such uncharted territory, rates might fluctuate because of the uncertainty. However, we are unlikely to see massive swings because (1) the standoff will probably resolve within a few weeks and (2) Kevin Warsh and Jerome Powell are unlikely to be miles apart on interest rate policy to begin with. So whether Warsh enters the picture in May, June, or July will not change the overall picture much for mortgage rates, for which investors are thinking over the long term. This means we might want to get some popcorn ready, but little in the way of tangible consequences for the housing market. This week’s hearings should provide some more clarity into Warsh’s stance on policy rates for the longer term and it will be the first time we have heard from him since he was nominated, prior to the Iran war.

Redfin Housing Market Reports


Late April Is the Best Time to List a Home For Sale

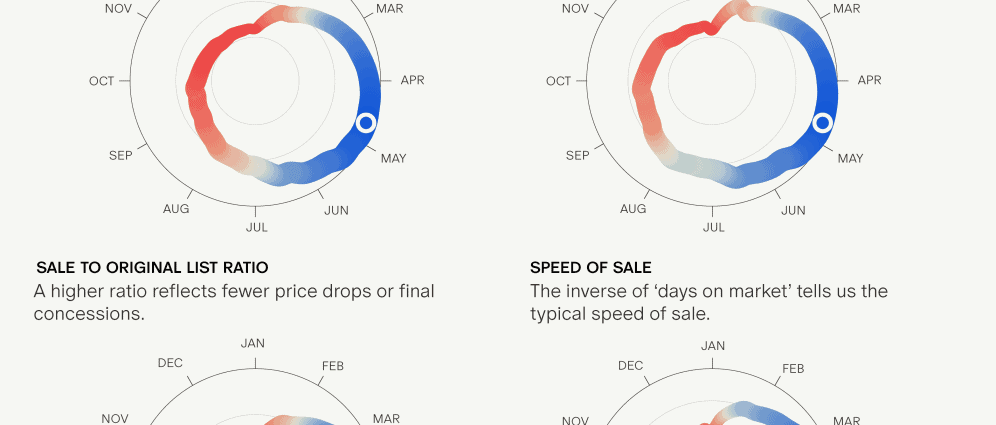
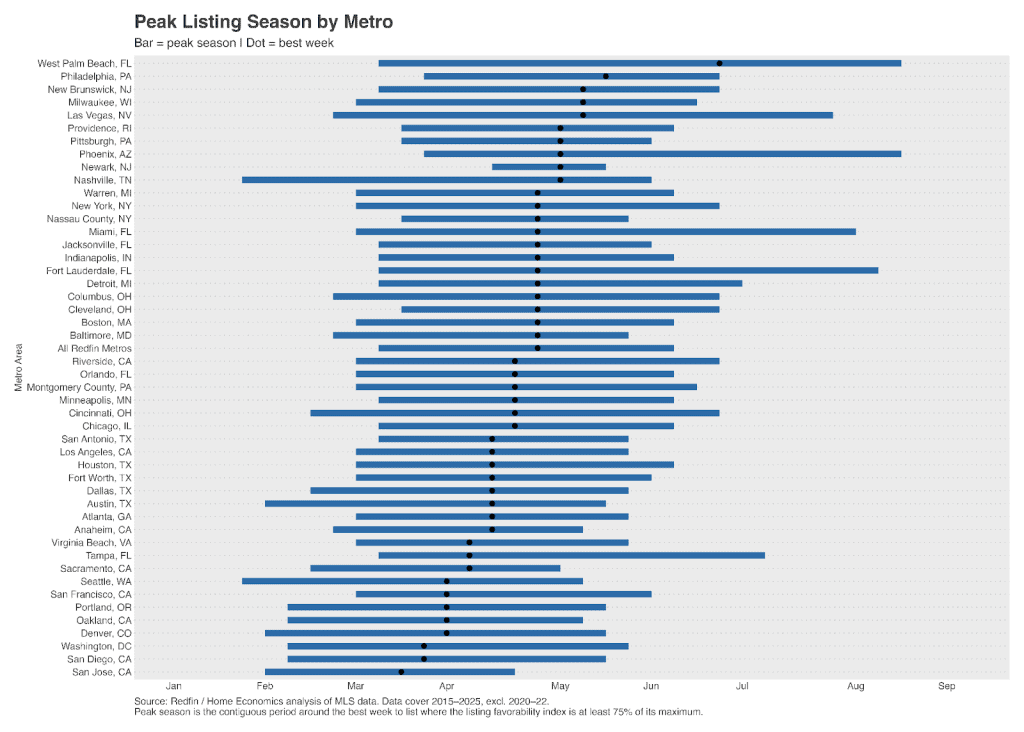
  • Late April is a sweet spot for sellers; nationwide, homes listed during that period have the highest chance of selling fast and fetching more than the asking price. This is from a Redfin and Home Economics analysis.
  • Real estate is local. On the West Coast, March is typically the best time to put a home on the market; on the East Coast, May tends to be best.
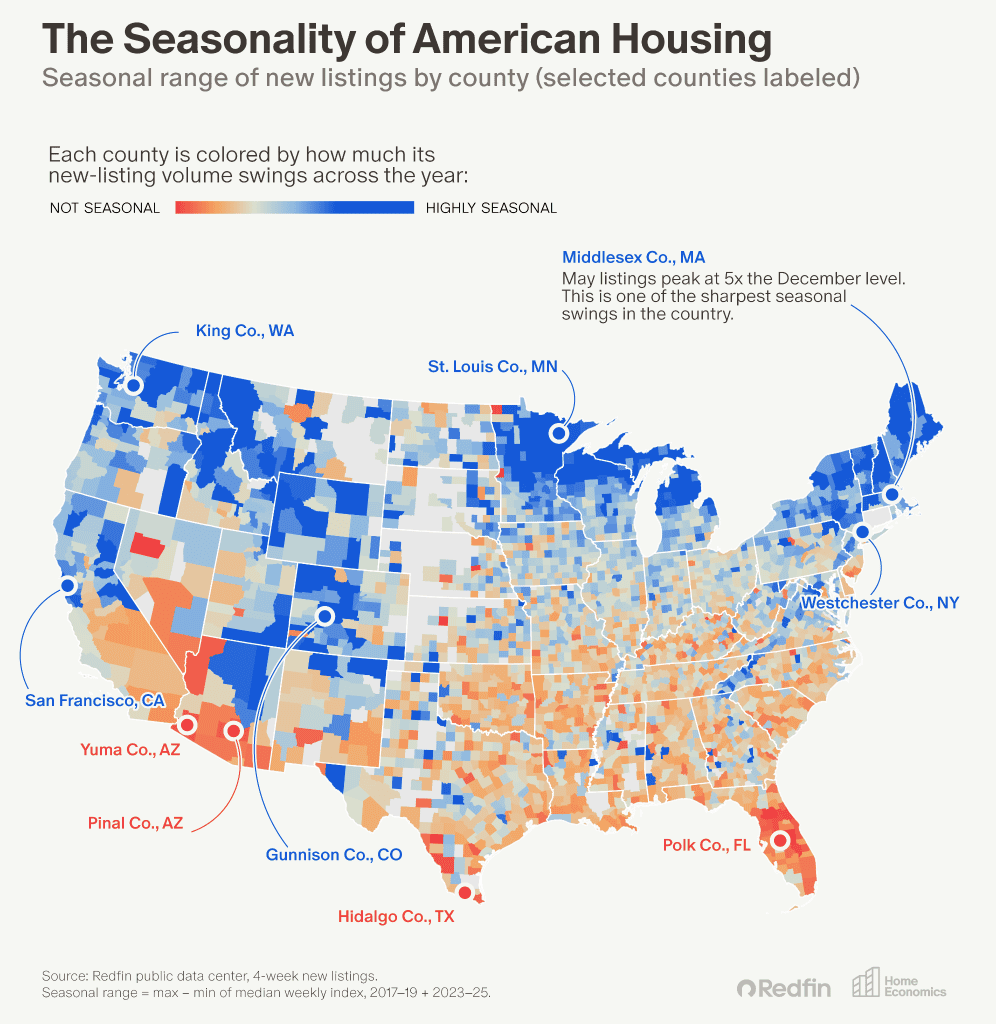
  • The best time to sell varies by region, but the swings are bigger in some parts of the U.S. than others. Places with mild weather and more supply are generally less seasonal. Places with more extreme weather or tight supply are more seasonal. 
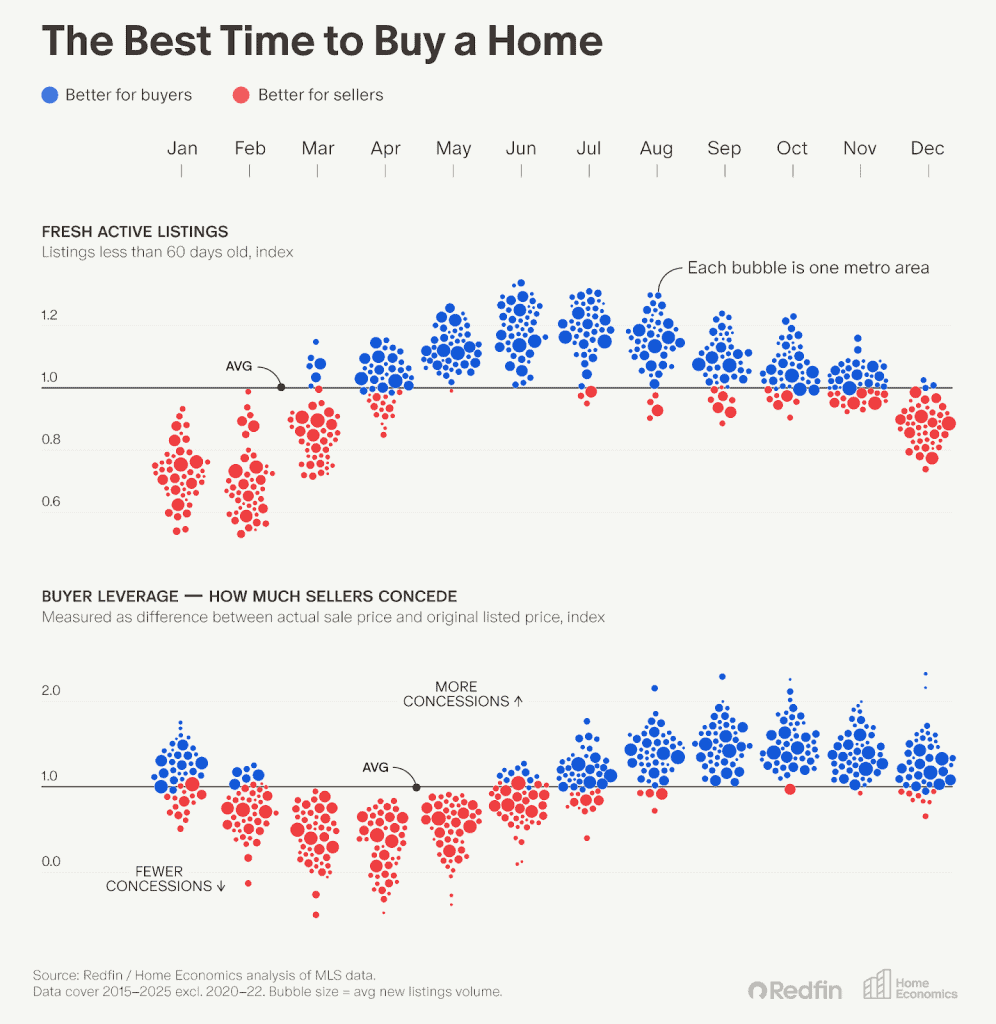
  • The picture is more complex for buyers: House hunters have the most homes to choose from in late April, but they get the best deals in July.

Homebuyers Hold the Negotiating Power In 38 Major Metros, Up From 29 Last Year

  • Nationally, sellers outnumber buyers by 43%—just shy of the largest gap in records dating back to 2013. When sellers outnumber buyers, the buyers who are in the market have bargaining power.
  • 38 of the most populous metro areas were buyer’s markets in March, up from 29 a year earlier. Just five were seller’s markets, down from nine in 2025.
  • Home prices rose 5% across seller’s markets last month, compared with a 2% increase in buyer’s markets.

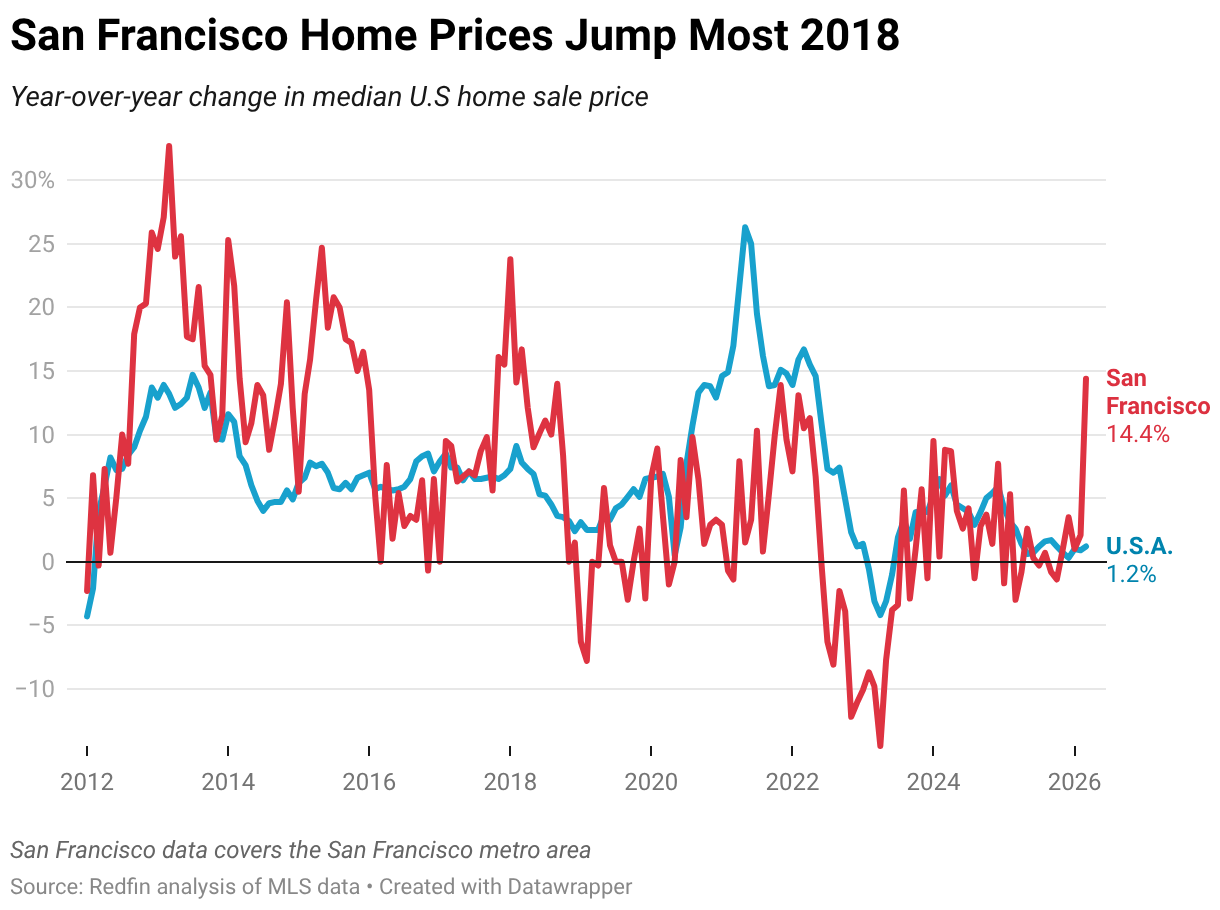
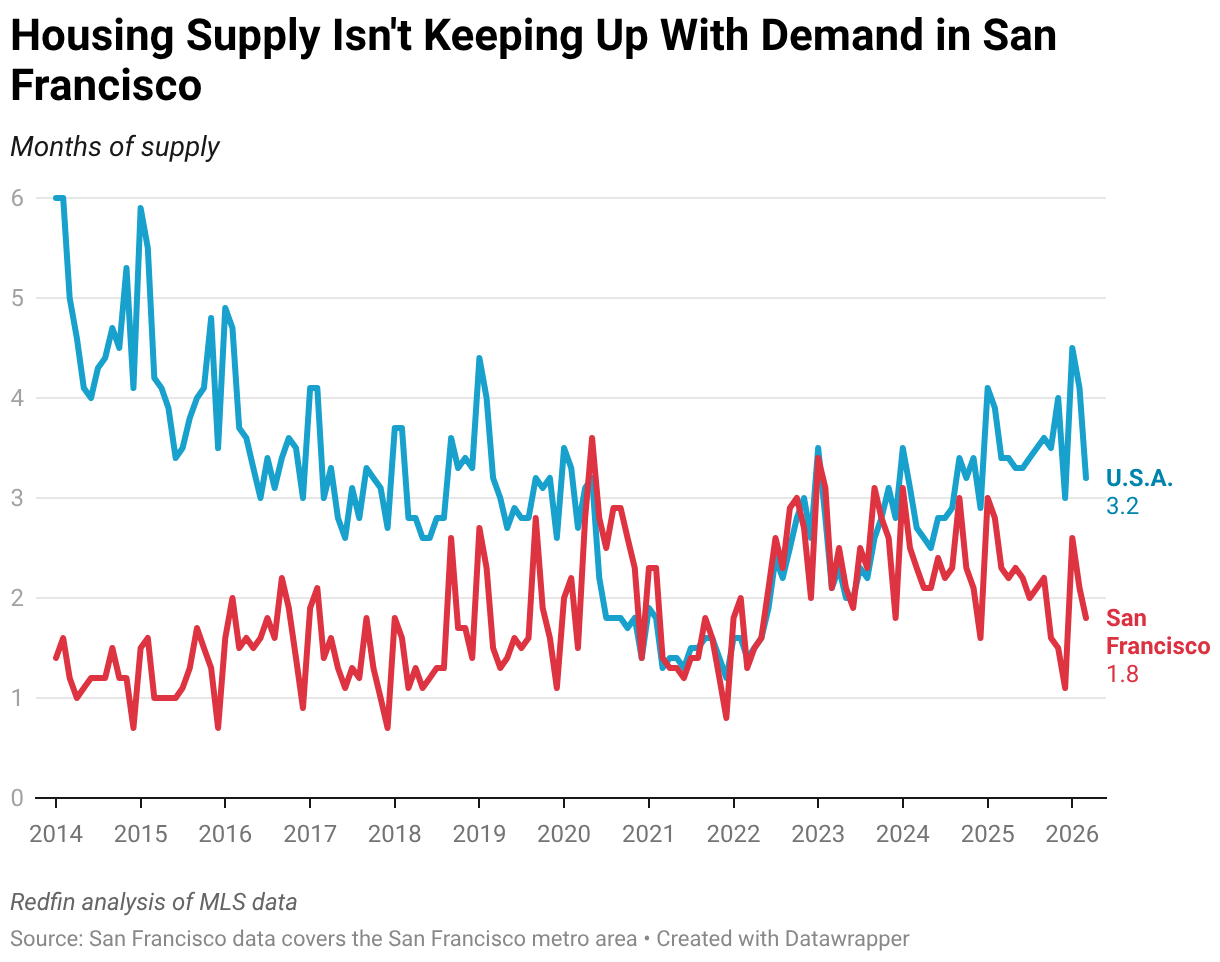
San Francisco Home Prices Jump Most in 8 Years Amid AI Boom

  • The median sale price in the Bay Area metro rose 14% year over year in March, compared with a 1% gain nationwide. That helped San Francisco reclaim its title as the most expensive major metro to buy a home.
  • Nationally, the housing market remained sluggish as high costs and economic uncertainty gave buyers and sellers pause.
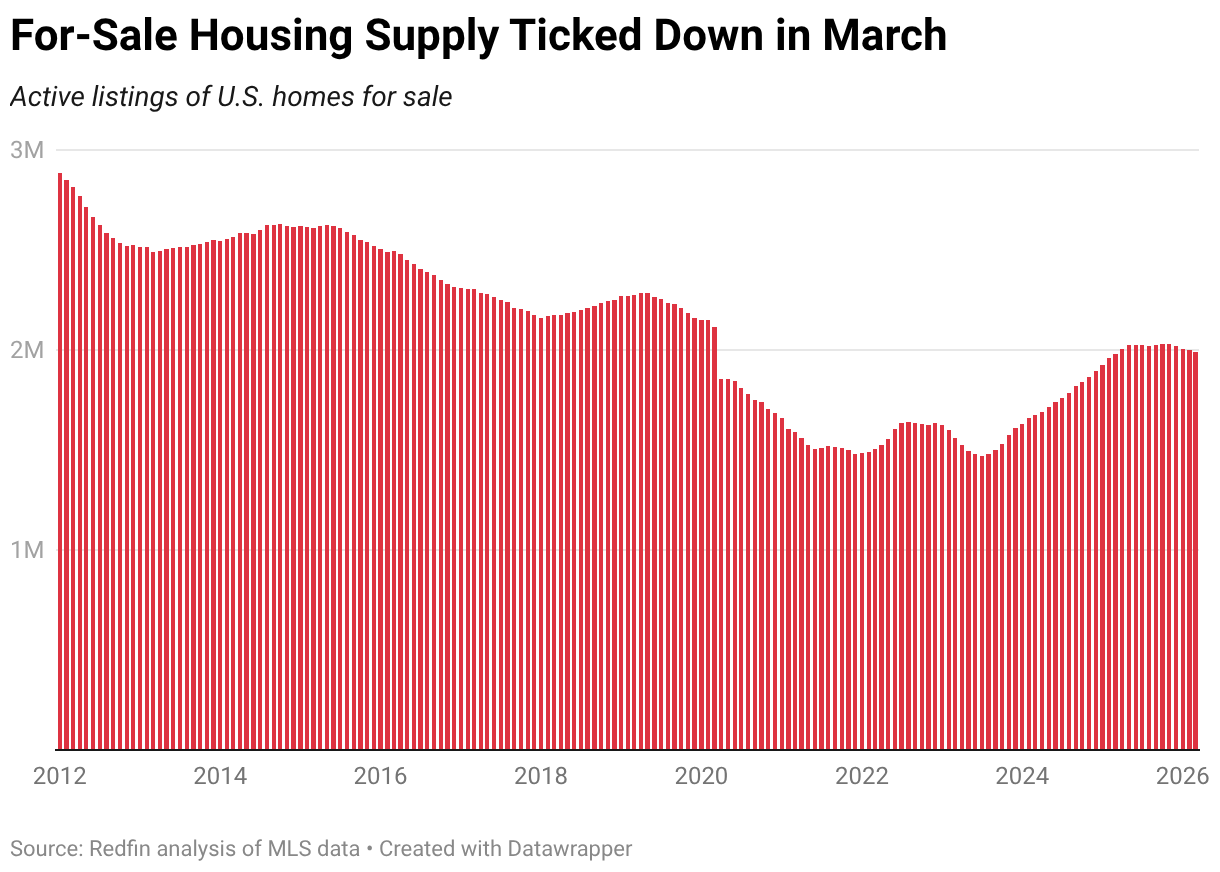
  • Active listings of U.S. homes for sale fell 1% from a month earlier and pending sales barely budged. Homes that did sell moved at the slowest March pace in a decade.

The post Redfin Economists’ Weekly Take: All Eyes on Fed Succession as Mortgage-Rate Swings Ease appeared first on Redfin Real Estate News.

This post was originally published here

A wave of texts and mailers warning that California politicians are targeting retirement savings for taxation has sparked confusion among voters, but experts say the claims mischaracterize a broader fight over competing ballot initiatives.

At issue is a proposed measure called the Retirement and Personal Savings Protection Act, one of several initiatives tied to an emerging political battle over a potential billionaire’s tax in California.

Some Californians recently received messages framed as urgent warnings. One “URGENT” text message reads: “Even though California has some of the highest taxes in the country, Sacramento politicians and special interests are still pushing to pass new taxes on retirement and savings accounts,” the San Francisco Chronicle reported.

Despite the alarm, state tax policy experts say California has not attempted to broadly tax retirement account balances or savings assets for residents.

Instead, the messaging is reportedly tied to a campaign over proposed constitutional changes that would shape what kinds of taxes the state could impose in the future.

Proposed retirement-related legislation is one of multiple competing initiatives backed in part by the political action committee Building a Better California. The group is also linked to efforts that could affect a separate proposal known as the billionaire’s tax.

The retirement measure would bar the state from imposing new taxes on the “ownership or control” of personal property — including financial assets, business interests, digital assets, intellectual property, and tangible property such as boats or aircraft. But it would not block taxes on real estate or on income generated from assets, such as wages, pensions, dividends or capital gains.

California ranked No. 8 on a list of states with the strongest retirement savings and home equity levels, according to 2022 U.S. Census Bureau data adjusted to December 2024 dollars.

A typical California household has a median net worth of $295,838 and median retirement savings of $96,131, the data shows. Its median deposit account balance stands at $17,046, and 62.1% of households have a net worth of $100,000 or more.

Billionaire’s tax debate

The retirement tax initiative is closely tied to opposition against a separate proposal that would impose a one-time tax on Californians with a net worth exceeding $1 billion.

That proposal — backed by the Service Employees International Union–United Healthcare Workers West — would apply a 5% tax on qualifying high-value assets.

While framed as targeting the ultra-wealthy, critics say the competing measures are designed to neutralize each other politically.

Darien Shanske, a law professor at the University of California at Davis, described the initiatives as “revengements,” or revenge amendments.

“They are all deceptive,” he told the Chronicle. “People who vote for the billionaire tax might not realize they could frustrate that vote by also voting for one or more of the revengements.”

Building a Better California has raised significant funding from prominent tech and finance figures, the Chronicle report — including Google co-founder Sergey Brin, Kleiner Perkins Chairman John Doerr, Stripe CEO Patrick Collison, venture capitalist Michael Moritz, Doordash CEO Tony Xu, Affirm CEO Maksim Levchin, Ripple executive chairman Chris Larsen and former Google CEO Eric Schmidt.

A spokeswoman told local reporters the organization is working on “long-term policy reforms that will improve government accountability, protect the state’s jobs and economic engine and prioritize affordability and a better quality of life for Californians.”

What comes next?

Two additional initiatives backed by the group could affect how tax revenue is allocated and overseen.

One would require stricter auditing and transparency for special taxes, while another could redirect or constrain how some new taxes are used under existing school funding and state spending rules.

Supporters say these measures increase accountability. Critics argue they could limit voter-approved tax policies.

“A few billionaires are spending tens of millions to deny Californians the opportunity to save their local hospitals and ERs — but so far, those billionaires are failing,” said Suzanne Jimenez, chief of staff for the union backing the billionaire’s tax.

Both sides are currently gathering signatures to qualify competing measures for the November ballot.

If approved by voters, conflicting provisions would be resolved in favor of whichever measure receives more “yes” votes.

This article was written by Jonathan Delozier and generated with the assistance of HousingWire Automation. It was reviewed by a HousingWire editor before publication. The system helps convert company announcements and industry data into HousingWire-style news coverage.

This post was originally published on here

Selling season 2026 – long on uncertainty and short on Spring mojo – is keeping many private homebuilders up at night and on edge all day long.

The challenge is no longer just about generating traffic to homebuilder websites and new neighborhood sales centers, converting buyers, or managing incentives.

It also concerns whether the business is prepared to react quickly and adapt effectively to conditions that change – frequently and fast. So much rests on whether leaders can see what’s happening in real time, reduce costs without causing chaos, and keep operations moving smoothly without overwhelming teams with workarounds.

In this light, Tennessee-based Parkside Builders’ recent digital transformation stands out as more than a software investment and cutover story.

More importantly, Parkside Builders’ pivot is an operations story in which the team’s imperative is to build resilience in the moment it’s being tested on the ground, as we speak. It is a case about what private builders need to consider and act on, when the market remains full of uncertainty, demand is choppy, and the margin for waste – in time, labor, communication, and decision-making – keeps vanishing.

The operational pivot

Parkside’s shift to Constellation HomeBuilder Systems’ BuildTopia platform followed years of using an à la carte software setup in which construction operations and accounting were not fully integrated. 

In the Parkside case, company business leaders state their goal of unifying construction and accounting, removing manual data entry, decreasing errors, and providing teams with real-time insights into budgets, approvals, and job performance.

The platform linked BuildTopia with Microsoft Dynamics 365 Business Central, while also adding field mobility through BuilderGo and trade-focused features via TradeTopia. 

For Amanda Davenport, Parkside’s Director of Finance, the old system had become harder to justify.

“It was still very manual, especially on the accounting side, which wasn’t great,” she said, describing the company’s years working with BuilderMT on operations while finance used separate systems. 

That friction amounted to more than a matter of annoyance, extra work, and tedium; it was costly to operate.

As Davenport explained, accounting often required accessing another system, manually pulling data, and trying to keep everything aligned. The result was not just extra work but missing information, weak visibility, and a growing sense that the company was carrying too much hidden strain. 

“Things would just disappear sometimes,” she said. “I was just following the instructions I was given, and I started missing purchase orders, which was driving us crazy.”

Parkside’s Davenport mentioned that purchase orders, budgets, and sales data did not flow automatically between construction and accounting, requiring manual updates and making it harder to spot problems early. As Parkside grew, she noted, “scaling the business started to feel risky.”

That’s where Parkside Builders’ strategic and operational leaders drew the line.

Operationalizing agility

For a private builder, especially in a market where sales pace is inconsistent and leaders must stay opportunistic on expenses, pricing, starts, and production velocity, disconnected systems create more than inconvenience. They can become a direct threat to nimbleness. If accounting lacks visibility into cash demands, if field scheduling lags reality, if approvals happen in batches rather than in flow, and if teams depend on email and memory to solve problems, then management’s ability to react is dulled at exactly the moment when sharper reactions are needed.

In Parkside’s case, the force factor – and deadline – for change was BuilderMT’s impending sunset.

“In today’s market, disconnected systems slow decision-making at exactly the wrong time,” said Sean Wilhelm, Vice President – Business Solutions at Constellation HomeBuilder Systems. “Builders need real-time operational and financial clarity to stay nimble when conditions change fast.”

Davenport said Parkside had seen the change coming. “Our accounting software kept saying that they would stop supporting BuilderMT,” she recalled. “I kept telling the operations team about this because I felt it was inevitable.”

Change management 101

But like many builders, Parkside also had to navigate the human side of change.

“They weren’t eager to switch because, even though it was clunky on my side, all plans and details were set up in the current purchasing/operating system, making it feel overwhelming to start over with how we do things.”

Eventually, though, the decision practically made itself.

“They announced they’d sunset BuilderMT, and that forced our hand,” Davenport said. “It forced our operations team to say, ‘Okay, here we go.’”

What followed was not a simplistic rip-and-replace exercise.

Parkside had already implemented Microsoft Dynamics NAV for accounting and did not want to change accounting systems again. Davenport said the company weighed three alternatives and eliminated one because it would have required another accounting change, and ultimately chose to upgrade NAV to Dynamics 365 Business Central and pair it with BuildTopia.

“We decided to upgrade NAV to what is now Business Central and go with BuildTopia,” she said. “We knew links had to be created because they weren’t there.”

The transition period was important because it’s when many implementations either gain or lose confidence. Parkside had to keep operating while rebuilding templates, redesigning workflows, and waiting for the integration link to work properly. For a while, data still needed to be exported from BuildTopia and imported manually. But when the connection finally worked as intended, Davenport said, “everything fell into place. It was incredible.” 

Her standard for success was practical, operational, and meaningful in terms of both business and financial KPI.

“I didn’t want to change accounting systems, but I needed the link between the two software systems to be better than the old one,” she said.

The biggest need was visibility. Under the prior arrangement, Parkside processed purchase orders in weekly batches, leaving accounting in the dark about near-term cash requirements.

“I had no idea about cash flow or what’s coming next,” Davenport said. “I didn’t know if the next check run would be 100,000 dollars or a million. I literally had no clue, no visibility, no foresight.”

That is precisely the kind of blind spot private builders cannot afford in a sluggish, iffy, incentive-driven sales environment. If leadership is unaware of what is coming, then the business stays stuck in a reactive mode.

“When leaders can’t see what’s coming next, the business is forced into reactive mode,” Sean Wilhelm said. “Integrated platforms give private builders the visibility they need to plan ahead, protect margins, and respond with confidence.”

End-to-end build-cycle management

Parkside also needed to improve scheduling discipline in the field. Davenport explained that the old system required builders to return to a computer to update schedules, which could cause the gap between field reality and system data to persist for a week or more. With BuildTopia and mobile access, those updates can now happen instantly. The effect, she said, is becoming evident in cycle time. 

“We’re now making huge strides,” Davenport said, adding that Parkside is seeing “cycle times cut by 10, 20, even 30 days.”

She was careful not to credit the software alone, but she emphasized a broader point that matters just as much: the system helps teams spend less time fighting with cumbersome processes and more time communicating, planning, and staying ahead.

That same benefit has appeared in accounting and payables. Parkside’s case study states that BuildTopia decreased manual accounting tasks by shifting the team from constantly monitoring data flow to intervening only when necessary. Davenport noted that one unexpected advantage came from the vendor experience itself.

“One of the benefits we didn’t expect was that vendors now have a portal, which reduced the emails we received about payments and POs,” she said. Instead of acting as intermediaries, payables can now direct vendors to the portal, where they can see purchase orders, invoices, and payment status on their own.

A separate time savings came from the real-time integration between BuildTopia and Microsoft Dynamics 365 Business Central. With purchase orders now pushed automatically when created and again upon approval, Davenport no longer has to manage a manual weekly upload process.

“That change saved me about two hours a week,” she said, noting that it eliminated the need to manually push POs late at night after hours.

The greater benefit, however, may be accountability.

Davenport said the new system is guiding Parkside toward a more disciplined, transparent workflow where people can see when a handoff hasn’t occurred and where responsibility lies.

“Now the process flows where everyone has to stay on point, stay on task, and that helps everyone do their job,” she said. She also noted that customer-care staff can now answer their own questions by checking contracts and stage status directly, instead of chasing answers across departments. “They are autonomous, able to handle everything on their own, and they’re not waiting on anyone else.” 

That is the main lesson for other private builders.

The return on nimbleness

In a volatile market, operational excellence isn’t just a nice-to-have – it’s essential. It offers time, visibility, and control. It reduces inefficiencies that accumulate when teams depend on spreadsheets, email chains, and weekly guesswork. It gives leaders a better chance to protect margins and keep their organizations prepared for growth when the sales environment improves.

“Operational excellence isn’t about adding complexity,” added Sean Wilhelm. “It’s about removing friction so teams can move faster, stay accountable, and be ready when the market turns.”

Davenport’s closing advice is worth taking seriously because it comes from someone who has lived through multiple implementations. Builders get comfortable, she said, and comfort can hide possibility.

“It’s hard to see what you’re missing or what’s possible,” she said. But if a company is willing to invest the time to examine a better way of working, “you can make a proper comparison of what it could do for your company.”

Her conclusion is just as straightforward as it is relevant right now:

“You could just rip the band-aid off, overcome the hurdle, and create a whole new world for your business.”

This post was originally published on here

Brad Jacobs’ vaunted, capital treasure-trove-fueled sprint to geographic and marketshare clout, enough to disrupt the nation’s building products and materials supply infrastructure, took another big leap this weekend, with a $17 billion deal to acquire TopBuild, a giant among homebuilder-favored distribution players.

During an investor presentation held on Sunday, Jacobs, Chairman and CEO at QXO, framed the deal as a “game changer” for QXO and its shareholders. 

As Jacobs explained, the deal, expected to close by the end of Q3 2026, will significantly expand QXO’s product offerings and value-added opportunities.

It will position the company as a leader in several key building products categories and expand the operator’s geographic footprint, laying the groundwork for bringing transformative new business and logistics efficiencies to the nation’s construction landscape, according to Jacobs. 

Once the deal closes, QXO will have an addressable market share of more than $300 billion and an enterprise value of about $50 billion, according to an announcement. Jacobs praised TopBuild’s strong operational execution, but also laid out a plan to grow the company’s revenue and profitability further through additional efficiencies. 

The announcement came less than three weeks after QXO closed on a $2.25 billion deal to acquire Kodiak Building Partners. Earlier this year, QXO stated its intentions to complete at least one acquisition in 2026 after it announced funding rounds that raised $3 billion in acquisition funds. TopBuild will be QXO’s third and largest acquisition since its founding.

But TopBuild likely won’t be its last. 

Why the TopBuild acquisition makes strategic sense

TopBuild is a publicly-traded installer and distributor of insulation and related products such as gutters, garage doors, fireproofing and commercial roofing systems. QXO specializes in residential and commercial roofing, siding, waterproofing products and other materials like lumber, trusses and gypsum.

Once the two companies join forces, QXO will be a leader in several key building product categories, including insulation, lumber and building materials, waterproofing and roofing. 

“This is the natural next step as we build out our multi-category platform, strengthening our position to compound growth through organic growth and additional consolidation over time,” Jacobs said. 

Jacobs pointed to some other key reasons why QXO was attracted to TopBuild. One of them is diversification. Once the deal closes, QXO’s combined business will be diversified across residential, industrial and commercial markets, with an equal share of new construction and repair/remodeling projects. 

“TopBuild benefits from exposure to fast-growing commercial and industrial end markets, including data centers and other energy-efficient, infrastructure-related projects that require complex, integrated building solutions,” Jacobs explained. 

TopBuild also brings an experienced team that will integrate well with QXO’s business. Once the deal closes, QXO will have about 28,000 employees, a fleet size of more than 10,000 vehicles and 1,150 locations in all 50 U.S. states and seven Canadian provinces. This represents a rapid expansion, as QXO had roughly 8,000 employees at the end of last year and a full-time staff of only about 200 in 2024. 

Jacobs also praised TopBuild’s integrated model that emphasizes job site proximity and a capital-light approach. Additionally, he pointed to TopBuild’s operational execution, as the company has industry-leading EBITDA margins of about 18%. QXO and TopBuild joining forces will create an even higher-margin and more resilient operator with a wide variety of value-added offerings on a national scale, Jacobs said. 

“It makes things much easier for national builders and large regional customers, enabling more consistent service, broader product availability and coordinated execution across multiple geographies and end markets,” Jacobs said. “The combination enhances value for local contractors through improved access to products, services and support, while maintaining the local relationships and execution model that drive day-to-day performance.”

“It also strengthens supplier relationships by increasing volume, visibility and predictability, supporting joint planning, innovation and long-term partnerships with critical vendors. And it positions the combined platform as a preferred channel for complex, multi-product projects, including commercial, industrial and infrastructure applications that require integrated solutions,” Jacobs added. 

How the deal aligns with QXO’s growth strategy

Billionaire entrepreneur Brad Jacobs founded QXO in 2023 with the stated intention of building the company into a $50 billion revenue operator by about 2030 to 2035. QXO plans to grow partially through acquisitions, which include the 2025 $11 billion acquisition of Beacon Roofing Supply and the recent Kodiak Building Partners deal

According to Jacobs, the TopBuild acquisition puts QXO “squarely on the path to building a $50 billion revenue market leader within the next decade.”

However, this expansion won’t be paved through acquisitions alone. Organic growth is another key lever. 

Jacobs made his fortune using a tested growth blueprint in his other companies, such as XPO Logistics, United Rentals and United Waste. Replicating a playbook in the fragmented building materials and products sector that worked well for Jacobs in other industries, like logistics and equipment rentals, is foundational to QXO’s vision. 

QXO’s technology-led strategy centers on acquiring traditional distributors and integrating them into a unified AI-powered platform. The company intends to use this platform to improve efficiency and expand margins, aiming to double the revenue of acquired businesses within three to five years.

Jacobs spoke briefly on how QXO plans to make TopBuild even more efficient and profitable. TopBuild reported about $5.41 billion in revenue in 2025, and executives targeted $9 billion to $10 billion of revenue by 2030 during a recent investor day in December. This growth trajectory roughly aligns with QXO’s vision of doubling revenues within five years. 

“Operational improvements will come from procurement, scale, organizational alignment, field-level operational excellence and network optimization. These improvements reliably buy down acquisition multiples over time, reducing execution risk,” Jacobs explained.

Jacobs also previously discussed how he plans to make Beacon Roofing Products more efficient. These efforts involve establishing a national call center for inactive accounts, increasing cross-selling potential, deploying digital tools to curb price overrides, and implementing a unified ERP system companywide.

What the deal signals about M&A activity in building materials

QXO’s aggressive expansion push signals that the highly fragmented $800 billion building products distribution industry could undergo increasing consolidation in the years ahead. This would mirror M&A activity in homebuilding, as large public operators increasingly scoop up regional, private homebuilders. 

The Webb Analytics 2025 Deals Report reports that 2025 was the busiest year for M&A activity in the building materials industry over the past decade, based on the number of facilities acquired.

The total number of deals declined by 30% in 2025, and fewer companies completed acquisitions. However, last year also marked a rise in megadeals, as four of the 120 reported deals represented 85% of all supply facilities acquired in 2025. 

This indicates that the industry’s largest operators, like Lowe’s, The Home Depot, QXO and Builders FirstSource, could increasingly dominate M&A in the industry and wrest more market share from smaller competitors. 

This post was originally published on here

If you want to understand the DNA of the modern American homebuilding industry, you don’t start in a boardroom or on Wall Street.

You start in the aftermath of World War II.

The men (and they were almost entirely men at the time) who came home from that war didn’t just return with discipline and grit. They returned with something far more valuable: a working knowledge of logistics at scale, systems thinking, supply chain coordination, and the ability to execute under pressure.

They had seen complexity. More importantly, they had learned to simplify it.

For a developer today, that generation isn’t just historically important; they are the greatest generation of homebuilders because they created the operating system we still run on.

They industrialized housing

Before the war, homebuilding was largely artisanal, fragmented, local and inefficient. A builder constructed a handful of homes at a time, often using inconsistent methods and little standardization.

What William Levitt and Levitt & Sons did in the late 1940s fundamentally rewrote that model.

Levitt, drawing directly on his experience as a Navy Seabee, applied assembly-line thinking to housing. At Levittown, crews didn’t build one house at a time; they performed specialized tasks across many homes in sequence. One team poured slabs. Another framed. Another installed windows.

It was Ford’s Model T, translated into shelter.

The result? Over 17,000 homes built in just a few years. Costs dropped. Speed increased. Quality became more consistent. For the first time, homeownership became accessible at scale.

Every production builder today, whether they admit it or not, is running a version of Levitt’s system.

They matched product to a moment

Timing wasn’t luck; it was strategy. The GI Bill unleashed unprecedented demand. Millions of returning veterans needed homes, and they needed them fast and affordably. Given the beating our boys took to win the war, a 1,250-square-foot, three-bedroom, two-bath was a mansion in paradise compared with their time on a place like Iwo Jima.

The demand was both numerical and emotional.

Builders like Ed Ryan of Ryan Homes, a former Army Air Corps navigator and POW, understood this intuitively. So did Donald Kaufman, a decorated infantry veteran who co-founded Kaufman & Broad. They didn’t chase luxury. They didn’t overcomplicate the product. They built what the market demanded: efficient, affordable, repeatable homes in emerging suburban corridors.

Even those who weren’t veterans, such as William Pulte, showed the same instinct. At just 18, Pulte recognized the wave forming and positioned himself to ride it. The lesson is simple but often ignored today: great developers don’t just build well; they build what the moment requires.

They mastered land as a strategic moat

If you study this generation closely, a pattern emerges: they weren’t just builders but land strategists.

Leonard Miller of Lennar began with 42 lots and a $10,000 investment. That wasn’t just a humble start; it was a calculated foothold. Control the land, control the pipeline. Control the pipeline, control your destiny.

Ray Ellison in San Antonio followed a similar trajectory, growing from a two-man operation into one of the largest single-family producers in Texas. The scale didn’t come from construction alone; it came from disciplined land acquisition and a relentless focus on growth corridors.

Even regional players like O.N. Mitchell Sr. of HistoryMaker Homes understood this. Build where demand is headed, not where it’s been. That principle built Dallas, Houston, Phoenix, and every other major Sunbelt market we operate in today.

They innovated relentlessly

Innovation for this generation wasn’t about buzzwords; it was about efficiency.

In Dallas, Ira “Ike” Jacobs and David Fox pioneered slab foundations, central air conditioning, and production-line floor plans. These weren’t flashy ideas; they were pragmatic solutions that reduced costs, increased speed, and improved livability.

Similarly, Alvin Homes in Cleveland scaled to 1,000 homes per year by the mid-1950s by standardizing its product and refining operations. They didn’t reinvent the wheel; they made it roll faster and cheaper.

Compare that to today, when “innovation” can sometimes drift into overdesign or unnecessary complexity. The post-war builders remind us that the best ideas are the ones that work at scale.

They built companies, not just projects

One of the most overlooked aspects of this generation is its focus on building enduring platforms. U.S. Home Corp., founded in 1954, didn’t just dominate New Jersey – it became a national force. Ryan Homes evolved into NVR, now one of the country’s largest builders. Lennar grew from a small Miami operation into a publicly traded giant. These weren’t one-off successes. They were systems designed to replicate, expand, and endure.

For a developer, that distinction matters. Anyone can get a good deal. The question is whether you can turn that deal into a repeatable business. This generation answered that question decisively.

They understood simplicity scales

There’s a temptation in modern development to overcomplicate and chase differentiation for its own sake. The post-war builders took the opposite approach.

They simplified everything:

  • Floor plans were repeatable.
  • Materials were standardized.
  • Processes were systematized.

That simplicity enabled them to scale from dozens of homes to thousands per year. It also made their product accessible. A Levittown home wasn’t custom, but it was attainable. Ultimately, accessibility drives volume.

They balanced vision with execution

It’s easy to romanticize this era, but their success wasn’t inevitable. These builders operated in a volatile, rapidly changing environment. Financing structures were evolving, and infrastructure had to be built. Entire suburbs had to be imagined from scratch.

Donald Borror of Dominion Homes in Columbus, Ohio, began building modest, affordable homes as the city expanded outward. The city wasn’t yet the national powerhouse it would become, but it had all the right ingredients: job growth, available land, and a wave of families, many tied to the broader post-war migration seeking attainable homeownership. He saw the future and bought land.

What set them apart was their ability to execute on vision. They didn’t just see opportunity, they moved on it with speed and precision. They aligned land, capital, labor, and product into a cohesive system. That alignment is still the hardest part of development today.

Why they still matter

For a modern developer, the relevance of this generation isn’t academic, it’s practical.

  • 1945 Long Island, New York – William Levitt → Levitt & Sons / Levittown
  • 1945 Cleveland, Ohio – Alvin A. Siegal (WWII Army vet) & Carl Milstein → Alvin Homes
  • 1946 Fort Worth, Texas – O.N. Mitchell Sr. → HistoryMaker Homes (family roots)
  • 1947 Dallas, Texas – Ira Jacobs (Army veteran) & David Fox → Fox & Jacobs
  • 1948 – Pittsburgh, Pennsylvania – Edward Ryan (Army Air Corps, WWII POW) → Ryan Homes
  • 1949 – San Antonio, Texas – Ray Ellison Sr. → Rayco / Ray Ellison Homes
  • 1950 (formalized 1956) – Detroit, Michigan – William J. Pulte → Pulte Homes
  • 1952 – Columbus, Ohio – Donald Borror → Dominion Homes (origins)
  • 1954 – New Jersey – Robert H. Winnerman → U.S. Home Corp.
  • 1954 – Miami – Gene Fisher & Arnold Rosen → F&R Builders (predecessor to Lennar)
  • 1956 – Miami – Leonard M. Miller (joins, later leads) → Lennar (renamed 1971)
  • 1957 – Detroit – Don Kaufman (WWII vet) & Eli Broad → Kaufman & Broad (KB Home)

We operate in a different world now. Regulations are tighter, land is scarcer, and costs are higher. But the core challenges haven’t changed:

  • How do you deliver housing affordably?
  • How do you scale efficiently?
  • How do you align product with demand?

The post-war builders answered these questions under arguably more constrained conditions. They lacked advanced software, global supply chains, or institutional capital. What they had was clarity of purpose and operational discipline.

And they executed.

The playbook endures

If you distill their approach, the playbook looks like this:

  • Standardize what you can.
  • Control your land pipeline.
  • Build for the largest addressable market.
  • Innovate only where it improves efficiency or affordability.
  • Scale through systems, not heroics.

It’s not glamorous. But it works.

A personal perspective

From my perspective as a developer, this generation represents something rare: a convergence of necessity, ingenuity, and execution. They weren’t chasing trends. They were solving a problem at a national scale by housing millions of Americans. And they did it with a level of efficiency and clarity that still hasn’t been matched.

They built more than homes. They built a framework for thinking about development. Every time we underwrite a deal, plan a community, or assess product-market fit, we’re operating within a system they created.

That’s why they are the greatest generation of homebuilders. Not because they were first – but because they were foundational.

What stays with me is the rare gift of proximity to that generation and the DNA that came with it. Growing up in Dallas, I saw it take physical shape as communities like The Colony rose from nothing into something enduring. Early in my career in San Antonio, working as a young land guy at KB Home after the Rayco acquisition, I learned how scale was engineered. How land, product and process come together under disciplined leadership.

Later, serving on the SWAT team with STORM Consulting and as an SME in Columbus during the Dominion Homes restructuring, I saw the inner workings from another angle: how great builders adapt, correct and rebuild to keep the machine running.

Across each chapter, it wasn’t just experience; it was exposure to the same foundational mindset. That’s the real inheritance from the greatest generation of homebuilders: a way of thinking that turns ambition into systems and systems into lasting scale.

This post was originally published on here

While national brands dominate real estate headlines, an independent brokerage based in Pennsylvania’s chocolate capital has quietly posted one of the industry’s strongest five-year growth runs.

Iron Valley Real Estate — now rebranding as IVRE — placed No. 10 nationally for five-year volume growth and No. 3 for five-year transaction side growth on RealTrends Verified’s 2026 brokerage rankings.

The firm reported $3.97 billion in 2025 volume and 12,347 sides from its headquarters in Hershey. It added $1.99 billion in volume and 4,315 transaction sides over the past five years.

Rob Cleapor, CEO of Iron Valley, sat down with HousingWire to detail factors in his company’s impressive showing.

“It was never about agent count for us,” he said. “It was about impact and market share in the markets that we are in. It’s impact on the community. It’s having brick and mortar and establishing our roots in those communities and being able to take real market share.”

Cleapor said the brokerage’s low-overhead structure has been critical.

“That’s been probably one of the keys to our success, especially with everything that’s been going on, and the last three years being a very difficult time for real estate.

“We’ve been bringing on a lot of agents that do volume because they started to look at their bottom line and started to look at what we had to offer. We’re giving the same kind of support that they’re getting from some of these other brokerages, but we’re giving them better splits.”

Steve Murray, senior advisor for HousingWire and founder of RealTrends and RTC Consulting, said Iron Valley’s model fits a broader trend.

“Iron Valley has been coming on strong for years out of central Pennsylvania,” he said. “It’s like (Samson Properties and LPT Realty); a low-cost model. Around 75% of Realtors don’t make a full time living. So, these companies appeal to people who want to go to the lowest cost place to do their business, and that’s why many of these companies have been growing faster in the market as a whole.”

Independent brokerages, in general, accounted for 28.79% of market share in this year’s rankings — up from 26.98% last year.

Finding your lane

Cleapor said independence requires flexibility in an industry climate marked by consolidation and technological advancement.

The company recently began rebranding from Iron Valley Real Estate to IVRE as it expands beyond Pennsylvania into markets like Florida and California.

“Iron Valley as a name doesn’t really resonate in all parts of the country,” said Cleapor. “So, we made the decision to be flexible enough to understand that our name might be a hindrance in some areas.”

He specified that existing Iron Valley affiliates will retain the choice to keep current branding or switch to IVRE — but newly added businesses will come on under the IVRE banner.

Cleapor’s advice to other independents navigating sweeping industry consolidation is straightforward.

“Stay consistent and find your lane,” he said. “There’s no such thing as one brokerage for every agent because every agent has different needs, different wants, a different style of business and a different path to success. The beauty of having a bunch of independent brokerages is all these agents can find their home.”

Murray said the challenge for large national brands is structural, when considering current areas of success for independents like Iron Valley.

“The challenge to the big national guys — Anywhere, Berkshire, Compass — because of their full-service approach with a lot of sales offices and all the overhead, is they’ve got to retain a higher percentage,” he said. “They’ve got to hold on to more of the commission dollar than the Iron Valleys or the Samsons or the LPTs.

“It’s kind of like a Nordstrom versus Walmart battle. The big difference between real estate and regular retail is the agents are mobile. They can pack up and take their practice anywhere else they want to. The national average over time has been 20% to 22% of all Realtors either leave the industry or move from one broker to another.

“There’s no brokerage I’m aware of that’s figured out some way to glue your agents to you.”

Local ownership, staying ahead of the curve

Cleapor said the decision to franchise rather than operate a cloud-based centralized model was deliberate.

“It’s local broker-owners,” he said. “We felt like it’s important to have a local broker owner for agents and the consumer. Agents need to feel supported when they need help and that’s not going to come from somebody that lives four hours away.”

The CEO emphasized continuous innovation.

“We’re always trying to stay ahead of the curve,” said Cleapor. “Our industry has changed so much the past five years between COVID, the NAR settlements and now consolidation. People went from having sub-3% interest rates to in the sixes and didn’t want to sell their homes. We as broker-owners or franchisors need to stay ahead of that curve and empower our owners and agents to be ahead of that curve.”

Murray noted that successful independents adapt by reducing fixed costs.

“Instead of having your own tech platform, they go to a variable cost license so their agents can get a good deal but the company’s not saddled with a big monthly check to underwrite the platform,” he said. “It used to be a lot of leading brokers had in-house training people — that’s all contracted out now on a variable basis. Same thing with very large marketing teams. A lot more has been automated.”

Asked whether fast-growing independents sacrifice profit per side to chase volume, Cleapor said Iron Valley’s profitability ranks higher than 75% of brokerages.

“Could we make a lot more profit per deal? Of course we could,” he said. “But does that allow us and everyone else to grow the right way? I don’t know if it does. We could be like everyone else but we’re not. We went with a different path and it’s been really good for us.”

This post was originally published on here

Loan officer mobility is continuing to decline even as the overall pool of active producers rebounds from recent low points. This appears to signal a shift in how originators are weighing risk, compensation and opportunity, according to a recent mortgage market intelligence report from RETR.

Loan officer movement has long served as a proxy for confidence in the industry. When originators believe they can grow their business, they’re more likely to switch platforms or pursue better economics. But data from RETR suggests that the dynamic is cooling.

In 2023, out of 234,419 producing loan officers, 56,297 switched companies, a mobility rate of about 24%. In 2024, production fell to 219,917 LOs, with 46,709 switching firms, lowering the mobility rate to 21.2%.

By 2025, the number of producing LOs rebounded to 225,062, but only 46,483 changed companies, pushing mobility down further to a rate of 20.6%.

The decline in mobility has persisted even as the market stabilizes, suggesting the slowdown is not purely a function of fewer originators but reflects broader structural factors.

“Loan officers are staying put because stability matters more than ever. Most are prioritizing consistent deal flow, strong support and trusted referral networks over chasing marginal comp differences,” RETR’s James Hooper told HousingWire. “As the market recovers, they’re doubling down on platforms and companies that help them retain clients and generate repeat business rather than starting from scratch elsewhere.”

RETR points to a “wait and see” environment, where loan officers are less willing to absorb the operational disruption of a move unless the upside outweighs it. At the same time, compensation compression across lenders has reduced differentiation, making platforms appear more similar from an earnings perspective.

Despite retention efforts by top lenders — including technology investments, support infrastructure and targeted incentives that appear to be keeping more originators in place — lower mobility does not necessarily signal higher satisfaction.

Performance data on loan officer “movers” adds additional context. A separate RETR analysis of roughly 26,000 active LOs who switched companies in 2024 found that their average loan volume rose from $8.33 million in 2023 to $10.18 million in 2025 — a 22% increase. Average loan counts increased from 24 to 28 units, up 17%.

But RETR pointed out that these gains closely tracked broader market trends. Total mortgage volume rose from $1.69 trillion in 2023 to $2.03 trillion in 2025, a 20% increase, while total loan counts grew 9% to 5.87 million.

The dataset excludes roughly 20,000 loan officers who left the industry, focusing only on those still active in 2026, a factor that likely skews the group toward higher-performing originators.

Weekly movement data underscores the continued slowdown in mobility, even as some originators continue to change firms. According to RETR’s newest weekly data, 284 loan officers switched companies, while 1,285 individuals obtained new licenses through the Nationwide Multistate Licensing System (NMLS).

Recent notable moves included Jonathan Esposito ($121.5 million, 289 units) joining Atomic Mortgage LLC; Steven Crawford ($111.9 million, 222 units) moving to HomeAmerican Mortgage Corp., and Arya Bybordi ($103.5 million, 389 units) joining United Lending Team Inc.

On the company side, several nonbank lenders posted gains based on aggregated loan officer production over a 14-month period. Integrity Home Mortgage Corp. led with a 17.28% increase, followed by Atlantic Avenue Mortgage LLC at 16.84% and Mortgage Solutions FCS Inc. at 8.39%.

This post was originally published on here

Tennessee-based MLS Realtracs has replaced its traditional MLS participation agreement with a new Brokerage Services Agreement that explicitly affirms brokers own their listings and the associated data, according to an April 14, 2026 company blog post by president and CEO Stuart White.

In the post, White said years of evolving rules, licensing structures and layered agreements left the industry in a “gray area” over who owns listing data, with some MLSs effectively treating listing content as an MLS asset or relying on vague language such as “for MLS purposes” to justify broad use of broker-created content.

Under the new agreement, Realtracs states that the listing broker owns the listing content and the data that comes with it, positioning the MLS as a steward and activator of data rather than an owner. The MLS said the agreement is intended to give brokers and agents a clearer foundation to enforce rights around copyright infringement and unauthorized use, according to the announcement.

Realtracs also said it is tightening rules around redistribution. Listing data can only be moved in ways that serve the brokerage’s economic interests or operational efficiency. 

“If it doesn’t serve the broker, it doesn’t happen,” White wrote in the blog post.

White framed the change as a structural shift rather than a cosmetic rewording of contracts. The move follows a broader internal restructuring at Realtracs designed to align the organization around “serving brokers first” and to accelerate decision-making on policy and product issues.

Realtracs said its Brokerage Services Agreement is ultimately about rebuilding trust with brokers, who it describes as being “squeezed on all sides” and in need of greater control over how their listing assets are used in the marketplace.

This article was generated using HousingWire Automation and reviewed by a HousingWire editor before publication. The system helps convert company announcements and industry data into HousingWire-style news coverage.

This post was originally published on here

Mortgage borrowing costs are beginning to ease, with a select group of major lenders now offering rates below the key 6% threshold, signaling a potential shift in housing affordability after an extended period of elevated financing costs.

According to a Yahoo Finance survey of national mortgage lenders published April 20, 2026, at least five institutions are currently advertising annual percentage rates (APR) below 6% on 30-year fixed-rate conventional loans, a level not widely seen in recent months. Because APR includes lender fees, it provides a more comprehensive measure of the true cost of borrowing.

Leading this week’s rankings is Navy Federal Credit Union at 5.740%, followed closely by Citi Mortgage at 5.755%, PenFed Credit Union at 5.916%, Better at 5.959%, and Chase Home Loans at 5.970%—all falling below the 6% mark. Rounding out the top 10 are U.S. Bank (6.141%), Truist (6.165%), Rate (6.261%), Wells Fargo (6.287%), and Citizens Bank (6.337%), reflecting a still-fragmented lending landscape.

The return of sub-6% mortgage offerings is widely viewed as a meaningful threshold for the housing market. Lower borrowing costs can significantly improve purchasing power, particularly for first-time buyers who have been priced out during the recent period of higher rates. Sam Khater, Chief Economist at Freddie Mac, said in recent commentary that “even small declines in mortgage rates can meaningfully impact affordability and demand,” pointing to early signs of renewed buyer interest.

At the same time, the current rate environment remains sensitive to broader financial conditions. Mortgage pricing is closely tied to movements in the bond market, and recent volatility has introduced uncertainty about how long these lower rates will persist. The Yahoo Finance analysis notes that ongoing fluctuations in Treasury yields could quickly shift lender pricing, narrowing the window for borrowers seeking favorable terms.

Competition among lenders is also intensifying, contributing to the dispersion in rates. The survey highlights a notable gap across institutions, with a spread of 1.166 percentage points between the top-ranked Navy Federal Credit Union and the lowest-ranked lender, Rocket Mortgage, underscoring the importance of comparison shopping for consumers.

Several large lenders did not make this week’s top tier. Among the 16 institutions surveyed, Flagstar Bank, Fifth Third Bank, PNC, Bank of America, Third Federal, and Rocket Mortgage fell outside the top 10 based on APR, reflecting shifting competitive dynamics as lenders adjust pricing strategies in response to changing demand.

The broader macroeconomic backdrop is also influencing the trajectory of mortgage rates. Federal Reserve Chair Jerome Powell, in recent remarks, reiterated that the central bank remains “data-dependent,” signaling that future policy decisions will hinge on inflation and labor market trends. Stability in Treasury yields—often driven by Fed expectations—has helped create a more favorable environment for mortgage pricing in recent weeks.

Despite the improvement, structural challenges in the housing market persist. Home prices remain elevated in many regions, limiting the full impact of lower rates. Lawrence Yun, Chief Economist at the National Association of Realtors, said that “while declining mortgage rates will help bring buyers back into the market, supply constraints and pricing pressures remain key obstacles.”

For existing homeowners, the shift could reopen the door to refinancing opportunities, particularly for those who secured mortgages at higher rates over the past year. However, analysts caution that a sustained decline in rates would be necessary to trigger a broad refinancing wave.

The current moment reflects a transition for the housing market—one where financing conditions are beginning to improve, but underlying supply and affordability issues continue to weigh on activity. Whether sub-6% rates become more widespread will depend largely on inflation trends, bond market stability, and the Federal Reserve’s next moves.

For now, the reemergence of mortgage rates below 6% offers a clear signal that borrowing conditions are easing, providing a potential catalyst for renewed activity across the housing sector in the months ahead.

Toronto-based Repliers has entered into a strategic partnership with HAR.com — the multiple listing service (MLS) platform operated by the Houston Association of Realtors — to provide real-time access to MLS data and expanded analytics tools for subscribers.

Under the agreement, Repliers will serve as the exclusive platform for licensing and distributing HAR.com’s MLS data through application programming interfaces (API), offering brokers agents and technology providers direct access to real-time listing information.

Repliers said its platform is designed to eliminate delays and technical complexity traditionally associated with MLS data feeds. The system allows users to access data on demand without building and maintaining their own data pipelines.

The platform is aimed at a range of users including brokerages developing search tools vendors building agent websites and technology teams launching new applications.

Integration of proprietary datasets

As part of the agreement, HAR.com will integrate additional proprietary datasets into the Repliers platform at no cost to subscribers.

These include HAR Stats, which tracks member pageviews and leads from the HAR.com consumer portal; ShowingSmart Stats, which provides real-time showing activity data; and Customer Experience Ratings, which offer verified agent performance insights.

Data will be accessible through Repliers’ API infrastructure — allowing subscribers to incorporate the information into their own systems and applications.

Repliers CEO Rhett Damon said the partnership reflects broader changes in how real estate data is managed and used.

“Shared infrastructure supports the majority of new use cases, and AI will empower a new generation of brokers, agents and vendors to innovate in ways we’ve never seen before,” he. “For HAR.com to embrace this reality and lean in with their proprietary data sets shows why they remain one of the most innovative MLSs in the country.”

Houston Association of Realtors President and CEO Rene Galvan said the partnership is intended to expand capabilities for subscribers while improving data access and security.

“This partnership reflects our philosophy of giving world-class services to our subscribers with valuable tools to build better and faster, while gaining new data insights and security features made possible by real-time data consumption through Repliers,” he said.

This article was generated using HousingWire Automation and reviewed by a HousingWire editor before publication. The system helps convert company announcements and industry data into HousingWire-style news coverage.

This post was originally published on here

Spring is one of the busiest times in the housing market—and having the right agent can make all the difference. From navigating competition to helping buyers and sellers move quickly with confidence, great agents are essential this time of year. We’re excited to welcome Redfin agents who bring the experience and dedication to support clients every step of the way.

One of those agents is Amy Brenner, who returns to Redfin’s San Francisco team after six years exploring other brokerages. She was drawn back by Redfin’s technology, team structure, and the opportunities created through its partnership with Rocket.

“At Redfin, the systems and team structure are second to none,” Amy said. “It allows you to do more volume and focus on helping clients instead of building everything yourself. With the added support from Rocket Mortgage and Rocket Close, it’s going to elevate my business by introducing me to more clients and helping us serve them faster and more efficiently.”

Amy is joining a growing community of agents finding success at Redfin, now powered by Rocket. Here, you do your best work and keep more of what you earn, thanks to smart technology, real business support (including an average of $32,000/year in covered costs and benefits), and a collaborative team culture built for ambitious professionals.

Nearly 30% of Redfin agents are on teams. Whether you want to start a team, join one, or grow your solo business, you’ll have the tools and support to exceed your goals. With this support in place, and an AI-fueled CRM that helps you stay ahead of client needs, Redfin agents consistently close about 3x the national average.

Curious if we’re hiring in your market or want to see what’s new at Redfin? Check for roles near you or join us at an upcoming info session to meet the team and get your questions answered.

Name Market
Abdiel Hernandez Los Angeles
Adam St. Clair Philadelphia
Ahna Vaoifi Oklahoma
AJ Sharif Boston
Alina Finkelshteyn Jersey
Amber Trapp Minneapolis
Amy Brenner San Francisco
Andre Asselin Orlando
Angel Walker Palm Beach
Angelica Fernandez Sacramento
Anny Sanchez Raleigh
Anthony Ibarra San Francisco
Aubrey Myers Jr Los Angeles
Ayla Contois Seattle
Becky Richmond Maryland
Bernar Espanol Palm Beach
Bonnie Kelm Atlanta
Brandon McCloud Indianapolis
Breea Staples Maryland
Brenda Potts Seattle
Brian Evans Houston
Brittania Nosworthy Nashville
Brooke Broadwell Charlotte
Catherine Nanziri Philadelphia
Cesar Chong Virginia
Chris Baptiste Bellevue
Chris Hallman Dallas
Chris Myatt Philadelphia
Christina-Jane DeLong Atlanta
Christine Langford-Dixon Maryland
Christopher Phares Indianapolis
Cindy Davis San Diego
Cody Semler Oklahoma
Cole Lussenhop Denver
Cynthia Prestrelski Portland
Cynthia Walker Maryland
Dale Porter Carolina
Dane Robinson Denver
Danielle Furrell Carolina
Darby Halstead Phoenix
Darlene Norris Maryland
Darren Hall Sacramento
Darron Losse Bellevue
David Dupree Raleigh
Dehlia Geneva Arce Virginia
DeLisa Gaines Maryland
Derek McLendon South Carolina
Desanka Pokrajac Portland
Devon Ogden Los Angeles
DJ Bonner Los Angeles
Donna Lambert New York
Doreen Covarelli San Francisco
Doug Van Brunt Jersey
Dylan Siebers Portland
Eddie Sharma Virginia
Elijah Dennis Minneapolis
Elijah Hoskins New York
Elizabeth Silva New York
Eric Pangle Dallas
Ernesto Heredia Sacramento
Evee Rivera Philadelphia
Farah Seibel Portland
Galya Gamliel Maryland
Giselle Ramirez Orlando
Gwendolyn Dyer Philadelphia
Hani Hills Dallas
Heather Bush Tucson / Ottawa / Toronto
Ian Badillo Seattle
Jaci Lee Dallas
Jake Hughes Minneapolis
Janine Byam Maryland
Jason Cox Jersey
Jason Kappenman Portland
Jayla Johnson Oklahoma
Jeff Fleming Detroit
Jeff Trexler Sacramento
Jeff Warren Los Angeles
Jennifer Hoelsher Nashville
Jessica Hill New York
Jessica Marshall Boston
Jessica Psaros Boston
Jessica Slaughter Dallas
Jimmy Couch Louisville
Jimmy Hart Dallas
John Cyr Boston
JoLyn Hartman Philadelphia
Joseph DeFrancesco Chicago
Joshua Jones Orlando
Julissa Browning Boise
Justin Richards Bellevue
Kathleen Tuttle San Francisco
Keely Jared-Glessner Phoenix
Keith Simone New York
Kelley Saunders Maryland
Kelsey Brazeau Portland
Kelsey Sauer Louisville
Kelvin Peters Boston
Kenneth Bailey Vegas
Kerry Weisback Philadelphia
Kira Person Raleigh
Kirk Rogers Jersey
Kristen Doyle Chicago
Kristen Nowack Portland
Kyle Kleinman Miami
Lakea Perry Buffalo
Laura Cuellar Charlotte
Lauren Frazer Nashville
Laurie Dean Portland
Laurie Dixon Team Kirton
Leora Ainshtein Philadelphia
Linda Santillo Louisville
Lisa Duggan New York & Buffalo
Lori Oliveira Boston
Luiz Fernando Coelho Boston
Maher Saieh Miami
Maik Ruppert Palm Beach
Mandy Strong Seattle
Manny Gomez Dallas
Marc Maley Nashville
Marceil Van Camp Seattle
Marcus Mason Chicago
Margie Zwart Dallas
Mark Zolezi Philadelphia
Matt Jones Sacramento
Melanie Nakamoto Denver
Melissa Donnelly Virginia
Michael Henderson Los Angeles
Michael Pecora Philadelphia
Michelle Schafer Los Angeles
Mike Fuscaldo Orange County
Mike Saleh Virginia
Mikisha Ismail Portland
Mindy Coward Charlotte
Mitch Johnson Minneapolis
Mitchell Gonzales Denver
Moe Eltouny Maryland
Myke Popatia Rhode Island
Myron Walker Charlotte
Naim Jones Maryland
Nate Velasquez San Francisco
Neeta Gupta New York
Nesmet Badawi Jersey
Nick Jacob Tucson / Ottawa / Toronto
Nidhi Gupta Dallas
Oscar Escobar Tucson / Ottawa / Toronto
Pablo Cintron Orlando
Portia Hewitt Houston
Quinique Hollis Palm Beach
Rebecca Huang Chicago
Robby Douglas Team Gilfoy
Robert Millaway Philadelphia
Robert Sousa Rhode Island
Robin Turner Empire
Roger Doyon Palm Beach
Rory Obletz Maryland
Rosanna Rivera Orlando
Ryan Lerow Charlotte
Sal Talluto Chicago
Sara Karan Orange County
Sean Powell Virginia
Sean Terrell Boston
Shablee Tuttle Portland
Shane Xiang Seattle
Shaquita Pressley Houston
Shardul Mehta San Francisco
Sharon McMilion Dallas
Shauna Rumel Seattle
Shawn Holman Detroit
Shess Ortiz Virginia
Sita Philion Philadelphia
Staci Fabian Rhode Island
Stephanie Calleja Nashville
Stephanie Jones Nashville
Steven Moore Los Angeles
Steven Tillotson San Francisco
Susan McHale Virginia
Takisha Gresham Jersey
Taylor Day Nashville
Thom McDonell Pittsburgh
Thomas Borkowski Jersey
Tiffany Dalton Palm Beach
Tobie Hickey Carolina
Toni Thompson Denver
Tony Jollay Indianapolis
Tony Natoli San Francisco
Tonya Williams Los Angeles
Trish Armstrong Denver
Tyler Sather Portland
Varun Yasa Jersey
Verron Jackson Houston
Victoria Baptiste Bellevue
Victoria Evangeliou Virginia
William Foxx Virginia
Yemily Lopez Jersey


The post Say hello to the Newfins who joined us in Q1! appeared first on Redfin Real Estate News.

This post was originally published here

With the 2026 World Cup less than two months away, the New York City Council introduced a package of legislation last week to support local businesses during the nearly six-week tournament, which includes eight games at nearby MetLife Stadium in New Jersey. One of the proposed bills would create a “cultural passport program” to encourage those traveling to New York for the soccer matches to explore local businesses and institutions across the five boroughs; another would make a calendar of events to help visitors find festivals, parties, and cultural corridors tied to the participating teams. The new legislation comes as City Hall has restricted approving permits for large public events during the World Cup, as well as the 250th Anniversary of America on July 4.

Introduced by Council Deputy Speaker Nantasha Williams, the legislation directs the city’s Economic Development Corporation to “develop and implement” a cultural passport program in consultation with the Department of Small Business Services, the Department of Cultural Affairs, and New York City Tourism + Conventions.

Williams said the program would help New York business owners and residents benefit from the eight World Cup matches held at MetLife from June 13 to July 19, which is estimated to generate $3.3 billion in total economic impact, according to the New York/New Jersey Host Committee.

“A cultural passport program creates a clear pathway to connect residents and visitors to institutions, small businesses, and community spaces across all five boroughs so the benefits of this moment are felt more equitably across the city,” Williams said in a statement.

“If we are moving forward with something of this magnitude, then it has to be done with a clear focus on who benefits and how. That means expanding opportunity, supporting local economies, and ensuring communities see a real return from an event happening in their own city.”

Another bill, introduced by Majority Leader Shaun Abreu, requires the city to publish a calendar of activities related to the World Cup, including “viewing parties, recreational events, performances, street festivals, and other cultural programming.” The bill calls for the city to create a map of neighborhoods with a significant concentration of residents or businesses that share connections to a participating nation in the tournament.

Officials expect more than 1.2 million visitors to travel to the region for the World Cup, which will be the largest edition of the tournament ever, expanding from 32 to 48 national teams and featuring 104 matches across 16 cities in the U.S., Canada, and Mexico.

The city has allocated $90 million for World Cup preparations, but specifics surrounding neighborhood events remain uncertain. In an op-ed published by Crain’s earlier this month, Council Member Virginia Maloney, chair of the council’s Economic Development Committee, said there’s a “lack of coordination” surrounding proposed public programming.

The city’s Economic Development Corporation received $15 million for public events, but little information has been made available to local stakeholders regarding the programming.

“Cultural institutions reported being left out of the process entirely until the last minute,” Maloney wrote. “Business Improvement Districts reported that a moratorium on public plaza permits, put in place to maximize FIFA site selection, left them unable to plan any programming in June and July, disrupting local events such as concerts and classes. BIDs are still waiting for approvals with 66 days to go.”

Maloney also noted that Mayor Zohran Mamdani, who appointed a World Cup Czar in January, has not yet appointed a president of the EDC.

The city has denied permits for new large events in NYC parks and other major gathering spaces for six weeks during the World Cup, as well as the Fourth of July, due to security concerns. According to the Daily News, the city has placed a moratorium on permitted events from May 24 through July 25, creating a problem for the city’s many business improvement districts (BIDs), which were hoping to capitalize on the major events.

The New York Times reported last week that there are applications for 25 new major events in NYC parks that could be denied by the city to conserve city resources. An emergency order issued by Parks and approved by the mayor last month, gives the department “broad latitude to deny applications for new, large-scale events like concerts and festivals from June 11 to July 19,” according to the Times, but returning events would not be impacted.

Jeffrey LeFrancois, the executive director of the Meatpacking District Management Association, told the Daily News he knows of six events that moved to other large cities because of delays from City Hall regarding permits.

“Depending on the size and scale, a lot of these events don’t even need city resources,” LeFrancois told the newspaper. “And a blanket ‘Wait and see’ from the city isn’t helping anybody. We need to be able to make decisions. There are brands that have money to spend on permits for events and want to leverage the World Cup, but they’re not getting approved here, so that money ends up going elsewhere.”

According to the Times, the city says most events, including birthday parties, picnics, weddings, and others, will not be affected. The newspaper reports Parks officials have approved over 1,340 event permits for this June and July.

Other bills included as part of the legislation package introduced in the Council last week include expanding access to public bathrooms in NYC, as well as promoting a list of locations of public facilities. The plan, as reported by Gothamist, would include installing temporary restrooms in areas of high foot traffic by June 1.

And Council Member Maloney wants to co-name several thoroughfares and public places, including “Thierry Henry Way” in Manhattan, next to the World Cup Fan Village opening at Rockefeller Center, and “Pelé Way” in Queens.

“I’m excited to introduce legislation naming Thierry Henry Way in Manhattan and Pelé Way in Queens, honoring two global soccer icons who helped shape the modern game,” Maloney said.

“Thierry Henry Way will be in the district I’m proud to represent, running alongside Rockefeller Center, where hundreds of thousands of fans will gather for free viewing parties. It’s fitting that we’re connecting this global moment to our local communities and businesses, ensuring that New Yorkers are a part of this once-in-a-lifetime experience, whether in our stadiums or on our streets.”

The following World Cup matches will be held at MetLife:

  • June 13: Brazil vs. Morocco
  • June 16: France vs. Senegal
  • June 22: Norway vs. Senegal
  • June 25: Ecuador vs. Germany
  • June 27: Panama vs. England
  • June 30: Round of 32
  • July 5: Round of 16
  • July 19: FIFA World Cup Final

RELATED:

The post NYC Council wants a ‘cultural passport,’ more public bathrooms, and Pelé Way for World Cup first appeared on 6sqft.

This post was originally published here

Compass International Holdings (CIH), which owns Compass, Anywhere Real Estate and @properties Christie’s International Real Estate, is taking majority control or 51% of the common equity of a parent company that will indirectly own some Sotheby’s International Realty, Inc. franchises.

The Robert Reffkin-helmed firm disclosed this ownership change in a document filed with the Securities and Exchange Commission (SEC) last Wednesday.

The parent company entity that indirectly owns some of Sotheby’s International Realty includes parts of Peerage, which is an investor in several Sotheby’s International Realty franchises, including Jameson Sotheby’s, Pacific Sotheby’s and Premier Sotheby’s, as well as several funds managed by TPG Angelo Gordon. The companies said the deal is part of an attempt to rework existing debt tied to the predecessor of the parent company CIH is acquiring. However, the total amount of debt involved has not been disclosed. 

“Sotheby’s International Realty, Inc. became an equity holder in several affiliated Peerage franchisees, reflecting its long‑term confidence in these businesses and their leadership in key markets across the U.S. and Canada,” a CIH spokesperson told HousingWire in an email. Peerage and these brokerages continue to operate independently under their existing leadership and brand, in most cases as part of the Sotheby’s International Realty network.”

As part of the deal, some of the debt owed to CIH will be repaid over 30 months in installments. Additionally, as part of the PUT agreement included in the filing, TPG retains the right to force CIH to buy its ownership stake at any time, by paying a predetermined price in cash. If TPG chooses to exercise that right, CIH is obligated to complete the purchase with no conditions or excuses—regardless of financing, market conditions, or internal issues.

The Sotheby’s International Realty brand is part of Anywhere Real Estate, which CIH acquired earlier this year. 

This post was originally published on here

Colorado Attorney General Phil Weiser reached a consent judgment with right-to-list agreement firm MV Realty that voids the firm’s long-term “Homeowner Benefit Agreement” contracts in the state, clears related title filings and blocks the company from performing real estate brokerage services in Colorado.

The agreement, which was announced at the end of March and is awaiting court approval, resolves a 2025 lawsuit that accused MV Realty of illegally locking “hundreds” of Colorado homeowners into decades-long listing contracts, according to the attorney general’s office. The contracts were secured by filings in county property records and required homeowners — and in some cases their heirs — to pay what the state called “exorbitant” fees if they sold or refinanced with a different real estate agent.

Under MV Realty’s Homeowner Benefit Agreement, the homeowner signs over the right to list their home for the next 40 years to MV Realty in exchange for a cash payment ranging from $300 to $5,000. This means that if a homeowner decides to sell their house sometime in the next 40 years, the company is entitled to list the home for a 3% commission, which is separate from the commission earned by the buy-side agent.

If the homeowner breaks the agreement or decides to terminate it early, they must pay the firm 6% of the appraised value of the home.

At the height of MV Realty’s success in 2023, the firm said since launching the program in 2020, it had enrolled more than 35,000 homeowners in 33 states and has paid homeowners nearly $40 million.

The firm announced it was pausing its right to list agreement program in late February 2023, after it had been sued by attorneys general in several states beginning with Florida, Massachusetts and Pennsylvania in late 2022. In Sept. 2023, MV Realty filed for Chapter 11 bankruptcy in the 33 states it operates in.

Under the attorney general’s consent judgment, all MV Realty Homeowner Benefit Agreement contracts with Colorado consumers are void and unenforceable, and the company is permanently barred from collecting any related fees or payments. Based on evidence gathered in the case, Weiser’s office estimates the cancellation will prevent MV Realty from collecting about $8.4 million from Colorado homeowners.

Additionally, MV Realty must also terminate all documents recorded against homeowners’ properties, fully release any claim or interest in those homes at no cost to consumers and notify impacted owners that their titles have been cleared. The agreement requires the company to meet “strict timelines” for those steps and to dismiss any pending lawsuits based on the agreements.

As part of the resolution, MV Realty has agreed to pay $600,000 to Colorado for consumer restitution and education over the next year. The consent judgment also includes $450,000 in civil penalties and $50,000 in attorneys’ fees, which are suspended as long as the company complies with the terms and pays the restitution, the attorney general’s office said.

The agreement resolves Colorado’s claims without any admission of wrongdoing by MV Realty and avoids prolonged litigation. Weiser’s office retains authority to enforce the consent judgment and pursue any future violations of state law.

Earlier this year, a North Carolina court barred MV Realty from enforcing its right-to-list agreements, after the firm was banned from operating in North Carolina back in 2024. Additionally, several states have enacted laws banning right-to-list agreements.

This article was written by Brooklee Han and generated with the assistance of HousingWire Automation. It was reviewed by a HousingWire editor before publication. The system helps convert company announcements and industry data into HousingWire-style news coverage.

This post was originally published on here

This meticulously renovated three-bedroom, three-bath home at 257 West 86th Street was the live/work studio of renowned dance teacher Raoul Gelabert. The subsequent architect/owners completely transformed the 2,800-square-foot co-op space into a three-bedroom duplex home that combines sophisticated design with meticulous craftsmanship. Asking $5.65 million, the loft-like residence retains its pre-war elegance, elevated by dramatic interiors and modern finishes.

Architect Morgan Rolontz and his wife Randie paid roughly $1.7 million for the property in 2021, according to city records. The duo went on to complete a total renovation of the home, taking it “down to its shell,” redesigning the layout, and adding modern amenities, storage, and bold colors throughout. See the before and after pictures of the project here.

Behind its standout interior style, the home offers every modern comfort and convenience, including an in-unit washer/dryer, custom closets, and built-in storage. All-new windows and zoned central A/C mean energy efficiency.

The entry foyer is an architectural showcase done in natural oak. Custom cabinetry and integrated artwork frame an upholstered bench; a glass rail borders an oak stairway. Two hidden storage closets slide conveniently under the stairs.

A double-height great room opens beneath a 20-foot ceiling. Bordering this dramatic space is an office gallery. A media room/den has a built-in Murphy bed, allowing it to double as a guest room or fourth bedroom.

The eat-in kitchen is as much a design showcase as a capable culinary lab. Anchored by a peninsula table, deep blue high-gloss lacquer cabinetry frames high-end appliances. Also on the first floor are three closets and a full bath.

Upstairs are three bedrooms and two full baths. Every inch of the space makes use of architectural innovation to make everyday living easy on the eyes.

The pet-friendly building is in a coveted Upper West Side spot between Riverside and Central Parks. The full-service cooperative offers a 24-hour doorman, a fitness center, and a landscaped roof deck.

[Listing details: 257 West 86th Street, #1/2A at CityRealty]

[At Sotheby’s International Realty by Epo I Manning and Florence Danforth-Meyer]

RELATED:

The post For $5.65M, a ballet legend’s former UWS studio is now a three-bedroom home first appeared on 6sqft.

This post was originally published here

For years, real estate marketing was viewed as simply a support function responsible for campaigns, promotional materials and brand visibility.  Now, there is a new model that is poised to help brokerages scale successfully.

Today, marketing sits at the center of how brokerages drive agent recruitment, retention and revenue growth. It is no longer a support function; it is a growth engine. 

Marketing shapes brand perception, drives pipeline, influences recruitment and ultimately determines how and how fast a brokerage or proptech company scales. It empowers brokerages to move faster, attract stronger agents and grow market share and profitability.

The organizations pulling ahead today are not doing so because they market better. They are doing so because they have redefined what marketing is responsible for: growth.

But that kind of growth does not happen by accident. It happens when marketing is structured with intention, when brand, performance and agent marketing and experience are distinct, aligned and accountable for real business outcomes.

The traditional brokerage marketing model was built for a time when visibility alone could drive results, and where marketing operated downstream from strategy. That model no longer holds.

What is emerging in its place is a new archetype: the marketing leader who thinks and operates like a Chief Marketing & Growth Officer with company-wide influence, accountability and ownership of the full growth system.

Own the full growth funnel

Historically, brokerage marketing teams were measured by output: brochures, signage and listing campaigns. These are still important, but they no longer differentiate a brand from a growth or expansion standpoint.

The most effective senior marketing leaders today are measured by outcomes. They go beyond marketers. They are builders and operators: close enough to the business to influence how it looks and how it grows. They own the full growth funnel, while helping shape conversations and decisions around recruitment, expansion and investment.

The data reinforces this shift. Research from McKinsey & Company found that companies with marketing embedded in strategic decision-making see 1.4x higher revenue growth, yet only about half of CMOs are meaningfully involved at that level. At the same time, Boston Consulting Group reports that organizations with strong alignment between marketing and sales achieve up to 20% higher revenue growth.

Marketing and recruitment need to be intertwined. Agents evaluate brokerages the same way consumers evaluate brands: through reputation, visibility, authority and, increasingly, the quality of the technology experience. The marketing leader who understands this doesn’t just generate leads; they shape demand for the right agents at the right time.

The brokerages that will outperform over the next decade will be those that give marketing a true seat at the table. Not as a support function, but as a driver of compounding growth.

Lead the digital transformation or be left behind

The Chief Marketing & Growth Officer, or a marketing leader operating with that mandate, should lead digital transformation with the CPO. Not just IT, or in isolation from Product. It should not be viewed as a secondary initiative owned by operations.

Digital transformation is not just about systems. It’s about adoption, experience and behavior at scale, which are all part of marketing-led outcomes.

This is where most brokerages get it wrong. Industry data shows the majority of digital transformations fail because organizations struggle to translate tools into behavioral change and business impact. In SaaS and tech companies, product and marketing are inseparable; real estate is well overdue for the same shift.

Effective marketing leaders partner closely with product and operations to improve and simplify the agent experience. They strip away unnecessary complexity, prioritize what drives progress, and ensure the tools agents rely on actually help them win business.

The issue facing most brokerages and PropTech companies today isn’t access to technology. It is translation: turning capability into behavior, tools into productivity and investment into measurable growth.

Two companies can invest in the same platform and see completely different outcomes if one treats it as a feature and the other treats it as a system. In real estate, that gap is accelerating.

Brokerages are investing heavily in AI, automation and data, but many agents are still operating with fragmented workflows, underutilized tools and inconsistent experiences. The result is not transformation, it’s complexity.

The firms pulling ahead are doing something fundamentally different. They are not asking, “What should we buy next?”  They are asking, “How should we operate differently?”

They are rethinking:

  • How agents generate and convert business
  • How client experiences are designed and delivered
  • How decisions are informed by data, not instinct
  • And how technology supports, not complicates, that process

This is where the CMGO creates a disproportionate advantage. For brokerages, it means driving measurable outcomes such as stronger agent recruitment, higher productivity, improved retention and a more consistent client experience across every touchpoint.

For PropTech companies, it means ensuring that products are not just built, but actually used, adopted and embedded into daily workflows. The gap between product innovation and user adoption is where most value is lost.

The CMGO is uniquely positioned to close that gap because they sit at the intersection of brand (what we promise), product (what we deliver) and experience (how it’s actually used).

They understand how agents build their businesses, how consumers make decisions and how both interact with technology in real-world environments.

More importantly, they own the outcomes tied to it:

  • Recruitment and agent attraction
  • Conversion and productivity
  • Agent sentiment, retention and long-term value
  • Product adoption and customer lifetime value

Without adoption, there is no ROI. Without alignment, there is no scale. And without marketing leadership, there is no system connecting the two.

The modern CMGO operationalizes new tools, partnering with product, sales and operations to ensure that every technology investment translates into a better agent experience, stronger market positioning  and measurable business performance. In SaaS companies, this alignment is expected because product and marketing operate as one system.

Real estate is still evolving into that model. The companies that win will not be the ones that invest the most in technology, but those that align leadership, culture and execution around it.

In the end, digital transformation is not about modernization but about momentum. And momentum is what great marketing leaders are built to create.

Credibility is the new competitive advantage

You have the right tools and agent adoption, now what? Today’s consumers are savvy. Generic marketing claims that once attracted attention are now costing brokerages credibility.

Today’s consumers and agents are more informed, more skeptical, and more reliant on digital signals than ever before. According to Zillow’s 2025 Consumer Housing Trends Report, 37% of buyers and 36% of sellers find their agent through online channels, turning digital presence into a direct revenue driver.

That shift elevates something many organizations still underestimate: credibility. Earned media, reputation, thought leadership and consistency across platforms now carry more weight than controlled messaging. The strongest brands don’t just say they are different; they demonstrate it repeatedly in places they don’t own.

This is where many brokerages get it wrong. They try to appeal to everyone, but credibility comes from clarity, not breadth. The most effective brands understand exactly who they are for and who they are not. They build systems, messaging and agent experiences that reinforce that positioning at every touchpoint.

Brand is no longer just a story; it is a filter. And marketing provides that filter. Over time, that filter compounds,  strengthening culture, improving retention and driving performance.

Measure what actually drives growth

The shift to a CMGO mindset ultimately comes down to accountability. Not for activity, but for impact.

Marketing leaders must operate as builders and operators: close to execution, deeply connected to the business, attuned to market shifts and aligned across recruitment, customer experience, product, operations and technology.

This requires a different measurement framework. The metrics that matter are not vanity metrics, but business metrics such as:

  • Recruitment quality and conversion
  • Agent satisfaction, retention, and productivity
  • Technology adoption and utilization
  • Customer acquisition cost and lifetime value
  • Revenue growth and market share

These are not marketing-adjacent metrics, but marketing-led metrics. When marketing owns them, the entire organization becomes more aligned, more efficient, and more capable of scaling.

The new era of brokerage marketing

We are at an inflection point. Brokerages and PropTech companies can continue to treat marketing as just a support function or they can recognize what it can become. I recommend two sectors: agent marketing and corporate brand and performance marketing.

When a marketing leader operates with a Chief Marketing & Growth Officer mindset — owning how the business attracts, converts and retains agents and clients — the impact is not incremental, it is transformational.

The companies that win in this next era will not be the ones with the biggest budgets or the most tools. They will be the ones with the clearest strategy, the strongest alignment and the leaders capable of connecting brand, product and performance into a single, scalable system.

That is the role of the modern marketing leader. And it is only just beginning.

Lauren Henss is Vice President of Marketing and Strategic Initiatives at FirstTeam.

This column does not necessarily reflect the opinion of HousingWire’s editorial department and its owners. To contact the editor responsible for this piece: tracey@hwmedia.com

This post was originally published on here

The window for Fannie Mae and Freddie Mac to be returned to the private sector “appears to be narrowing,” with a low probability of it happening before the midterms election in November, according to analysts at Keefe, Bruyette & Woods (KBW).

With the Trump administration’s focus having shifted to the Middle East conflict and housing affordability, the topic has become quieter in Washington, D.C., and across the mortgage market in 2026, following early signals of a potential stock offering for the government-sponsored enterprises (GSEs) last year.

“While there have been multiple posts on X about GSE privatization, we think in order for privatization to succeed, the administration needs to take action to address key issues, such as capital levels, the treatment of the government’s senior preferred (stock), and the nature of the implicit guaranty,” the analysts wrote in a report released Monday.

But resolving these issues while maintaining a stable secondary market for mortgage assets will take time. And “if much of the work isn’t done in 2027, it will probably be challenging in 2028 as the administration’s focus shifts to the 2028 presidential election,” the analysts said.

“Given that, we think the window for GSE privatization appears to be narrowing.”

The comments come as the GSEs prepare to release first-quarter 2026 earnings. KBW said net interest income for Fannie and Freddie is projected to rise amid an expected $200 billion increase in their retained portfolios, as announced by Trump in January.

“The GSEs, unlike the Federal Reserve when it was buying agency MBS while conducting quantitative easing, are behaving like other private market participants and buying agency MBS where they see value,” the analysts said.

Overall, KBW lowered its price target from $10 to $8.50 per share for Fannie Mae, and from $9 to $8.50 for Freddie Mac, reflecting a reduced likelihood of privatization.

This post was originally published on here

New York City Comptroller Mark Levine plans to invest $4 billion from the city’s public pension funds for affordable housing development. Levine on Thursday unveiled the “NYC Housing Investment Initiative,” which will more than double the funds’ current real estate portfolio and help finance thousands of new homes through mixed-income projects, office-to-residential conversions, and renovations, as first reported by the New York Times. The plan calls for roughly $1 billion in annual pension investments over the next four years.

The initiative seeks to address NYC’s current housing crisis. As of February 2024, the rental vacancy rate had fallen to 1.4 percent, the lowest level in more than 50 years. Data from Pew also shows that the city’s housing stock grew by only 4 percent between 2010 and 2018.

As part of the initiative’s first round of investments, Levine has directed the Bureau of Asset Management to bring $750 million in investments to the boards for approval to create new mixed-income affordable housing, preserve existing affordable homes, and support office-to-residential conversions.

He has called for a $500 million expansion of the Public Private Apartment Rehabilitation (PPAR) program to support the construction, preservation, and rehabilitation of housing across NYC and surrounding counties. Levine also announced a new 36-month rate lock and 40-year amortization schedule for both preservation and new construction.

Additionally, Levine recommended further investment for approval in the AFL-CIO Housing Investment Trust to finance large-scale multifamily and affordable housing projects in NYC using union labor. The AFL-CIO trust specifically finances middle-income housing built and operated by union workers, according to the Times.

Investments will require approval from each pension fund’s board of trustees.

“Too many New Yorkers are struggling just to keep a roof over their heads. Solving this crisis takes action on all fronts. We’ve advanced critical zoning changes, but without financing, housing doesn’t get built,” Levine said.

“The NYC Housing Investment Initiative is about closing that gap, delivering the homes New Yorkers need, and making sound investments for the NYC retirement systems,” he added.

NYC currently has five pension funds, which provide retirement benefits to police officers, teachers, firefighters, and other city workers. Totaling roughly $320 billion in assets, the funds invest in real estate across the city and around the world, as well as in stocks, bonds, and private equity.

Since the early 1990s, these investments have helped create or preserve 199,000 housing units, according to a press release. The new capital infusion is expected to support the creation or rehabilitation of thousands more units.

Previous projects funded through the program include Lily House, a Bronx building for domestic violence survivors, and The Rise, a Brooklyn building that houses formerly incarcerated women, according to the Times.

Pension funds are required to make investments that maximize returns, which has historically made affordable housing a less attractive option. Investors have often favored market-rate projects, where higher rents typically generate stronger returns.

However, a 2024 survey from the Federal Reserve Bank of New York found that pension funds have increased their investments in affordable housing in recent years, viewing it as more stable long-term than market-rate housing, according to the Times.

RELATED:

The post NYC plans to invest $4B from pension funds for affordable housing first appeared on 6sqft.

This post was originally published here

The MIAMI Association of Realtors (MIAMI) and Broward, Palm Beaches & St. Lucie Realtors (RWorld) and their respective MLSs are merging, creating a single association and MLS that will be the largest local Realtor association in the world and one of the nation’s biggest MLSs, according to an announcement on Monday. 

The merger, effective May 11, 2026, will unify 93,000 members across South Florida and is being positioned by the organizations as the largest and fastest local Realtor and MLS merger in National Association of Realtors (NAR) history, according to the announcement. The combined association is proposed to be called Miami and South Florida Realtors, pending NAR approval.

MIAMI, with 56,000 members, is currently the largest local Realtor association in the U.S., while RWorld, with 37,000 members, is the third largest. The combined 93,000-member body will be larger than 47 state associations, more than double the next largest local association at 43,000 members and about one-third larger than the next largest local association globally, the organizations said.

“Two of the strongest MLS and Realtor organizations in the U.S. are now one, building on South Florida’s momentum as a global real estate powerhouse and shaping the industry’s next frontier,” MIAMI Chairman of the Board Alfredo Pujol said in the announcement. “This is a win for South Florida, our 93,000 collective members and their clients. Our members will have broader, more fluid access to the data, tools and services they need — without the limitations or complexity of multiple memberships.”

Pujol, currently chairman of MIAMI, will serve as the first chairman of the board of the combined association. Katherine Arteta will serve as 2027 chair-elect.

RWorld President Jonathan Dolphus, who will serve as 2026 chair-elect and 2027 chairman of the board for the new organization, said the combination is aimed at streamlining how South Florida real estate professionals access data and services.

“By bringing our organizations together, we are creating a more connected and efficient Association and MLS, one that delivers complete MLS data, expanded access to tools and services and a simpler way for our members to do business,” Dolphus said. He will be the first Black chairman of the board in the history of both MIAMI and RWorld.

The new association will be led by co-CEOs Teresa King Kinney and Dionna Hall, extending more than 60 years of women’s leadership at the organizations. Kinney, who has led MIAMI for 33 years, announced on Feb. 20, 2026, that she will retire at the end of 2026. Hall will remain as CEO of Miami and South Florida Realtors & BeachesMLS in 2027 and beyond.

The associations said that division boards for both legacy organizations will remain in place to preserve existing cultures and local representation. Upon completion of the merger, Evian White De Leon, MIAMI chief operating officer and chief legal counsel, will become COO of the new association and chief of the MIAMI Division. Kim Hansen, RWorld’s COO, will serve as COO of BeachesMLS and chief of the RWorld Division.

According to the announcement, the associations will initially continue to operate their MLSs as separate entities after the merger closes, with plans to fully combine them “in the near future.” Once combined, the Miami and South Florida Realtors Beaches MLS is expected to have about 93,000 subscribers, which would make it the third-largest MLS in the U.S., behind Bright MLS (101,000 subscribers) and California Regional MLS (CRMLS, 99,000 subscribers), based on T3 Sixty’s 2025 MLS rankings.

The resulting Beaches MLS will also be the largest MLS owned by a single Realtor association in the U.S., according to the announcement. The organizations reported that MIAMI and RWorld members closed $69 billion in total real estate volume in 2025.

The merged association will maintain access to both Flexmls and Matrix, giving subscribers two MLS platform options under the same organizational umbrella, according to the announcement.  The combined group says it will offer more than 2,830 educational seminars annually and provide access to more than 300 marketing tools, products and services.

In addition, the new organization will expand on MIAMI’s existing global program, which includes more than 437 signed international agreements with real estate associations worldwide. These partnerships drive referral business and promote South Florida to international buyers, investors, tourists and corporations.

The unified association also has 11 data exchange relationships with some of the largest MLSs in the U.S. and Canada, allowing reciprocal access to each other’s MLS data.

The organization said it will soon launch participation in the Global Data Exchange (GDX), a platform enabling MLSs and real estate organizations across multiple countries to share public listing data. That initiative could further extend South Florida listing exposure to global audiences and deepen inbound referral pipelines.

This article was generated using HousingWire Automation and reviewed by a HousingWire editor before publication. The system helps convert company announcements and industry data into HousingWire-style news coverage.

This post was originally published on here

The MIAMI Association of Realtors (MIAMI) and Broward, Palm Beaches & St. Lucie Realtors (RWorld) and their respective MLSs are merging, creating a single association and MLS that will be the largest local Realtor association in the world and one of the nation’s biggest MLSs, according to an announcement on Monday. 

The merger, effective May 11, 2026, will unify 93,000 members across South Florida and is being positioned by the organizations as the largest and fastest local Realtor and MLS merger in National Association of Realtors (NAR) history, according to the announcement. The combined association is proposed to be called Miami and South Florida Realtors, pending NAR approval.

MIAMI, with 56,000 members, is currently the largest local Realtor association in the U.S., while RWorld, with 37,000 members, is the third largest. The combined 93,000-member body will be larger than 47 state associations, more than double the next largest local association at 43,000 members and about one-third larger than the next largest local association globally, the organizations said.

“Two of the strongest MLS and Realtor organizations in the U.S. are now one, building on South Florida’s momentum as a global real estate powerhouse and shaping the industry’s next frontier,” MIAMI Chairman of the Board Alfredo Pujol said in the announcement. “This is a win for South Florida, our 93,000 collective members and their clients. Our members will have broader, more fluid access to the data, tools and services they need — without the limitations or complexity of multiple memberships.”

Pujol, currently chairman of MIAMI, will serve as the first chairman of the board of the combined association. Katherine Arteta will serve as 2027 chair-elect.

RWorld President Jonathan Dolphus, who will serve as 2026 chair-elect and 2027 chairman of the board for the new organization, said the combination is aimed at streamlining how South Florida real estate professionals access data and services.

“By bringing our organizations together, we are creating a more connected and efficient Association and MLS, one that delivers complete MLS data, expanded access to tools and services and a simpler way for our members to do business,” Dolphus said. He will be the first Black chairman of the board in the history of both MIAMI and RWorld.

The new association will be led by co-CEOs Teresa King Kinney and Dionna Hall, extending more than 60 years of women’s leadership at the organizations. Kinney, who has led MIAMI for 33 years, announced on Feb. 20, 2026, that she will retire at the end of 2026. Hall will remain as CEO of Miami and South Florida Realtors & BeachesMLS in 2027 and beyond.

The associations said that division boards for both legacy organizations will remain in place to preserve existing cultures and local representation. Upon completion of the merger, Evian White De Leon, MIAMI chief operating officer and chief legal counsel, will become COO of the new association and chief of the MIAMI Division. Kim Hansen, RWorld’s COO, will serve as COO of BeachesMLS and chief of the RWorld Division.

According to the announcement, the associations will initially continue to operate their MLSs as separate entities after the merger closes, with plans to fully combine them “in the near future.” Once combined, the Miami and South Florida Realtors Beaches MLS is expected to have about 93,000 subscribers, which would make it the third-largest MLS in the U.S., behind Bright MLS (101,000 subscribers) and California Regional MLS (CRMLS, 99,000 subscribers), based on T3 Sixty’s 2025 MLS rankings.

The resulting Beaches MLS will also be the largest MLS owned by a single Realtor association in the U.S., according to the announcement. The organizations reported that MIAMI and RWorld members closed $69 billion in total real estate volume in 2025.

The merged association will maintain access to both Flexmls and Matrix, giving subscribers two MLS platform options under the same organizational umbrella, according to the announcement.  The combined group says it will offer more than 2,830 educational seminars annually and provide access to more than 300 marketing tools, products and services.

In addition, the new organization will expand on MIAMI’s existing global program, which includes more than 437 signed international agreements with real estate associations worldwide. These partnerships drive referral business and promote South Florida to international buyers, investors, tourists and corporations.

The unified association also has 11 data exchange relationships with some of the largest MLSs in the U.S. and Canada, allowing reciprocal access to each other’s MLS data.

The organization said it will soon launch participation in the Global Data Exchange (GDX), a platform enabling MLSs and real estate organizations across multiple countries to share public listing data. That initiative could further extend South Florida listing exposure to global audiences and deepen inbound referral pipelines.

This article was generated using HousingWire Automation and reviewed by a HousingWire editor before publication. The system helps convert company announcements and industry data into HousingWire-style news coverage.

This post was originally published on here

As the real estate industry grapples with consolidation, margin pressure and shifting consumer expectations, HomeServices of America is rethinking its role — and getting louder about it.

In a recent interview on the RealTrending podcast, CEO Chris Kelly said the company is moving beyond its long-standing identity as a “quiet powerhouse” and evolving into a more active, value-driven parent organization. The shift reflects broader changes across the brokerage landscape, where scale alone is no longer enough and firms are racing to control more of the transaction.

“We are very much evolving … from holding to parent company,” Kelly said, noting that the distinction carries real implications for agents and affiliated businesses. As a parent company, HomeServices is expected to deliver value — not just aggregate it — and to take a more visible role in shaping the industry.

Listen to the podcast

A broader definition of growth

That evolution is influencing how HomeServices thinks about expansion. Rather than focusing solely on acquiring brokerages, Kelly said the company is pursuing a mix of strategies, including M&A, organic growth and investments across the broader real estate ecosystem.

“Our growth strategy could be buying other parts of the ecosystem,” he said, pointing to the company’s investment in a title underwriter as an example of a move that may not grab headlines but plays a critical role in the business model.

The approach reflects a wider industry shift. According to Kelly, real estate is increasingly dividing into two camps: national, full-service ecosystem players and cloud-based, virtual brokerages. Both models can succeed, he said, but companies need to be clear about who they are.

“There’s not any one right path,” Kelly said. “You have to understand who you are and lean into it.”

The race to the consumer

As competition intensifies, firms are also looking to engage consumers earlier in the transaction process — even before they formally enter the housing market.

“The whole concept behind it is how further upstream do I need to go to get to that client?” Kelly said.

That trend is fueling convergence across sectors, with mortgage companies, brokerages and portals all expanding into adjacent businesses. While some firms are built on digital-first strategies, HomeServices is leaning into its existing network of agents and service providers while continuing to invest in digital capabilities.

“We’re all trying to get to the same spot, just coming at it from different angles,” he said.

Local leadership as a competitive edge

Despite the push toward national scale, Kelly emphasized that local leadership remains one of the company’s most important differentiators.

HomeServices maintains a president or CEO-level leader in each of its markets — a structure that may be less efficient but, in Kelly’s view, is essential to culture and agent engagement.

“The one thing that we will not let efficiency interfere with is our local leadership,” he said.

That local focus is especially important as independents and alternative models gain market share. Rather than trying to appeal to every type of agent, Kelly said brokerages should be clear about their value proposition.

“If you pretzel yourself enough, you can appeal to be the brokerage for every kind of agent — and that’s just not reality,” he said.

Profitability through diversification

With margins under pressure across the industry, HomeServices is relying on its multi-line business model to maintain stability.

Kelly compared the approach to a stool: the more legs it has, the sturdier it becomes. Revenue streams from mortgage, title, insurance and other services help balance fluctuations in any one segment.

Brokerage cannot be a loss leader,” he said. “They all have to be able to stand on their own.”

That diversification also allows the company to continue investing in agent services without cutting value — a key consideration in a competitive recruiting environment.

A shifting role for MLSs and portals

Kelly also weighed in on ongoing debates around private listings, portals and the role of MLSs.

HomeServices’ participation in Zillow’s “coming soon” offering, he said, was less about making a strategic shift and more about expanding distribution channels where public marketing is already allowed.

“It was just another distribution channel,” he said.

Looking ahead, Kelly expects MLSs to increasingly function as technology providers rather than rule-setting bodies. Those that adapt to that role, he said, will be best positioned to succeed.

The industry’s biggest risk

For all the structural changes underway, Kelly said the greatest threat to the industry may be internal.

He warned that fragmentation — particularly around listings and data — could create a more difficult experience for consumers and ultimately weaken the role of the agent.

“If I’ve got to go to 20 different websites to find out what’s for sale, that’s a terrible way to go about it,” he said.

Such a scenario could erode the value of buyer representation and open the door for new forms of disruption.

Simplifying the transaction

Ultimately, Kelly said the next phase of growth for HomeServices — and the industry — will center on simplifying the real estate transaction.

He compared the current process to buying a car by sourcing each component separately, calling it unnecessarily complex for consumers.

The goal, he said, is to bring brokerage, mortgage, title and insurance together into a more seamless experience, both in person and digitally.

“We’ve been a really good strip mall,” Kelly said. “We want to make it more of that singular door.”

For an industry navigating rapid change, that focus on integration — without losing the human connection — may define which models endure.

Listen to the podcast

This article was generated using HousingWire Automation and reviewed by a HousingWire editor before publication. The system helps convert company announcements and industry data into HousingWire-style news coverage.

This post was originally published on here

  • Nationally, sellers outnumber buyers by 43%—just shy of the largest gap in records dating back to 2013. When sellers outnumber buyers, the buyers who are in the market have bargaining power.
  • 38 of the most populous metro areas were buyer’s markets in March, up from 29 a year earlier. Just five were seller’s markets, down from nine in 2025.
  • Home prices rose 5% across seller’s markets last month, compared with a 2% increase in buyer’s markets.

There were an estimated 43.1% more home sellers than buyers in the U.S. housing market in March (or 600,168 more, in numerical terms). That’s just shy of the largest gap in records dating back to 2013 and is up from 28% (or 432,532) a year earlier. The largest gap on record is 45.2% in December 2025.


We define a market where there are over 10% more sellers than buyers as a buyer’s market and a market where there are over 10% fewer sellers than buyers as a seller’s market. A market where the gap is plus or minus 10% is considered a balanced market. By this definition, it has been a buyer’s market since May 2024. 

When sellers outnumber buyers, buyers typically hold the negotiating power because they have options. That’s why a market with a lot more sellers than buyers is considered a buyer’s market. Of course, it’s only a buyer’s market for those who can afford to buy. High housing costs and economic uncertainty have caused many house hunters to retreat, creating an imbalance of buyers and sellers. 

“High property taxes, rising insurance costs and fears about job security are making homebuyers very selective,” said Barb Cooper, a Redfin Premier real estate agent in Austin, TX, where sellers outnumber buyers by 112%. “The buyers who are in the market want turnkey homes in every sense, and they can afford to wait without compromising because we have tons of inventory.”

We estimated the number of buyers using proprietary Redfin data on the typical time from a buyer’s first tour to close of purchase, and MLS data on active listings and pending sales. The estimated number of sellers in the market is simply the number of active listings in the MLS. These estimates, along with median-sale price data in this report, are seasonally adjusted and subject to revision. See a more detailed methodology here and view an interactive dashboard here.

Buyers Are Retreating, Which Is Causing Some Sellers to Retreat


There were an estimated 1.39 million homebuyers in the market in March, just shy of the 1.38 million record low hit in April 2020—the start of the pandemic. That’s little changed from a month earlier but down 10% from a year earlier. 

There were an estimated 1.99 million sellers in the market—the lowest level in a year. That’s down 0.5% from a month earlier and up 0.7% from a year earlier.

Homebuyers and Sellers Have Both Been Backing Off (Line chart)


Home sellers have been retreating in part due to lackluster demand from buyers. Some sellers are delisting after watching their homes sit on the market, while others are choosing not to list at all after seeing nearby homes sell for below the asking price. Redfin did report last month that relistings are beginning to rise as sellers bet on a spring uptick in demand.

There Are 38 Buyer’s Markets, Down From 29 Last Year


Thirty-eight of the 49 U.S. metropolitan areas Redfin analyzed were buyer’s markets in March, up from 29 a year earlier. In five of those markets, there were over twice as many sellers as buyers. 

The strongest buyer’s market was Miami, which had an estimated 148% more sellers than buyers. Next came Nashville (119%), Austin, TX (112%), San Antonio (109%) and Las Vegas (101%). Redfin analyzed the 50 most populous U.S. metropolitan areas and included in this analysis the 49 with sufficient data.

The Sun Belt skyrocketed in popularity during the pandemic, when scores of homebuyers moved in from more expensive parts of the country. To meet surging demand, homebuilders ramped up activity, which is one reason there are now a lot more homes for sale than people who want to buy them. The buyer pool has also shrunk because soaring housing costs in recent years have priced many people out of the market.

New construction can have a significant influence on whether negotiating power lies with buyers or sellers because it impacts the balance of supply and demand. The South and the West have historically issued the most building permits, while the Northeast and the Midwest (where the five seller’s markets are located) have issued the fewest.

Florida and Texas, in particular, build more homes than other states. Florida has also been grappling with intensifying natural disasters, soaring insurance premiums and rising condo HOA fees, which has prompted some homeowners to leave. Miami, specifically, frequently shows up as a buyer’s market because it has a lot of housing supply, which could be in part due to the high number of condos. 

There Are 5 Seller’s Markets, Down From 9 Last Year


Just five of the metros Redfin analyzed were seller’s markets in March, down from nine a year earlier.

The strongest seller’s market in March was Newark, NJ, which had an estimated 30.4% fewer sellers than buyers. The other four seller’s markets were Nassau County, NY (-28%) Montgomery County, PA (-26.2%), Milwaukee (-19.7%) and New Brunswick, NJ (-12.5%). 

On average, home prices rose 4.8% year over year across the five seller’s markets in March, compared with a 1.6% increase across the 38 buyer’s markets—an indication that buyer’s markets offer house hunters more leverage. 

Metro-Level Summary: 50* Most Populous Metros (March 2026)

U.S. metro area Balance of power Percent by which sellers outnumber buyers Buyers Sellers
Anaheim, CA  Buyer’s Market 43.6% 5,079 7,293
Atlanta, GA  Buyer’s Market 70.4% 22,692 38,656
Austin, TX  Buyer’s Market 112.1% 8,509 18,043
Baltimore, MD  Balanced Market -5.9% 10,851 10,205
Boston, MA  Balanced Market -1.4% 10,952 10,794
Charlotte, NC  Buyer’s Market 88.7% 9,057 17,087
Chicago, IL  Balanced Market 1.4% 25,427 25,795
Cincinnati, OH  Buyer’s Market 30.7% 6,409 8,379
Cleveland, OH  Balanced Market -4.2% 7,310 7,006
Columbus, OH  Buyer’s Market 22.8% 7,081 8,698
Dallas, TX  Buyer’s Market 86.7% 17,001 31,743
Denver, CO  Buyer’s Market 37.2% 11,837 16,245
Detroit, MI  Buyer’s Market 48.7% 4,910 7,304
Fort Worth, TX  Buyer’s Market 69.2% 7,923 13,404
Houston, TX  Buyer’s Market 96.5% 22,965 45,122
Indianapolis, IN  Buyer’s Market 23.6% 7,723 9,543
Jacksonville, FL  Buyer’s Market 58.7% 7,751 12,304
Kansas City, MO  Buyer’s Market 21.8% 7,190 8,756
Las Vegas, NV  Buyer’s Market 100.7% 7,110 14,272
Los Angeles, CA  Buyer’s Market 58.6% 14,392 22,819
Miami, FL  Buyer’s Market 147.9% 7,806 19,347
Milwaukee, WI  Seller’s Market -19.7% 6,488 5,210
Minneapolis, MN  Balanced Market 9.0% 12,833 13,989
Montgomery County, PA  Seller’s Market -26.2% 6,905 5,094
Nashville, TN  Buyer’s Market 119.0% 7,398 16,202
Nassau County, NY  Seller’s Market -28.0% 9,978 7,181
New Brunswick, NJ  Seller’s Market -12.5% 9,918 8,679
New York, NY  Buyer’s Market 12.6% 24,811 27,946
Newark, NJ  Seller’s Market -30.4% 8,153 5,672
Oakland, CA  Buyer’s Market 36.0% 4,457 6,060
Orlando, FL  Buyer’s Market 81.4% 9,965 18,075
Philadelphia, PA  Buyer’s Market 35.2% 6,047 8,176
Phoenix, AZ  Buyer’s Market 79.1% 18,415 32,979
Pittsburgh, PA  Buyer’s Market 55.3% 6,030 9,364
Portland, OR  Buyer’s Market 45.5% 7,502 10,914
Providence, RI  Balanced Market -1.9% 4,202 4,124
Riverside, CA  Buyer’s Market 66.4% 11,537 19,196
Sacramento, CA  Buyer’s Market 34.5% 5,664 7,617
San Antonio, TX  Buyer’s Market 109.0% 9,059 18,932
San Diego, CA  Buyer’s Market 29.2% 6,272 8,103
San Francisco, CA  Buyer’s Market 12.1% 2,592 2,905
San Jose, CA  Buyer’s Market 28.5% 2,635 3,387
Seattle, WA  Buyer’s Market 34.9% 7,681 10,359
St. Louis, MO  Buyer’s Market 17.8% 8,754 10,312
Tampa, FL  Buyer’s Market 82.7% 13,064 23,869
United States of America Buyer’s Market 43.1% 1,392,693 1,992,861
Virginia Beach, VA  Buyer’s Market 14.7% 6,797 7,794
Warren, MI  Buyer’s Market 16.7% 7,935 9,258
Washington, DC  Buyer’s Market 14.9% 15,829 18,190
West Palm Beach, FL  Buyer’s Market 94.0% 8,090 15,694

*Fort Lauderdale, FL has been removed due to insufficient data.

The post Homebuyers Hold the Negotiating Power In 38 Major Metros, Up From 29 Last Year appeared first on Redfin Real Estate News.

This post was originally published here

Aziz Sunderji, housing economist and founder of data visualization consultancy Home Economics, also provided data and analysis for this report. 

  • Late April is a sweet spot for sellers; nationwide, homes listed during that period have the highest chance of selling fast and fetching more than the asking price. This is from a Redfin and Home Economics analysis. 
  • Real estate is local. On the West Coast, March is typically the best time to put a home on the market; on the East Coast, May tends to be best. 
  • The best time to sell varies by region, but the swings are bigger in some parts of the U.S. than others. Places with mild weather and more supply are generally less seasonal. Places with more extreme weather or tight supply are more seasonal.  
  • The picture is more complex for buyers: House hunters have the most homes to choose from in late April, but they get the best deals in July. 


The best time to list a U.S. home for sale is the end of April. Sellers are most likely to sell their home above the asking price, and to sell a home quickly, when they list during that period. 

The advantages of listing in late April: 

Sellers get stronger offers

  • They’re more likely to sell above the asking price. Homes listed at the end of April are 18% more likely to sell above their original asking price than the rest of the year–the highest likelihood of all 52 weeks. 
  • Prices are higher. The median home-sale price is 4% higher for homes listed at the end of April than the yearly average sale price, the biggest premium of the year. That’s because there are more buyers and more competition—and also partly because better homes tend to be listed in the spring. 

Homes sell faster

  • They’re more likely to sell within 2 weeks. Homes are 17% more likely to sell in two weeks at the end of April than the yearly average, also the highest likelihood of the year. 
  • They spend less time on the market.  Homes listed in late April spend about 9% fewer days on market than the yearly average.

Sellers face less competition 

  • There are fewer homes for buyers to choose from. Sellers face less competition at the end of April than later in the spring or over the summer. There are typically 8% fewer homes for sale at the end of April than the peak reached in late summer. As spring goes on, the total number of homes for sale increases, peaking in the summer, giving buyers more choices and upping competition among sellers. 

This is according to a Redfin and Home Economics analysis of housing market data. Please see the end of this report for more on methodology 

“Late April hits a sweet spot for home sellers: buyers are out in force, but the market isn’t yet flooded with competing listings,” said Aziz Sunderji, housing economist and founder of data visualization consultancy Home Economics. “For sellers, timing can meaningfully shape the outcome of their home sale. Listing in that late-April window can help generate stronger early interest and create the kind of competition that leads to faster sales and better terms. Sellers who list earlier in the spring may miss peak demand, while those who wait until later risk getting lost in a growing pool of listings. If you’re preparing to sell, it’s worth aligning your timeline—pricing, staging, and marketing—so you’re ready to hit the market during this brief but advantageous window.”

Sellers should keep in mind that this analysis identifies the best time to list their home based on general trends, and assumes a stable market. The best time could shift to a different period in a year when the market experiences dramatic, unexpected shifts. 

Additionally, the best time to sell a home is different for different people. Selling (or buying) a home is typically the biggest financial decision people make in their lives, and personal factors matter in terms of timing. For someone who is offered their dream job in another state in September, for instance, listing their home in the fall probably makes more sense than listing in April. 

It’s also worth noting that most home sellers are also buyers. That means many sellers factor in the best time to buy when deciding when to sell. They may want to sell earlier in the season rather than later, so they have more time to find their next home. For more on the best time to buy, see the last section of this report. 

In California, the Best Time to List Is Before Spring Even Starts. In Parts of the East Coast, It’s Just Before Memorial Day. 


The best time to list a home for sale varies from metro to metro. Generally, the optimal time to list is earlier on the West Coast and in Texas, and later in the Northeast and the Rust Belt. This is based on the same metrics we used to calculate the national best time to list: The time of year when sellers have the best chance of selling their home faster and for more money. 

Places where the prime time to sell is March:

    • San Jose, CA: Middle of March
    • San Diego and Washington, D.C.: Mid-to-late March
    • Seattle, San Francisco, Portland, OR, Oakland, CA and Denver: Late March 

Places where the prime time to sell is May or June:

    • West Palm Beach, FL: Mid-to-late June
    • Philadelphia: Middle of May 
    • Las Vegas, Milwaukee and New Brunswick, NJ: Beginning of May 

Real estate is local. In places like California and Texas, the spring market tends to kick off earlier thanks to milder weather and a longer home-shopping season, so sellers who list in March are better positioned to capture motivated buyers before competition builds. Markets in the Northeast often heat up later in the year, when the snow has melted and warmer days are bringing house hunters out of hibernation. 

“The best week to list isn’t one-size-fits-all. Sellers should think locally,” Sunderji said. “Pay attention to when inventory typically ramps up, and when local buyers are most active. Listing just ahead of that surge—whether that’s March in Silicon Valley or May in Milwaukee—can help your home stand out, attract more serious buyers, and sell quickly for the price you want.”

Timing Matters—But It Matters More in Some Parts of the Country Than Others


The best time to sell a home—and buy a home—varies from metro to metro, but the swings are bigger in some parts of the U.S. than others. In the southern part of the country, where weather tends to be warmer, the swing in how many new listings hit the market by season is fairly small. In the northern part of the country, which has more extreme weather, the swing in new listings is bigger. Another important factor is supply: Highly populated areas with limited supply tend to be more seasonal. 

The metros with the least seasonal housing markets, i.e. where the seasonal swing in listings is smaller, are in Florida. Tampa is the least seasonal of all. Next come Fort Lauderdale, Miami, West Palm Beach and Orlando . The next two are also located in places with warm weather throughout the year: Phoenix and Las Vegas.

On the other end of the spectrum, the places with the most seasonal metros are either in colder climates or they’re in the Bay Area. San Francisco has the most seasonal market in the nation. Next come Boston,  Seattle, San Jose, CA and Minneapolis.

“The fact that the Bay Area has the most seasonal housing market shows that seasonality isn’t just about weather–it’s also about supply,” said Asad Khan, a senior economist at Redfin. “In places like San Francisco and San Jose, where there are a lot of house hunters and limited inventory, timing matters a lot. It becomes a bit like musical chairs: Sellers want to list when they’ll have the best chance of finding their next home, so everyone converges during the same window. In places with more inventory, like Detroit or Columbus, OH, buyers can be more flexible, which gives sellers more flexibility, too, dampening those seasonal swings even though the winters are colder.”

Buyers Get More Choices Earlier in the Year, But Better Deals Later 


The picture is more complex for homebuyers. Buyers need to balance choice and competition. More inventory to choose from improves the chance of finding the home that’s right for them. But competition creates more urgency and requires stronger offers to win a home.

To capture this tradeoff, we identify three key moments for homebuyers:

  • Most new listings. The flow of new listings of homes for sale typically peaks in late spring and continues through early summer. This is when picky buyers are most likely to see the widest selection of listings right when they hit the market. 
  • Most inventory. The bullet point above is about brand-new listings; this one is about “fresh” listings–those that have been on the market for no more than 60 days.  The number of fresh listings typically peaks in mid-summer. This is when flexible buyers with more time have the biggest selection to choose from.
  • Best deals. Discounts off a home’s original asking price—through price drops and/or negotiations between buyer and seller—grow in late summer and peak in early fall. But discounts typically plateau or shrink heading into winter, even as inventory declines. This moment captures the last point when both choice and discounts are working in the buyer’s favor. Winter isn’t an ideal time for bargain hunters because by the time it rolls around, sellers may be more likely to wait for spring’s new buyers than make concessions. 

“The right time to purchase a home depends on a buyer’s flexibility,” Khan said. “New listings peak in late spring, but that’s also when competition between buyers is most intense. House hunters should shop earlier if time is tight and finding the right home in the right location is the top priority. But for more flexible buyers, inventory will grow until mid-summer. Buyers also have more negotiating power heading into the fall, and while inventory is somewhat picked over, there are still quite a few homes to choose from. For many buyers, the sweet spot may be somewhere in between.”

Best Time to Buy a Home, Metro-Level Summary

Please note that this table includes 3 key moments for buyers; it’s important for buyers to balance what’s most important for them–choice or price

Most New Listings Most Fresh Inventory Best Deals
Anaheim, CA Mid May Late June Late August
Atlanta, GA Mid May Mid July Early September
Austin, TX Mid May Early July Late August
Baltimore, MD Early May Early June Mid September
Boston, MA Mid May Mid July Early October
Chicago, IL Mid May Early June Early October
Cincinnati, OH Mid May Mid July Mid October
Cleveland, OH Mid May Mid July Late October
Columbus, OH Late June Mid July Mid October
Dallas, TX Late June Early August Mid September
Denver, CO Mid May Mid July Early September
Detroit, MI Early August Early September Mid December
Fort Lauderdale, FL Early February Late March Mid December
Fort Worth, TX Late June Mid August Mid September
Houston, TX Late May Mid July Late September
Indianapolis, IN Mid May Mid July Mid October
Jacksonville, FL Early May Mid May Mid September
Las Vegas, NV Late May Mid June Late September
Los Angeles, CA Mid May Mid July Mid September
Miami, FL Early February Late March Mid December
Milwaukee, WI Mid May Mid July Early November
Minneapolis, MN Mid May Mid July Early October
Montgomery County, PA Mid May Early June Mid October
Nashville, TN Mid May Mid July Mid September
Nassau County, NY Mid May Late June Late August
New Brunswick, NJ Mid May Early June Early October
New York, NY Mid May Early June Mid August
Newark, NJ Mid May Early June Late August
Oakland, CA Mid May Mid July Late August
Orlando, FL Early May Mid July Early October
Philadelphia, PA Mid May Early June Mid October
Phoenix, AZ Late March Early April Late October
Pittsburgh, PA Mid May Early July Mid October
Portland, OR Mid May Mid July Late August
Providence, RI Mid May Late June Mid October
Riverside, CA Mid May Mid June Early November
Sacramento, CA Mid May Mid July Late August
San Antonio, TX Late May Mid July Mid September
San Diego, CA Mid May Mid July Mid September
San Francisco, CA Late September Late October Late September
San Jose, CA Mid May Early June Late August
Seattle, WA Mid May Mid July Early September
Tampa, FL Late March Early April Early November
Virginia Beach, VA Early May Mid June Mid October
Warren, MI Mid May Late August Late October
Washington, DC Early May Early June Late September
West Palm Beach, FL Early February Late March Mid December

Here’s a video from Daryl Fairweather, Redfin’s chief economist:

Methodology 


This is according to a Redfin and Home Economics analysis of housing market data. 

  • We created a seasonal index for each week within a given year and region by dividing the weekly value of each metric by that year’s annual average. For median sale prices, the seasonal index was computed on a series detrended using OLS.
  • We then average the seasonal index for each week-of-year between 2015-2019 and 2023-2025; we excluded 2020-2022 because the pandemic skewed seasonal effects during that time. 
  • For the seasonality map, we measured the seasonal range of new listings by county as the difference between the maximum and minimum of the seasonal index for new listings.     
  • To identify the best time to list, we normalize four seller-relevant metrics (share sold in 2 weeks, share sold above list, days on market, sale-to-original-list ratio) to 0–1 within each metro and average them into a single composite score per week. The peak of this composite is the “best week to list” for that metro.
  • To identify the best time to buy, we focus on the seasonal indexes for three metrics: new listings, fresh inventory, and the average discount. 
    • Most new listings: the week when the flow of new listings is greatest relative to the annual average.
    • Most  fresh inventory: the week the stock of active listings with 60 days or less on market is greatest relative to the annual average.
    • Best deals: To identify the period with the “best deals” we identify the moment when the average discount (original list price divided by final sale price) reaches an “inflection point,” meaning it slows or shrinks heading into late fall or winter. We characterize this moment as reflecting the best deals since buyers typically have ample inventory to choose from while discounts approach a local maximum.  To identify these moments, we first fit a smoothed curve to the average discount seasonal index for each region to remove week-to-week noise. Starting from the spring trough—the week when homes sell closest to (or above) their list price—we find the week of maximum slope, representing the period of fastest improvement in the average discount. We then identify the first subsequent week where the slope falls below 10% of that maximum, marking the point where average discounts have largely plateaued. For metros where the slope never drops below this threshold (i.e., discounts continue to grow aggressively through year-end), we use the week of the overall peak discount instead.

The post Late April Is the Best Time to List a Home For Sale appeared first on Redfin Real Estate News.

This post was originally published here

Florida-based Atlantic Avenue Mortgage became the top reverse brokerage firm in the U.S. in 2025, less than four years after its founding, and it sees more room for growth in 2026. 

“We just had our best month ever. We’ve done over $90 million in loan volume in Q1. We expect to certainly be at the top of the broker space. We’re really excited this year,” founder Eric Manley said in a recent interview with HousingWire’s Reverse Mortgage Daily. 

“If the reverse mortgage product had some of these changes that the market has been discussing, it would not only help us, but help others too,” he added. “The more loan originators, the more businesses that offer reverses, the better it is.”

The company, launched in 2022 and now licensed in 35 states, topped the Home Equity Conversion Mortgage (HECM) rankings from Reverse Market Insight with 899 endorsements last year. It also built a staff of more than 70 employees, split between its Florida headquarters and an office in Maryland — including 47 salespeople, according to Manley.

Atlantic Avenue’s production is driven almost entirely by data-powered direct mail, a heavy focus on first-time reverse mortgage borrowers, and a growing share of proprietary products aimed at higher-value homes and more affluent clients.

Manley, who has been in the mortgage industry for a decade, said Atlantic Avenue has already closed more proprietary loans in early 2026 than in all of 2025. It’s leaning on a custom-built CRM system and in-house modeling to refine its targeting and improve conversion rates.

This interview has been edited for length and clarity.

Flávia Nunes: Atlantic Avenue Mortgage became the top reverse mortgage brokerage by HECM endorsements in 2025 after less than four years in business. What is driving this performance?

Eric Manley: I’ve been in the mortgage industry for a little over 10 years. I’ve worked at a lot of bigger mortgage companies, and unfortunately, it becomes a numbers game at some point. We have high retention here at Atlantic Avenue, and it has to do with who we are.

We focus on compliance. More importantly, compliance is trying to treat every interaction – you either enhance the interaction or diminish it with the customer — and take it on the education level.

Atlantic Avenue started a little over three and a half years ago. A few of us moved down to Florida, and now we’re over 70 employees. We have a range of products. We also do some forward mortgages as well, but our focus is the reverse product. That is our sole focus.

FN: What borrowers are you focusing on?

EM: We’re seeing growth across both the traditional, typical reverse mortgage borrower, as well as more affluent borrowers. Many financially strong homeowners now are viewing home equity as part of their retirement strategy.

The reverse mortgage is something that should be used a lot more. It’s an amazing product. There are a lot more people in America who need this product than are using it. The biggest thing that’s sad is when we see older borrowers who have been in the house for 40 or 50 years and, instead of taking out a reverse, they would rather downsize and move to an apartment.

FN: How do you see proprietary products evolving?

EM: We’ve already done more proprietary products this year than in all of last year. We did about 60 to 70 proprietary products last year, and we’re already at around 60 right now. They’re becoming more important, especially for high-value homes and more affluent borrowers. But at the same time, there are additional benefits even for borrowers who aren’t in that situation.

They don’t have the upfront mortgage insurance, which is pretty high. We have the ability to pay off debt, which is huge. The proprietary principal limit factors are, at times, even more competitive than the HECM. Years ago, that wasn’t the case.

There are quite a few times where it still depends on the principal limits for the benefit of the borrower, but you’d be surprised how frequently you’ll see the proprietary loans allow borrowers to get more access to cash. And on top of that, the closing costs are less. From our standpoint, it’s just becoming a more competitive product. There’s a broader reach.

The challenge is education, but we make sure that our team knows the difference between the HECM and the proprietary products. It seems like the secondary market has a better appetite for proprietary products. It’s more flexible as well.

FN: What are your expectations regarding the U.S. Department of Housing and Urban Development (HUD)’s request for information on the HECM and HECM Mortgage-Backed Securities (HMBS) programs?

EM: It’s encouraging that there is an RFI. It shows regulators recognize the importance of the reverse program and are looking for ways to improve it. I know there’s a liquidity side, the efficiency and sustainability side, and looking at some of the articles from the National Reverse Mortgage Lenders Association, probably one of the most important things is the upfront mortgage insurance.

The Mutual Mortgage Insurance Fund is doing very well. Maybe we can reduce the 2% upfront premium and find a better system so that you can put more borrowers into reverse products.

FN: What’s your perspective on some recent broker-lender agreements?

EM: We’ve always had those letter broker agreements. I do think that they’re making some positive steps, and it shows the industry is evolving. There’s better alignment between brokers and lenders. It benefits everyone. That’s always been one of our main focuses at Atlantic Avenue — trying to have the best relationships with third parties. 

But the key to it, even with the agreements there or not, is actually that relationship with them. We have great relationships with our lenders, with the companies, with our AMCs, with our title partners. Regardless of what those agreements say, the most important thing is having that human to human interaction with lenders and really working as a team, even though they’re different companies.

The agreements are great, but they alone aren’t the solution. The long-term success still depends on fair economics between both sides, strong support and product availability.

FN: These agreements are also seen as a way to deal with refinance churning. How are Atlantic Avenue’s originations split between purchase and refis?

EM: The HECM endorsement reports show us as more heavily weighted toward HECM-to-HECM. But last year, over 40% of our loans were what we call FTRs – first-time reverse. We had months last year where over 60% of our business was first-time reverses.

It is something we’re expanding. We’re really honing in on our marketing to continue to grow that out. Probably the most important thing we can do is put as many loans as we can into this space and educate as many people as we can for the first time.

FN: How are you attracting more borrowers, and what is the main source of your leads?

EM: We focus on direct-mail marketing. That’s all we do. We’ve tried web marketing as well, and it’s really hard to qualify. We get a lot of referrals in the South Florida area, but it takes a long time to build out that referral network. We think that data-driven marketing is the way to go. That really separates us.

The biggest room to grow is in the FTR proprietary space, because there are already people who have proprietary loans and people are refinancing them. But one thing we’d like to focus on is growing that pool of affluent first-time reverse borrowers, which is a tough code to crack and has a lot to do with behavioral marketing.

We have tried social media. It’s good to show brand awareness. We’ve done Google ads. The juice is not worth the squeeze, at least for our level. If we were a big lender, we’d probably do it just to keep the brand out there. Unfortunately, you get a lot of people who don’t qualify, and you can educate them, but at the same time I still need to make sure we’re providing our sales floor with qualified leads.

FN: How do you deploy technology, AI and data in your marketing strategy?

EM: We do a lot in-house. We have our own custom-built CRM, which is constantly evolving. And then we have numerous models, different mail strategies and something we update weekly. I think that’s what really separates us, how focused we are on data.

We buy the data from various vendors. We try to buy the best data we can, both property and credit data, and we try to make sure that we’re targeting the people we think have the best chance of qualifying as well as responding. The team we have working on our models understands reverses. It’s really hard to find people who like the reverse space and at the same time want to dedicate a lot of time to figure out how we can build it out.

A lot of companies would do auto dialing. I’m really against auto dialers. It’s not good business. Same with trigger leads. I believe those are done. We’ve never done anything like that. We’ve done manual outbounds at times, but we don’t do this often.

FN: How has Atlantic Avenue performed so far in 2026?

EM: We just had our best month ever. We’ve done over $90 million in loan volume in Q1. We expect to certainly be at the top of the broker space. We’re really excited this year. We certainly expect 2026 to be our best year yet, especially with the pace we’re on.

If the reverse mortgage product had some of these changes that the market has been discussing, it would not only help us, but help others too. The more loan originators, the more businesses that offer reverses, the better it is. Unfortunately, some businesses don’t like the idea of competition. The more competition there is, the better. It raises the standards and requires you to be more educated on the products.

This post was originally published on here

The home inspection industry is undergoing a quiet shift that directly impacts mortgage origination timelines, closing procedures, and lender risk assessment. As the owner of an inspection company, with over 3,000 inspections completed across Texas’s fastest-growing markets, I’m seeing trends that fundamentally reshape how lenders, agents, and buyers approach the inspection phase of the transaction.

Thermal imaging becomes standard, not premium

Five years ago, thermal imaging was a luxury add-on. Today, it’s becoming baseline. Infrared technology reveals what the naked eye cannot: missing insulation, air leakage patterns, moisture intrusion, and hidden electrical hotspots. For mortgage originators, this matters considerably. A complete thermal imaging report reduces post-closing defect claims by identifying issues before funding, which directly protects lender collateral and reduces early payment defaults caused by expensive surprise repairs.

In the Austin-San Antonio I-35 corridor, where rapid new construction dominates, thermal imaging has become necessary for identifying shortcuts in insulation and HVAC installation. Lenders working with new construction clients in Kyle, New Braunfels, and Round Rock increasingly request thermal imaging reports as a condition of commitment. A trend is unlikely to reverse.

Video walkthrough reports are replacing static PDFs

Static inspection reports are becoming vestigial. Buyers and agents increasingly expect video walkthrough reports. narrated, timestamped documentation of every defect with visual evidence. This serves multiple stakeholder interests: buyers see exactly what the inspector saw; agents have defensible documentation for their MLS disclosures; and lenders have video-backed evidence of collateral condition at inspection.

The operational benefit for originators is subtle but significant. When a repair dispute arises post-underwriting, you have video evidence rather than conflicting interpretations of written reports. This reduces loan file friction during quality control and underwriting review.

Bundled services and In-depth due diligence

Buyers and lenders increasingly demand detailed due diligence. Beyond the standard home inspection, commercial clients now routinely request crawl space evaluations, foundation elevation surveys, septic system inspections, WDI/termite reports, and thermal imaging as bundled packages. The in-depth approach reduces the risk of major undisclosed defects that could trigger renegotiation post-inspection or post-closing.

For mortgage originators, the message is clear: thorough, bundled inspection protocols lower overall credit risk. A buyer who knows the true condition of the foundation, HVAC, roof, and septic system is less likely to experience buyer’s remorse or post-closing disputes that impact loan performance.

11-month warranty inspections on new construction

New construction is booming across the Austin market, and so is a new service: 11-month warranty inspections. These occur just before the builder’s one-year warranty expires, allowing homeowners to formally document defects before their recourse period ends. For lenders, this trend is powerful: it encourages buyers to uncover defects during the warranty period rather than walking away from the property or facing legal disputes years later.

The I-35 corridor is experiencing unprecedented growth, and much of that growth is new construction. New homebuyers increasingly understand that an 11-month inspection is not optional, it’s critical self-defense. This service has become standard request in hot markets like Kyle, San Marcos, and Buda.

Closing timelines and inspection pressure

These trends are compressing closing windows. Broad inspections with video reports, thermal imaging, and specialty inspections (foundation, crawl space, septic) require time. Originators who build 7-10 business days into their inspection timeline, rather than the old 3-5 day standard, experience fewer rushed decisions and reduced post-closing disputes.

The bottom line for lenders

Home inspection trends are not cosmetic. They reflect a market-wide recognition that thorough, documented due diligence protects all stakeholders. Originators who incorporate these evolved standards into their loan origination workflows, such as thermal imaging, video reports, and broad defect documentation, are investing in better credit outcomes and reduced post-closing litigation risk.

The inspection phase is no longer a formality. It’s a critical control point for collateral assessment and borrower confidence.

Shawn Patterson is the owner of CenTex Inspection Services.
This column does not necessarily reflect the opinion of HousingWire’s editorial department and its owners. To contact the editor responsible for this piece: zeb@hwmedia.com.

This post was originally published on here

As automation reshapes mortgage operations, the industry’s next challenge is to help borrowers navigate the complex decisions that shape their lives—not just to close the loan faster.  

For the better part of a decade, the mortgage industry has been obsessed with a single metric:  speed. We have poured billions into “Sales Infrastructure”—digital applications and lead generation engines designed to capture consumers in seconds. We built high-performance engines to get borrowers to the starting line, but we often forgot to pave the road to the finish line.  

Every generation inherits a financial system built for someone else. Today, as individuals move toward financial independence, they are immediately confronted with binding commitments — where to live, how to finance transportation, and how much debt is sustainable. These decisions shape the next 20 to 40 years of their lives. Yet the modern financial system treats these as isolated transactions, evaluated independently and explained not at all.  

We don’t have a speed problem; we have a navigation problem. In today’s market, the bottleneck is rarely getting the customer into the funnel; it is navigating the “administrative rot”  that exists between the application and the deed. To move forward, the industry must transition from a sales-distribution model to a Navigation Infrastructure model.  

The administrative rot: Why speed is an illusion  

In a traditional workflow, a “fast” approval is often a hollow victory. A borrower may receive an answer within minutes, but rarely an explanation. Technology has become remarkably good at determining whether a borrower can be approved, but it remains structurally incapable of guiding them through the approval process.  

This is largely because the system rewards execution and throughput rather than restraint or understanding. Efficient file movement is a measure of success. No operational dashboard celebrates the time spent explaining why a decision might be suboptimal — such as qualifying for a 30-year term when a 20-year structure would preserve long-term liquidity — because that time does not monetize cleanly within traditional commission structures.  

As a result, borrowers often mistake access to credit for an endorsement of their decision. They believe they have made an informed choice when, in reality, they have merely complied. This  “administrative rot” is not a failure of ethics, but a failure of system design. The next phase of innovation must focus on a system that works for the person, not just the transaction.  

Navigation infrastructure: The operating system for ownership  

Navigation Infrastructure represents a fundamental shift from reactive data collection to proactive orchestration. It was not conceived as a minor improvement to the application process,  but as a response to a structural absence in finance: the absence of guidance. 

Think of this infrastructure as “Air Traffic Control” for the journey from application to settlement. It does not exist to advise on which products are “best” — an act that would merely recreate old incentive conflicts. Instead, it serves as a guide through the application process itself, ensuring that the borrower navigates on a foundation of verified facts rather than speculation.  

This infrastructure relies on three operational pillars:  

1. Truth as Infrastructure: Establishing financial truth once, directly at the source, and preserving it as a reusable foundation so borrowers don’t have to re-upload the same documents repeatedly.  

2. Middle-Office Orchestration: Automatically identifying what needs to happen next in an application and triggering it instantly to remove human “phone tag”.  

3. Real-Time Connectivity: Using advanced APIs to ensure the lender and the borrower are always looking at the same map, updated in real-time.  

The shift from “search” to “resolution”  

The greatest friction in the current system is that every application resets the process. Every lender rebuilds the same picture from zero, leading to preventable denials and borrower fatigue.  

Navigation Infrastructure solves this by treating financial truth as infrastructure — not paperwork.  By tracking not just “Is this true?” but “When was this verified and how does it age?”, the system introduces an awareness of time into the process. This allows the infrastructure to understand the  reliability of a borrower’s data over time rather than just their point-in-time eligibility.  

The Workflow Impact: 

Consider how these changes the daily reality of a loan file:  

 The Title Hurdle: A rental management judgment typically surfaces days before closing.  In a traditional model, a processor discovers the defect and leaves a voicemail, leaving the file in limbo for 48 hours. In a navigation model, the system identifies the defect and instantly triggers automated outreach for a payoff statement, clearing the hurdle weeks before the scheduled closing.  

 The Verification Loop: Instead of a borrower chasing their employer for a new paystub because a 30-day window expired, the system maintains a “living foundation”. It knows  when employment continuity was last validated and can automatically refresh that truth at  the source, preventing late-stage surprises.  

The transparency dividend  

In the modern financial system, the true status of a transaction is often difficult to observe. A  Navigation Infrastructure addresses this by building “explainability” into the process. 

Every event is source-level, time-stamped, and normalized. This creates an auditable chain of truth that strengthens compliance for lenders and improves transparency for regulators. For the  borrower, this represents a “Transparency Dividend.” Instead of navigating in the dark, they are given a clear view of their verified financial reality and how it aligns with the system’s requirements.  

The human-AI partnership  

This infrastructure does not replace the need for professional judgment. As operational complexity declines through automation, the industry must ask: where should human expertise create the most value?  

The role of the professional is elevated, not diminished. By liberating experts from  administrative tasks such as chasing documents and manual follow-ups, a Navigation  Infrastructure allows them to focus on high-value guidance. The technology handles the logistics of the “last mile” of the transaction, while the human professional remains the ultimate pilot of the ship.  

Conclusion: The new industry standard  

The mortgage industry has spent decades perfecting the process of efficiently producing loans. The next phase of innovation must focus on helping borrowers navigate the complex decisions  that shape decades of their lives.  

Real estate is the largest asset class in the world, yet we have tried to navigate it using fragmented maps and manual labor for too long. A robust Navigation Infrastructure is the missing counterpart to traditional lending—a guide that works for the person, not just the transaction.  

The firms that will dominate the late 2020s are those that stop buying “tools” and start investing  in “infrastructure.” It is time to stop celebrating how fast we can find a problem and start measuring how efficiently we can navigate to a resolution.

Gerald Green is the founder of Veri-Search.
This column does not necessarily reflect the opinion of HousingWire’s editorial department and its owners. To contact the editor responsible for this piece: zeb@hwmedia.com.

This post was originally published on here

IRVINE, Calif. — U.S. residential foreclosure activity rose in the first quarter of 2026, signaling renewed stress in segments of the housing market as higher borrowing costs continue to weigh on homeowners, according to a report released April 17, 2026, by real estate data firm ATTOM.

A total of approximately 95,000 properties had foreclosure filings in Q1 2026, up from the previous quarter and marking a notable increase from a year earlier, ATTOM said. “Foreclosure activity is starting to tick up again as the market adjusts to higher interest rates and affordability constraints,” Rob Barber, CEO of ATTOM, said in the report, noting that while levels remain below pre-pandemic norms, “we are clearly seeing a shift from the historically low foreclosure environment of the past few years.”

The increase comes as mortgage rates remain elevated compared to pandemic-era lows, putting pressure on borrowers with adjustable-rate loans or those facing income disruptions. According to Freddie Mac data released April 11, 2026, the average 30-year fixed mortgage rate has hovered near 6.7%, significantly higher than the sub-3% levels seen in 2021. “Higher rates continue to strain affordability and increase the risk of delinquency for more vulnerable borrowers,” said Sam Khater, Chief Economist at Freddie Mac, in a weekly market commentary.

Regional data suggests the rise is uneven, with certain states accounting for a disproportionate share of filings. ATTOM reported that California, Florida, Texas, and Illinois led the nation in total foreclosure activity in the first quarter. “These are large housing markets where even small shifts in economic conditions can translate into significant changes in foreclosure numbers,” Rick Sharga, Executive Vice President of Market Intelligence at ATTOM, said on April 17, adding that localized job markets and home price dynamics are key drivers.

Labor market conditions remain a critical factor in determining whether foreclosure activity accelerates further. While unemployment remains relatively low, economists warn that any softening could quickly translate into housing stress. “The housing market is particularly sensitive to changes in employment, and even a modest uptick in job losses could lead to higher foreclosure rates,” said Diane Swonk, Chief Economist at KPMG U.S., in a research note published April 16.

At the same time, home equity levels are providing a partial buffer for many homeowners. Rising home values over the past several years have allowed some distressed borrowers to sell rather than enter foreclosure. “Strong equity positions continue to act as a safety valve,” said Lawrence Yun, Chief Economist at the National Association of Realtors, on April 15, noting that “most homeowners still have options that weren’t available during the last housing downturn.”

Still, analysts caution that the trend bears watching as financial conditions remain tight. “We’re not looking at a foreclosure crisis, but the direction of the data is clearly upward,” said Mark Zandi, Chief Economist at Moody’s Analytics, on April 17. “If interest rates stay higher for longer and economic growth slows, foreclosure activity could continue to increase into the second half of the year.”

What comes next will depend largely on the path of interest rates, the resilience of the labor market, and whether policymakers succeed in stabilizing housing affordability—factors that will determine whether this uptick remains contained or evolves into a broader housing market concern.

JBizNews Desk

A ton of housing data snapped back last week as it should have from the holiday-impacted week before: active inventory, new listings and weekly pending home sales all grew above trend. This usually happens when we have a major holiday the previous week that slows data, but mortgage rates have also fallen and we are almost back below 6.25% again. So, was the growth more of a rebound from Easter or falling mortgage rates? Let’s take a look and find out.

Weekly pending sales

Our weekly pending home sales data provides a week-to-week perspective, though results can be affected by holidays and short-term fluctuations such as Easter weekend. Housing demand snapped back from the previous week’s negative year-over-year print. Was it all about mortgage rates falling? I don’t believe so. We usually do get a rebound from a holiday week, and we weren’t far off from showing growth in the data. So, I am going with more Easter-week snapback than rates.

Weekly pending sales usually take 30-60 days to hit the sales data. Typically, mortgage rates above 6.64% and those breaking over 7% really impact the data negatively. Under 6.25% has been the sweet spot over the past several years, excluding short-term variables.

Weekly pending sales last week over the last two years:

  • 2026: 73,241
  • 2025: 71,775

Mortgage purchase application data

Purchase application data is a forward-looking indicator: growth here leads home sales by roughly 30-90 days. Last week, we saw a 1% week-to-week decline and a 3% year-over-year decline. Higher mortgage rates have impacted this data line, and we aren’t back below 6.25% yet, but this week’s data should be interesting as rates have fallen closer to 6.25%.

For purchase apps, what I really value is at least 12-14 weeks of positive week-to-week data. If we can get that positive week-to-week data to go with year-over-year growth, then we have something cooking. For 2026, we are basically flat on the week-to-week data, while showing positive year-over-year data up until rates rose. 

Here’s 2026 so far:

  • 6 positive week-over-week prints
  • 7 negative week-to-week prints
  • 1 flat week-to-week print
  • 7 weeks of double-digit year-over-year growth
  • 12 weeks of positive year-over-year growth
  • 2 negative year-over-year print

visualization

10-year yield and mortgage rates

In the 2026 HousingWire forecast, I anticipated the following ranges:

  • Mortgage rates between 5.75% and 6.75%
  • The 10-year yield fluctuating between 3.80% and 4.60%

We recently saw a positive move in the 10-year yield and mortgage rates as the bond market has been trying to get ahead of any Iran war deal. Both times we have heard about an end to the Iran conflict, the 10-year yield has gotten back toward 4.24%. Mortgage spreads are also improving, so mortgage rates are closer toward 6.25% now.

We shall see what Monday and this week brings, but for the entire year, we have still stayed within the range I believe we should stay in for 2026 as rates have ranged between 5.98% and 6.64%.

visualization

Mortgage rates ended the week at 6.29% according to Mortgage News Daily and 6.43% according to the Polly rate lock data.

Mortgage spreads

Mortgage spreads remain a positive story for housing in 2026, as mortgage rates would have easily been over 7% in 2023 and 2024, and close to 7% in 2025, given the current 10-year yield level and the worst spread levels back then. The spreads were already deteriorating in February as yields fell, compressing volatility on the downside. The war took the spreads toward 2.11%, but now they are back down to 2%.

visualization

Historically, mortgage spreads have ranged from 1.60% to 1.80%. Last week, spreads closed at 2%, down from 2.05% the week before.

However, I wanted to compare last week’s rates to the worst levels of the spreads over the past three years, given the 10-year yield at its current level.

  • If we had the worst mortgage spread levels of 2023, mortgage rates would be 7.39% today, not 6.29%.
  • If we had the worst levels of 2024, mortgage rates would be 7.02% today.
  • If we had the worst levels of 2025, mortgage rates would be 6.83% today.

Housing inventory

Housing inventory growth was very small two weeks ago, which was impacted by Easter. Now, we have had a solid week of inventory growth, which is the rebound impact, so if you average the two weeks out, the inventory growth story has really stayed the same this year.

We have gone from 33% year-over-year growth in inventory at the highest point in 2025 to 3.21% last week. In the past, inventory growth picked up amid higher mortgage rates, softening demand and rising year-over-year new listings. Even with the Iran conflict pushing rates higher from 5.99% toward 6.64% recently, 2026 has had the lowest rate curve for the housing market to work from since 2022, and rates have not gotten above 7% in a while.

  • Weekly inventory change: (April 10-April 17): Inventory rose from 724,977 to 743,006
  • Same week last year: (April 4-April 11): Inventory rose from  702,436 to 719,403

visualization

New listings

I have been disappointed with the new listings data so far this year, as I was hoping we would see some weeks with new listings ranging from 80,000 to 100,000 during the seasonal peak months, which we would see in a normal year from 2013 to 2019. We should at least get over 80,000 this year, as we did last year, but I’m not sure about growth beyond that.

New listings data had a solid week, rebounding from Easter weekend. And remember, for context on these numbers, during the housing bubble crash, new listings ranged from 250,000 to 400,000 per week for several years.

Here is last week’s new listings data for the past two years:

  • 2026: 77,919
  • 2025: 77,005

visualization

Price-cut percentage

Typically, about one-third of homes undergo price reductions before they sell, reflecting the dynamic nature of the housing market. As mortgage rates and inventory rise together, the percentage of price cuts increases.

In my 2026 home-price forecast, I had a negative 0.62% call for the year nationally. However, mortgage rates were lower than I thought they would be at the start of this year, and the FHFA’s announced purchase of mortgage-backed securities pushed mortgage spreads lower than I expected earlier in the year. I believed we would get toward the 1.80% level later.

The price-cut percentage is slightly lower this year than last, and housing inventory has grown very slowly in 2026. 

The price-cut percentage for last week:

  • 2026: 34.65%
  • 2025: 35%

visualization

The week ahead: Iran, Iran, Iran, retail sales, pending home sales, and more

Of course, the news about the Iran conflict runs the show with the bond market, which impacts housing the most.

This week, we will get our first retail sales report post-oil shock, which could be interesting. Pending home sales from the NAR will also come out. The last two months have been more funky than usual with the NAR pending home sales data; at times when it’s negative, the next month’s existing home sales beat estimates, when it’s positive, the existing home sales miss. So, the recent data has been softer with higher rates. The big story will be any new updates on the news from the Iranian conflict.

This post was originally published on here

For nearly two decades, real estate technology followed a predictable playbook: Build an all-in-one platform that does everything, with the CRM, dialer, transaction management and nurture campaigns all under one roof.

But a quiet reversal is underway. A growing number of agents, teams and brokerages are abandoning general-purpose tools in favor of highly specialized solutions designed to do one thing exceptionally well.

To illustrate this shift, HousingWire sat down with Troy Palmquist, founder of HomeCode Advisors — a peer-driven directory and review platform that helps real estate professionals navigate the fast-growing world of proptech.

Palmquist pointed to a new wave of startups redefining specialization.

“I think Rezora was really the first, the one that kind of made me start really realizing what I was seeing,” he said. “Prospecting can be done 1,000 different ways and much of it can now be automated. With voice and outbound dialing, you have more ability to create specific or niche products that serve the purpose of one type of thing.”

Rezora IO — launched in January — is an artificial intelligence (AI) voice prospecting agent that automatically makes calls, qualifies leads, books meetings and syncs calendars. Company co-founder Aidan Richards said seeing real estate move toward specialized tools was a green flag for product development.

“The whole reason that we built this is there are plenty of companies that offer AI voice agents to make phone calls, but not specifically for real estate agents,” he said. “You can pretty easily and quickly create an AI voice agent, but you have to build it from scratch and test it and deploy it.

“Then on top of that, it’s not going to be able to speak specifically like a Realtor would, handle objections the right way and be personalized for this type of conversation.”

Rezora solved this by building its own large language model trained on more than 60 sales books and thousands of real conversations.

During an alpha test in October 2024, agents saw three times the conversion rate versus manual calling, according to the company.

Specialized tools winning on cost, integration

One concern with specialized tools has always been cost — paying for five niche products instead of one bundled platform.

But Palmquist argues that the math favors specialization, especially when integrations are done right.

“Most of these products aren’t that expensive,” he said. “If you get one listing appointment that you didn’t have because of it, did you get a return in your first 30 days? I’d say yes.”

The key enabler, he said, is open integration.

“The companies that are doing really well and seeing growth right now integrate with everything they can,” Palmquist said. “They go about building with the mindset of, ‘I need to plug into X software so I have the most beneficial product and output for my customer.’”

Richards echoed this philosophy.

“Another goal of ours is to integrate on as many platforms as possible, so adding Rezora to people’s CRMs and to lead generation websites and anywhere that Realtors are already spending time,” he said. “We want it so they don’t also have to sign up for this tool and can continue using it. This is supposed to modify your tech stack and not necessarily add to it.”

‘Amazon for AI voice agents’

What makes this moment different, according to Palmquist, is that many of these specialized tools are genuinely novel.

As for whether larger proptech platforms will simply copy the approach of Rezora and similar specialty tools, Richards is unfazed.

“I’d be surprised if any company really tried to get into this, just because the tech investment and the complexity of the agents is really complicated,” he said. “It’s going to get easier, in a sense, but also, at the same time, we’ve got a pretty substantial headstart in terms of tuning in agents, specifically for real estate.”

The road map, he said, is to become “the Amazon of AI voice agents.”

“It would be where there’s one (agent) for every kind of conversation,” Richards said. “So that means you log on, you pay the regular subscription price, and then it tells you, ‘OK, do you want buyer leads, seller leads, expired listings, open houses, wholesale, circle prospecting? All those are already ready to go.’

“Then, hopefully at that point, we would have been deployed to enough brokerages where they wouldn’t even need to create their own agents, because we can just tweak any of ours a little bit for whatever a Compass wants or whatever an eXp wants.”

For agents tired of bloated dashboards and unused features, the shift toward specialized tools that actually replace — rather than multiply — their tech stack could prove welcome.

This post was originally published on here

While many of the same real estate firms may grace the top echelons of the RealTrends Verified Rankings year after year, that is where, at least for many of these firms, the similarities between them end. From cloud-based to franchise networks, specializations and network approaches the top performing firms include a variety of different business models. HousingWire caught up with the leaders of Sotheby’s International Realty and Keller Williams to find out how their chosen models have contributed to the success of their agents and brokers.

Sotheby’s: synonymous with luxury

Known for serving luxury clients across the globe, Sotheby’s International Realty claimed the No. 6 spot among the top-performing brands in the 2026 RealTrends Verified Rankings, with agents affiliated with the brand closing $140.316 billion in sales volume in 2025. 

visualization

Phillip White, the brand’s CEO and president attributed his firm’s success to the global interconnectivity his agents have due to Sotheby’s large footprint. 

“Every year, the real estate market becomes more global and our advisors have really capitalized on the flow of referral back and forth,” White said. 

He believes this flow of clients and referrals helped his brand turn out the strong performance it did in 2025, despite overall housing market conditions in the U.S.

“Last year was a really strong year for us, which was somewhat surprising given that the overall market was only up slightly, and we were up almost 10% in just the U.S. alone,” White said. 

He also highlighted the strong focus he and his team have on maintaining a strong identity and service standard across the brand. 

“I always look at things through the eyes of the consumer and our goal has always been to have a seamless experience for that consumer no matter where in the world they are,” he said. “It is very important for a luxury brand to deliver a close to the same experience from one market to the next.”

According to White, luxury real estate consumers expect a certain level of service.

“In the luxury market it, is really important that you are not providing a cookie cutter experience,” he said. “It is a lot more bespoke and tailored to their individual needs.” 

By focusing solely on luxury consumers, White and his team at Sotheby’s have been able to create experiences and a level of service that luxury clients like and can depend upon.

“That’s how we are able to win the trust of the clientele,” White said. “I think our advantage is that we don’t have to be all things to all people. We have our niche, which is luxury, and we are able to do that really well. We continue to refine what we do and we can do that because we are not trying to cater to everybody.” 

White said this has allowed Sotheby’s to perfect certain parts of the real estate business that matter most to luxury clients, helping the brand attract more and more buyers and sellers. 

“We don’t waste our time on things that we are not necessarily going to be the best at,” he said. “We stick to our lane.” 

For Sotheby’s, finding that niche has been a key to success and White believes a similar strategy can work for any brokerage or agent. But when it comes to figuring out which fits you or your firm the best, White said you must figure out what “fits your heart.” 

“Luxury isn’t for everybody and that is ok,” he said. “You have to follow your dream and your passion, whether that be a specific type of real estate or a service you want to provide, but you need to find that segment and then figure out how best to serve it and if you can scale your business in that space.” 

Once those things are in order, the sky, according to White, is the limit. 

Keller Williams is in the people development business

Real estate franchisor Keller Williams yet again came out of the RealTrends Verified Rankings as the No. 1 brand in the nation by both transaction side count (837,323 sides) and sales volume ($383.086 billion), capturing 20.4% of the market share. 

John Clidy, Keller Williams’ vice president of regional growth, attributes this success to the company’s focus on agent training and education

“Training is paramount,” he said. “At KW, whether you are a new agent or a $100 million producer, there is a training program for you. Over the years, there has been a lot of noise and competition, but we have continued to pour into our people, meet them where they are today and help them get where they want to go next. Everyone is doing all kinds of stuff out there to win, but we just keep developing people and keep training.”  

Clidy said he believes the continued success of Keller Williams’ agents shows that this education-focused model is still relevant. Additionally, he believes a franchise brand is uniquely positioned to provide franchisees with independence and the ability to grow their own companies, while still providing them with valuable support. 

“When you speak to independent companies right now, they are nervous about what the future will be. What will be the next lawsuit? Or, how do I recruit and retain agents in the current environment?” he said. “But we teach that through our community and our culture. That really helps us continue to attract and retain agents.” 

He added that franchises also have systems in place showing franchisees and their agents how to operate a successful business, instead of leaving them to their own devices as they work to get their businesses off the ground. 

“A lot of mega agents and independents that aren’t in a franchise model will ask us how we do things because every time they take on a new endeavor, they are reinventing the wheel. They don’t [always] have the systems or technology in place that we can afford to have because of our model,” Clidy said. 

But while Clidy is a major proponent of the franchise model, he believes that any brokerage model can be successful, but that success depends on the agents. 

“The professional agent will always win,” he said. “They are organized, they know what they are doing, their marketing is in place, they understand the market at a high level. If you have all of those elements in place with the support of your brokerage, that’s where you see firms like us and other brands succeed because we’ve been able to build a great brand with a culture of success.” 

Whether it’s luxury branding, agent count, franchise scale or tight-market specialization, the top performers show that success isn’t tied to a single blueprint — it’s built on clarity, consistency and the ability to adapt as the market shifts. The firms that rise to the top aren’t the ones that look the same, but the ones that know exactly who they are and lean into it.

This post was originally published on here

I became a grandma recently, which has been equal parts magical … and also mildly humiliating. Because apparently, everything we did thirty years ago is now wrong. Like, way wrong. I marvel that my daughter survived to age one.

Put the baby on their stomach? Wrong. Kiss that baby on the face? Not yet, Grandma. Add a blanket and a stuffed animal to the crib? Horrors. Let them cry it out for a few minutes? Essentially a felony.

I did manage to bite my tongue before saying “But we did it this way and you turned out ok …” which I’ve learned, is not considered a compelling, data-grounded argument in 2026.

And honestly?  They aren’t wrong.

Today’s parents have more data, more tools, more access to information – and as a result, they are making different, often better decisions. Not because the old ways were foolish or bad … but because we know more now.

So it got me thinking.

If we can see how parenting tactics have evolved with better information and the ability to look back and see what worked well and what didn’t … why do we still make some of the same mistakes in the mortgage industry that we were making back in 1995?

If there’s one thing that becoming a grandma (“Gigi,” for the record) has reinforced for me, it’s that just because something worked in the past, it doesn’t mean it’s still the best way to do it. And yet, we cling to our old habits like comfy security blankets.

Some of that is understandable, as this is a high-stakes business with much on the line, and old habits that have served well over the market cycles are hard to shed. But some of those old ways of thinking may be costing us growth, talent, revenues and relevance. And this market has exposed some of the places where we simply must evolve.

Here are three places where I think we’re still getting it wrong – and one where I think we are finally doing it exactly right.

Over-reliance on top producers instead of building systems

We know the stats: 30% of loan officers are doing 70% of the production, year after year (InGenius). So we chase them, give big signing bonuses, build entire strategies around making sure they are happy and never want to leave us. But this isn’t a growth strategy, it’s a dependency.

Don’t get me wrong. While I might not have originated enough to be listed in the new HousingWire Mortgage Rankings, I was a decent MLO in my own right – and I have a lot of respect and love for the hard work originators do. 

But I will suggest that the best companies out there have shifted to creating repeatable systems and best practices – supported by technology – that create more consistency and raise up better producers across the board. Think playbooks over personalities. I’ve also found that the best of the best top producers are surprisingly generous, and generally willing to help capture their best practices and habits to help lift others around them.

Designing around the company rather than the customer

Every single mortgage company website says they are customer-centric, customer first, customer is numero uno. But then the processes, tech interfaces and communications are built to make sense for the company, internally. But not externally, to that customer to whom each mortgage company has pledged their undying love and affection. 

Today’s consumer has an expectation of an easy-to-understand process that helps build understanding and trust – and when that isn’t delivered, they notice.

Secret shopping results show that the customer experience in mortgage still has a whole lot to be desired. Not to mention the miserable repeat and retention rates that still hover darn close to 18%, according to the MBA. Where is the love, and what to do?

Test out your process, end to end – and not with an internal eye, but purely the view from the prospect or customer seat. Secret shop in earnest. Survey your customers. And most importantly, stare your results in the face, and be relentless about not just removing friction points – but considering the ways you can delight your customer.  

Underestimating the speed of technology adoption … including AI

AI isn’t coming soon – it’s here, and it’s already infiltrating many unexpected nooks and crannies of our personal and professional lives.  

Yet I know a lot of brilliant, experienced mortgage professionals, from the executive suite to the front lines, who are simply overwhelmed trying to keep up.

Last fall, Ruth Porat, president and CIO of Google and Alphabet talked about AI, stating “I think of it as a time where there are two speeds. One is the speed of change, the speed of breakthroughs, the science that we’re seeing, but the other really important part is a slower speed. And that’s the speed of adoption in a truly substantive way so that each one of us can have that economic uplift that AI offers.” 

So well said – the pace of innovation is far faster than the speed at which humans can adopt it, and it doesn’t seem to be slowing down any time soon.

So what are smart lenders doing? Starting small, but starting immediately. They are building internal AI task forces that include participants from each major department – both to watch for unintended consequences, help find adoption best practices, and to create internal champions to help buy-in across the company. They are focusing on applications that support and serve their staff, not replacing them. That day will come and not just in mortgage, but that’s a topic for a different day.  

And … have patience. Many employees are wildly stressed by technology change, particularly AI. Take adequate time to help them understand the why, learn and adopt.

So what are we getting right?

This challenging market that seems never-ending has driven us to question everything. And this is a very good thing. Putting everything on the table and questioning if there is a better way. Pushing back on long held assumptions that things need to be done this way … because it’s always been done this way. Developing an openness to new technologies, new partnerships, new ways of working. A willingness to embrace data and take significant action. Making daily learning and listening a must do, not a sometimes do. 

Attending industry events and not just sitting in the sessions scrolling on our phones, but intentionally bringing meaningful strategic learnings and actions back to the team. Learning from the past and what worked well but actively questioning, seeking out and embracing the new.

So 30 years ago, we did our best with what we knew at the time – and we and our children and our industry amazingly survived. But it turns out that “we’ve always done it this way and survived” isn’t really a great strategy, in parenting or in the mortgage industry. 

A new generation can make different choices, building on what we did in the past, with better information, tools, technology, data and insights. It’s not a rejection of the past, but it is wisely and continually building on it. Growth will come from a willingness to question, tweak, learn, measure, adjust and keep trying. And for us old dogs, being willing to admit that in plenty of cases, the new ways are actually much better.

Even if it means that from time to time, this Grandma will have to keep her parenting opinions to herself.

This post was originally published on here

The U.S. housing market is chronically underbuilt, resulting in a decades-long shortage. Burdensome regulations take part of the blame, but they are not the only cause.

A new report from the Federal Reserve Bank of St. Louis indicates that regulations are just one piece of the puzzle. Labor shortages, land constraints, and rising building, borrowing and material costs are also to blame. These factors can delay approved residential projects or kill them altogether.

The report dives into how America’s housing shortage is decades in the making. Permitting activity reached its peak in the early 1970s at 10.6 building permits per 1,000 people. After a period of volatility in the 1980s and 1990s, permits began to climb, only to crash after the financial crisis of the late 2000s.

There’s been an uptick in permits and authorizations since the Great Recession, but the authors of the report, Manu Garcia and Carlos Garriga, called this an “incomplete recovery.” Single-family permits are at 2.9 per 1,000 people, short of the historic average of 4.1, according to the report. 

“Despite over a decade of recovery, total permits per capita in 2024 stand at 4.3 per 1,000 — still 35% below the 1960-2000 average of 6.6 permits per 1,000. The U.S. is building less housing per person than at almost any point in the postwar era,” the report explains. 

To exemplify the nation’s housing deficit, the report noted that the homeowner vacancy rate was just 0.95% in 2024, the lowest on record and down from a peak of 2.9% in 2008. This rate has since risen to 1.2% but is still well below its historic average. 

Non-regulatory barriers 

Estimates typically put the U.S. housing shortage at between 1.5 million and 4 million homes, although the Fed report offered no figure of its own. Instead, it focused on underlying causes. 

One of these causes is the plummeting household size, which has fallen from roughly 3.4 people in 1960 to just over 2.5 people in 2026. 

Some research indicates that the typical household size could fall even further. The National Association of Realtors2026 Home Buyers and Sellers Generational Trends Report found that 53% of Gen Z buyers — the oldest of whom are approaching 30 years old — bought a home on their own. 

“As average household sizes shrink and the desire for independent living grows, a ‘static’ housing stock effectively becomes a shrinking one,” the Fed report cautioned.

It also pointed to the “leaky pipe” of supply, highlighting barriers to completing construction once a builder or developer obtains a permit. The data indicates a persistent lag as the number of permits issued exceeds the number of completions. 

Getting projects approved, entitled and permitted is just part of the battle. Many projects that make it to this stage can stall for years or even fail to move ahead altogether. 

This issue was particularly pronounced in the years following the COVID-19 pandemic. The number of building permits issued spiked between the second half of 2020 and the start of 2022. Builders and developers secured many permits during this period that have yet to be converted into more new housing units. 

Anyone who’s observed development project timelines and approvals knows that many of these projects died due to high costs. Borrowing costs, temporarily lowered during the pandemic, skyrocketed in 2022 and have since remained elevated. Inflation and supply chain disruptions, combined with a chronic labor shortage in the trades, also made building more expensive.

As housing became more costly to finance and construct, some developers and builders found that the rents or sales prices needed to support these projects weren’t viable. 

“Completions lagged as builders faced unprecedented supply chain disruptions and labor shortages,” the report noted. 

But the authors also noted that per-capita home completions reached 4.77 in 2024, while permits came in at 4.33 — marking the first time since 2010 that permits trailed completions on a per-capita basis.

Local regulations remain a hurdle

The authors additionally highlighted local regulatory barriers to construction, such as zoning restrictions and lengthy approval and permitting timelines. There’s been a wave of state and municipal reforms aimed at streamlining construction, including zoning overhauls and efforts to legalize more attainable housing options, such as single-room occupancy

For example, a recent bill signed into law by Idaho Gov. Brad Little restricted some local limits for starter-home subdivisions while granting local governments more power to implement missing-middle housing plans. 

Additionally, many large cities like Seattle, Austin, Honolulu and Los Angeles have adopted AI to streamline permitting and approval processes, often shortening review periods by days or weeks. 

The findings from the Federal Reserve Bank of St. Louis complement a recent White House report that outlined chronic underbuilding across the nation. That report mainly pointed to overregulation as the main cause of the country’s housing shortage. But it estimated that the real housing deficit was around 10 million single-family homes — much larger than most contemporary estimates. 

This post was originally published on here

Virginia Gov. Abigail Spanberger left in limbo legislation that would let faith-based organizations build affordable housing on their land without rezoning.

Instead of vetoing or signing the Faith in Housing Act, Spanberger recommended changes. The recommendations keep the bill’s core intact but make targeted operational tweaks.

The governor, who has only been in office since January, made improved housing affordability a major campaign theme. Her first legislative push had mixed results. Local governments defeated a proposal to allow multifamily housing by right in many commercially zoned areas.

Since the faith-based bill passed more than a week ago, local governments have pressured the governor to veto it. At the same time, she has heard from pro-housing and faith-based organizations urging her to make it law. The measure would put Virginia among the few states with a “Yes in God’s Backyard” policy that permits faith-based housing development by right.

“The governor’s amendments make some narrow adjustments, and like most legislation, there’s still room for improvement,” Jessica Sarriot, a co-lead organizer for Virginians Organized for Interfaith Community Engagement (VOICE), told HousingWire‘s The Builder’s Daily. “But this creates a strong foundation and we’re ready to move forward.”

Virginia legislators will consider the recommendations when they reconvene April 22. Even if they reject them, Spanberger can still sign the original bill.

Tweaks to the Faith in Housing Act

Spanberger proposed easing the bill’s infrastructure test. She would replace the 500-foot water and sewer rule with a broader service-or-planned-service standard. She also reinforced safeguards by clarifying that projects must follow environmental, historic, siting and archaeological laws and regulations that apply to similar developments.

On building form, Spanberger narrowed height flexibility. She excluded buildings with special-exception height from the tallest-building comparison baseline. Her recommendations would also give historic districts more control by letting existing historic-district regulations set maximum building heights in these areas.

She broadened pro-housing tools for local planners by allowing higher minimum housing densities in revitalization, transit, and small-area or sector-plan districts.

To address process concerns, she proposed streamlining approvals. Qualifying projects would be deemed “substantially in accord” with local comprehensive plans, limiting plan-consistency challenges.

She also reinforced the bill’s implementation focus by urging tax-exempt religious and nonprofit landowners to consult state housing resources when planning affordable housing on their properties.

This post was originally published on here

While the mortgage industry lobbies to reduce credit report costs, the idea of allowing borrowers to use the same file across multiple lenders has slowly emerged.

In this consumer-controlled portable credit report model, borrowers would authorize the use of a single credit report during their mortgage search across different lenders. The concept mirrors tenant screening reports — a reusable, renter-obtained background check shared with multiple landlords, often within a 30-day period.

Mortgage industry proponents say the change would reduce the need for lenders to pull credit reports that ultimately fail to result in closed loan originations while also empowering customers. Credit reporting industry representatives, however, view the model as an open door for fraud and have showed skepticism from the start. 

The Broker Action Coalition (BAC) noted in a February letter to the Federal Housing Finance Agency (FHFA) that consumers have their credit pulled an average of 2.5 times when getting a mortgage. Reducing this to a single pull would effectively lower the aggregate cost of credit reports from roughly $150 to $60 for the consumer, the group said.

“I don’t think it solves all of our problems; it’s more than a Band-Aid solution, though,” Brendan McKay, president of advocacy at the BAC, said in an interview with HousingWire.

“Right now, if a consumer comes to me and says, ‘Hey, I want to get preapproved, but I just had my credit pulled by a lender down the street. Can you just use that credit report I paid for?’ the answer is no, and for no good reason. Either I have to pay $150, or they have to pay $150, to pull a report with the exact same information on it.”

Under the proposal, a borrower would pull and pay for their own credit report, then distribute it with multiple mortgage companies by sharing a credit reference number, McKay said. Lenders would then import the credit report directly into their systems.

“It’s not going to drive down the cost of credit, but it will reduce the number of credit reports that are pulled wastefully,” McKay said. He added that his broker shop spends $30,000 a year on credit reports for mortgages that don’t close.

Under the Fair Credit Reporting Act (FCRA), lenders can currently share borrower credit reports with third parties like investors only if they have a permissible purpose. Lenders often incur additional “secondary use” fees from credit bureaus for each party that accesses the report. They frequently pass these costs to the borrower as part of the application or origination fees.

“When lenders began to reissue a credit report to various lenders through Fannie Mae and the Federal Housing Administration, the reissue fees were put in place,” an executive in the credit reporting industry said. “The bureaus also must post a hard inquiry to every lender whose report is shared. Clearly, they are not going to do that without a revenue game.”

Current context

The portable credit report concept recently emerged when the Consumer Financial Protection Bureau (CFPB), under former Director Rohit Chopra, debated the Personal Financial Data Rights Rule. The rule established an open banking framework, but the bureau vacated it last year. 

Mortgage professionals view the model as an interesting idea but argue it lacks sufficient research and faces a difficult context, making it hard to support. 

“My overarching concern is that adding a new variable into the mix with credit reports, when we are already beginning to explore other variables, could start to become destabilizing for the housing market,” said Taylor Stork, president of the Community Home Lenders of America. “The industry in general needs to figure out how the impact of VantageScore 4.0 and FICO 10T hits the rate sheets.”

There are also questions about operational challenges — for example, how sharing the information with multiple lender would affect credit scores.

“Portable credit reports are a novel and compelling idea with clear potential benefits for the consumer experience,” Stork said. “At the same time, we need more clarity on key operational and risk considerations. For example, the process today includes verifying inquiries to ensure the borrower hasn’t opened new credit across multiple lenders.

“As we evaluate a portable model, a concern might be how those safeguards would work. With that clarity, the industry can better assess the concept.”

Eric Ellman, president of the National Consumer Reporting Association (NCRA), raised concerns about fraud.

“We are obviously very focused on fraud prevention; artificial intelligence and other technology are making it so much harder to fight fraud — and conversely, making it so much easier to commit and perpetuate fraud — that anything that has the capacity to inject more fraud into the system is going to be a significant problem,” Ellman said.

For McKay, portable credit reports would remove a significant financial barrier for consumers facing a challenging path to homeownership. Borrowers are more likely to persist rather than exit the process prematurely when each additional attempt no longer requires another $150 simply to assess eligibility.

“It is time to give consumers meaningful control over their credit reports,” he said. 

This post was originally published on here

Homeowners associations (HOAs) filed 284,933 liens against U.S. homeowners in 2025 — an 8.6% increase from the 262,446 filings in 2024 and the equivalent of roughly one lien recorded every 90 seconds — according to property records compiled by Benutech.

An HOA lien is a legal claim placed on a property when an owner falls behind on assessments, fees or fines. In many states, these liens can be enforced through foreclosure.

The increase in lien activity was not evenly spread across the year. Benutech’s data shows the steepest year-over-year gains in the summer and fall months, when many associations move from delinquency notices to legal enforcement tied to their annual budget and assessment cycles.

June lien filings rose 21% year over year, from 20,737 in 2024 to 25,092 in 2025. December showed a similarly large jump of 19.4%. July remained the busiest month for both years, climbing to 31,710 liens in 2025, up 12.6%.

Florida, Texas, California, Georgia and Arizona together account for more than half of all HOA liens filed nationally, reflecting the dominance of HOA-governed communities in fast-growing Sun Belt markets.

Florida retains top spot for HOA lien volume

Florida continued to lead the nation in HOA lien activity with 49,447 filings in 2025, representing 17.4% of all U.S. HOA liens tracked. That total was up 9.9% from 45,012 in 2024. December 2025 was a particular outlier in Florida, with 34.4% more filings than in December 2024.

Louisiana recorded the most dramatic escalation in HOA lien activity. Statewide filings nearly tripled, rising 178.9% from 2,345 in 2024 to 6,541 in 2025, according to Benutech’s data.

The surge was concentrated in the second half of the year. November 2025 saw 2,062 liens, up 672% annually. October filings rose 295% year over year. The numbers suggest either a change in enforcement behavior or a structural shift in the market for HOA-governed housing in the state’s suburban parishes.

Benutech’s analysis notes that potential drivers include regulatory changes affecting association collections, rapid HOA formation in new subdivisions, and lingering financial pressure in communities hit by recent hurricanes. For lenders and servicers with exposure in Louisiana, the pattern points to a need for closer monitoring of HOA practices and borrower ability to keep up with non-mortgage housing obligations.

Colorado logged 7,679 HOA liens in 2025, up 74% from 4,413 in 2024. Unlike most states, where filings tend to follow predictable seasonal patterns, Colorado’s increases were broad-based and intensified through the back half of the year.

August lien filings in Colorado rose 146% year over year, while September’s figure was up 164% and October’s climbed 152%. With rapid population growth along the Front Range and a large pipeline of new HOA-governed communities, the state’s numbers suggest that rising dues, higher insurance and maintenance costs, and tighter association enforcement are converging.

Maryland’s HOA lien volume increased nearly 30% in 2025, from 12,432 to 16,123 filings. Unlike Louisiana’s spike pattern, Maryland saw consistent month-over-month growth throughout the year. February filings rose 56% over the same month in 2024, March’s figure increased 58%, July’s was up 50% and December’s climbed 56%.

Where HOA liens are falling

Ten states recorded fewer HOA liens in 2025 than in 2024, according to Benutech, offering a counterpoint to the national trend.

Missouri’s decline stands out because of its volume. The state posted 886 fewer liens, a 14.6% drop from a relatively high base. Activity was sharply lower in the first half of 2025 before reversing course later in the year.

New York also saw an 18% decline in HOA lien filings. That could be tied to the state’s governance structure and regulatory framework, including the prevalence of co-ops and stricter rules around common interest communities, which tend to reduce the use and frequency of liens compared with Sun Belt HOA models built around single-family subdivisions.

Benutech attributed the 8.6% national increase — nearly 23,000 additional liens in 2025 — to several overlapping factors. These include growth in HOA-governed communities following post-pandemic construction in Sun Belt states, rising non-mortgage housing costs that have driven up dues, and special assessments and limited exit options for financially strained homeowners locked into low-rate mortgages.

The data also shows filings tend to spike in the second half of the year, reflecting association collection cycles as delinquencies accumulate before advancing to legal action.

This article was generated using HousingWire Automation and reviewed by a HousingWire editor before publication. The system helps convert company announcements and industry data into HousingWire-style news coverage.

This post was originally published on here

Tri Pointe Homes shareholders overwhelmingly voted to approved the previously announced merger with Japanese firm Sumitomo Forestry during a special meeting of stockholders held on Thursday. 

While the deal is not yet finalized, the acquisition is expected to close sometime during the second quarter, according to the initial merger announcement. 

Sumitomo Forestry confirmed the vote in an announcement, and Tri Pointe Homes revealed further details in an 8-K filing with the Securities and Exchange Commission (SEC). The two companies announced the $4.5 billion all-cash acquisition in February.

According to the SEC filing, about 78% of the company’s 85,135,564 shares of common stock were represented in person or by proxy at Thursday’s special meeting. Of the shares that were represented at the meeting, 99.99% voted in favor of a proposition supporting the merger. 

The vote came shortly before the waiting period for the merger — which is mandated under the Hart-Scott-Rodino Antitrust Improvements Act of 1976 — expired at 11:59 p.m. ET on April 16. 

The merger’s completion is still contingent on other conditions set out in the agreement, and the SEC filings did not include an expected closing date. After the merger is complete, Tri Pointe Homes will go private, meaning its scheduled April 23 earnings call for the first quarter of 2026 could be its last as a public firm.

Once the Tri Pointe Homes and Sumitomo Forestry merger is finalized, Japanese companies are expected to account for about 6% of home construction in the U.S. Japanese builders, motivated by a declining domestic population, are increasingly looking to international markets for expansion opportunities. 

Tokyo-based Hajime Construction became the latest Japanese firm to scoop up an American homebuilder after acquiring a 51% equity stake in Utah builder Wright Homes in March. 

This post was originally published on here

A Q1 fraud report from FundingShield found that 43.72% of transactions within a $106.7 billion portfolio were flagged for issues posing significant wire and title fraud risks — with each problematic loan showing 2.2 issues on average.

The report showed closing protection letter (CPL) related discrepancies in 43.49% of transactions, with defects concentrated in borrower data, vesting information, titleholder details and property identifiers.

Wire instruction defects were present in 6.92% of transactions, while licensing irregularities remained at 2.37%.

Despite a 10.86% quarter-over-quarter improvement in CPL issues, FundingShield President Adam Chaudhary said disconnected systems will continue to present challenges.

“It really comes down to disparate systems, inconsistent definitions of what the data is that we’re supposed to be opting into and using, and also the manual nature of data movement,” he said. “There is no single central repository in the title world as to how you generate docs and how the title insurer systems allow and permit those docs. It’s very disjointed on that side of the world.

“Lenders and investors often do not realize there is a lot of trust being placed in title companies to produce and generate those documents, but there’s not a lot of controls around it.”

The solution, Chaudhary said, is getting into the data flow earlier.

“We’re clearing up discrepancies earlier, before you close, not letting that become a post-closing trailing doc issue,” he said.

Agent liability for title company breaches?

The report noted that new federal directives increased pressure on lenders to strengthen data accuracy and vendor oversight — with heightened scrutiny of vendor layer cyber resilience as attacks on title and settlement firms continued to rise.

When asked whether a real estate agent could face regulatory exposure or liability for recommending a title company that later suffers a wire fraud breach, Chaudhary said the legal landscape remains unsettled.

“The biggest source of driving a regulation is if there’s recourse that can actually be collected,” he said. “If you have a regulation that has teeth and penalties and a party can’t be collected against, there’s really no point. It’s all fluff.”

He noted that since the post-crisis era, banks have taken on much of this liability, but the proliferation of independent mortgage bank transactions has shifted some risk.

“There’s still not a hard line, no direct regulation in most states that says that party is responsible on the real estate side or the title side,” said Chaudhary. “If they’re doing consumer-direct activities, that’s a little bit different. But typically, the real estate side is directing it.

“The [real estate professional] is saying, ‘Hey, let’s go open escrow. I know this person, let’s do this transaction in this fashion.’ That gap still exists in terms of where the recourse is for the consumer.”

Chaudhary said consumer protections for real estate fraud could widen in the near-future.

“We do think that there needs to be a baseline element of reasonable levels of diligence,” he said. “We’re seeing the bigger platforms talk about that. On the real estate side, is there some sort of basic check they can do, or validation source they can hit? We think it’s important for that validation source to not be paid for by [real estate professionals] to vet or approve title companies. We don’t think having a pay-for model to be approved like Angie’s List works.

“We think it has to be a diligent system that’s paid for by the parties themselves. So, there’s a fee or something else that gets assessed to access and confirm the parties you’re working with have been validated.”

Embedded solutions expand title access

The report highlighted growth in FundingShield’s TitleKnight and TitleShield offerings as lenders sought standardized, embedded solutions.

Chaudhary clarified that “embedded” does not mean steering borrowers away from independent title agencies.

“When we say embedded, we don’t mean providing access to one title company or one party,” he said. “We mean building in these verification flows and validation flows allowing parties to freely operate using a trusted intelligence layer. We’re an embedded infrastructure layer within the actual production system that’s tying those two disparate worlds together — title and lending worlds.

“It improves the chances for compliant, good standing, properly licensed, high quality producing agents to get the deals and have them go through faster, not the other way around.”

The cost of reputational damage

The report concluded that lenders are increasingly adopting real-time, source-data validation frameworks, with clients seeing return-on-investment (ROI) of up to 400% across 2025.

Chaudhary said the single most cost-effective control for agents is real-time, transaction-level risk remediation.

He broke down the risks into financial, reputational and insurance-related costs — with reputational risk overriding all others.

“When these events happen, the true cost of ROI of not having one of the events versus having one is hard to quantify for most boards until they have one,” Chaudhary said. “It’s Secret Service and FBI involvement in your operations. It’s reinstatement of insurance policies, if you can get them back. In the lending world, can I sell to Fannie and Freddie?”

He added that even if funds are recovered, there are hard dollar costs and considerable time spent rebuilding trust with counterparties and auditors.

“That’s why we think a per transaction, per data change — that our clients can adjust and calibrate the way they want done in real time with traceable and trackable data, leveraging source data — is the way to go.”

This post was originally published on here

Maine Gov. Janet Mills this week signed LD 1901, making Maine the first state to enact comprehensive consumer protections for home equity investments (HEIs), which the new law defines as “shared appreciation mortgage loans.”

The bill, titled “An Act to Regulate Shared Appreciation Agreements Relating to Residential Property,” establishes guardrails around a growing class of home equity-based products that offer cash upfront in exchange for a share of a home’s future value. The law targets features that advocacy groups like the National Consumer Law Center (NCLC) say can lead to large, unpredictable lump-sum payments and forced home sales.

HEI arrangements generally allow homeowners to tap equity with no monthly payments, repaying the provider when the home is sold or refinanced, or when the borrower dies. The payoff amount is tied to the home’s future value, meaning it is unknown when the agreement is signed. According to an NCLC press release, the balloon payments can reach tens or even hundreds of thousands of dollars above the initial cash advance, stripping equity needed for retirement, health care or intergenerational wealth transfers.

“With the signing of this groundbreaking bill, Governor Janet Mills brings transparency and fairness to the home equity investment loan process,” Andrea Bopp Stark, senior attorney at NCLC, said in a statement. “This legislation applies comprehensive boundaries to a complex financial product that is often marketed and sold without regard for the long-term impacts on homeowners.”

The bill was sponsored by Rep. Art Bell (D-Yarmouth.) The Maine Bureau of Consumer Credit Protection, led by Superintendent Linda Conti and principal examiner Ed Myslik, supported the legislation and was actively involved in its development, according to NCLC.

Key provisions of Maine’s HEI law

LD 1901 defines “shared appreciation mortgage loans” as transactions in which a homeowner receives cash upfront in exchange for a future interest in the property’s value, secured by the real estate and payable upon a triggering event such as sale, refinance or death.

The statute’s consumer protections include:

  • Enhanced disclosures that spell out the actual costs and potential future payments associated with the loan
  • Mandatory housing counseling education and legal representation for consumers before they enter into a shared appreciation mortgage
  • Limits on contract terms, including prohibitions on unreasonable restrictions related to renting, occupying or maintaining the property
  • Assignee liability, extending homeowners’ claims and defenses against the original lender to any purchaser or assignee of the loan

Consumer advocates say HEI products are often marketed nationally to older homeowners with significant equity and to consumers with lower credit scores. The structures are typically positioned as alternatives to home equity lines of credit, cash-out refinances or reverse mortgages — but without the same level of regulatory oversight.

What’s happening in other states?

“HEI loans may be marketed as a lifeline to a homeowner in trouble, but they are a trap that siphons away people’s hard-earned equity,” Tom Cox, a Maine attorney, said in NCLC’s announcement. “Thanks to the Maine Legislature and Governor Mills, Mainers will have one less bad financial actor to contend with.”

For lenders, servicers and real estate agents, Maine’s law is an early signal of how states may move to regulate nontraditional equity products that sit outside conventional forward mortgage and reverse mortgage frameworks but function similarly from the homeowner’s perspective.

A key legal decision involving the HEI space was announced in October when a federal appeals court ruled that Unison‘s flagship product met the definitions of a reverse mortgage under Washington state law.

It’s not the only legal battle being waged against San Francisco-based Unison, which faces a class-action suit in California stemming from a complaint by a senior homeowner. The complaint is based on a $97,000 payout in 2017 that allegedly grew to $375,000 after eight years, implying an effective interest rate of nearly 35%.

The company was also recently sued in Colorado. The plaintiffs in that case say they are “trapped” in an agreement that would force them to pay up to $278,000 to terminate the contract after an upfront payout of about $87,000.

Another major HEI company, Hometap, was targeted by the Massachusetts attorney general beginning in February 2025. Late last year, a Suffolk Court Superior Court judge ruled that Hometap’s defense could not rely on arguments that state regulators previously approved or implicitly sanctioned the company’s business model. The case is still in the discovery phase, with a deadline of Oct. 23, 2026, for the parties to submit evidence.

Changes on the horizon?

HEI providers and investors now face state-level requirements in Maine around disclosures, counseling and assignee liability that more closely resemble traditional mortgage rules. That could affect product design, pricing, secondary market appetite and how these agreements are integrated into broader home financing strategies.

Maine’s law also underscores growing regulatory and advocacy attention on equity-stripping risks for older homeowners and equity-rich, cash-poor households. Housing professionals operating in Maine will need to understand the new definitions and compliance obligations when discussing or encountering shared appreciation structures in transactions, refinances or loss-mitigation scenarios.

Stakeholders in other states are urged to watch Maine’s framework as a potential model for future legislation. NCLC said its attorneys have long pressed for stronger oversight of HEI products. The organization provided technical assistance in drafting LD 1901 and testified in support of the bill.

In November, not long after the ruling against Unison in Washington state, Allen Price of BSI Financial Services told HousingWire that secondary market investors are watching these legal proceedings with interest as they could reshape how HEI products are marketed and securitized.

“It’s kind of early to tell with any kind of specificity what the real impact is going to be to [sales] volumes,” Price said. “The disclosures that homeowners are going to get will probably change. In Washington state, if you’re a shared equity originator, you’re going to have to change your disclosures — which may not necessarily mean a whole lot, but that’s more cost. You’ve got more training, more consumer education you have to do.”

This post was originally published on here

On Thursday, Dark Matter Technologies announced the promotion of Vikas Rao from chief technology officer to CEO, with Rao replacing Sean Dugan.

At the same time, the Florida-headquartered company announced layoffs impacting 5% of its workforce. The roles affected were not immediately announced.

Rao, just one day into his new role heading the technology company, sat down with HousingWire and discussed his transition from CTO to CEO. He also clarified the strategy behind the layoffs and shared his focus on market implementation and lowering barriers for new customers. 

Editor’s Note: This interview has been edited for length and clarity

Sarah Wolak: Vikas, you’re officially one day into being the CEO of Dark Matter. What is changing the most for you beyond the title and the scope of the position?

Vikas Rao: As the CTO of Dark Matter. I was very much driving our AI and technology strategy. I’ve also worked in product roles in the past, so I was also deeply involved in our product direction. What changes as I take over as CEO now is also how we take what we’re doing from a product and technology perspective into the market.

One of my core intentions is to lower the barrier to entry for new customers who want to adopt our platform, and really bring a technology and an automation lens to all aspects of the organization. We have 94% adoption of AI within Dark Matter; we’re not just deploying AI for our customers, but within our own organization, we’re using it to write code, to test software … so it’s pervasive.

It’s just how we operate, how we deliver our product innovations to our customers, as well as lowering the barrier of entry for new customers who want to join our customer base. So that’s kind of the shift in how we operate that will be changing as I take over the CEO role.

Wolak: The company previously mentioned that it plans to turn tech investments into stronger commercial performance. Can you talk more about what you mean by that, and what success looks like over the next year or two?

Rao: As I mentioned, we have incredible products, and we’re doubling down on our strategy. We recently unveiled our direction at our Horizon conference to our customer base, and the reception could not have been more positive.

What we’re really doing is kind of shaping where lending is going, and we’re doing that before sometimes our customers are ready for it. We want to lead our customers and the industry where technology’s going, where lending and its paradigm are going to be. By doing so, that naturally translates into growth and expansion.

Our Aiva platform — which is our AI-based document recognition, data extraction, and all of the income asset analysis that happens — is now being embraced by some of the largest lenders on our platform. We think every single lender out there should have it because the ROI on it is undeniable.

We believe in making sure our customers have the best ROI from our product, and the commercial performance and the growth of our company are going to be byproducts of that. So the focus for us is to innovate and help our customers adopt it. It’s very much customer first in everything we do, and everything else is a byproduct of that.

Wolak: I would be remiss if I didn’t ask about the 5% reduction in force or about Sean Dugan. Is he still with Dark Matter or has he transitioned to a different role?

Rao: He has transitioned out of Dark Matter.

Wolak: Can you share which roles specifically were impacted by the reduction in force and why the decision was made? How many people did this impact?

Rao: The reduction in force, fundamentally, is a reflection of how we see the nature of work shifting. I mentioned we are using AI extensively within our own organization, and so for a lot of our people, the nature of work has shifted from doing to reviewing.

Right now, AI is doing the work. Then our developers, etc, come in and see what AI did, and then review and accept it. The reductions were more from a perspective of now, we can do a lot more through automation and AI to develop, test and deliver our products. So the reductions were to kind of mirror the efficiencies we have gained just from an operational perspective as an organization. We’re a little over 1,000 people, so it affected 5% of that.

Wolak: Can you go deeper into how this organizational shift aligns with the priorities of Dark Matter going forward?

Rao: I think the direction of the company, which we unveiled to our customer base at our Horizon conference, remains unchanged. Fundamentally, Empower and Aiva are market-leading solutions that are being used by some of the largest lenders in the country.

Now what we’re doing is embedding agentic experiences into all of these products. So that is a critical priority for Dark Matter; we will be unveiling a lot more of that throughout this year and next year. So that direction remains unchanged, and again, we strongly feel like we have the right team in place to drive that transformation.

The nature of work for us is shifting. Mortgage lending needs to make that same transition.

Wolak: Which products do you feel that Dark Matter customers are getting the strongest ROI from right now?

Rao: Empower is the foundation; automation has been part of it for a long time. I think where our customers are now seeing the most ROI is as they also use our point-of-sale platform and Aiva in conjunction as just one suite. It’s not three different products, and this is what happens when you bolt on products from different companies versus an integrated suite that drives our ROI.

The point of sale is all about customer experience, the borrower who is working with the lender. But the lenders also need to see that ROI from the loan origination with the loan fulfillment perspective, because the cost of origination remains extremely high.

This is where Aiva comes in by automating a lot of what an underwriter would do, dramatically lowering errors and time to underwrite, etc., so that the customer is getting a much better experience, a faster closing experience. And the lender, with the power of Aiva embedded into Empower, is having faster, cheaper loan originations. It’s a winning formula, and that’s kind of where we’re seeing the most ROI for our customers when they deploy this as a holistic suite.

I’m incredibly energized by the mission that we’re on, the team that we have at Dark Matter, and the sense of urgency we feel at bringing to life all of these great innovations that are in the hopper right now.

This post was originally published on here

With FIFA World Cup ticket prices already high, fans attending matches at MetLife Stadium this summer will face additional costs, as NJ Transit confirms round-trip rail tickets will cost $150. On Friday, the agency released its final transportation plan for the tournament, confirming earlier reports that rail tickets for the 18-mile trip to and from MetLife would cost more than $100. The tickets will go on sale May 13, with only 40,000 available for each match day and no additional tickets to be sold once the initial batch is gone.

MetLife Stadium. Credit: Gabriel Argudo Jr on Flickr

Fans will need to purchase tickets in advance for specific boarding periods on NJ Transit’s mobile app, and tickets will be checked prior to boarding.

An official shuttle service will also be available, offering soccer fans a one-seat bus ride from the Port Authority Bus Terminal or the Midtown East Shuttle directly to the stadium. In NJ, a park-and-ride shuttle will operate from the Hackensack Meridian School of Medicine, allowing fans to travel directly to the stadium. Bus tickets cost $80 and are available for purchase here.

MetLife Stadium is hosting eight World Cup matches this summer, including five group-stage games on June 13, 16, 22, 26, and 27, a round of 32 match on June 30, a round of 16 match on July 5, and the final on July 19, as 6sqft previously reported.

The tri-state area is expected to see an influx of visitors as soccer fans from around the world converge for the tournament. NJ Transit has been preparing for the event, including plans to restrict access to parts of New York’s Penn Station to ticket holders for several hours before matches, then shuttle attendees to Secaucus Junction, where they will transfer to trains bound for the stadium.

An anonymous NJ Transit source told The Athletic that providing rail service for the eight matches, including accounting for disruptions, could cost the agency up to $48 million. The source also said FIFA’s security requirements are so strict that the matches will require the highest level security perimeter of any event hosted in New Jersey.

As a result, the agency says it may have to pass those costs on to either taxpayers or event attendees. Officials say the pricing structure is not intended for profit but to avoid losses or additional burden on local taxpayers.

The NY/NJ Host Committee and NJ Transit did not respond to requests for comment from The Athletic on whether discounted fares will be offered for children, seniors, or riders with disabilities, which are typically available on NJ Transit trips from Penn Station to MetLife Stadium.

Rail service will be critical to attendees, as extremely limited public parking will be available in the lots surrounding the venue. Instead, most of the lots will be used for “fan engagement” and “enhanced security,” significantly limiting parking capacity, according to NJ.com. Premium parking at American Dream will be available on match days by advance purchase only.

The higher rates mark another hefty price tag added to World Cup attendees’ expenses. According to NPR, the most expensive “Category 1” ticket to the final now costs $10,990, significantly higher than the $6,730 price when sales first launched last year.

In a post on X, Chuck Schumer called on FIFA to cover transportation costs for host cities, saying fans should not be “gouged” on travel.

“FIFA is set to reap nearly $11 billion from this summer’s World Cup, yet New York area commuters and residents are being handed the bill,” Schumer said. “The least FIFA can do is ensure New York residents can go to the stadium without being gouged at the turnstile.”

“I am demanding FIFA step up and cover transportation costs for host cities and states. New York commuters and residents should not subsidize an $11 billion windfall,” he added.

NJ joins several other U.S. states and cities in increasing transportation costs for World Cup ticket holders this summer. Last month, the Massachusetts MBTA said it planned to raise fares for travel from Boston to Foxborough’s Gillette Stadium from the usual $20 to more than $75.

That pricing was confirmed last week, when the MBTA announced return trips would cost $80. Separately, the agency also indicated that its alternative bus service to the stadium would cost $95 per seat, according to The Athletic.

In a Wednesday post on X, NJ Gov. Mikie Sherrill called on FIFA to help fund World Cup transportation, noting that while the organization is expected to generate $11 billion from the tournament, the Garden State is facing a $48 million transit bill.

“FIFA is making $11 billion off this World Cup and charging fans up to $10,000 for a single ticket for the final,” Sherrill said. “I won’t stick New Jersey’s commuters with that tab for years to come, that’s not fair. Here’s the bottom line: FIFA should pay for the rides, but if they don’t, I’m not going to let New Jersey commuters get taken for one.”

However, according to Gothamist, Sherrill said she would be prepared to approve the controversial NJ Transit fare hikes “if that’s what it takes,” in order to avoid placing the financial burden “on the backs of New Jerseyans.”

Editor’s Note 4/17/26: This article has been updated with final pricing information following NJ Transit’s announcement on Friday.

RELATED:

The post NJ Transit tickets to World Cup matches at MetLife will cost $150 first appeared on 6sqft.

This post was originally published here

New York City is expanding its trash containerization program, selecting additional districts in all five boroughs to fully adopt containerized trash collection by the end of next year. Mayor Zohran Mamdani on Friday announced that the city’s Department of Sanitation (DSNY) will deliver at least one fully containerized community district in every borough by the end of 2027, with a target of citywide containerization by 2031. The districts will receive the city’s new Empire Bins, which will be collected by automated side-loading garbage trucks.

Photo Credit: Ed Reed/Mayoral Photography Office on Flickr

Community districts slated for full containerization by the end of 2027 include Brooklyn District 8 (Crown Heights, Prospect Heights, and Weeksville); Bronx Districts 2 and 5 (Hunts Point, Longwood, University Heights, Mount Hope, Morris Heights, and Fordham Heights); and Queens District 2 (Sunnyside, Hunters Point, and Woodside).

In Staten Island, District 1 (Stapleton, Randall Manor, Westerleigh, West Brighton, Clifton, and Shore Acres) will also see full containerization, as will Manhattan District 2 (West Village, Soho, Little Italy, Greenwich Village, and Nolita).

These districts will join West Harlem, which last June became the first neighborhood in North America to fully containerize its trash. The DSNY rolled out roughly 1,100 Empire Bins, each holding about 794 gallons of waste, or about 25 32-gallon trash bags.

West Harlem was part of a pilot program, which, though it performed well over the past 10 months, the Mamdani administration says former Mayor Eric Adams refused to fund or plan for expansion.

Those bins are emptied by automated side-loading trucks developed in collaboration with designers in Italy, Hicksville, and Brooklyn. First introduced in DSNY’s “Future of Trash” report, the trucks use side-loading technology specifically designed to service the on-street bins.

Current city policy requires businesses and low-density residential buildings with nine or fewer units to place trash in smaller wheelie bins. Friday’s announcement expands the program to higher-density buildings with 10 or more units, where building managers will use Empire Bins. The bins are assigned to individual buildings and accessible via keycard, and eventually through a mobile app.

The DSNY expects the expansion to use more than 6,500 Empire Bins across more than 3,500 medium- and high-density buildings.

“Neighborhood by neighborhood, we are ending the decades-long era of trash bags on the streets of New York City,” DSNY Commissioner Gregory Anderson said. “Others have talked a lot about containerizing the city’s trash, but we are actually getting it done, delivering cleaner streets and sidewalks, and fewer rats, to every corner of the city.”

Manhattan Community Board 9  in June 2025. Photo courtesy of Ed Reed/Mayoral Photography Office on Flickr

During Friday’s press conference, Mamdani said that city agencies have already containerized 70 percent of trash in NYC. The program’s expansion aims to cover the remaining 30 percent, moving the city closer to eliminating trash bags from sidewalks.

“Once full city-wide containerization is achieved, sidewalks across our cities will be clean. Flowers will bloom,” Mamdani said. “But one thing will never change, which is that as New Yorkers, we will continue to talk trash, we just won’t see that much of it.”

The program’s expansion will add roughly $15 million to the city’s expense budget next year and $35.5 million in capital funding over this fiscal year and the next, Mamdani said.

RELATED:

The post NYC announces 6 more districts to fully containerize trash by end of 2027 first appeared on 6sqft.

This post was originally published here

eXp Realty is the latest defendant to be brought into the Taylor Real Estate Settlement Procedures Act (RESPA) lawsuit filed against Zillow last fall. 

The Glenn Sanford-founded firm was added to the lawsuit through a second amended complaint filed on Wednesday. 

Originally filed in mid-September in U.S. District Court in Seattle, the lawsuit claims that the portal tricks consumers into using agents affiliated with Zillow through its Flex and Premier Agent programs, resulting in inflated home purchase prices.

In December, the lawsuit was consolidated with a second suit known as the Armstrong suit, which was first filed in early November, claiming that Zillow pressures agents in its Premier Agent and Flex lead programs to steer buyers to Zillow Home Loans for their purchase mortgage pre-approval. Allegedly, agents who send more clients to Zillow’s mortgage arm for their pre-approvals received extra or higher-quality leads in exchange.

In a first amended complaint filed in the consolidated lawsuit in early January, the plaintiffs again claimed that Zillow tricks consumers into using agents affiliated with Zillow through its Flex and Premier Agent programs, resulting in inflated home purchase prices. 

In Wednesday’s second amended complaint, eXp is accused of supporting Zillow’s “fraudulent business enterprise” by allegedly steering clients to Zillow Home Loans for their financing needs. 

According to the complaint, eXp posted “at least 10” videos on its official YouTube channel promoting Zillow’s agent referral and lead generation program. Additionally, lead plaintiff Alucard Taylor claims that an eXp agent represented him in the purchase of his home. 

In an emailed statement, an eXp spokesperson told HousingWire that the firm is aware of the filing and that “eXp has been improperly named in this matter.” 

“Should we be drawn into this litigation, we will vigorously defend against these claims which we believe have absolutely no merit,” the spokesperson added.

In addition to eXp and Zillow, the second amended complaint again names The Real Brokerage and two real estate teams, the Nevada-based GK Properties and the Florida-based Frano Team, as defendants and it adds one new named plaintiff, bringing the total number of named plaintiffs to 12. 

Zillow filed a motion to dismiss the lawsuit in February. The listing portal giant has maintained that the claims in the lawsuit “are false and fundamentally mischaracterize” how the firm’s business operates.

This post was originally published on here

The Office of the Comptroller of the Currency (OCC) released its April 2026 enforcement actions on Thursday, which included a consent order against a Chicago-based bank.

The consent order against The Federal Savings Bank of Chicago is tied to alleged violations of Section 5 of the Federal Trade Commission Act, and involve deceptive acts or practices tied to cash-out refinances guaranteed by the U.S. Department of Veterans Affairs (VA). The OCC claims these violations occurred between “at least” 2022 and 2024.

The OCC uses enforcement actions to require banks and institution-affiliated parties to correct deficient practices and address violations. The order states that the bank “neither admits nor denies” the allegations.

The OCC said the conduct involved significant origination fees, higher interest rates and increased monthly payments for borrowers. The office also claims that the bank made misleading statements to customers and sent them deceptive advertisements, which stated the individual had “available funds” and instructed them to contact the bank.

The deceptive statements also allegedly involved employees telling consumers about the terms of VA cash-out refinances and creating the impression that the interest rates or monthly payments would significantly decline within a defined time period.

In reality, the cash-out refinance loans were permanent, fixed-rate mortgages with set monthly payments, and the bank could not guarantee that consumers would be able to refinance into lower rates or payments as represented or implied by employees.

Within 30 days of the order, the bank’s board of directors is required to submit a written progress report to the assistant deputy comptroller. The report is supposed to detail the corrective actions needed to achieve compliance with each article of the order, the specific steps taken to address these requirements, and the results and current status of the corrective actions.

Also within 30 days of completing its review, a restitution consultant must submit a report identifying eligible consumers affected by the misconduct. Within 60 days of receiving the report, the bank must hire the consultant and submit the plan to the assistant deputy comptroller for review and approval.

Within 90 days after the bank pays restitution, the restitution consultant must review whether the bank followed the approved methodology for distributing the payments.

The bank did not respond to HousingWire‘s request for comment at the time of publication.

Aside from the consent order at the Federal Savings Bank of Chicago, the OCC also issued prohibition orders against a former JPMorgan Chase associate banker for embezzling customer funds and a former BMO Bank associate banker for making unauthorized withdrawals from an elderly customer’s account.

The OCC also terminated enforcement actions against CNB Bank & Trust, Generations Bank and a consent order with JPMorgan Chase, according to the release.

This post was originally published on here

The New York State Comptroller Thomas DiNapoli is again taking aim at eXp World Holdings, the parent company of eXp Realty, the largest brokerage in the country by transaction side count. 

On Wednesday, DiNapoli, who is a trustee of the New York State Common Retirement Fund, an eXp World Holdings shareholder, called on investors to block the firm’s attempt to move its place of incorporation from Delaware to Texas

According to Securities and Exchange filings, the New York State Common Retirement Fund holds nearly 27,000 shares of eXp World Holdings. In total, eXp World Holdings has over 300 investors holding nearly 160 million shares in total.

The firm announced its desire to reincorporate in the Lone Star State in late February. Critics of the firm have claimed that eXp is trying to reincorporate to dodge allegations that the company and its executives enabled the drugging and rapes of women attending recruiting events. 

These allegations stem from lawsuits filed against the company in 2023, which accuse two former eXp agents and top recruiters Michael Bjorkman and David Golden of drugging and sexually assaulting women at eXp recruiting events. The plaintiffs have also sought to hold eXp and some of its executives, including CEO and founder Glenn Sanford, liable for the alleged negligent hiring of Bjorkman and Golden. 

eXp has reiterated to HousingWire that the firm “has zero tolerance for abuse, harassment or misconduct of any kind — including by the independent real estate agents who use our services,” and that it believes the claims against Sanford and the firm “are without merit.”

DiNapoli is urging investors to vote against the proposed move at the firm’s annual meeting scheduled for next Friday. 

In an interview with The New York Times, DiNapoli claimed that eXp has shown “an avoidance of corporate responsibility at the highest levels.” 

“They have not taken these allegations seriously, and they’re just packing up their tents and moving somewhere else hoping there will be less scrutiny and less accountability,” he told The Times. 

DiNapoli’s attempt to block the move comes a little over two years after he called for an independent investigation into the culture at eXp, after The Times published an expose on the sexual assault allegations faced by the two former star agents. 

In response to these allegations, two of the firm’s shareholders, the Los Angeles City Employees’ Retirement System and Building Trades Pension Fund of Western Pennsylvania, filed a lawsuit against eXp in October 2024, claiming that the firm’s leaders had breached their fiduciary duties to shareholders by ignoring red flags of alleged sexual misconduct by agents. 

In an emailed statement, an eXp spokesperson told HousingWire that the decision to reincorporate in Texas “was the result of more than a year of deliberation by our Board, including a special committee of independent directors.” 

“The decision reflects the Board’s considered judgment about the long-term operational and governance interests of the company and its shareholders. We do not anticipate the reincorporation will have any impact on existing litigation, as disclosed in our Proxy Statement filed with the SEC on March 9, 2026, which describes in detail the Special Committee process and the Board’s conclusions,” the spokesperson wrote. “Any characterization of the timing as ‘suspect’ misrepresents a lengthy, good-faith process and a misunderstanding of the reincorporation impacts on existing litigation.”

This post was originally published on here

A meaningful shift is underway in residential real estate—and most agents aren’t paying attention yet.

This change isn’t about AI writing listing descriptions or generating social media posts. It isn’t about CRMs or lead generation platforms. Those tools are already widely used and, in many cases, interchangeable.

The next evolution is more tangible: physical, AI-enabled assistants operating inside the home itself—assigned to a single listing from launch to close.

This will not replace skilled real estate agents. It will redefine what full-service actually means.

The hidden stress of selling a home

Real estate professionals tend to focus on negotiations, pricing strategy and marketing exposure as the core challenges of selling a home. Sellers experience something very different.

What they remember most is living in a property that has to remain show-ready at all times.

Laundry can’t stay in the basket. Shoes can’t stay by the door. Pets have to disappear before showings. Meals are reconsidered. Children’s routines are disrupted. And the request always seems to come at the worst possible moment: “Showing in 30 minutes.”

Selling a home isn’t stressful because of the transaction. It’s stressful because sellers lose control of their daily lives while the home is on the market.

That is the problem the next wave of real estate technology will solve.

From static listing to managed environment

Consider what happens when a listing includes a dedicated, on-site assistant responsible for preparing the home before every showing, managing access, monitoring conditions and maintaining a consistent standard of presentation.

Lighting adjusts automatically. Climate is controlled. The property is staged appropriately. Contractor access is coordinated. Marketing materials are maintained. Buyer activity is tracked and feedback is captured in real time.

What used to require constant coordination between agents, sellers and vendors becomes a managed system operating inside the home itself.

The core technology already exists. Smart home systems, identity verification, remote access and automated scheduling are widely trusted and in daily use.

What’s been missing is integration and physical presence.

When that arrives at scale, listings will stop being static assets. They will become actively managed environments.

While the physical assistant layer is still emerging, the underlying behavior is already visible. Buyers are scheduling showings through automated platforms like ShowingTime. Sellers are monitoring their homes remotely through Ring and Nest devices. Access is being controlled digitally and feedback loops are increasingly immediate.

In other words, the industry has already accepted automation at every step—just not yet in a unified, physical form inside the home itself.

A new standard in listing presentations

For years, listing presentations have sounded nearly identical: professional photography, online exposure, email campaigns, and open houses.

These are no longer differentiators. Now consider a different proposition: A listing supported by a system that ensures the home is prepared, monitored, and professionally maintained every day until it sells.

That isn’t marketing. That’s infrastructure.

And infrastructure resets expectations quickly. Professional photography followed this exact path, from premium to standard in a short period of time. The same will happen here.

The first agents and brokerages to adopt this model won’t just improve their service. They will reset what sellers expect from every agent who follows.

The buyer experience improves as well

This shift isn’t just about sellers. Buyer’s agents and buyers prefer homes that are easy to show and ready to purchase.

A consistently prepared property eliminates friction. There are no last-minute surprises, no access issues, and no uncertainty about condition.

Showings become faster, cleaner, and more predictable.

That consistency leads to more showings. More showings lead to more offers. And more offers lead to stronger results.

Solving the scaling problem for listing agents

Most listing agents can manage a limited number of active listings before service begins to slip.

Showings get missed. Feedback is delayed. Contractors fall out of sync. Sellers become anxious. Communication slows.

This is not a skill issue. It’s a capacity issue.

This pressure is already showing up in the numbers. According to the National Association of Realtors, agents are handling more complex transactions with longer days on market and more frequent price adjustments in a normalized market cycle. At the same time, consumers expect faster communication, better presentation, and a more seamless experience.

The gap between what clients expect and what a single agent can operationally deliver continues to widen. Systems—not effort—are what close that gap.

When each listing includes its own operational system, the model changes. The listing no longer depends entirely on the agent’s time and coordination. It begins to manage itself.

The agent shifts from handling logistics to guiding decisions. From coordinating vendors to advising strategy. From reacting to problems to leading outcomes. This is the role sellers believe they are hiring in the first place.

From optional feature to expected standard

Adoption will follow a familiar pattern. At first, this will feel optional. Then it will feel impressive. Then it will become expected.

The industry has seen this before with online listings, digital signatures, and professional media. Once the infrastructure exists, expectations adjust quickly.

Soon, sellers will begin asking a new question during listing interviews: What systems are in place to manage my home while it’s for sale?

As this shift unfolds, brokerages will begin to differentiate based on the systems they deploy.

Some will build proprietary platforms. Others will partner with providers. Luxury brokerages may offer concierge-level systems. Other segments will adopt more streamlined versions.

The distinction will no longer be just about marketing reach or brand. It will be about operational capability.

The next competitive advantage

For decades, agents have competed on marketing. The next competitive advantage will be infrastructure.

Agents who understand this early will position themselves differently—and win accordingly. Because as homes become more intelligent and more responsive, the seller’s question changes: Not just, “How will you market my home?”

But, “How will you manage it while it’s for sale?”

And the agents with a clear, confident answer will win the listing.

Tim and Julie Harris are real estate coaches, bestselling authors and the dynamic voices behind Real Estate Coaching Radio, a daily podcast for real estate professionals. With decades of hands-on experience, they help agents build profitable, sustainable businesses through proven, practical strategies. Listen daily at TimandJulieHarris.com or on your favorite podcast platform.

This column does not necessarily reflect the opinion of HousingWire’s editorial department and its owners.

To contact the editor responsible for this piece: tracey@hwmedia.com

This post was originally published on here

In the wake of the Sitzer-Burnett lawsuit and the National Association of Realtors (NAR) settlement, consumer advocates claimed a major victory. Their long-standing theory — decoupling commissions so buyers pay their own agents — was supposed to lower housing costs and create a more competitive marketplace.

It hasn’t.

In fact, recent analysis from the Consumer Federation of America (CFA) — the very group that championed decoupling — acknowledges a fundamental reality: While a few more sellers are a bit more inquisitive about how commissions are paid and a very select few decline to pay buyer agent commissions, and in most cases sellers are still paying the buyer agents commission.

In addition to that the home prices haven’t come down at all due to this and the transactions are not cheaper. The promised savings for consumers have simply not materialized.

That should prompt some reflection

Instead, we are seeing a familiar pivot. The blame is once again being placed on real estate agents — accused now of failing to negotiate aggressively enough. But this argument conveniently ignores the most obvious force in any housing transaction: the seller’s price. In a market constrained by supply, with persistent demand and high construction costs, the idea that shifting who pays commissions would meaningfully lower home prices was always more theory than reality.

Let’s be clear: the Burnett-Sitzer lawsuit and the resulting NAR settlement are not transformational reforms. They are, at best, a rearranging of the deck chairs on the Titanic, changing the structure of how fees are presented without addressing the underlying economics of the housing market.

Decoupling does not create more housing. It does not reduce land costs, labor shortages or regulatory barriers. It does not make financing cheaper. What it does do is shift costs around in a way that may ultimately disadvantage buyers — particularly first-time and moderate-income households.

For decades, one of the quiet strengths of the existing system was that buyer representation could be financed through the transaction itself. Decoupling risks turning that into an upfront, out-of-pocket expense. For many buyers already struggling with down payments, closing costs and rising interest rates, that additional burden may discourage them from seeking professional representation altogether.

That is not a win for consumers

It is also worth noting emerging unintended consequences. Reports of increased “pocket listings” — properties marketed privately or within limited networks — should concern anyone who cares about transparency and fair access. A fragmented marketplace benefits insiders, not everyday buyers.

Where does this leave us?

The CFA’s own findings undermine their central claim. If decoupling does not lower prices, and early evidence suggests it does not, then what exactly was achieved? Consumers were promised savings. Instead, they are facing a more complex, less transparent system with no clear financial benefit.

This is a classic case of policy driven by theory rather than practice.

Consumer advocates meant well. The goal of reducing costs and improving fairness is one we all share. But good intentions do not guarantee good outcomes. In this case, the push for decoupling may have disrupted a system without delivering the benefits that were promised.

There’s an old saying in public policy: be careful what you ask for.

We would be wise to heed it now.

Joseph Ventrone is the former Vice President of Federal Policy and Industry Relations at the National Association of Realtors (NAR). He serves as a voluntary consultant to NAR, a member of the Arlington County Housing Commission, and President of the North Rosslyn Civic Association. The views expressed are his own.

This column does not necessarily reflect the opinion of HousingWire’s editorial department and its owners.

To contact the editor responsible for this piece: tracey@hwmedia.com

This post was originally published on here

The Mortgage Bankers Association (MBA) on Friday submitted a letter to the Consumer Financial Protection Bureau (CFPB) to support the bureau’s proposed 2026–2030 strategic plan, backing efforts to reduce regulatory burdens while urging the agency to go further in easing mortgage rules that expand credit access.

The draft strategic plan, which the CFPB published for public comment on March 13, outlines the agency’s three primary goals: addressing pressing threats to consumers; reducing what it describes as unwarranted regulatory burdens; and strengthening the agency’s governance and culture. The public feedback submission period ended on Friday.

Under the first goal, “Address Pressing Threats to Consumers,” the bureau said it will focus enforcement and supervision on “tangible” consumer harm, particularly cases involving measurable financial losses.

The goal involves several objectives to combat fraud; protect servicemembers and veterans in the U.S. Department of Veterans Affairs (VA) loan space; and ensure what it calls “fair banking,” including scrutiny of potential “debanking” practices tied to political or ideological factors.

The agency also signaled a shift in enforcement priorities, stating it intends to return money directly to affected consumers rather than relying on fines that feed into its civil penalty fund.

The second goal, “Reduce Unwarranted Regulatory Burdens,” includes several objectives, including the need to “systemically identify and address outdated, unnecessary, or unduly burdensome regulations,” and to “minimize regulatory burden by eliminating duplicative supervision or supervision outside of the CFPB’s authority.”

“MBA agrees with the aim of the strategic plan to concentrate the CFPB’s resources on identifying and addressing pressing threats to consumers, reversing instances of regulatory overreach, and lowering the compliance and liability costs associated with consumer financial products,” Pete Mills, the MBA’s senior vice president of residential policy and strategic industry engagement, said in the letter.

The trade group praised recent CFPB actions that align with these goals, including the rollback of a proposed rule requiring certain nonbank firms to report enforcement orders to a federal registry that became effective in October 2025.

It also backed the bureau’s move away from “regulation by enforcement,” saying it supports limiting enforcement to cases involving clear, measurable consumer harm.

MBA urged the CFPB “to incorporate the Trump administration’s recent executive order on mortgage credit and to ensure any regulatory relief is applied broadly across the market — not limited to smaller banks — so borrowers across all lender types can benefit from lower costs and improved access to credit.”

MBA pressed for adjustments to TRID tolerance thresholds, as well as expanded error-correction provisions and reforms under the Truth in Lending Act and Real Estate Settlement Procedures Act (RESPA), warning that limiting changes to smaller institutions would reduce their impact on costs and access to credit.

The group also called for changes to servicing rules to ease loss mitigation, revisions to loan originator compensation standards, and updates to disclosure and underwriting requirements.

The CFPB has been undergoing major restructuring under the second Trump administration. After former CFPB Director Rohit Chopra was fired from his position and Russell Vought was appointed as acting director, the agency shut down most of its functions and closed its headquarters.

In April 2025, the Trump administration fired 90% of the CFPB’s staff, a move that was challenged in court and temporarily blocked. In August, a federal appeals court panel allowed the firings to proceed, leading to layoffs of about 1,500 employees.

While the agency has not officially been dismantled despite Vought’s announced plans, it has paused most enforcement actions, dropped investigations and started rolling back Biden-era rules.

This post was originally published on here

Though some 583,000 people are buried there, the 478-acre Green-Wood Cemetery has always been more than a burial ground. The Brooklyn cemetery served as a verdant 19th-century escape, and it has since been a unique destination for events, nature study, and more. This weekend, the cemetery will officially open the Green-House at Green-Wood, a new $43 million welcome center that wraps around the renovated 1895 Victorian greenhouse. Designed by Architecture Research Office (ARO), the new L-shaped building, clad in glazed terra cotta and topped by a green roof, will help visitors navigate the cemetery’s sprawling grounds. The new center will also serve as a venue for events, starting with a free grand opening weekend program and a MoonFest celebration in May.

Located just across from the main entrance at 25th Street and Fifth Avenue in Brooklyn, the center will be free to enter and open all year.

“The Green-House opens the door to Green-Wood for a new generation of visitors while giving longtime fans, families, and neighbors a welcoming place to begin their visit,” Meera Joshi, president of The Green-Wood Cemetery, said.

“Just outside the front gates, the Green-House will offer visitors a deeper understanding of Green-Wood’s role as a place of remembrance, a historic landmark, and a green space that brings communities together, all before they step inside to experience it firsthand.”

Green-Wood purchased the crumbling, landmarked greenhouse, one of the only surviving Victorian greenhouses in New York City, in 2012 for $1.6 million. The architecture firm of Architecture Research Office was tasked with adding a modern terra-cotta-clad L-shaped building to the existing structure. Construction began in 2023, as 6sqft previously reported.

The new center was designed to further the cemetery’s founding mission of providing a public resource to the city’s residents. In an interview with the New York Times, Joshi said, “It was a place both for people who lost their loved ones as well as for the general public to have some green space and some peace. Now, it’s kind of come full circle.”

The new building measures 17,000 square feet and wraps around the historic greenhouse. As the architects describe, a one-story volume abuts one edge of the greenhouse, and a new entry courtyard separates the 19th-century structure from the two-story volume along the west end of the site.

The second floor overlooks the Civil War-era main entrance arch designed by Richard Upjohn and a landscaped green roof designed by Michael Van Valkenburgh Associates.

The facade features a custom glazed burgundy terra cotta, a reference to the brownstone of Upjohn’s arches. The building is certified LEED Gold and is all-electric.

“Our goal was to create a new front door to Green-Wood—one that orients visitors and prepares them for the remarkable experience across the street,” Kim Yao and Stephen Cassell, principals of ARO said.

“The new building frames the historic greenhouse and the views toward the Cemetery, with a sculpted green roof and glazed terra cotta facade that echo the character of its landscape and Gothic entrance.”

The new visitor center will offer free maps and guidance to the cemetery’s most scenic vistas and notable monuments, a new exhibition gallery featuring artifacts from Green-Wood’s history, and a modern classroom for both children and adult programs. There will also be a Center for Research offering access to rarely seen archival material and digital stations to help guests find any grave at Green-Wood.

The $43 million project was funded by city, state, and federal funds as well as private donations, with additional funding provided by Green-Wood, according to the Times. The cemetery is free to enter, but fees for gravesites and services (graves start at $21,000; mausoleums start at $50,000) are used for upkeep and maintenance.

Photo © Maike Schulz

The exhibition hall will feature items from Green-Wood’s history, including handwritten records that date back to its founding in 1838 as one of America’s first rural cemeteries. One wall will be dedicated to the lives of 46 notable Green-Wood residents, with the exact locations of their graves displayed on digital screens.

The Center for Research will offer “An Inside Look,” a collection of stories preserved in Green-Wood’s climate-controlled Archives and Collections.

The Green-House at Green-Wood is free to visit and will be open from Thursdays to Mondays, from 10 a.m. to 6 p.m., starting Saturday, April 18. Opening weekend festivities will include workshops, explorations, and more.

Highlights include:

“Tokens of Remembrance” is a card-making workshop that offers a chance for visitors of all ages to create a handmade card for someone special.

Celadon Landscape” by Jean Shin centers around two large vessels, formed from thousands of discarded celadon shards; visitors are invited to write the names of loved ones on paper “shards,” contributing to the artwork.

Another notable event on the horizon at Green-Wood is MoonFest, the newest addition to the cemetery’s after-hours programming. Created to celebrate our collective fascination with the moon, MoonFest will harness the inventive spirit of scientists, historians, artists, and stargazers for one night only, to focus on the moon’s influence on all of us.

Topics will include the pull of time and tide, moon mythology and the future of humans in space, addressed through guided moonlight tours, expert lectures, stargazing, and immersive art. The free event happens on May 1st from 6 p.m. to 11 p.m. Check the event page for more details.

RELATED:

The post Green-Wood Cemetery opens new welcome center that surrounds Victorian greenhouse first appeared on 6sqft.

This post was originally published here

The Trump administration on Thursday agreed to release nearly $60 million in federal funding for the Second Avenue Subway extension, ending a monthslong dispute that began during October’s government shutdown. According to the New York Times, in a letter filed in Federal Claims Court, a lawyer for the government said the administration would resume payments to the Metropolitan Transportation Authority after the agency sued in March over the withheld funding. The funds were initially held while the U.S. Department of Transportation (U.S. DOT) reviewed the MTA’s race- and sex-based contracting requirements, which the agency now says have been satisfied.

“We took the Trump Administration to court after they illegally froze funding for the Second Avenue Subway,” Gov. Kathy Hochul said in a statement on X.

“Today, they backed down. The freeze is over. For East Harlem and every New Yorker who relies on our subways, release our money immediately.”

The federal government owes more than $58 million for the project, as work on the $7.7 billion second phase has only recently begun. Slated for completion in 2032, the project will extend the Q train from 96th Street to 125th Street in East Harlem, delivering long-awaited subway service to a historically transit-deprived area, as 6sqft previously reported.

The project, which received a $2 billion tunnel-boring contract in August, the largest in MTA history, will create three fully accessible Q train stations at 106th Street, 116th Street, and 125th Street, with tunneling expected to begin in 2027. In 2023, the U.S. DOT approved a $3.4 million grant for the extension, covering about half of its estimated $7.7 billion cost, as 6sqft reported at the time.

New York state agencies such as the MTA are required to award a portion of construction contracts to minority- and women-owned businesses. In October, the federal government issued an interim rule challenging those requirements as part of a broader attack on diversity, equity, and inclusion (DEI) policies.

The MTA has said it has complied with the updated federal requirements since their implementation. After warning the administration in late February that it would sue if funding was not released within a week, the agency filed a lawsuit in early March for breach of contract over delayed reimbursements, arguing that further delays could stall the long-planned expansion.

Danna Almeida, a U.S. DOT spokesperson, said the government was satisfied with its review but declined to comment on the MTA’s claim that it had already been in compliance, according to the Times.

The funding was released moments before a federal judge was scheduled to hear oral arguments in the MTA’s lawsuit. While the U.S. DOT said it had found “troubling” information regarding the MTA’s DEI contracting policies, it said it had reached a deal to release the funds.

In a statement, MTA Chair and CEO Janno Lieber celebrated the Trump administration’s reversal, saying “transit justice” is on the way for East Harlem residents.

“It shouldn’t have taken seven months and a lawsuit to get here, but with the federal government’s concession today on the courthouse steps, the MTA can now confidently forge ahead with Second Avenue Subway Phase 2. The billion-dollar contract approved at our March Board meeting is being awarded and contractors are mobilizing right away,” he said.

“Today’s MTA is determined to expand our network and give riders more and better service. Long-awaited transit justice for East Harlem is just the beginning.”

The Gateway Project, another major transit project connecting New York and New Jersey, also faced a similar dispute. Funding was halted in October, prompting the two states to sue the federal government in February to recover the money.

Following an appeal by the administration, a judge allowed the funding freeze to continue temporarily until February 12. Work resumed later that month.

RELATED:

The post Trump will release funds for Second Avenue Subway extension first appeared on 6sqft.

This post was originally published here

The city will install a crosstown protected bike route that runs the entire length of 72nd Street in Manhattan. The Department of Transportation (DOT) this week unveiled plans for a two-way protected bike lane from Riverside Drive to York Avenue, connecting the Upper West Side and Upper East Side through Central Park. The transportation committee of Manhattan Community Board 7 on Tuesday passed a resolution in support of the West 72nd Street redesign, which could begin later this spring. DOT will present plans for the east side of the street to Community Board 8 this fall.

72nd Street and Amsterdam, existing. Courtesy of NYC DOT
72nd Street and Amsterdam, proposed. Courtesy of NYC DOT

Existing protected bike lanes on the Upper West Side run north and south on multiple avenues, but do not currently connect the neighborhood to Riverside Park or Central Park. Improving the “crosstown cycling connection” to Central Park was identified as part of a 2024 study of the park’s drives and circulation.

According to the city, the West 72nd Street protected bike lane would create a dedicated space for cyclists traveling east and west and “improve overall traffic safety without causing significant spillover traffic to neighboring streets.”

A map of the proposed protected bike lane route for 72nd Street in Manhattan. Courtesy of NYC DOT

“Creating a protected, two-way bike lane on 72nd Street will finally deliver a safe, seamless crosstown connection between the Hudson River Greenway, Central Park, and the East Side Greenway—filling a major gap in Manhattan’s cycling network,” NYC DOT Commissioner Mike Flynn said.

“Designs like this make our streets safer for everyone, whether you’re biking, walking, or driving. This proposal reflects our commitment to safer streets and meets the growing demand for cycling, making it easier for New Yorkers of all ages and abilities to get across Manhattan safely.”

Currently, West 72nd Street has four lanes of traffic and two lanes of parking. The project redesigns the street to allow for a nine-foot, two-way bike lane on the north side of the curb from Riverside Boulevard to Central Park West. This would require the repurposing of 27 parking spaces on the east side of Riverside Boulevard between 68th Street and 71st Street and the removal of 10 parking spots on West 72nd Street.

The project would also include painted curb extensions and improved visibility at intersections and add a new bus boarding island for the M72 to West 72nd Street and Central Park West.

During Tuesday’s meeting, DOT urban planner Patrick Kennedy said double parking is a big issue on this corridor, creating dangerous conditions for cyclists. If the travel lane is reduced to just one in each direction, the city believes this will prevent double parking.

The meeting drew a big crowd, with over 150 people signed up to testify. Several business owners expressed concern about the project’s effect on curb access for daily deliveries, and other residents said they did not feel adequately informed of the redesign.

Council Member Gale Brewer told Gothamist she received complaints from local businesses about the plan and is worried about people who need to access the Islamic Cultural Center at 72nd Street.

“There’s double parking, triple parking sometimes. I’ve personally spent hours trying to get the triple parking to go away,” Brewer told Gothamist. “I don’t know if you’ve ever been around a mosque, but there are people who come in to pray five times a day.”

DOT’s plan would require deliveries at designated loading zones, located in the parking lane. The city said it would also update curb regulations to encourage “turnover of parking spaces in high-demand areas.”

The community board had previously supported the two-way protected bike lane and passed a resolution in favor of the redesign in 2020.

The city could begin installation of the bike lane on the west side of 72nd Street in late spring or early summer of this year. DOT will present a similar plan to Community Board 8 in the fall of 2026.

RELATED:

The post 72nd Street to get crosstown protected bike lane first appeared on 6sqft.

This post was originally published here

Redfin is asking Northwest Multiple Listing Service (NWMLS) to revise its rules to allow a formal premarketing phase for listings in the Seattle area, arguing that current policies limit how sellers can test pricing and demand before going fully live on the MLS, according a blog post written by Joe Rath, the head of industry relations at Redfin’s parent company Rocket, on Thursday.

NWMLS’s rules currently do not allow for premarketing, preventing brokers from publicly marketing a home before it appears in the MLS. Redfin says that restriction conflicts with what many of its sellers want: a short “runway” period to gauge interest on a public platform before committing to a full launch.

The request comes ahead of a new Washington state law on private listing networks that takes effect in June. The law will require agents to market homes to the general public and all brokers at the same time. Redfin’s position, according to Rath, is that premarketing is compatible with the statute as long as the listing is publicly available to any buyer or agent, the seller gives informed consent for the premarketing and that brokers have access to the listing information. 

Redfin’s proposal is to create an explicit premarketing status within NWMLS. Under that framework, a listing would be filed with the MLS and visible to all member agents, preserving cooperation, while the seller and listing agent would retain more control over how the property appears publicly and when it transitions to fully active status. 

Across the country, many MLSs have some sort of coming soon status, which may or may not be part of the IDX data feed the MLS sends to sites like Redfin and Zillow, allowing for sellers and their agents to pre-market a property within the MLS prior to the listing going active. 

In the post, Rath noted that large MLSs including Bright MLS, MRED in Chicago, Unlock MLS in Austin, Canopy MLS, Realtracs and MLS PIN have already adopted seller-choice frameworks that incorporate some form of premarketing or coming soon status. Those policies generally aim to balance anti-pocket-listing rules with seller preferences to “test” the market.

“I’ve had sellers who just want a little runway before going fully live. Premarketing gives them that space to test the waters, get feedback, and feel confident in their next move,” Redfin agent Macartney McQuery is quoted as saying in the post.

The post highlighted a Tacoma case in which McQuery used a coming soon listing on Redfin.com for a unique 1800s home with few direct comparables. Redfin argues that the premarketing period allowed the seller to gauge interest and refine timing before listing the property in the MLS.

According to the blog, Redfin leaders have held “productive conversations” with NWMLS leadership, who have signaled a willingness to consider the proposal. Any change would likely require NWMLS to adjust how it defines public marketing and to clarify how its rules align with the new state law.

“Policies that give sellers more flexibility can encourage more homeowners to list, which can help increase inventory and give buyers more options,” Rath wrote in the post.

This post comes after Compass International Holdings (CIH), the parent company of Compass, the Anywhere Brands and @properties Christie’s International Real Estate, along with Rocket-Redfin, penned an open letter urging MLSs to adopt policies that support pre-marketing and phased marketing distribution and to cease penalizing or punishing agents for carrying out “seller-directed marketing plans.” 

The letter came just a few weeks after the companies entered into a mutually exclusive deal to publish Compass coming soon listings on Redfin.

Compass and NWMLS are currently embroiled in a legal battle over NWMLS’s listing policy, which requires listings to be entered into the MLS within 24 hours of the listing being publicly advertised and does not have an exemption for office exclusive properties. Earlier this month, NWMLS filed a counter claim against Compass alleging that the brokerage’s “three-phase marketing program” is a deceptive scheme that hides listing data from the public and violates Washington’s Consumer Protection Act.

This article was written by Brooklee Han and generated with the assistance of HousingWire Automation. It was reviewed by a HousingWire editor before publication. The system helps convert company announcements and industry data into HousingWire-style news coverage.

This post was originally published on here

  • About two-thirds of homeowners who recently made renovations chose to upgrade their home instead of moving to a new place, per a recent Redfin survey. 
  • Within this group of homeowners, millennials and Gen Zers are more likely than older people to remodel instead of move.
  • Most homeowners who renovated in the last year spent less than $20,000 on upgrades, signaling that a lot of them are opting for select improvements rather than a full remodel. 
  • Fresh paint, bathroom upgrades and  kitchen renovations are the most common improvements. 

Instead of moving, Americans are remodeling. More than two in five (43%) Americans renovated their home in the last year, and another 33% plan to renovate in the next year, according to a recent Redfin survey. 

For many, renovating is a deliberate alternative to seeking out a different home. Roughly two-thirds (65%) of homeowners who are recent renovators chose to upgrade their current home instead of  moving. For homeowners who are planning to renovate in the next year, 71% say they’re remodeling instead of buying a new place. 


This report is based on a Redfin-commissioned survey fielded by Ipsos in November 2025, fielded to 4,000 U.S. residents. Please see the end of this report for more on methodology. 

Homeowners are staying put because it is expensive to move. With high mortgage rates and home prices, moving isn’t an affordable option for many Americans–especially when about 80% of homeowners with a mortgage have an interest rate below current levels, according to a recent Redfin analysis. Other recent Redfin research shows that while housing inventory is increasing slightly on a year-over-year basis, there’s still a shortage of desirable, move-in ready homes for sale–especially those that are spacious enough for a family. 

Gen Zers and millennial homeowners are more likely than their older counterparts to remodel instead of move, with 77% of each generation saying they made improvements rather than moving in the last year. Those with kids living at home are also more likely than others to choose renovations. 

“Many Americans are choosing to stay put and make the home they already have work for them,” said Chen Zhao, Redfin’s head of economics research. “That could mean improving outdated spaces, adding space for a growing family or reconfiguring the existing space so it works for everyone. Younger homeowners are especially likely to renovate instead of jumping to a different house; they’re earlier in their homeownership journey and more willing to invest in improvements to build equity. Those with kids living at home are often motivated to plant deeper roots where they are so they can stay in the same school district and community.”

Most Homeowners Who Opt to Renovate Spend Under $20K on Upgrades


A lot of renovators are opting for meaningful improvements without busting their budget on a complete remodel. 

Roughly a quarter (23%) of people who renovated their home in the last year spent between $10,000 and $20,000 on improvements; the next-most common price tags were $1,000 to $5,000 (21% of recent renovators) and $5,000 to $10,000 (20%). A sizable share (16%) spent between $20,000 and $50,000 on renovations. 

The Lion's Share of Homeowners Who Renovate Spend Between $10K and $20K (Bar Chart)


Fresh Paint, Bathrooms and Kitchens Are Most Popular Improvements


Painting is the most popular upgrade; nearly half (47%) of recent renovators gave their home a fresh coat. Next are bathroom (43%) and kitchen (40%) improvements. Exterior maintenance and landscaping are also popular, with 35% of renovators opting for those upgrades. 

Climate resiliency is important to some homeowners, too: About one in seven (15%) added features to make their homes more resilient to natural disasters such as flooding, wind, fire and/or heat. 

Painting Is Most Popular Improvement, Followed By Bathroom and Kitchen Remodels (Bar Chart)


One way to fund renovations is with a cash-out refinance, which allows homeowners to use the equity they’ve built up in their house to pay for upgrades. Rocket Mortgage offers cash-out refinances, in which homeowners take out a bigger loan in exchange for putting cash in their pocket. 

Home improvements not only provide homeowners with the space and features they need to make their house comfortable, but they can be worthwhile in the long run. “If you can afford it, investing time and money into making your house look and feel better can help when it comes time to sell,” said Jo Chavez, a Redfin Premier agent in Kansas City, MO. “Updated homes tend to sell faster than fixer-uppers, and for more money.” 

Methodology


The survey results in this report are from a Redfin-commissioned survey fielded by Ipsos in November 2025, fielded to 4,000 U.S. residents. The results for this combined group of survey respondents have a credibility interval of +/-1.9 percentage points. 

This report is based on these questions from the survey: 

  • Which of the following best applies to you? Answer choices: I made improvements or renovations to my home within the past year, I plan to make improvements or renovations to my home in the next year, or neither statements apply to my situation. 
  • To what extent do you agree or disagree with the following statement: I made improvements or renovations to my home in the past year instead of moving to a new home. Answer choices: Strongly agree, somewhat agree, neither agree or disagree, somewhat disagree, or strongly disagree. For this report, we grouped together “strongly agree” and “somewhat agree.” This question was asked of respondents who said they made improvements or renovations to their home in the past year. 
  • To what extent do you agree or disagree with the following statement: I plan to make improvements or renovations to my home in the next year instead of moving to a new home. Answer choices: Strongly agree, somewhat agree, neither agree or disagree, somewhat disagree, or strongly disagree. For this report, we grouped together “strongly agree” and “somewhat agree.” This question was asked of people who said they plan to make improvements or renovations to their home in the next year. 
  • How much did you spend on renovating/improving your home in the past year? All answer choices listed in the chart above. This question was asked of respondents who said they made improvements or renovations to their home in the past year. 
  • Which of the following improvements or renovations have you made to your home in the past year? All answer choices listed in the chart above. This question was asked of respondents who said they made improvements or renovations to their home in the past year. 

Here’s the full survey questionnaire for questions referenced in this report. 

The post U.S. Homeowners Are Remodeling Instead of Relocating appeared first on Redfin Real Estate News.

This post was originally published here

While Mayor Zohran Mamdani’s administration has so far focused on affordability for renters, the mayor announced a plan to help landlords on Thursday. A new program managed by the city will reduce the cost of property and liability insurance for affordable and rent-stabilized housing. As the New York Times reported, the proposal is seen as a peace offering to property owners, whose interests have often been at odds with the administration. According to the city, the self-sustaining program will help address the rising cost of insurance, which has more than tripled since 2017.

“We cannot take on the housing crisis without confronting one of the fastest-growing costs facing New Yorkers: insurance,” Mamdani said.

“That’s why we’re creating the first city-backed insurance program—to help New Yorkers stay in their homes, give building owners the support they need to make repairs, and build a city that New Yorkers can actually afford.”

According to a report presented during an April 9 Rent Guidelines Board meeting, insurance was the second-largest contributor to the Price Index of Operating Costs (PIOC), which tracks changes in the cost of operating rent-stabilized buildings. Insurance costs rose 10.5 percent between April 2025 and March 2026.

Policies costing more than $11,382 saw an average renewal increase of 10.6 percent, while those at or below that threshold rose 10 percent. Buildings constructed before 1974 saw increases of 11.6 percent, compared with 5.4 percent for newer buildings.

Over the past five years, the cumulative PIOC has increased by 31 percent. Insurance costs rose nearly 100 percent over that period, making it the fastest-growing component in the index. Although insurance is one of the lowest-weighted components in the PIOC, it saw the fastest growth in price, accounting for 6.8 percent of the index’s cumulative 31 percent increase.

Those rising insurance costs are a key reason many landlords have opposed Mamdani’s policies, particularly his pledge to “freeze the rent” for rent-stabilized apartments, which make up roughly 40 percent of the city’s rental housing stock. They argue the policy could further strain already tight fiscal margins.

Landlords say they have already had to cut back on expenses such as maintenance in response to rising costs. Additionally, affordable housing developers often rely on loans to finance construction, with loan size tied to a building’s projected net operating income (NOI).

When insurance costs are high, NOI is reduced, resulting in smaller loans that must be supplemented with city subsidies to close the funding gap. The city estimates that every $100 increase in insurance premiums results in a $1,200 increase in city capital needed for new developments. Lowering premiums would lead to larger loans and reduced reliance on city capital, according to the Times.

Leila Bozorg, deputy mayor for housing and planning, told the Times the program could improve tenants’ lives, as landlords could redirect savings on insurance toward repairs and property improvements.

“The skyrocketing cost of insurance is putting affordable, rent-stabilized housing at risk and risks setting back our efforts to build a more affordable city,” Bozorg said. “This effort will use the city’s purchasing power to lower insurance premiums, helping our own investments in affordable housing go farther and reducing operating costs for owners of rent-stabilized housing.”

Bozorg said the program would be run by a private entity, though the city would retain oversight and a financial stake, and it would compete with other insurers in the marketplace. The city expects the program to pay for itself, generating revenue through premiums.

While many details of the program remain unclear, including eligibility, premium costs, and the overall cost to the city, the city’s Housing Development Corporation (HDC) will issue a request for proposals this week for an actuary or risk consultant to help design the program.

Ann Korchak, president of the Small Property Owners of New York (SPONY), said the program “raises many questions.”

“The insurance market is incredibly complex. It would take years for real reform to have a meaningful impact on the operating costs of economically distressed small private property owners,” Korchak said.

“The Mayor could have a more effective and immediate impact on the financial stability and quality of affordable housing by reducing property taxes and eliminating costly city mandates that burden small private property owners.”

This summer, the Economic Development Corporation (NYCEDC) will issue a request for expressions of interest to solicit proposals on how best to structure and operate the program. By 2027, the city expects to lower insurance costs for the first 20,000 homes, increasing to 100,000 homes by 2030.

The program’s unveiling comes weeks after an RGB report found that landlord incomes rose 6.2 percent citywide between 2023 and 2024, marking the third consecutive year of NOI growth.

A public hearing will be held by the RGB on April 23, followed by a preliminary vote on rent adjustments in May. See the schedule of meetings here.

RELATED:

The post Mamdani proposes city-backed insurance program to cut costs for some NYC landlords first appeared on 6sqft.

This post was originally published here

Title and escrow has long operated under the weight of manual processes and fragmented systems. Now, a new class of technology, agentic AI, is beginning to fundamentally transform how work gets done across the industry, driving greater speed, precision, scale and service.

The next evolution of artificial intelligence, agentic AI, does more than generate content in response to prompts. It understands context, reasons across sources and executes tasks, serving as a proactive teammate to human experts.

Title and escrow is well poised to benefit from agentic AI. The industry depends on document-heavy, strict-timeline workflows that demand accuracy across hundreds of steps. That’s an ideal environment for AI agents to reliably execute repetitive, time-consuming tasks while delivering business-building intelligence.

In fact, it’s already happening. Early adopters in title and escrow are seeing meaningful gains in velocity, efficiency, accuracy and overall operational excellence. An analysis found that Qualia Clear, an agentic AI system built specifically for the title and escrow industry, can reduce the time to process a file by 35% to50%, while enhancing work quality. For firms handling 1,200 transactions annually, that translates to approximately $325,000 in time savings value per year.1

“The firms that embrace agentic AI purpose-built for the title and escrow industry are going to operate faster, cleaner and with better margins,” says Mike Rubin, President of Shaddock National Holdings, the largest collective of independent title insurance agencies in the United States. “The ones that don’t will wake up one day and realize they can’t compete.”

So, how are firms applying the technology today? We answer that here.

Get out of the inbox much faster

With more than 100 emails tied to each transaction, managing the inbox is an operational bottleneck for title and escrow. Agentic AI is reducing that friction, slashing the time industry professionals spend on email.

Agentic systems like Qualia Clear can respond to emails and draft proactive messages. They can also organize inboxes by topics, urgency and new business. Of critical importance, the systems can take action, like opening new orders, as well as extracting key details from messages and attaching that information to the appropriate file.

The upshot is that title and escrow professionals can respond to emails up to three times faster, research shows, while also spending less time managing email and raising the standard of their work. 

“The ability to streamline communication and reduce manual follow-up allows us to focus on the more complex aspects of our files,” says Lindsey Mendoza, Director of Operations at the Law Offices of Elizabeth A. Byrne LLC, a Saratoga Springs, NY-based real estate law firm. “It not only saves us a significant amount of time but also ensures our clients and partners receive timely and consistent updates, which elevates the entire closing experience.”

But email is only one piece of the operational puzzle.

A powerful new operational engine

Another positive impact of agentic AI is the emergence of a new way of managing work that can execute tasks, monitor quality in real time and dynamically orchestrate workflows.

Within platforms like Qualia Clear, specialized AI agents will be able to handle processes such as retrieving property tax data, verifying business entities and helping coordinate with vendors to handle mortgage payoff or HOA information. At the same time, real-time quality assurance flags missing requirements, data mismatches and calculation discrepancies as they occur, which allows teams to resolve issues earlier and avoid downstream problems. 

Workflows themselves are accelerated and enhanced. Agentic AI can trigger tasks automatically based on file conditions or timelines, while firms can embed their own business rules into how work is completed. Intelligent queues help teams prioritize what matters most.

On the analytics side, the right agentic system for title and escrow will surface insights into referral performance, market share and growth opportunities, turning operational data into a launchpad for strategic action.

Importantly, the AI doesn’t remove human expertise. It empowers it. Teams remain in control, serving as expert reviewers with full visibility into every action.

The proof is in real-world results

For some title and escrow firms, these capabilities are already redefining performance benchmarks.

At Washington-based AEGIS Land Title Group, examiner capacity doubled from 10 commitments per day to 20 after instituting an agentic AI platform. At the same time, the firm achieved full file audit coverage, reducing the risk of missed errors.

Then there’s North Carolina-headquartered Thomas & Webber. Client communications had tripled, increasing operational risk and reducing closer capacity. After deploying agentic AI to automate email drafting, file actions and help with accuracy checks, the firm restored capacity to 40 files per month—a 33% increase—and avoided an estimated $117,000 in annual hiring costs.

“AI is changing so rapidly,” says Tiffany Webber, Managing Attorney at Thomas & Webber. “The longer you wait, the firms that have adopted AI will be that much further ahead.”

Meanwhile, The Title Group was looking to reduce risk associated with manual reviews/audits, while improving efficiency and scaling quality control. The Tennessee-based firm implemented an agentic AI system for real-time quality assurance. Files are now audited in seconds rather than hours, and each receives a comprehensive review.

Why a unified platform is pivotal

Realizing the full potential of agentic AI requires more than standalone technology tools. It depends on deep access to industry knowledge and each transaction itself—documents, data fields, workflow status and more—combined with the ability to take action within that environment.

This level of visibility and execution is difficult to achieve across fragmented systems that operate through complex external integrations. It becomes a reality within unified, cloud-based platforms made for title and escrow.

By embedding agentic AI directly into the title production environment, platforms like Qualia Clear can analyze files, initiate actions and maintain context across the full lifecycle of a transaction.

“This combination of industry knowledge, full data access and ability to take action is what enables agentic AI to dramatically elevate how title & escrow work gets done,”

— Charlotte Brown, Vice President of Product & Design at Qualia

Firms that embrace agentic AI now will lead the next era of title and escrow

For decades, title and escrow has relied on human expertise to manage extraordinary complexity under intense pressure. That hasn’t changed. What is changing is the operating layer around that expertise. 
Agentic AI can now take on much of the repetitive, time-intensive work—tracking, analyzing and executing across workflows. The result is more capacity for human judgment, stronger decision-making and a higher standard of execution. The technology is already delivering measurable results. And as underlying AI models like Claude and ChatGPT continue to advance, the capabilities of industry-specific agentic platforms built on them will accelerate in step.

“In 2026, agentic AI will advance faster than any technology the title & escrow industry has ever seen,” says Nate Baker, CEO & Co-Founder, Qualia. “The next year will usher in the most consequential transformation the industry has ever experienced.”

To stay at the forefront of AI in title & escrow, register now to attend Qualia’s 2026 Future of Real Estate Summit, April 27-29, in Austin, TX.

Footnote: 1. Time savings estimates are based on analysis of the 2024 ALTA report, “More than pushing a button: Estimating the time and complexity of clearing title,” which found an average of 22 hours to complete a file. Qualia applied a conservative 30% adjustment, then evaluated time savings based on customer feedback, product data, and internal analysis. Every company’s results will vary based on the current state of their operations and the extent to which they adopt Qualia Clear.

Register Now

This post was originally published on here

The mortgage industry is no longer debating whether AI has a role to play. That part is over. The real conversation now is about what kind of AI can work inside a business where decisions must be documented, policies must be followed, and every workflow may eventually be reviewed by risk, audit, or compliance. That is where AI agents are starting to get attention. 

Unlike basic AI assistants that summarize content or answer questions, AI agents are designed to handle tasks within a workflow. In mortgage, that could mean reviewing incoming documents, identifying missing conditions, checking for data inconsistencies, drafting borrower follow-ups, surfacing exceptions, or recommending next steps to processors and underwriters. The appeal is obvious. These tools can reduce manual effort, improve speed, and help teams focus on the cases that need the most judgment. But in mortgage, speed alone is never enough. If lenders want AI to move from experiment to production, they need to build systems that compliance teams can trust.

AI in mortgage needs structure, not just intelligence

One of the biggest mistakes companies make is treating an AI agent like a smarter version of a bot. That mindset is risky in any regulated industry, but especially in mortgages. A mortgage AI agent should not be a vague digital helper that can do a little bit of everything. It should have a clearly defined job, a narrow operating boundary, and a visible record of what it did and why it did it. AI agents in regulated financial institutions need distinct identities, explicit authority, and full auditability rather than being treated like generic automation running under the hood. 

That same thinking applies directly to lending. If an agent is being used to review asset documents, then its role should be limited to that purpose. If it helps with condition management, then it should stay within that lane. The more specific the task, the easier it becomes to validate performance, define controls, and explain outcomes to stakeholders who are rightly cautious.

Read first, act later

A practical way to build trust is to separate what an agent can read from what it can change. It translates well to mortgage operations. Most agents should be read-focused. They should gather information, compare documents, identify gaps, summarize findings, and recommend actions. A much smaller set of agents should be allowed to write back into systems, update statuses, or trigger workflow changes. Even then, those actions should often remain behind human approval gates. That distinction matters in real lending scenarios.

For example, a read-oriented agent could review an uploaded pay stub, compare it against checklist requirements, and flag that the coverage period appears incomplete. That is helpful and low risk. But changing a milestone, clearing a condition, or sending a customer-facing notice is very different. Once AI starts acting rather than making recommendations, the standard of governance gets much higher.

Lenders that get this right will not try to automate everything at once. They will start by using AI to improve visibility, reduce repetitive review work, and support human decision-making before they expand into controlled action.

Compliance teams need more than an answer

In mortgage, “the model said so” is not a real answer. If an AI agent flags a file, recommends an escalation, or suggests that a loan is ready to move forward, the business needs to understand how it reached that conclusion. Regulated institutions need causal traceability, meaning they must be able to reconstruct what data the agent used, what logic it applied, and how a decision was formed. 

That idea is especially relevant for mortgage lenders. Compliance, QC, capital markets, and servicing teams all care about different things, but they share one expectation: important actions should be explainable. If a loan document was marked insufficient, there should be a reason. If a borrower communication was recommended, there should be a basis. If an exception was surfaced, there should be a trail showing which policy rule, document fact, or workflow signal drove that output.

The best mortgage AI systems will not be the ones that sound smartest. They will be the ones who produce structured, understandable explanations in business language.

Trust is what turns AI into an advantage

The mortgage companies that get the most value from AI will not be the ones that deploy the flashiest demos. They will be the ones who take the time to build useful, bounded, well-governed agents into real workflows. That means starting with specific tasks. It means favoring read and recommend before write and execute. It means giving compliance and risk teams visibility into how outputs are produced. And it means proving performance in stages before expanding autonomy. Mortgage does not need AI agents that look impressive in a product presentation. It needs AI agents that can hold up in operations, in audit, and under compliance review. That is a higher bar. But it is also the bar that matters.

Sandeep Shivam is Head of Touchless Experience Product Suite of Tavant.
This column does not necessarily reflect the opinion of HousingWire’s editorial department and its owners. To contact the editor responsible for this piece: zeb@hwmedia.com.

This post was originally published on here

If you’re thinking about selling your home in Seattle, a behind-the-scenes industry debate could shape how your home comes to market. 

Redfin supports a seller’s choice in how their property is marketed, including premarketing to test pricing and demand. But home sellers in Seattle don’t have this choice because Northwest MLS (NWMLS), the region’s multiple listing service, currently prohibits all premarketing. 

We’ve asked NWMLS to update its rules to better align with what our customers want. And this comes at an apt moment. A new Washington State law addressing private listing networks will take effect in June. It requires agents to market homes to the general public and all brokers at the same time. At Redfin, we believe the law clearly supports premarketing as long as the listing is publicly marketed and the seller consents. That means a home can be shared on a publicly available platform, like Redfin.com, where any buyer or agent can view it freely.

Our proposal is to create a premarketing phase within the MLS. During that period, a home would still be filed with NWMLS and visible to all member agents and available to all buyers through those brokers, preserving the cooperation that the MLS is built on. At the same time, sellers and their agents would have more control over their data.

This approach fits within the law’s framework. The law requires public marketing and access for all brokers and buyers, but it does not prescribe exactly how or where that marketing must occur. Importantly, the law allows the homeowner to choose, not the MLS. Public display on a site like Redfin.com ensures broad visibility while giving sellers flexibility in how they go to market.

We’re already seeing demand for this flexibility from sellers in the Seattle area. As Redfin Agent Macartney McQuery put it, “I’ve had sellers who just want a little runway before going fully live. Premarketing gives them that space to test the waters, get feedback, and feel confident in their next move.” 

McQuery recently tested a Coming Soon listing on Redfin.com in Tacoma. His sellers have a very unique home. It is an 1800s build that doesn’t have direct comparables in the neighborhood, so being able to launch as a Coming Soon and gauge interest helped them make the right decision for when the listing went live on the MLS.

This shift is already underway across the country. Major MLSs including BrightMLS, MRED in Chicago, UnlockMLS in Austin, Canopy MLS, Realtracs, and MLSPIN have all adopted seller-choice frameworks that include a pre-marketing status within the MLS. The momentum is clear: the industry is moving toward giving sellers more flexibility, not less. We’re asking NWMLS to join that movement.

Redfin’s goal is to work constructively with NWMLS and the broader industry to find a solution that keeps listings available on the MLS, supports transparency for agents, and gives sellers the flexibility they’re asking for. We’ve had productive conversations with leaders at NWMLS who have expressed an openness to hearing our ideas and considering our proposal. 

For the broader market, the outcome of this discussion matters. Policies that give sellers more flexibility can encourage more homeowners to list, which can help increase inventory and give buyers more options.

We believe that’s achievable, and we’re committed to continuing that conversation in the open.

The post Redfin Calls on NWMLS to Give Home Sellers More Choice appeared first on Redfin Real Estate News.

This post was originally published here

Republican lawmakers in Kentucky sought to put the state on the housing reform map with sweeping legislation to boost construction and curb rising costs. But the package collapsed in the final hours of the state’s legislative session this week, and housing advocates warn the state’s housing shortage will deepen without swift action.

Kentucky’s failure shows how difficult housing politics remain even as other states manage to pass modest reforms.

“The Kentucky Senate has chosen politics over the people and passivity over good policy,” Heather LeMire, director of conservative advocacy group Americans for Prosperity-Kentucky, said in a statement. “The people of Kentucky deserve a better shot at the American Dream through homeownership.”

The omnibus measure, built around Senate Bill 9, bundled more than eight proposals to expand housing supply, streamline permitting and create new tools for local governments to support development. A conference committee could not bridge divisions between the House and Senate before adjournment, dooming the proposal for the year.

Sen. Robby Mills, who sponsored SB 9, told local reporters that negotiators ran out of time as they struggled over a controversial short-term rental provision that would have blocked cities and counties from heavily restricting short-term rental properties listed on platforms such as Airbnb.

“The Senate and House simply could not agree at the end of the day,” Mills said, calling the short-term rental language “one of the stickier points.”

Some Republicans joined Democrats in opposing that section, reflecting unease over state preemption of local rules.

Fixing a housing crisis falls short

Advocates and lawmakers spent months pushing for a major housing package to address the state’s housing shortage, which a 2024 legislative task force put at 206,000 units, split evenly between rental and owner-occupied homes.

Last year, state lawmakers made a less aggressive attempt with two bills. One would have allowed faith-based organizations to build housing by right on the property they own.

That change has gained favor elsewhere in the country. But the bill did not pass in Kentucky last year because lawmakers worried about preempting local zoning control.

The other bill passed and became law. It allows cities and counties to issue industrial revenue bonds for multifamily projects with at least 48 units by redefining a “building” to include large condominiums, townhouses and apartments. The law also restricts zoning and planning appeals to owners of property that directly borders a site affected by a final decision.

Added language became too much

This year, Kentucky lawmakers chose an omnibus approach. The original SB 9 would have allowed local governments to designate special building zones, lower regulatory barriers and tap new financing tools to kickstart construction in targeted areas.

In the final days of the session, lawmakers added provisions. These included language requiring automatic expungement of dismissed eviction filings, along with protections to keep children from being named in eviction cases that can follow tenants for years. Those measures drew support from tenant advocates, who argued they would prevent minor court actions from becoming long-term barriers to stable housing.

But other parts of the bill raised alarms among some Democratic lawmakers and local officials, who said the package moved too far and too fast in rolling back safeguards and local discretion.

Under one section, local regulators would have had to inspect properties within five days and review building plans within 10 days. If they missed these deadlines, they would have had to issue temporary permits allowing work to begin immediately and refund all application fees.

Critics said that approach could allow projects to move ahead without adequate review and further strain already thin inspection staffs.

This post was originally published on here

Growing up in poverty in Chicago, Realty of America founder and CEO Eddie Garcia, remembers going to the Archdiocese of Chicago on Tuesdays each week as a child to pick up a small box of food for his family. 

“I came from extreme poverty,” Garcia said. “Both of my parents were homeless, living under highway overpasses in Mexico City. We came to America when I was three, and we arrived to a one-bedroom apartment that we shared with 11 people.” 

Gracia said this experience growing up defined who he is now and why he wanted to chase his version of the American dream.

“When I was 16 or 17, I decided that there was no way I was going to repeat the cycle of poverty,” he said. “I wanted to change my life. I believe we are in the greatest country in the world and if you want to chase your version of your American dream, you can do it here because there is fairness. America doesn’t care where you come from.” 

Initially, Garcia believed a law degree was his path to a brighter future, but after meeting a successful real estate agent in his neighborhood, he decided to drop out and pursue a career in the housing industry. 

“Once I got my license, I didn’t sell anything for the first six months. Once I sold something, my broker didn’t pay me,[but] I still realized that I had found a way to make money. I thought that if I could scale it and replicate it, I could become very successful very fast,” Garcia said. “So, I went from 20 homes to 40 homes to 50 homes in a year. In my best year as a single agent, I sold 104 houses.” 

Founding Realty of Chicago

Garcia said he spent the next nearly two decades “married to his business,” founding his first firm Realty of Chicago in 2012.

“A lot of the same people I grew up with saw my success and wanted to become agents, so I told them to get their license and find a brokerage to work at and we could do masterminds. But they all wanted to work with me, so I opened Realty of Chicago,” Garcia said. “We started from zero and grew to about 400 agents doing 12,000 transactions a year.” 

In 2023, Garcia had an idea for his next venture: a national brokerage firm. This led him to approach Houston-based real estate team leader, Mark Dimas. In 2023, Dimas’s team was the No. 1 large team in the country by transaction side count in the RealTrends Verified Rankings

“As I grew Realty of Chicago, I started making friends throughout the country who were building their own businesses and we would mastermind, but I knew that the model I had in Chicago would not scale in some of these other cities,” he said. “Mark Dimas was the first person I spoke with about Realty of America because who better to talk to about my crazy idea than one of the top agents in the U.S.?” 

Launching Realty of America

To Garcia’s surprise, Dimas decided to join him in building Realty of America, a virtual, cloud-based firm which officially launched in September 2024. 

“We made lists of the top-50 agents that we admire, not because they are just great [real estate agents], but because they are great humans and business people. We started reaching out to them and meeting with them,” Garcia said. “We went to a conference in Miami and met with several one-on-one. Then, within two days, we had solidified the starting seven agents we wanted to build the company with.” 

These agents quickly went to work, and in 2025, Realty of America closed 9,374 transaction sides, totaling $3.82 billion in sales volume, according to RealTrends Verified data. This earned the firm the No. 42 rank in the nation for sides and the No. 61 rank for volume in the 2026 RealTrends Verified Rankings in just its first full year of operation. Garcia said the firm currently has over 3,100 agents and is open in 22 markets, with launches in Nashville, Michigan and Puerto Rico expected in the coming weeks. 

Central to Realty of America, according to Garcia, is the firm’s revenue share model, a model which he feels is the future for real estate brokerages. Ultimately, Garcia would like to take the firm public. “We are still a little small, so I’d love to wait until we have 12,000 to 15,000 agents and are debt-free and profitable,” Garcia said. “We have not taken any investor money, and we are not going to until we IPO. We’ve watched some of these other companies before us, and we don’t want to make the same mistakes.”

“I’d love to wait until we have 12,000 to 15,000 agents and are debt-free and profitable,” Garcia said. “We have not taken any investor money and we are not going to until we IPO. We’ve watched some of these other companies before us, and we don’t want to make the same mistakes.”

In addition to the firm’s expansion, Garcia is also proud of the technology Realty of America is developing, having already built its own application, as well as consumer and agent platforms. He said he would like Realty of America to own at least 60% of the technology it uses before he takes the company public, hopefully in the next few years. Garcia said Realty of America was already approached by a sponsor to do an IPO, but he feels the company is still too new to make the jump.

“I think in the next five years, we will see the majority of agents become part of a revenue share model, which means that roughly 160,000 agents will move to revenue share a year, which is a massive opportunity for us,” Garcia said. 

Finding leaders to scale the firm

While attracting agents is certainly a goal, Garcia said he is “uber focused” on finding the right leaders to help him scale the company and reach their goals. 

“We have a great executive team with a lot of people from eXp and Real Brokerage, who helped scale those operations,” Garcia said. “With my business, I don’t want to be the smartest person in the room. I want to get people that are way smarter than me.” 

Garcia’s story is less about a single breakout moment and more about a steady refusal to accept limits — whether in his own life or in the way brokerages operate. As Realty of America scales, its success will hinge on whether that same scrappy, people-first approach can translate across markets without losing its edge.

For now, Garcia is betting that alignment — through leadership, technology and revenue share — will prove more durable than traditional models. And if his track record is any indication, he’s not building for the next quarter, he’s playing the long game.

This post was originally published on here

Real estate commissions for first-time homebuyers have barely budged since the National Association of Realtors’ (NAR) commission lawsuit settlement, while the rising popularity of pocket listings and worsening affordability are creating new access hurdles, according to survey of housing counselors from the Consumer Federation of America and the National Urban League, released Thursday. 

Authored by Sharon Cornelissen, Katie McCann and Ethan Weiland, the study, titled “Escalating Housing Costs, Hidden Listings,” draws on survey responses from 223 housing counselors across 37 states collected in July and August 2025, roughly a year after the business practice changes outlined in NAR’s settlement took effect. Researchers also conducted nine in-depth interviews with housing counselors, who provide individual guidance to first-time homebuyers and educate consumers in homebuyer classes.

The authors claim that their findings offer an early look at how the landmark settlement and shifting brokerage practices are affecting first-time buyers in an already constrained market.

Commissions largely unchanged despite decoupling

Only 7% of counselors surveyed said their first-time homebuying clients are paying lower real estate commissions than a year earlier. A larger share, 36%, disagreed with the belief that commissions have fallen and 28% were neutral, suggesting commission levels have remained stable or edged higher.

The report notes that this aligns with internal data from Redfin, which shows buyer’s agent commissions largely unchanged since NAR’s new rules rolled out in August 2024.

Counselors identified a lack of fee negotiation as a primary reason. Two-thirds of respondents said their clients “never,” “rarely” or only “sometimes” negotiate agent fees. Just 16% said clients negotiate “often” or “always.” In November 2025, a mystery shopped study published by the Consumer Policy Center found that buyer’s agents “make it very difficult for homebuyers to negotiate lower rates,” which may also contribute to the lack of fee negotiations. 

In interviews conducted by the authors, some respondents reported that buyers who try to negotiate commissions risk being labeled “difficult” by agents, which can limit their ability to find representation in tight local markets. That dynamic, the authors argue, points to persistent cultural and structural resistance to price competition in brokerage services even after the settlement.

Buyers more exposed to fees, but deals rarely die over commissions

The survey results suggest responsibility for paying buyer’s agent fees has shifted, at least partially, toward buyers. Just 26% of counselors said sellers “often” or “always” cover the buyer’s agent commission; 53% reported sellers “never,” “rarely” or only “sometimes” pay it.

Still, 47% of counselors said they “never” or “rarely” see a home purchase fail because buyers cannot afford the buyer’s agent commission and receive no seller help. Only 9% said this happens “often” or “always.”

Counselors also reported stepping in to help clients budget for the additional cost, treat buyer-broker fees as part of savings targets and understand the new rules. The data suggest that, to date, the feared widespread exclusion of first-time or low-wealth buyers purely due to buyer-broker commissions has not materialized at scale.

For lenders and real estate brokerages, this implies that while buyer cash-to-close is under more pressure, commission structure changes are not yet a primary driver of fallout. However, the report notes this is an emerging trend that may warrant continued monitoring as consumer awareness and enforcement evolve.

Affordability and inventory dwarf commission concerns

When asked to rank the top challenges facing first-time buyers in 2025, counselors overwhelmingly cited core affordability and supply issues rather than brokerage access, with 88% responding that “saving up for a down payment” is “difficult” or “very difficult” for clients, 73% citing “finding a house that meets their needs” as a major challenge, 70% pointing to paying out-of-pocket costs, 64% highlighting building up credit scores and 50% saying buyers are being outcompeted by other buyers. 

Counselors told researchers that rising home prices, limited stock that can pass inspection in some markets and shrinking down payment assistance were squeezing clients even when they had strong credit or obtained aid. Debt loads from auto and student loans also frequently kept buyers from qualifying for mortgages.

Pocket listings emerge as a fair housing and access risk

The report highlights the growth of pocket or private listings as an emerging concern for first-time buyers and homebuyers of color.

In the survey, 46% of housing counselors said first-time buyers “sometimes,” “often” or “always” struggle with pocket listings. About 31% said their clients “never” or “rarely” experience issues, and 23% answered “don’t know,” which the authors attribute to the relative newness and opacity of the practice.

Pocket listings can keep a portion of inventory within a single firm or network, allowing brokerages to capture both sides of a transaction and reducing visibility for buyers represented by competing firms or searching independently. A recent analysis by Bright MLS cited in the report found that nearly 8% of new listings in February 2025 in its mid-Atlantic footprint started as office exclusives, up from a historical range of 2% to 4%, with some ZIP codes in the Washington, D.C., metro area exceeding 20%.

The brief flags equity concerns, noting prior research that private listings can reinforce segregation and enable discriminatory steering. The National Association of Hispanic Real Estate Professionals (NAHREP) has warned the industry could be on the “cusp of the worst fair housing crisis since the 1960s” if pocket listings expand unchecked.

Housing counselors’ role grows as rules shift

The report also emphasizes the role of the U.S. Department of Housing and Urban Development (HUD)-certified housing counselors as independent advisors. Counselors, who do not earn commissions or origination revenue, work with dozens or hundreds of clients annually, often from early credit-building stages through closing and, in some cases, post-purchase.

The authors argue that as commission structures and listing practices evolve, counselors are serving as key interpreters of new rules for first-time and low-income buyers, developing curriculum on how to select an agent, negotiate compensation and understand contract terms.

According to the report, the continued and stable funding of housing counselors is a consumer protection and market-functioning issue rather than only a social service.

Policy recommendations for data, oversight and counseling

Looking ahead, the study calls for several policy responses targeted at improving transparency and mitigating emerging risks, including things like Federal Housing Finance Agency (FHFA) mandated collection and public reporting of real estate commission data, the monitoring of pocket listings for disparate impact on buyers of color and the funding, training and recognition of housing counselors by HUD. 

NAR did not immediately return HousingWire’s request for comment on the study.

This article was written by Brooklee Han and generated with the assistance of HousingWire Automation. It was reviewed by a HousingWire editor before publication. The system helps convert company announcements and industry data into HousingWire-style news coverage.

This post was originally published on here

The House Financial Services Subcommittee on Financial Institutions held a hearing on Thursday morning examining ways to expand access to credit, with lawmakers also considering several bills aimed at reshaping credit reporting rules and consumer protections.

The hearing, “Promoting Access to Credit for Everyday Americans,” comes as policymakers continue to weigh changes to the credit reporting system amid ongoing debates over consumer access to credit and regulatory oversight of financial institutions.

The conversation focused on a slate of Republican-backed bills to amend the Fair Credit Reporting Act (FCRA), expand the use of alternative data in credit files and tighten controls on complaints filed with the Consumer Financial Protection Bureau (CFPB).

In addition to the hearing, the subcommittee will consider several pieces of legislation related to credit reporting and consumer protections.

Witnesses included Dan Smith, president and CEO of the Consumer Data Industry Association; Rebecca Kuehn, a partner at Hudson Cook; Celia Winslow, president and CEO of the American Financial Services Association; Veneshia Ferdinand, director of compliance policy at Simmons Bank, testifying on behalf of the American Bankers Association; and Chi Chi Wu, director of consumer reporting and data advocacy at the National Consumer Law Center.

Absent from the hearing was French Hill (R-Ark.), chairman of the House Financial Services Committee, who spoke earlier in the week at the Mortgage Bankers Association (MBA)’s National Advocacy Event. Hill did not get into specifics about legislation but instead pushed for advancing smaller, targeted bills with bipartisan support rather than sweeping packages — an approach he argues can help move financial services legislation more effectively through Congress.

Congressman Andy Barr (R-Ky.) opened the hearing by defending the current framework as essential to economic mobility, warning that proposals to exclude certain debts or adopt “positive-only” reporting would erode accuracy.

“A credit reporting system that ignores real obligations is not more fair, it’s simply less accurate,” Barr said. “When accuracy suffers, access to credit suffers with it.”

‘Credit washing’ claims

Barr also pointed to what he described as a surge in duplicative or fraudulent complaints in the CPFB’s database, which are often tied to credit repair firms. He promoted his bill, the Eliminating Fraud in the CFPB Consumer Complaint Database Act (H.R. 7588), which would require consumers to attest to complaints under penalty of perjury and allow institutions to dismiss those deemed illegitimate.

The witnesses echoed concerns about so-called “credit washing,” where mass disputes or false identity theft claims are used to remove accurate negative information. Winslow said bad actors “flood lenders, bureaus and the CFPB complaint database” with form disputes, forcing removals.

“Corrupt that data and the whole system is compromised,” Winslow said, adding that the result is tighter lending standards and higher costs for borrowers.

Ferdinand said lenders rely on complete reports to meet legal obligations. “Removing accurate information … does not eliminate the risk — it just hides it,” she said.

A central point of debate was the FCRA Liability Harmonization Act (H.R. 5775), which would cap damages and limit attorneys fees in credit reporting lawsuits. Supporters, including Smith and Kuehn, said uncapped liability has fueled costly litigation, discouraged data reporting such as rent and utilities, and limited competition.

“The liability risk … is enormous. It’s uncapped and it will put a company out of business overnight,” Smith said.

“The FCRA framework works because it balances consumer protection and access to credit,” Ferdinand said. Kuehn added that large settlements ultimately raise costs for consumers while reducing innovation and credit access.

Democrats and consumer advocates sharply disagreed. Wu said the bills under consideration would “drastically reduce accountability” for errors and make it harder for consumers to seek relief.

“We oppose each of the bills posted today, which all benefit the big three credit bureaus, the most complained-about financial services companies with 5 million complaints to CFPB,” Wu said at the start of her testimony. “Instead of these four giveaway bills, we urge Congress to pass meaningful reform of the credit reporting industry.”

Democrats also criticized changes at the CFPB under Director Russell Vought, arguing the agency has made it harder for consumers to file complaints.

Lawmakers in both parties showed interest in expanding the use of alternative data — such as rent, utility and telecom payments — to help consumers with limited credit histories. Rep. Young Kim (R-Calif.) promoted legislation to incorporate such data, while industry witnesses supported broader reporting but opposed the exclusion of negative information.

Wu warned that including negative rental data could harm vulnerable tenants, arguing any such reporting should be voluntary and limited to positive information.

Members also raised concerns about artificial intelligence, with witnesses noting it could both reduce errors and enable more sophisticated fraud. Smith called AI a “significant risk,” while Winslow said a large share of disputes are already driven by questionable claims.

MBA voices concerns

MBA, in a letter submitted for the record, raised separate concerns about the structure of the credit reporting market. The trade group argued that a lack of competition among the three major credit bureaus — Experian, TransUnion and Equifax — has driven steep cost increases for lenders and borrowers.

MBA said its members have faced credit reporting cost increases of as much as 350% in recent years, along with projected hikes of 40% to 50% in 2026. These costs are passed on to borrowers through higher closing costs. The group attributed the increases in part to the long-standing tri-merge requirement that forces lenders to obtain reports from all three bureaus for mortgages backed by Fannie Mae, Freddie Mac and federal agencies.

“MBA and its members are strong supporters of the welcome focus on pursuing all avenues to improve housing affordability by the Trump administration — and within the individual party caucuses in both the House and Senate,” according to the letter signed by Bill Killmer, the MBA’s senior vice president of legislative and political affairs.

“Given the recent exorbitant price increases cited above, we believe removing the current mortgage tri-merge framework should be a key element on any checklist of affordability initiatives put forth by federal policymakers.”

The group ended its letter by stating that single-file credit reports are already used safely in other consumer lending markets, and that eliminating the tri-merge requirement for most Fannie- and Freddie-backed loans would increase competition, lower closing costs and improve access to homeownership without adding risk.

MBA also pointed to data showing most borrowers have high credit scores, proposing a single-report option for those above 700, while noting that federal housing regulators have previously determined a tri-merge report is not necessary.

This post was originally published on here

Today’s real estate CRM software makes it easy to stay organized, generate, convert and nurture leads on autopilot and automate the tedious but crucial daily tasks that build lasting client relationships. Our team of experienced agents reviewed dozens of real estate CRMs to help you find the best fit.

We chose the best real estate CRMs for 2026 based on their value for money, organization, marketing, lead-nurturing features and scalability to support your growing business. In this update, we review nine CRMs (and one CRM add-on) that leverage the latest technology, including AI, to help you scale your business faster. Let’s get started!

Our picks: The best real estate CRMs for 2026

Logo-Hondros-college

Best value for agents and teams

Follow Up Boss

From $58/month

Jump to details ↓

VISIT

Logo-300x100_The-CE-Shop

Best for AI-powered email marketing on a budget

Lone Wolf Relationships

From $33.25/month

Jump to details ↓

VISIT

CINC logo; a real estate CRM or customer relationship management software

Best for top producing agents and teams

CINC

From $899/month for solo agents, $1500/month for teams

Jump to details ↓

VISIT

Top Producer logo.

Best for experienced buyer agents

Top Producer

From $179/month

Jump to details ↓

VISIT

iHomeFinder logo.

Best for lead gen system + seller leads

iHomeFinder

From $169/month + $250 one-time setup fee

Jump to details ↓

VISIT

rechat-logo

Best for mobile CRM + marketing tools

Rechat.

From ~$35/seat, based on team size + features

Jump to details ↓

VISIT

Perry Real Estate College logo

Best for automated marketing + lead nurturing

Sierra Interactive

From $299.95/month

Jump to details ↓

VISIT

Perry Real Estate College logo

Best for affordable marketing tools

Wise Agent

From $49/month

Jump to details ↓

VISIT

Perry Real Estate College logo

Best budget all-in-one CRM platform

Real Geeks

From $399/month

Jump to details ↓

VISIT

Perry Real Estate College logo

Bonus: Best add-on to supercharge your CRM

Fello

From $165/month

Jump to details ↓

VISIT

Our picks: The best real estate CRMs for 2026

Best value for agents and teams

Follow Up Boss

From $58/month

VISIT

Jump to details ↓

Best for AI-powered email marketing on a budget

Lone Wolf Relationships

From $33.25/month

VISIT

Jump to details ↓

Best for top producing agents and teams

CINC

From $899/month for solo agents, $1500/month for teams

VISIT

Jump to details ↓

Best for experienced buyer agents

Top Producer

From $179/month

VISIT

Jump to details ↓

Best for lead gen system + seller leads

iHomeFinder

From $169/month + $250 one-time setup fee

VISIT

Jump to details ↓

Best for mobile CRM + marketing tools

Rechat.

From ~$35/seat, based on team size + features

VISIT

Jump to details ↓

Best for automated marketing + lead nurturing

Sierra Interactive

From $299.95/month

VISIT

Jump to details ↓

Best for affordable marketing tools

Wise Agent

From $49/month

VISIT

Jump to details ↓

Best budget all-in-one CRM platform

Real Geeks

From $399/month

VISIT

Jump to details ↓

Bonus: Best add-on to supercharge your CRM

Fello

From $165/month

VISIT

Jump to details ↓

Follow Up Boss: Best value for agents and teams

Follow Up Boss logo; a real estate CRM or customer relationship management software

Follow Up Boss (FUB) strikes the ideal balance between powerful features and affordability for solo agents and teams. Instead of piling on unnecessary bells and whistles, it connects seamlessly with over 250 popular real estate tools, making it the central hub for your business. Think of it as an operating system that allows you to control all the real estate software you’re already using with one login.

Beyond integrations, Follow Up Boss delivers powerful built-in tools to keep you organized and close deals faster. Every plan includes access to a vast library of email and text templates crafted by top agents, built-in texting features and advanced automations called Action Plans. These let you combine emails, texts and tasks into personalized follow-up campaigns for different leads.

A built-in dialer with call logging, recording and AI-generated call transcripts is available as a $33 upgrade for the Grow plan, but included with every team plan. Follow Up Boss’s value proposition is clearest for small teams, but its unbeatable combination of features and value makes it a winner for solo agents as well.

Pros & Cons

  • Acts as a central hub to connect and control all your real estate software
  • Drip campaigns (Action Plans) are highly customizable and can include videos
  • Intuitive user interface for speed and efficiency
  • Extensive library of action plans, text and email templates
  • Daily live and on-demand video training for easy onboarding
  • Dialer is a $33 per month upgrade
  • Text messages can only be added to Action Plans via third-party tools
  • No built-in AI features
  • Mobile app has limited functionality

Standout features

  • Integrations with 250+ real estate apps
  • Pre-written email and text templates created by the Follow Up Boss community 
  • Pre-built Action Plans created by the Follow Up Boss community 
  • Smart Lists show daily task reminders for contacts and leads
  • Built-in dialer available ($33 upgrade)
  • Website pixel connects to your IDX website to track properties your lead viewed
  • Team features include lead routing,  leaderboards, AI-powered call recording and transcripts and speed-to-lead analysis

Pricing

  • Free Trial: 14 days
  • Grow: $58 per month
  • Pro: $416 per month for 10 users
  • Platform: $833 per month for 30 users

Visit Follow Up Boss

Lone Wolf Relationships: Best for AI-powered email marketing on a budget

lone-wolf-logo

Lone Wolf Relationships is an intuitive and easy-to-use CRM that includes everything you need (and nothing you don’t) at a significantly lower price than competitors. Both new and experienced agents will find a lot to love here, especially with the inclusion of Gmail and Outlook calendar syncing.

You get intuitive and customizable dashboards, AI-powered email marketing, pre-written email templates and automations that let you create lead campaigns by blending drip emails with scheduled tasks. It also integrates with EZ Texting, allowing you to send one or bulk text messages to your contacts. Lone Wolf Relationships is an excellent choice if you want an AI-powered CRM built for real estate that just works, without breaking the bank.

Pros & Cons

  • Affordable pricing
  • AI-powered email marketing
  • Automations blend email drip campaigns, texting and task reminders
  • Email template library saves time and energy drafting emails
  • Seamlessly integrates with other Lone Wolf software, including CloudCMA, websites, eSignature and transaction management
  • No built-in dialer
  • Limited prebuilt email drip campaigns
  • No direct MLS connection
  • Texting feature only available via EZ Texting

Standout features

  • AI-powered email writing assistant
  • Customizable automation templates
  • Pre-written email templates
  • Texting features available
  • Pre-built automations
  • Contact activity timeline

Pricing

  • Free trial: 14 days
  • Paid yearly: $33.25 per month
  • Paid monthly: $39 per month

Visit Lone Wolf Relationships

CINC: Best for top producing agents and teams

CINC logo; a real estate CRM or customer relationship management software

CINC is an all-in-one real estate CRM platform ideal for top-producing buyer agents, listing agents and teams. The platform features a sophisticated CRM integrated with a lead capture IDX website that utilizes AI to attract, qualify and automatically nurture buyer and seller leads based on their behavior.

CINC’s Autotracks feature handles lead-nurturing automation. Using Autotracks, you can create sophisticated drip campaigns that include automated emails, texts and task reminders based on the lead’s behavior on your website. Although CINC is significantly more expensive than our other top picks, the monthly price includes buyer leads.

Pros & Cons

  • All-in-one CRM, marketing and lead gen platform 
  • Send bulk emails and texts right from the CRM
  • Autotracks campaigns can include text messages and videos
  • Automated outreach and follow-ups based on lead behavior 
  • Sophisticated lead-nurturing automation 
  • Video emails and texts available
  • More expensive than other CRMs (but leads are included in the price)
  • AI-chatbot is a pricey $200 per month upgrade 
  • No AI-powered email or text message writing feature 
  • Sophisticated platform with a steep learning curve and setup time
  • Smaller community than Follow Up Boss

Standout features

  • Sophisticated drip campaign builder (Autotracks)
  • IDX property search website tracks leads’ behavior 
  • AI chatbot trained by real estate agents
  • Built-in email, text and calling features 
  • Home valuation landing pages 
  • Agent and client-facing mobile apps

Pricing

  • Free trial: Not offered
  • Solo agents: starting at $899* per month*
  • Teams: Starting at $1500 per month*

*Leads are included in all CINC pricing plans. The company does not sell its CRM software without done-for-you lead generation.

Check out CINC

This post was originally published on here

A new survey indicates that residential contractors and remodelers began the second quarter on an optimistic note, but economic uncertainty driven by the war in Iran could complicate the picture. 

The Houzz Q2 2026 U.S. Houzz Pro Industry Barometer, a survey conducted between March 17 and April 6, found that construction and design pros expect a mixed spring after a Q1 slowdown. Respondents reported softer activity to start 2026 but entered the second quarter with cautious optimism and leaner backlogs, according to the report. 

The quarterly survey of 989 residential construction and design firms on the Houzz platform found that sentiment is diverging by business type. Design-build firms are signaling a sharp pickup in work, while build-only remodelers expect more modest gains. In the design sector, interior designers are more upbeat than architects.

“After recent activity slowed in the first quarter compared with the end of 2025, construction and design pros are entering Q2 with cautious optimism, particularly in construction, where expectations for new projects are showing early signs of a rebound,” Marine Sargsyan, head of economic research at Houzz, said in a statement.

“At the same time, persistent cost pressures and client hesitation are reshaping how firms compete. We’re seeing pros adapt in real time with construction firms investing in workforce development and more flexible pricing, while design professionals are doubling down on client experience and branding.”

How firms are competing for projects and talent

According to the Houzz survey, most firms are focusing on communication, pricing and workforce development to stay competitive in this environment.

In response to heightened competition over the past three months, 60% of construction pros and 45% of design pros said they have improved client communication. Construction firms are relying more on financial tools to win work, with 42% adjusting pricing or offering promotions, versus 19% of design firms.

Recruiting and retention strategies are also shifting. More than half of construction firms (57%) said they are offering on-the-job training to appeal to younger workers. Design firms are leaning more on academic partnerships, cited by 26% of respondents.

Both sectors reported increased use of social media in recruiting — 35% of construction firms and 36% of design firms — and are highlighting their use of advanced technology, including AI and project management platforms, to attract tech-focused candidates (10% of construction firms and 16% of design firms).

For remodelers and design practices, the barometer suggests that investments in communication, digital tools and training are becoming table stakes in a market where homeowners are more selective and projects are taking longer to convert.

Costs, macro risk and labor weigh on outlook

Rising input costs and a choppy macro backdrop remain the primary headwinds as firms plan for the second quarter. Nearly half of construction businesses (49%) and design firms (45%) cited higher prices for products and materials as a top concern, according to the company’s announcement.

Client hesitation is another drag. More than one-quarter of firms in both sectors reported that homeowners are delaying projects, including 27% of construction companies and 30% of design firms. In construction, 67% of respondents reported facing skilled labor shortages.

Bigger-picture risks are especially acute for design professionals. Roughly 30% of design firms pointed to geopolitical uncertainty (30%) and tariffs (30%) as concerns, compared with 23% and 17% of construction firms, respectively.

Shaky consumer confidence is another issue. According to a survey from the University of Michigan, consumer sentiment fell 11% in March to its lowest level on record, driven primarily by economic shocks resulting from the war in Iran. And Redfin says that 36% of American workers are delaying or canceling big purchases as consumers worry about job security, inflation and high borrowing costs.               

Construction sentiment improves as backlogs ease

The Expected Business Activity Indicator for construction firms, which tracks expectations for project inquiries and new committed projects, rose 3 points to reading of 58 for Q2 2026. Scores above 50 indicate more firms reporting quarter-over-quarter increases than decreases.

The improvement was driven by stronger expectations for new committed projects, which climbed to 59, up 6 points from Q1. Expected project inquiries held steady at 57.

Outlooks diverge sharply by business model:

  • Design-build firms reported a Q2 expected business activity reading of 66, up 10 points from 56 in Q1
  • Build-only remodelers posted an expected activity score of 50, down 5 points from 55, signaling a flatter pipeline

Backlogs in construction continued to normalize from last year’s elevated levels. The Project Backlog Indicator fell to 5.6 weeks at the start of Q2 2026, down from 6.4 weeks a year earlier.

  • Build-only remodelers reported a 4.6-week backlog, down slightly from 4.8 weeks in Q2 2025
  • Design-build remodelers saw a larger decline, to 6.7 weeks from 8.0 weeks a year earlier

Recent activity weakened during the first quarter. The Recent Business Activity Indicator for construction — covering actual project inquiries and new committed projects — declined to 48 in Q1 2026 from 51 in Q4 2025.

  • Project inquiries improved modestly, rising 2 points to 51
  • New committed projects fell 7 points to 45

Among firm types, the recent activity index fell to 50 for build-only remodelers, down from 59, but rose to 46 for design-build firms, up from 43.

For lenders and suppliers focused on the remodeling channel, shrinking backlogs and lower recent activity suggest some easing of capacity constraints alongside softer near-term demand, particularly for smaller, build-only operators.

Design firms see softer Q2 expectations, shorter backlogs

In the architectural and design services sector, expectations for the spring softened slightly and backlogs fell more sharply than in construction.

The Expected Business Activity Indicator for design firms slipped to 60 for Q2 2026, down from 61 in Q1. Expectations for project inquiries eased to 60 from 62, while expectations for new committed projects edged up to 61 from 60.

Sentiment diverged within the sector:

  • Architects’ expected business activity fell to 58, down from 61 in Q1
  • Interior designers’ reading rose to 65, up from 61, signaling stronger demand for interior work.

Design backlogs compressed significantly. The Project Backlog Indicator dropped to 4.0 weeks at the start of Q2 2026, 1.7 weeks shorter than the 5.7 weeks reported a year earlier.

  • Architects’ backlogs fell to 4.0 weeks, down from 6.3 weeks in Q2 2025
  • Interior designers also reported a 4-week backlog, down from 4.8 weeks in Q2 2025

Recent business activity pulled back in Q1. The design sector’s recent activity indicator fell to 48, down from 54 in Q4 2025.

  • Project inquiries dropped to 45, down 9 points
  • New committed projects dipped to 52, down 1 point

Architects reported a sharper slowdown, with recent activity falling from 55 to 45. Interior designers, by contrast, saw recent activity rise from 5o to 53.

Tyler Williams reported and wrote this article with drafting assistance from HousingWire Automation, an editorial tool that helps transform announcements and industry data into HousingWire-style news coverage.

This post was originally published on here

Foreclosure activity accelerated in the first quarter of 2026, with signs of mounting operational pressure for mortgage servicers and downstream vendors, according to ATTOM’s latest U.S. Foreclosure Market Report and insights from industry executives.

While overall foreclosure volumes remain below pre-Great Recession peaks, starts, completions and real estate-owned (REO) inventories are climbing, timelines are shrinking and geographic hot spots — especially in parts of the Sun Belt — are emerging.

The rise is less of a surprise and more a delayed reckoning after several years of aggressive loss mitigation and forbearance programs, executives said.

ATTOM reported that 118,727 properties had a foreclosure filing in Q1 2026, up 6% from the prior quarter and 26% year over year. March alone saw 45,921 properties with filings, 18% higher than February and 28% above March 2025.

Foreclosure starts — an early warning indicator — rose to 82,631 properties in the first quarter, up 7% from Q4 2025 and 20% from a year earlier. Bank repossessions (REOs) climbed even faster, with lenders taking back 14,020 properties in Q1, a 45% annual increase.

“While volumes remain below historical peaks, the continued rise, especially in starts and bank repossessions, suggests financial pressure may be building for some homeowners and could signal shifting housing market dynamics,” Rob Barber, CEO at ATTOM, said in a statement.

According to Donna Schmidt, president and CEO of DLS Servicing, the industry saw five years of very low foreclosure rates due to loss-mitigation policies that allowed borrowers to “kick the can down the road.” 

“The restructuring of loss mitigation that has reduced the number of options offered has revealed this weakness,” Schmidt said. “I expected to see five years of normal foreclosure activity get condensed and forced through the system in the next two years. This is just the start.”   

For servicers, the compressed window of elevated foreclosure activity raises questions about staffing, vendor capacity and compliance controls that were built in a different interest rate and delinquency environment. The operational impact extends well beyond the teams managing legal actions and REO disposition.

“When foreclosures start to rise year over year, servicers feel it first as pipeline pressure,” Mirza Hodzic, managing director and founder of BlackWolf Advisory Group, said in a statement. “The work is not limited to the foreclosure department. It stretches loss mitigation transitions, borrower communications, document processing, and oversight of attorneys and vendors. If capacity and controls do not scale with volume, timelines and borrower experience suffer.”

According to Hodzic, the jump in bank repossessions is a signal that the back end of the process is getting busier too, putting real demand on REO and property related functions like inspections, preservation, title and curative services, and vendor management.

ATTOM found that properties foreclosed in Q1 2026 spent an average of 577 days in the process, down 3% from the prior quarter and 14% year over year. It marked the sixth straight quarter of declining timelines.

Hodzic said that faster resolution is a double-edged sword for servicers operating under higher volume because “when volume rises and timelines tighten at the same time, small gaps become costly fast,” he said. 

Nationally, one in every 1,211 housing units had a foreclosure filing in Q1 2026, according to ATTOM. But activity is far from uniform. States with the highest foreclosure rates were Indiana (one in every 739 housing units), South Carolina (one in every 743 housing units) and Florida (one in every 750 housing units).

“While it is hard to say what is behind the data — it is widely believed that the surge in homeowners’ insurance rates have pushed many people to move out of the Sun Belt,” Schmidt said. “Florida saw a huge surge in home prices during COVID and those gains are being reversed. This just means that borrowers who find that their homes are now unaffordable cannot sell their properties and completely satisfy their liens.” 

This post was originally published on here

The National Association of Real Estate Brokers (NAREB) has launched an eight-city Affordable Homeownership Bus Tour aimed at closing the Black homeownership gap by bringing housing education, lending resources and policy conversations directly into local communities.

The tour, led by NAREB President Ashley Thomas III, will visit Philadelphia; Baltimore; Detroit; Gary, Indiana; Kansas City, Missouri; Memphis; Little Rock and Tulsa over eight days beginning April 25. NAREB said the initiative is part of its national strategy to “Close the Gap” in Black homeownership and respond to widening affordability challenges for first-time buyers.

Black homeownership in the U.S. stands at 44.2%, far below the 75.1% rate for white families, according to NAREB’s 2025 State of Housing in Black America report. Only 33% of Black millennials are homeowners, compared with a 65% homeownership rate for white millennials. The report also cites unprecedented obstacles for Black women seeking to buy homes.

The tour is jointly presented by NAREB and the African American Mayors Association (AAMA) and backed by a coalition of local real estate boards, lenders, housing agencies, elected officials and faith-based organizations. NAREB affiliates including the NAREB Investment Division – Housing Counseling Agency and the Women’s Council of NAREB are also central partners.

NAREB said the eight tour cities were chosen based on localized housing data showing significant gaps between the share of Black residents and the share of mortgage originations to Black borrowers. In each of the eight markets, Black households make up a far higher share of the population than their share of new mortgages.

For example, in Philadelphia, Black residents are 39% of the population but received 28% of 2024 mortgage originations, while in Detroit, 81% of the population is Black, but only 63% of originations were for Black residents. 

According to NAREB, each stop will include programming designed to move renters toward sustainable ownership and protect existing homeownership in Black families. Sessions include a breakdown of renting versus owning, education on Section 8 housing choice vouchers, guidance on clearing title, preventing forced sales and preserving family-owned properties and sessions for NAREB-aligned developers on partnering with cities to deliver affordable, community-focused housing projects.

NAREB said the goal is for attendees to leave each event with actionable information, direct connections to housing professionals and lenders, and clearer next steps toward buying a home or preserving existing ownership.

Thomas framed the tour as a response to the urgency of today’s affordability environment for historically underserved buyers.

“We are committed to transforming the wealth landscape for historically underserved communities, one home at a time,” Thomas said in a statement. “By providing education, practical tools, and access to strategic partnerships, we are equipping families to create and sustain generational wealth through real estate.”

Additional partners in the tour include Alpha Phi Alpha, Delta Theta Sigma, Sigma Zetta, the NAACP, the National Council of Negro Women and the Urban League, according to NAREB.

The tour has also attracted support from national lenders and corporate sponsors that are active in mortgage origination and community investment, including Airbnb, Bank of America, KeyBank, Rate, U.S. Bank and Wells Fargo.

NAREB said more information and sign-up links for the city sessions are available online. The organization frames the initiative as “action and access” — using a short, intensive tour to connect households directly with resources, rather than relying solely on digital or centralized outreach.

This article was generated using HousingWire Automation and reviewed by a HousingWire editor before publication. The system helps convert company announcements and industry data into HousingWire-style news coverage.

This post was originally published on here

Virtual staging — once a simple tool for digitally adding furniture — is rapidly evolving into a powerful and sometimes controversial force in real estate marketing as artificial intelligence (AI) reshapes what’s possible.

To understand where the line is drawn between enhancement and misrepresentation, it helps to start with the people who enforce the rules.

Edward Zorn, vice president and general counsel at California Regional Multiple Listing Service (CRMLS), has been watching this space for years.

“I would draw your attention first to Article 12 of the NAR code of ethics, because that’s the foundational element that is then mimicked and has some very similar rules in every MLS,” he told HousingWire. “The standard is that you shall present a true picture in the advertising, marketing and representation of the listing. So, we call it the true picture standard.”

Industry data shows why virtual staging adoption is accelerating, even as concerns about accuracy grow.

According to the National Association of Realtors (NAR), 83% of buyers’ agents said staging a home made it easier for a buyer to visualize the property as a future home.

Sixty percent of buyers’ agents cited that home staging had an effect on some buyers, but not always, while 26% said that staging had an effect on most buyers’ view of the home.

Among buyers’ agents, having photos (73%), traditional physical staging (57%), videos (48%) and virtual tours (43%) available for their listings was much more or more important to their clients.

The true picture standard in practice

Zorn emphasized that the “true picture” framework applies regardless of how an image was altered.

He cited that agents have been manipulating property photos for decades using telephoto lenses and Photoshop — and offered real world examples of how buyers have used photos as evidence in claims.

In one case, a seller digitally enhanced a fire into a fireplace. The buyer later discovered a $25,000 to $30,000 chimney and flue problem that made a fire impossible.

“The buyer, using the photo as evidence in their claim, said that it was reasonable for the buyer to think that they were buying a home that they can do a fire in, because that was the picture they saw,” Zorn said. They would use that photo to support their misrepresentation or failure to disclose claim.

Another good example is a buyer closes, goes into the garage to try to turn on the really pretty exterior lights, to show the house at night. “Then they call their agent and say, ‘I can’t find the switches. Where do I set the clock for the pretty lights at night?’ [Then they find out] there are no lights. To install lights, maybe that’s $5000 or $6,000 if it’s a big home. These are cases that get settled and you don’t hear anything about after.”

An agent’s perspective

Not every agent embraces virtual staging, even as a marketing tool.

Veronique Perrin — a real estate agent at New York-based Coldwell Banker Warburg — takes a firm stance against it.

“I never use virtual staging for my listings,” she said. “I find that buyers actually resent it and respond very negatively when they feel they were deceived about what is offered. In full transparency, I have a separate staging business, so I include actual staging for free for all my exclusives.”

Perrin has also seen damage caused by misleading photos from the buyer’s side.

“Countless times, when representing buyers, we would get to a listing and wonder whether we were in the right place,” she said. “The misrepresentation is getting out of control. Disclosure about photos being virtually staged is often missing, and some of it is so well done now that you only find out when you walk in.

“Buyers get very frustrated, and I find it counterproductive. Now, I systematically speak with the listing agent before sending a buyer to any listing to make sure the photos match what is offered.”

‘The MLS is not a marketing platform’

Zorn drew a critical distinction between marketing and cooperation.

Multiple listing services, he explained, are broker cooperatives first — not marketing platforms.

“I think that’s an important distinction,” said Zorn. “Those are two very different things. Now we do, in fact, do excellent marketing and excellent distribution in the MLS. We are great at getting good information out there for people to market with, but we can’t lose sight of the fact that we are a broker cooperative.

“Putting up what [a listing] could be if you spent another $50,000, well, that’s great for marketing. That’s terrible for me as a buyer’s agent.”

He recalled a complaint from several years ago involving a Long Beach, Calif., condominium. The listing showed a “stunning view” of the Queen Mary occupying about half the photograph.

But when buyers and their agents walked onto the deck, the Queen Mary was a tiny fraction of that size.

“That’s uncooperative to the buyer’s agent,” Zorn said. “Now the buyer is in a fight with his own agent. They’re mad, saying, ‘Why did we drive all the way out here? I told you to find me something with a great view.’ They’re squinting with binoculars and they can kind of see the Queen Mary.”

Existing Rules, enforcement gaps

Zorn does not believe new laws are needed to address AI-altered listings.

He noted that California recently passed Assembly Bill 723 — requiring real estate agents and brokers to clearly disclose when listing photos are modified by AI or digital editing.

The law mandates that if an image is digitally altered [virtual staging, object removal, etc.], a disclaimer must be added and the original image must be made available.

“We don’t need new regulation or laws,” Zorn said. “We just need to enforce the rules that we have. This standard that I just expressed to you under Article 12 of the (NAR) code of ethics — and that is almost word for word in most MLS rules — works great.

Perrin is less optimistic about enforcement.

“Honestly, I am not sure how you can actually keep up with the bad behavior, especially with the world of AI,” she said. “As for adjusting my practices, again, I only do actual staging for my listings. Most of the time, I use what is there and bring in curated props and artwork, or I’ll do a quick glow up.

“This works especially well in estate situations. There is instant gratification in a coat of paint on old furniture, the use of a staple gun and some cool fabric.”

As Zorn and Perrin both make clear, a feature that looks like a great marketing idea from one side of the transaction can become a genuine problem for the other.

Without consistent enforcement, the gap between listing and reality may only widen.

This post was originally published on here

Inside, this two-floor apartment in the Standish at 171 Columbia Heights looks for all the world like the gracious pre-war co-ops and townhouses that surround it in historic Brooklyn Heights. But this 1,786-square-foot home has the convenience of full-service condo living in a converted Beaux-Arts hotel. Asking $3,995,000, the duplex has enough space to add a third bedroom to its already generous two-bedroom layout.

With interiors done by Patrick Mele, the home is move-in-ready (provided you’re partial to lush materials and classically elegant decor). Framed by high, coffered ceilings, herringbone floors, crown moldings, and oversized arched windows, built-ins and custom details add 21st-century livability.

The main floor is anchored by a 30-foot-long great room with 12-foot ceilings and arched windows that frame the streetscape below. There’s enough space to add a third bedroom, made even easier by a full bath already in place.

A well-outfitted galley kitchen offers premium appliances framed by contemporary white cabinetry and Carrara marble worktops. A large pantry serves this capable space. There’s plenty of room for a formal dining area adjacent to the kitchen.

Up a dramatic stair, sleeping quarters begin with an impressive primary suite. Bay windows overlook the neighborhood, and four custom closets keep clutter behind closed doors. A suitably classic ensuite bath has a glass-enclosed shower and a freestanding soaking tub. The large second bedroom has its own full bath.

The Standish offers an elevator, a 24-hour doorman, concierge services, a fitness studio, a playroom, and a landscaped rooftop terrace with harbor views. As an added bonus, the duplex includes a private storage cage.

[Listing details: The Standish, 171 Columbia Heights, #1A at CityRealty]

[At The Corcoran Group by Deborah L Riders, Sarah Shuken, Albi Zhubi, Dario Nolfi, and Angelina Martinez]

RELATED: 

The post This $4M Brooklyn Heights duplex adds condo convenience to old-world elegance first appeared on 6sqft.

This post was originally published here

Lincoln Center on Thursday revealed the lineup for its fifth annual Summer for the City festival, which brings hundreds of free events and performances to the iconic arts campus. Running from June 10 through August 8, the festival transforms the 16-acre campus into a vibrant cultural hub, activating both indoor and outdoor spaces with dance, music, and multidisciplinary performances. This year’s edition places a particular emphasis on dance, including the debut of the first Lincoln Center Contemporary Dance Festival.

Credit: Lawrence Sumulong

“Summer for the City carries forward Lincoln Center’s founding promise to enliven New York with arts for all—inviting everyone to experience the fullest expression of art and community,” Shanta Thake, Ehrenkranz chief artistic officer of LCPA, said.

“This year, that energy feels more alive than ever, with dance at the center, artists from around the world, and moments of connection unfolding across our campus. We look forward to welcoming New Yorkers and visitors alike to discover something new and experience the joy, creativity, and community that make this global city extraordinary.”

As part of the launch of the Pasculano Collaborative for Contemporary Dance, the inaugural dance festival will take place in Alice Tully Hall, showcasing five international companies, with two making their United States debut and two making their New York debuts.

Credit: Lawrence Sumulong

Dance Encounters, a new outdoor contemporary dance series, will debut at Hearst Plaza, featuring choreographic works that respond to the campus’s signature Modernist architecture. The series will present several free performances each week for eight consecutive weeks.

To underscore this year’s focus on dance, opening night on June 10 will feature a triple-header of dance events, including KEIGWIN + COMPANY’s “Rhapsody,” a community dance work featuring 30 New Yorkers; “Inayat: A Duet for Four,” which blends two ancient North Indian performance traditions; and a swing dance party with Caleb Teicher & Company and the Eyal Vilner Big Band.

Renderings of Josie Robertson Plaza. Credit: Evan Alexander

Josie Robertson Plaza’s vibrant dance floor, featuring its 10-foot disco ball, will also return, transforming the space into a colorful open-air disco. The plaza will once again host the BAAND Together Dance Festival, a popular social dance series spanning swing, hip-hop, salsa, and ballroom, as well as silent discos beneath the night sky.

International artists are also a key feature of this year’s festival, with New Yorkers invited to experience a series of events celebrating artists and cultures from around the world. This includes K-Pop Dance Night on July 1, Brazil Day on July 9, Ruidosa Fest on July 12, Chinese Arts Week from July 22–29, globalFEST on August 1, and Jamaica Day on August 8.

The World at Play will celebrate the global spirit of soccer and the intersection of arts and sports as the FIFA 2026 World Cup arrives at MetLife Stadium in New Jersey. The series will feature live concerts and dance parties honoring soccer culture, while freestyle soccer performers showcase their skills and lead family-friendly workshops.

The Festival Orchestra of Lincoln Center will return for its third year under Renée and Robert Belfer Music and Artistic Director Jonathon Heyward, featuring three commissions, including a world premiere, alongside traditional classics.

“This summer’s focus on international artistry reflects our global city, as well as our commitment to collaboration and artistic exchange,” Mariko Silver, president and CEO of LCPA, said.

“Lincoln Center is a place for community, for belonging, for experiences that help us feel vividly connected to each other and to something larger than ourselves—a reminder of how truly joyful it is to be together,” she added.

Hearst Plaza design by Clint Ramos; renderings by Evan Alexander

Clint Ramos, artist-in-residence and visual director of Summer for the City, will debut an entirely new design for this year’s festival. Inspired by the season’s focus on dance, the design will feature a newly commissioned fountain show with the dance floor as its centerpiece, under lighting design by David Weiner.

Most events are free on a first-come, first-served basis, with select performances available at choose-what-you-pay pricing starting at $5.

Summer for the City debuted in 2022, bringing together more than 1,000 artists across 10 outdoor stages for 300 unique events. It has since established itself as a popular summer destination, welcoming more than 1.6 million visitors since its launch.

This year’s festival comes as Lincoln Center continues a major renovation of its western edge aimed at removing longstanding barriers between its campus and Amsterdam Avenue and improving access to surrounding neighborhoods. A colorful mural was unveiled this week on the construction fencing surrounding Damrosch Park.

RELATED:

The post Lincoln Center unveils Summer for the City lineup, with dance taking center stage first appeared on 6sqft.

This post was originally published here

Office vacancies remain elevated as hybrid work continues to reshape commercial real estate demand.

The U.S. commercial real estate sector continues to face sustained pressure, as persistently high office vacancy rates underscore the long-term impact of shifting workplace trends and tighter financial conditions.

New data released this week by major real estate services firms, including CBRE and JLL, indicate that office demand remains subdued across major metropolitan areas, with vacancy rates holding near multi-year highs. The استمرار of hybrid and remote work arrangements has fundamentally altered corporate space requirements, reducing demand for traditional office footprints.

Landlords are responding by offering increasingly aggressive concessions, including rent discounts, flexible lease terms, and tenant improvement incentives, in an effort to attract occupants. Despite these measures, leasing activity has remained below pre-pandemic levels in many markets.

At the same time, rising interest rates are creating additional challenges for property owners. Higher borrowing costs have made refinancing more expensive, particularly for properties with declining occupancy rates. This dynamic is placing pressure on balance sheets and raising concerns among lenders.

Regional banks, which hold a significant share of commercial real estate loans, remain exposed to these risks. Regulators have been monitoring the sector closely, particularly in light of broader financial stability concerns tied to concentrated exposure in certain portfolios.

“The office sector is undergoing a structural reset,” analysts at JLL said in a recent report, noting that demand patterns are unlikely to fully revert to pre-pandemic norms.

While the office segment faces ongoing headwinds, other areas of commercial real estate have shown greater resilience. Industrial properties, driven by e-commerce demand, and multifamily housing have remained relatively strong, though they too are beginning to feel the effects of higher financing costs.

Investors are increasingly selective, focusing on high-quality assets in prime locations, often referred to as “flight-to-quality” dynamics within the sector. Older and less well-located buildings have been disproportionately affected, with some facing potential repurposing or redevelopment.

Looking ahead, market participants expect a prolonged adjustment period. The pace of recovery will likely depend on broader economic conditions, interest rate trends, and the evolution of workplace practices.

For now, the commercial real estate market remains in transition, as structural changes continue to reshape one of the largest asset classes in the U.S. economy.

— JBizNews Desk

UWM Holdings Corp. tied its acquisition of Two Harbors Investment Corp. to its stock price, ultimately failing to complete the deal even after adding a cash portion. When CrossCountry Intermediate HoldCo emerged as the seller’s preferred option, UWM suggested potential litigation, according to a public filing by TWO.

UWM revised its original proposal — an exchange ratio of 2.3328 shares of UWMC Class A common stock for each TWO share — twice to save the deal amid a declining stock price. The deal would have marked UWM’s first acquisition.

Analysts had pointed to UWM’s falling stock price as a key factor in the failed acquisition, although the company previously told HousingWire its stock performance has nothing to do with fundamentals. UWM declined to comment on the new information disclosed by TWO. 

Cash backstop

UWM’s initial all-equity proposal implied an $11.94 price based on its Dec. 16 closing price. But when CCM made a $10.70 all-cash proposal on March 17 — approximately twice the book value plus payment of a $25.4 million termination fee to UWM — UWM’s offer equated to paying just $8.54 per share, the filing with the Securities and Exchange Commission states.

CCM stated its proposal “would be a fixed price, all-cash offer with no financing contingencies, meaning that CCM would assume the market risk of fluctuations of TWO’s book value during the period prior to the closing of a transaction,” Two Harbors said in public filing. CCM also delivered a financing commitment letter from a leading national bank for a $2 billion secured loan facility.

UWM’s first revised proposal added a cash backstop. It guaranteed TWO shareholders up to $10.71 per share, with UWM paying cash to cover any shortfall between that amount and the stock consideration based on UWM’s recent average share price. UWM capped the added cash at $2 per share, totaling about $212.8 million.

The TWO board leaned toward accepting the CCM offer. But a third undisclosed bidder, Company A, proposed the acquisition of TWO for $10.75 per share in cash or a stock-for-stock reverse merger where Company A would merge into TWO, giving TWO stockholders a stake of roughly 16.1% in the combined company.

CCM then raised its offer to $10.80. Company A countered with a cash election option allowing up to 25% of Two Harbors’ common shares to be cashed out at $11.09 per share, subject to proration. But Company A lacked draft deal agreements, required significant due diligence, faced a lengthy path to closing and failed to provide enough financial information for TWO to properly value the bid, the seller said.

Meanwhile, UWM submitted a second revised bid, raising its offer to provide a cash-equivalent value of $10.95 per share through a mix of stock and cash. This version removed the cap on total cash consideration.

Breached merger agreement?

Still, the TWO board said the final value remained uncertain because it depended on UWM’s 10-day average stock price before closing rather than the actual closing-day price. Shareholders would need to sell UWM shares in the open market to realize the full cash value. The board also accused UWM of limited engagement regarding potential synergies.

Houlihan Lokey’s analysis showed the implied value often fell below an alternative CCM proposal, including in a March 24, 2026 simulation where the total value was about $10.52 per share ($8.42 in stock plus $2.10 in cash), highlighting variability and potential downside versus the headline price,” TWO said in public filing. 

UWM accused TWO of breaching merger agreement obligations, including non-solicitation and good-faith negotiation terms, the filing states. The wholesale lender warned it could pursue a hostile bid or legal remedies if TWO accepted competing offers. UWM sent TWO a document preservation notice, signaling potential legal claims and requiring records related to the dispute to be retained.

Two Harbors rejected UWM’s allegation. Through its counsel, the company asserted it fully complied with all merger agreement obligations, including vote solicitation, non-solicitation rules, consideration of superior offers and good-faith negotiations. Two Harbors reminded UWM of its own contractual duties and asked UWM to preserve relevant documents.

TWO entered into an agreement with CCM on March 27, 10 days after the initial unsolicited proposal.

In a statement following the deal’s collapse, a UWM spokesperson said the company “presented an offer that is higher in value in every respect including a materially accelerated timing relative to the offer they want to accept.”

“The full context will be made public in due course, allowing both shareholders and the courts to evaluate the facts accordingly,” the spokesperson said.

This post was originally published on here

The Batton homebuyer commission lawsuit plaintiffs have unsurprisingly taken a stand against the National Association of Realtors’ (NAR) decision to settle the homebuyer antitrust claims by opting-in to the Tuccori homebuyer commission lawsuit settlement. 

Due to the settlement, which was announced last Friday, NAR filed a motion to stay the Batton litigation, in which it is a defendant. On Wednesday, the Batton plaintiffs filed a memorandum in opposition to NAR’s motion to stay the Batton lawsuit.

In the filing, the Batton plaintiffs claim that NAR is asking the court to “compel” them “to stand aside while it proceeds with its reverse-auction Tuccori settlement that, if approved, will extinguish a significant portion [but not all] of Plaintiffs’ claims against NAR in this case.”

This is not the first time the Batton plaintiffs have taken issue with a defendant in their litigation opting into the Tuccori settlement. 

In March, the Batton plaintiffs filed a motion for a preliminary injunction seeking to prevent Hanna Holdings from proceeding with its proposed settlement in the Tuccori lawsuit. This came after the Batton plaintiffs filed a motion to intervene in the Tuccori lawsuit and a motion for a preliminary injunction seeking to block Anywhere Real Estate from obtaining preliminary approval for the settlement the firm negotiated in the lawsuit via the opt-in mechanism. 

These motions were denied, but the Batton plaintiffs have also sought to appoint the Tuccori plaintiffs’ attorneys as interim co-lead counsel in the Batton lawsuit. Additionally, despite denying their attempt to block Anywhere’s settlement, the court did allow the Batton proceedings involving Anywhere to continue, denying the firm’s motion to stay the lawsuit despite its pending settlement in the Tuccori lawsuit. 

In this ruling the court wrote that it would be “presumptuous” to treat the “final approval of the settlement and resolution of all claims against Defendant Anywhere as a foregone conclusion” and stay the Batton litigation. The Batton plaintiffs argue that this same argument can apply to NAR’s settlement. Additionally, the plaintiffs note that NAR has not yet filed for preliminary approval of its settlement in the Tuccori lawsuit. 

The Batton plaintiffs also argue that a stay would prejudice them and cause delay, especially if the settlements do not gain final approval. 

The parties are meeting on Thursday for a hearing on the motion. 

In an emailed statement, an NAR spokesperson wrote that the trade group stands by its settlement.

“NAR looks forward to the Tuccori court’s final hearing and approval process,” the spokesperson added. “NAR maintains that the settlement process established by the Tuccori court is fair, reasonable, and in the best interests of the class. NAR intends to vigorously defend the settlement it reached after mediation and negotiations before the court-appointed mediator, Judge James Holderman.” 

This post was originally published on here

Independent mortgage banks (IMBs) and mortgage subsidiaries of chartered banks earned an average profit of $785 on each loan they originated in 2025, up from $443 per loan in 2024, according to the Mortgage Bankers Association (MBA)’s 2025 Annual Mortgage Bankers Performance Report, released Thursday.

MBA reported that the average net production profit reached 21 basis points in 2025, the highest level in four years. That is still less than half the historic average of 45 bps, or $1,031 per loan, since the study began in 2008.

“The average net production profit for IMBs in 2025 reached its highest level in four years at 21 basis points,” said Marina Walsh, the MBA’s vice president of industry analysis. “While profits have improved slightly in recent years, they are still less than half the historical average going back to 2008.

“There was also wide variability between top and bottom performers due to differences in product mix, volume levels, geography and cost efficiencies, among other factors.”

The report shows that profitability improved alongside higher origination volumes and larger average loan sizes, but lenders did not see the typical cost relief that comes when volume rises.

Total production expenses increased to $11,094 per loan in 2025, up from $11,076 in 2024, even as total production revenues rose to $11,879 per loan (compared to $11,520 the year prior).

“Overall annual production volume was up in 2025, while loan balances rose to new study-highs,” Walsh said. “Despite the increase in volume, per-loan production costs were slightly higher than in 2024.

“Historically, when volume picks up, fixed costs are spread over more loans, resulting in a reduction in per-loan costs. However, that was not the case in 2025 as rising wage growth, increases in third-party charges, and reduced application pull-through negatively impacted origination costs. Containing origination costs and increasing efficiencies will remain a differentiator between profitable and unprofitable companies in 2026.”

More firms return to profitability

Including both production and servicing, 78% of firms in the study posted pretax net profits in 2025, up from 68% in 2024 and 36% in 2023. Without the contribution from servicing, just 64% of firms would have been profitable in 2025, underscoring the continued importance of servicing income for IMBs’ overall performance.

Net servicing financial income — which includes servicing operational income, mortgage servicing right (MSR) amortization, and gains and losses on MSR valuations — fell to $89 per loan in 2025, less than one-third of the $301 per-loan figure in 2024. Even with that decline, servicing remained a key lifeline for many lenders as production margins stayed compressed.

Average production volume rose to $2.5 billion per company in 2025, or 7,273 loans, up from $2.1 billion (6,259 loans) in 2024. For repeat participants in the survey, average volume increased to $2.4 billion (7,158 loans) from $2.1 billion (6,290 loans).

The average loan balance for first mortgages reached a study high of $371,965 in 2025, up from $357,631 in 2024. Larger loan sizes can help support per-loan revenue, but they also reflect ongoing affordability challenges for borrowers in many markets.

The refinance share of total originations by dollar volume among IMBs increased to 21% in 2025, up from 16% in 2024. For the broader mortgage market, MBA estimates the refi share climbed to 34% in 2025, a 14-point jump from 2024 and an indication that IMBs continued to skew more toward purchase lending than the overall industry.

Measured in basis points, average production income rose to 21 bps in 2025 compared to 10 bps in 2024. Total production revenues — including fee income, net secondary marketing income and warehouse spread — ticked up 2 bps during the year to 347 bps.

MBA’s data suggests that while the worst of the profitability downturn may be over, IMBs remain under pressure to manage costs and improve efficiency. Rising wage and third-party expenses, coupled with weaker pull-through, are preventing lenders from fully benefiting from higher volumes and growing refi activity.

This article was generated using HousingWire Automation and reviewed by a HousingWire editor before publication. The system helps convert company announcements and industry data into HousingWire-style news coverage.

This post was originally published on here

Three in four homebuyers assume artificial intelligence already plays a role in the homebuying process, but most still want humans making or verifying key decisions, according to a new global survey from property data firm Cotality.

Its AI in Housing 2026 Report, released Thursday, finds that 75% of buyers expect AI to be embedded somewhere in the transaction. They most commonly assume AI is used by property websites (86%), insurers (82%) and lenders (80%), with similar expectations for real estate agents (80%) and brokers (79%).

The report covers buyers in the U.S., Canada, the U.K. and Australia. Cotality surveyed buyers who purchased within the past five years and those who plan to purchase in two to five years. Responses were obtained across the Gen Z, Gen X, millennial and baby boomer cohorts.

The findings arrive as mortgage lenders, real estate brokerages and insurers accelerate deployment of AI in underwriting, lead routing, pricing, risk modeling and marketing. With more than $2 trillion in mortgage originations each year in the U.S., even marginal efficiency gains can materially affect capacity and capital availability for lenders.

Buyer confidence down, AI expectations up

U.S. buyer confidence in navigating the homebuying process has fallen to 72% in 2026, down from 83% in 2025, Cotality reported. The share of U.S. consumers actively saving for a home dropped from 75% to 69% during the same period.

Younger cohorts are more likely to see AI as part of the solution:

  • 50% of Gen Z say AI would increase their confidence in buying a home
  • 40% of millennials say the same
  • 33% of Gen X and 21% of boomers report increased confidence with AI

Gen Z buyers report a particular need for speed from AI-enhanced services, especially for legal assistance (46%) and insurance (39%). In the U.S., buyers under 35 account for 37% of originated loans, underscoring the influence of younger borrowers on product and process expectations.

“Homebuyers want the speed and scale of AI — but not at the expense of certainty,” Amy Gromowski, head of data science at Cotality, said in the report.

Cotality estimates that AI-driven workflows could shorten mortgage processing times by one to three months, potentially allowing lenders to pull forward repayments, recycle capital more efficiently and expand capacity without adding staff.

Trust gap widens despite broad AI adoption

Even as buyers expect AI to be ubiquitous, trust in AI systems has weakened in the U.S. Trust in AI to help find a home fell to 16% in 2026, a 14-point drop from 2025, according to the survey.

Buyers are also drawing firmer lines around where and how AI can be used:

  • 68% say clear AI labeling for property listings and mortgage recommendations is important or essential
  • 37% say such labeling should be mandatory, rising to 61% among baby boomers
  • 46% say it is unacceptable for lenders or insurers to conduct automated AI valuations without prior approval

Tolerance for AI mistakes remains low. Only 22% of Gen Z and 19% of millennials say they are tolerant of AI errors, compared to 11% of Gen X and 9% of boomers. For lending and real estate firms, that suggests limited consumer patience for misfires from AI-driven underwriting, valuation or recommendation systems.

Demand grows for transparency and human checks

Concerns about how AI uses data are also widespread. Nearly two-thirds (64%) of buyers worry that AI may recycle unverified information rather than rely on validated, first-party data.

Generational differences emerge in willingness to act on AI outputs:

  • Only 7% of global Gen Z homebuyers would accept AI-generated information on property risk and its impact on insurance premiums
  • 12% of millennials say they would accept and act on such AI-generated safety information
  • 11% of U.S. buyers and 10% of U.K. buyers say they are comfortable with AI-generated information, compared with 3% in Canada

Despite growing familiarity with digital tools, human expertise still carries more weight at critical decision points. Globally, 48% of buyers consider AI reliable for making fair lending decisions, but U.S. consumers increasingly favor humans:

  • 55% of U.S. buyers prefer working with a person to secure a mortgage, up from 46% last year
  • 66% would rely on human professionals over AI for legal assistance, up from 54% in 2025
  • 56% say they would trust a human expert over AI when assessing natural disaster risk

Buyers are willing to pay for these safeguards. Cotality found that 44% of respondents would pay an additional fee to have a human expert verify AI-generated housing decisions.

“Buyers are not rejecting AI; they are asking for safeguards,” Gromowski said. “They recognize AI’s power to process massive datasets and speed up decisions. But when it comes to the largest financial transaction of their lives, accuracy and accountability are non-negotiable.”

This article was generated using HousingWire Automation and reviewed by a HousingWire editor before publication. The system helps convert company announcements and industry data into HousingWire-style news coverage.

This post was originally published on here

There is a shift happening in real estate and mortgage, and it has less to do with rates or technology than with how companies show up. Branding was once treated as a finishing touch. Today, it is becoming a core part of how brokerages and lenders compete, and that evolution is on full display in the 2025 Exhibit Awards finalist class, presented by MAXA Designs.

Thirty-four companies made the cut across eight real estate categories and, for the first time, a national mortgage track. The expansion signals how quickly the lending side of the industry is rethinking its brand approach. These finalists represent more than strong design. They reflect a broader movement toward brand as an integrated, measurable business function, one that influences everything from lead conversion to long-term client loyalty.

What this year’s finalists reveal

Brand is becoming a performance lever, not a marketing layer. The strongest finalists are not just visually cohesive; their branding carries through every touchpoint, reinforcing trust and improving consistency across the client experience.

The size and scale of the company are no longer a prerequisite for brand strength. Some of the most influential entries are smaller firms that have built intentional, differentiated identities without enterprise budgets.

Leveraging local identity is increasingly proving to be an advantage. Rather than mimicking national brands, top performers are leaning into regional expertise and community presence, creating brands that feel specific and credible. At the same time, the line between real estate and mortgage is beginning to blur. Mortgage companies are adopting the storytelling and experience strategies long used by brokerages. As the transaction becomes more connected, the brands that can deliver a cohesive experience on both sides will have an edge.

Together, these companies are helping define what effective branding looks like in housing today and setting expectations for where the industry is headed next. In a market where products are increasingly commoditized, and technology continues to level the playing field, brand is emerging as one of the few advantages that is both defensible and durable.

The 2025 finalists

The finalists are broken into categories, with the real estate finalists organized into four U.S. regions, with each region split by brokerage size: under 1,000 agents and over 1,000 agents. The mortgage category is national.

West Coast Northeast

Under 1,000 Agents

  • Vanguard Properties
  • Navigate Real Estate
  • Ensemble

Over 1,000 Agents

  • FirstTeam
  • HomeSmart
  • Intero Real Estate Services

Under 1,000 Agents

  • Leading Edge Real Estate
  • Charlesgate
  • BHHS Warren Residential

Over 1,000 Agents

  • Long & Foster Real Estate
  • Real
  • Baird & Warner
Southeast Midwest

Under 1,000 Agents

  • Nest Realty
  • ENRG Realty
  • BHHS Florida Properties Group

Over 1,000 Agents

  • BHHS Georgia Properties
  • The Keyes Company
  • ONE Sotheby’s International Realty

Under 1,000 Agents

  • Madison & Co. Properties
  • Tamara Williams & Company
  • Rêve Realtors

Over 1,000 Agents

  • Epique
Mortgage — National
  • AnnieMac Home Mortgage
  • Key Mortgage
  • Flat Branch Home Loans
  • Sage Home Loans
  • Revolution Mortgage
  • LeaderOne Financial Corporation
  • Movement Mortgage
  • CrossCountry Mortgage

About the Exhibit Awards

The Exhibit Awards are judged by a panel of 10 industry leaders across four areas: storytelling, visual identity, marketing execution and overall client experience. Aesthetics alone are not enough. The brands that made the cut demonstrate consistency across channels, clarity in their value proposition and the ability to translate brand into real engagement.

The awards are not based on popularity or a pay-to-play model.Winners will be announced live at HousingWire’s The Gathering on April 27 in Austin.

Click Here

This post was originally published on here

Mortgage industry leader Sue Woodard has joined HousingWire as a strategic advisor, bringing decades of experience in origination, fintech and lender advisory work to the company’s growth strategy.

Woodard will work with HousingWire’s executive team to help shape content, events and product direction for mortgage and real estate professionals, with a focus on connecting industry leaders to the data, analysis and community they need to make better decisions, faster.

Woodard will continue her work as a Senior Advisor at STRATMOR Group, as well as continuing her own speaking and advisory roles.

Woodard is widely known in the housing industry for her work as a C-suite executive, advisor and board member to lenders and technology companies. Over the course of her career, she has held senior leadership roles spanning production, customer experience and technology innovation, and has advised a range of mortgage and fintech firms on go-to-market and growth strategy.

“Sue has sat in nearly every seat in the mortgage business, from originator to executive to advisor,” said Clayton Collins, CEO at HousingWire. “Her perspective on how housing professionals actually make decisions will help us to continue to focus our content, data and events on the issues that matter most to our audience.”

As a strategic advisor, Woodard will collaborate with HousingWire’s editorial and event teams on initiatives that support executives navigating higher rates, tighter margins and rapid technology change. That includes advising on executive-level programming, thought leadership and ways to better connect housing professionals to the right people, the right ideas and the right next moves.

“I’ve spent my career helping leaders connect the dots between strategy and execution, and that’s exactly what makes this opportunity with HousingWire so compelling.” said Woodard. “I’m excited to work alongside their team to bring forward ideas, insights, people and conversations that help this industry keep moving forward.” 

Woodard’s background includes front-line experience in mortgage origination, leadership roles at mortgage and fintech firms, and extensive speaking and advisory work across the housing finance industry. She is a frequent industry keynote and has been recognized for her contributions to mortgage technology, leadership development and customer experience.

She will be speaking at HousingWire’s The Gathering event April 27-30 in Austin, Texas.

Why this matters for housing professionals:

HousingWire’s addition of a seasoned mortgage executive and advisor reflects rising demand for practical, decision-grade intelligence as lenders and real estate firms work through prolonged affordability challenges, margin compression and shifting regulation. Woodard’s direct experience with both lenders and the tech companies who serve them in creating successful customer journeys and managing change will inform HousingWire’s coverage, content and programming targeted at executives and top producers.

This post was originally published on here

Dark Matter Technologies on Thursday appointed Vikas Rao as CEO, elevating him from the role of chief technology officer as the mortgage technology firm is poised to accelerate its AI-driven strategy and growth plans.

Rao succeeds Sean Dugan and will lead the company’s next phase with a mandate to translate its technology investments into stronger commercial performance, according to a company press release.

As part of the CEO transition, Dark Matter is also adjusting its leadership structure and making targeted organizational changes, including a reduction in force, to align its operating model with strategic priorities. A company spokesperson told HousingWire the layoffs would impact 5% of the firm’s workforce but did not specify what roles they involved. The release said Dark Matter’s product road map, customer commitments and daily operations remain unchanged, and that it continues to operate with the backing of Constellation Software‘s Andromeda Operating Group.

Dark Matter has emphasized product innovation and early adoption of artificial intelligence in mortgage origination. The CEO change comes as lenders and vendors across the mortgage ecosystem are racing to deploy AI and automation to reduce costs, speed decisioning and manage compliance in a volatile mortgage rate environment.

“Dark Matter has built meaningful technology advantages in a market that is being reshaped by AI, automation and a faster pace of change,” Bonnie Wilhelm, CEO of Constellation Software’s Andromeda Operating Group, said in a statement. “This leadership transition reflects a clear decision to align the company with where the market is going and to turn that advantage into sustained growth. Vikas has been at the center of that shift and is the right leader to carry it forward.”

Rao, who became CTO in 2025, said he plans to embed an “AI-first” approach across the organization, from product development to operations and go-to-market execution.

“We are reshaping how we build, operate and go to market to match where the technology is going,” Rao said. “That means embedding an AI-first approach across the entire organization so we can move faster and deliver more effectively. Our clients will feel that pace of innovation. That is the measure that matters most.”

Rao brings more than 15 years of experience in software engineering, product management and mortgage technology leadership. Before joining Dark Matter, he led product strategy at Ellie Mae, where he oversaw the Encompass lending platform along with its developer and partner ecosystems.

For lenders, the move underscores how mortgage technology providers are reorganizing around AI capabilities and margin pressure. Leadership teams with deep product and engineering backgrounds are increasingly being tasked with turning automation gains into commercial outcomes, from lower origination costs to faster cycle times and more efficient secondary market execution.

This round of layoffs is not the first undertaken by Dark Matter in recent years. In May 2025, the company reportedly eliminated an unspecified but “massive” number of jobs across a variety of roles. Former employees told HousingWire at the time that the “abrupt” move was tied to a shaky economy and the company’s bottom line.

This post was originally published on here

  • The median sale price in the Bay Area metro rose 14% year over year in March, compared with a 1% gain nationwide. That helped San Francisco reclaim its title as the most expensive major metro to buy a home.
  • Nationally, the housing market remained sluggish as high costs and economic uncertainty gave buyers and sellers pause.
  • Active listings of U.S. homes for sale fell 1% from a month earlier and pending sales barely budged. Homes that did sell moved at the slowest March pace in a decade.

The median home sale price in the San Francisco metropolitan area jumped 14.4% year over year in March to a record $1.7 million. That’s the largest increase since March 2018 and the biggest gain among the 50 most populous U.S. metro areas. 

San Francisco Home Prices Jump Most 2018 (Line chart)


Condo prices in San Francisco rose particularly quickly, posting a 24.4% year-over-year increase last month—the largest since 2013.

San Francisco’s housing market has been heating up as a boom in the artificial intelligence industry and a return to the office have coincided with a lack of inventory. 

“A lot of 22-year-olds are getting $500,000 signing bonuses from AI companies, and they’re excited to buy homes,” said local Redfin Premier real estate agent Ali Mafi. “Inventory isn’t keeping up—sellers have been hearing that if they wait to sell, they’ll get a better deal. But suddenly, the time to sell is now. We’re seeing quality homes in desirable areas get 20 offers and go for as much as $900,000 over the asking price.”

Mafi said sellers should still make sure their homes are in tip-top shape before going to market (cleaning, staging, painting, etc.). Oftentimes, a $20,000 investment there can turn into $100,000 because it helps the home sell for a higher price—especially when demand is so strong, he noted.

Thanks to last month’s price jump, San Francisco has reclaimed its title as the major U.S. metro with the highest home prices, eclipsing neighboring San Jose, which held that title for much of 2024 and 2025.


The typical San Francisco home that sold in March went for 8.9% more than its final list price—the largest March premium since 2022. By comparison, the typical U.S. home sold for 1.3%
below its final list price—the biggest March discount since 2020.

San Francisco’s housing market has just 1.8 months of supply, compared with 3.2 months nationwide. Months of supply measures the length of time it would take for the existing supply of homes for sale to be bought up at the market’s current pace of sales, assuming no new listings.

Housing Supply Isn't Keeping Up With Demand in San Francisco (Line chart)


Nationally, the Housing Market Remains Sluggish


The median U.S. home sale price rose 1.2% year over year in March to $436,733. That’s the fastest growth in five months but remains low by historical standards.

Active listings of U.S. homes for sale fell 0.6% month over month on a seasonally adjusted basis—the largest decline since June 2023. Some sellers have been retreating due to lackluster demand for their homes; pending home sales were little changed from a month earlier (0.1%) on a seasonally adjusted basis in March and fell 2.6% from a year earlier. High home prices, rising mortgage rates and economic uncertainty have caused many house hunters to stay on the sidelines.

For-Sale Housing Supply Ticked Down in March (Column Chart)


It’s worth noting that while both buyers and sellers have been retreating, buyers have retreated faster, which means they are
far outnumbered by sellers. That imbalance is why buyers have negotiating power. Yes, home price growth is inching up, but buyers are also scoring the largest discounts in years as sellers watch their homes linger on the market. The typical home that went under contract in March did so in 55 days. That’s the slowest March pace in a decade and is up from 49 days a year earlier.

U.S. Homes Are Taking Longer to Sell (Line chart)


March 2026 Housing Market Highlights: United States


March 2026 Month-over-month change Year-over-year change
Median sale price $436,733 1.8% 1.2%
Existing-home sales, seasonally adjusted annual rate 4,222,253 -0.3% -0.3%
Pending home sales, seasonally adjusted 482,196 0.1% -2.6%
Homes sold, seasonally adjusted 427,358 0.6% -1.6%
New listings, seasonally adjusted 554,854 2.4% -2.6%
Total homes for sale, seasonally adjusted (active listings) 1,990,299 -0.6% 0.5%
Months of supply 3.2 -0.9 -0.2
Median days on market 55 -11 6
Share of homes that sold above final list price 25.6% 2.9 ppts -1.5 ppts
Average sale-to-final-list-price ratio 98.7% 0.5 ppts -0.2 ppts

Pending sales that fell out of contract, as % of overall pending sales

13.4% 0.2 ppts

0.9 ppts

Monthly average 30-year fixed mortgage rate 6.18% 0.13 ppts

-0.47 ppts

March 2026 Metro-Level Highlights


The figures below are based on a list of the 50 most populous U.S. metropolitan areas. Some metros may be removed from time to time to ensure data accuracy.
Refer to our metrics definition page for explanations of metrics used in this report. Metro-level data are not seasonally adjusted. All changes below represent year-over-year changes.

  • Prices: Median sale prices rose most from a year earlier in San Francisco (14.4%), Detroit (11.1%) and Milwaukee (8%). They fell most in Oakland, CA (-6.3%), Dallas (-4.5%) and Sacramento, CA (-2.5%).
  • Pending home sales: Pending sales rose most in West Palm Beach, FL (25.4%), Miami (13.5%) and Milwaukee (11.7%). They fell most in Providence, RI (-13.2%), New Brunswick, NJ (-11.5%) and New York (-10.9%).
  • Closed home sales: Home sales rose most in West Palm Beach (15.5%), Kansas City, MO (11.7%) and Virginia Beach, VA (9.4%). They fell most in Nassau County, NY (-9.7%), Pittsburgh (-8%) and Oakland (-7.8%).
  • New listings: New listings rose most in San Jose, CA (13.5%), Boston (9.3%) and San Francisco (9.1%). They fell most in Tampa, FL (-17.4%), Jacksonville, FL (-13.4%) and Miami (-13.3%).
  • Active listings: Active listings rose most in Seattle (16.8%), Detroit (11.5%) and Milwaukee (10.8%). They fell most in Jacksonville (-18%), Tampa (-9.5%) and Riverside, CA (-9%).
  • Days on market: In Nashville, the typical home that went under contract did so in 91 days, which was 23 days longer than a year earlier—the biggest increase among the metros analyzed. Next came Indianapolis (+22 days) and Austin, TX (+19 days). The biggest decreases were in Kansas City, MO (-5 days), Fort Worth, TX (-4 days), San Francisco (-3 days) and West Palm Beach (-3 days).

March 2026 Full Metro-Level Data

U.S. metro area Median sale price Median sale price, Y/Y change Pending sales, Y/Y change Homes sold, Y/Y change New listings, Y/Y change Active listings, Y/Y change Median days on market Median days on market, Y/Y change
Anaheim, CA $1,260,000 4.7% 0.6% 1.3% -9.0% -5.6% 36 1
Atlanta, GA $392,000 -0.8% -2.9% 4.7% -3.2% 1.7% 59 4
Austin, TX $430,000 -2.3% 11.0% 2.4% -2.0% 2.7% 93 19
Baltimore, MD $399,000 6.4% -0.8% -3.5% -0.8% 6.6% 41 9
Boston, MA $748,000 3.2% -2.7% -0.9% 9.3% 6.9% 26 6
Charlotte, NC $408,000 0.5% N/A -2.9% 2.6% 8.2% 74 14
Chicago, IL $375,000 4.2% 2.7% 2.3% 2.3% -1.8% 51 -2
Cincinnati, OH $310,000 6.9% 7.1% -1.2% 3.1% 6.5% 45 2
Cleveland, OH $240,000 5.5% -0.1% -1.1% -0.5% 2.8% 32 0
Columbus, OH $355,000 4.4% 9.2% 0.3% 0.6% 2.6% 51 6
Dallas, TX $400,000 -4.5% 6.0% 0.3% -5.0% -0.2% 66 14
Denver, CO $589,000 -1.0% 0.0% 2.8% -6.9% 0.6% 24 -1
Detroit, MI $200,000 11.1% -6.4% -7.6% -2.8% 11.5% 37 6
Fort Worth, TX $352,585 -0.7% 5.5% 1.0% -1.8% -1.8% 54 -4
Houston, TX $330,320 -2.0% -7.0% -0.4% -4.4% 2.1% 76 13
Indianapolis, IN $310,000 2.3% 0.8% -2.1% -0.9% 7.2% 51 22
Jacksonville, FL $372,000 2.4% -0.2% -0.5% -13.4% -18.0% 76 5
Kansas City, MO $345,000 6.2% N/A 11.7% 5.3% -0.4% 32 -5
Las Vegas, NV $450,000 0.0% -2.8% 2.9% -6.7% 5.7% 62 10
Los Angeles, CA $913,400 -1.3% 1.1% 4.0% -2.7% -2.0% 45 3
Miami, FL $580,000 1.8% 13.5% 2.9% -13.3% -7.7% 95 9
Milwaukee, WI $350,000 8.0% 11.7% 9.2% 8.6% 10.8% 41 -1
Minneapolis, MN $380,000 0.0% -7.2% -1.3% 3.0% 4.8% 34 3
Montgomery County, PA $500,000 7.5% -2.7% 3.7% -1.9% 2.8% 35 7
Nashville, TN $464,900 0.0% -2.3% -2.8% 3.7% 9.2% 91 23
Nassau County, NY $737,000 5.3% -9.8% -9.7% -4.8% -7.9% 46 8
New Brunswick, NJ $550,000 0.2% -11.5% -5.8% 0.5% 0.3% 51 9
New York, NY $790,000 4.8% -10.9% -1.5% -3.3% -5.4% 68 1
Newark, NJ $600,000 1.7% -1.4% -2.4% -0.4% 1.5% 35 -1
Oakland, CA $918,000 -6.3% N/A -7.8% -4.9% -7.3% 15 0
Orlando, FL $410,000 1.2% -7.3% -6.8% -8.1% -8.7% 59 -1
Philadelphia, PA $291,000 2.1% -5.7% -7.8% 4.1% 0.7% 56 12
Phoenix, AZ $470,000 0.0% 6.0% 8.8% -5.1% -0.4% 59 3
Pittsburgh, PA $250,000 6.4% 1.8% -8.0% -2.3% 1.0% 72 3
Portland, OR $552,696 1.4% 3.8% 9.3% 0.6% 1.7% 31 1
Providence, RI $525,000 6.7% -13.2% -7.5% -11.1% -3.1% 37 7
Riverside, CA $585,000 -1.7% -0.7% 0.9% -8.7% -9.0% 54 2
Sacramento, CA $585,000 -2.5% 4.2% 4.9% 1.8% -0.1% 23 1
San Antonio, TX $313,725 -0.1% 0.1% 2.8% 6.3% 1.0% 105 18
San Diego, CA $915,000 0.0% -1.4% 9.2% -0.3% -2.6% 27 2
San Francisco, CA $1,720,000 14.4% N/A 5.4% 9.1% -6.5% 13 -3
San Jose, CA $1,638,000 -0.1% N/A 4.5% 13.5% 3.4% 10 -1
Seattle, WA $834,000 0.5% -8.1% -3.0% 2.4% 16.8% 12 4
St. Louis, MO $281,000 6.0% N/A -3.3% 7.2% 10.0% 33 5
Tampa, FL $375,000 1.4% -7.1% 0.1% -17.4% -9.5% 56 7
Virginia Beach, VA $367,423 5.0% -3.9% 9.4% 2.5% -1.2% 36 2
Warren, MI $313,000 4.3% 3.2% -1.4% 2.5% 10.2% 32 6
Washington, DC $585,000 0.0% 6.7% 5.5% 2.1% 8.3% 38 7
West Palm Beach, FL $515,000 -1.0% 25.4% 15.5% -7.3% -5.0% 86 -3

The post San Francisco Home Prices Jump Most in 8 Years Amid AI Boom appeared first on Redfin Real Estate News.

This post was originally published here

Idaho Gov. Brad Little signed into law a sweeping set of housing reforms as lawmakers sought to avoid a piecemeal legislative approach to the state’s housing affordability problem.

The legislation gave local governments more power to implement plans on missing middle housing, but took control away in some zoning.

Like Sun Belt states, Mountain West states such as Idaho saw population booms during the COVID-19 pandemic that overwhelmed housing supply. Remote workers left high-cost states such as California and New York for lower-cost areas, pushing prices higher in the places they landed.

Return‑to‑office policies have pulled workers back to their previous states, driving housing prices lower in cities where new construction surged. Austin, Texas, once a hotspot for price growth, now leads the nation in rent declines and ranks among the top cities for falling home prices as tech talent returns to the coasts.

Hollie Conde, a fellow at think tank Sightline Institute, told The Builder’s Daily that the scenario hasn’t happened in Idaho.

“So far, they have kept their jobs,” Conde said. “It’s come so far that we have people in the legislature that have lived here for five, six years.”

Solving a housing affordability problem

The new population brought big salaries and buying power that drove housing prices beyond what the average Idaho resident could afford.

Mountain West cities led the 2025 Urban Land Institute’s Terwilliger Center Home Attainability Index with percentage increases in home prices, citing data from 2019 to 2023. Boise’s metropolitan area topped the list, Coeur d’Alene, Idaho Falls and Twin Falls in the Top 10.

Last year, state lawmakers created a committee to study state and local land-use regulations and their impact on housing supply. The committee returned with recommendations, many of which are now law.

As is typical in other states, local governments fought the changes and still aren’t happy with the results. Coeur d’Alene city officials called the bills “dumb” and “not very clever” during a public meeting Tuesday, a local newspaper reported.

Manufactured housing — H800

Idaho law now treats manufactured homes, including manufactured duplexes and other multi-dwelling units, similarly to site-built single-family and multifamily housing for siting purposes. It lowers minimum size requirements and clarifies that single-section and smaller units cannot be zoned out.

Cities must allow manufactured single-unit homes wherever they permit single-family housing, while manufactured duplexes are limited to multifamily zones.

Lot splits for ADUs — H707

Subdivision law now includes an administrative path for cities and counties to approve limited lot splits. The property must already have an existing or approved ADU or secondary unit, mainly to enable separate ownership or financing.

The split does not add new dwelling entitlements or density beyond what zoning already allows and is “one and done” for the parent parcel. Each resulting lot must still meet local infrastructure, setback and building requirements.

Single-stair — H706

Changes to the Idaho Building Code Act let local governments approve small apartment buildings with a single interior exit stairway. Those buildings must meet strict life-safety standards and are limited in height, unit count and floor area. They also must have full sprinklers, pressurized two-hour-rated stairs, fire-rated corridors, short exit travel distances and robust smoke and fire detection.

ADUs — S1354

The zoning reform requires cities to allow accessory dwelling (ADUs) units by right as a residential use in many places. It prevents local governments and homeowners’ associations from flatly banning ADUs. The law guarantees at least one ADU per lot in covered jurisdictions.

It also bars local rules that impose hard maximum size caps, but still allows health, safety and infrastructure standards.

Starter homes / small lots — S1352

State law now preempts certain local regulations to protect “starter home subdivisions” on at least four acres. It prevents cities from banning these projects through large minimum lot sizes and other dimensional standards.

The law bars local rules that require lots above a defined minimum size, such as 1,400 square feet, or impose certain setbacks, depths and fees. It also pushes cities to permit smaller lots and higher minimum densities, around 12 units per acre, subject to infrastructure limits, for these starter home projects.

This post was originally published on here

Pending home sales are declining and touring activity is slumping. 

U.S. pending home sales fell 4.1% from a year earlier during the four weeks ending April 12, the biggest decline in over a year. 

Sales fell in all but seven of the 50 biggest U.S. metro areas, with the biggest declines in Providence, RI (-17.5%), Houston (-16.9%) and Nassau County, NY (-14.8%). The biggest increases were in San Francisco (9.6%), West Palm Beach, FL (8.2%) and Miami (6.4%). 

Homebuying demand is unseasonably slow. Home-touring activity is up just 11% since the start of the year, compared to a 40% increase over the same period last year, according to ShowingTime

Would-be homebuyers are backing off partly because the Iran war is causing widespread geopolitical and economic uncertainty, making some Americans wary of making a big purchase. It has also contributed to higher mortgage rates, though the average rate fell slightly to 6.37% last week. Mortgage rates may swing up or down in the next few weeks, depending on the direction of the Iran war, the outcome of negotiation talks and oil prices.  

High housing costs are also sidelining house hunters. The median home-sale price rose 2.3% annually, the biggest increase in a year, and while the weekly average mortgage rate has come down slightly, it is still near a six-month high. It’s worth noting that the timing of Easter is contributing to the year-over-year decline in pending sales, too: Easter fell into this four-week period, but not the comparable period in 2025. 

Redfin agents in some parts of the country say some buyers are jittery about whether it’s the right time to make a big purchase, with economic uncertainty in the air and the rising prices of other things, like gas, cutting into their budgets.

On the selling side, new listings of homes for sales declined 1.4% year over year, with some prospective sellers hitting pause while demand is down. 

For Redfin economists’ takes on the housing market, please visit Redfin’s “From Our Economists” page. 

Leading indicators 


Indicators of homebuying demand and activity
Value (if applicable) Recent change Year-over-year change Source
Daily average 30-year fixed mortgage rate 6.32% (April 15) Down from 6.64% three weeks earlier  Down from 6.98% Mortgage News Daily 
Weekly average 30-year fixed mortgage rate 6.37% (week ending April 9) Down slightly from 6-month high the week before Down from 6.62% Freddie Mac
Mortgage-purchase applications (seasonally adjusted) Down 1% from a week earlier (as of week ending April 10) Down 3% Mortgage Bankers Association 
Google searches of “homes for sale” Up 11% from a month earlier (as of April 11) Up 20% Google Trends
Touring activity Up 11% from the start of the year (as of April 12) At this time last year, it was up 40% from the start of 2025 ShowingTime

Key housing-market data


U.S. highlights: Four weeks ending April 12, 2026

Redfin’s national metrics include data from 400+ U.S. metro areas and are based on homes listed and/or sold during the period. Weekly housing-market data goes back through 2015. Subject to revision. 

Four weeks ending April 12, 2026 Year-over-year change Notes
Median sale price $393,059 2.3% Biggest increase in a year
Median asking price $426,225 1.8%
Median monthly mortgage payment $2,748 at a 6.37% mortgage rate -1.9%
Pending sales 86,665 -4.1% Biggest decline in a year
New listings 103,853 -1.4%
Active listings 1,092,911 -2.7% Biggest decline since 2023
Months of supply  4.2 Unchanged 4 to 5 months of supply is considered balanced, with a lower number indicating seller’s market conditions 
Share of homes off market in two weeks  38.4% Essentially unchanged
Median days on market 48 +4 days
Share of homes sold above list price 24.3% Down from 26%
Average sale-to-list price ratio  98.6% Down from 98.7%

Metro-level highlights: Four weeks ending April 12, 2026

Redfin’s metro-level data includes the 50 most populous U.S. metros. Select metros may be excluded from time to time to ensure data accuracy. 

Metros with biggest year-over-year increases Metros with biggest year-over-year decreases

Notes

Median sale price San Francisco (13.3%)

Detroit (10.7%)

Cleveland (9.8%)

Providence, RI (9%)

Pittsburgh (8.8%)

Dallas (-3.4%)

Austin, TX (-3.2%)

Oakland, CA (-3.2%)

Seattle (-2.9%)

Nashville, TN (-2.8%)

Declined in 17 metros

Pending sales San Francisco (9.6%)

West Palm Beach, FL (8.2%)

Miami (6.4%)

Fort Worth, TX (2.4%)

Milwaukee (1.3%)

Providence, RI (-17.5%)

Houston (-16.9%)

Nassau County, NY (-14.8%)

New York (-14.2%)

Seattle (-13.8%)

Increased in just 7 metros 
New listings Milwaukee, WI (12%)

Philadelphia (11.5%)

San Jose, CA (8.5%)

Minneapolis (7.3%)

Indianapolis (5.8%)

Tampa, FL (-15.8%)

Jacksonville, FL (-14.9%)

Anaheim, CA (-13.8%)

Riverside, CA (-13%)

Orlando (-11.9%)

Refer to our metrics definition page for explanations of all the metrics used in this report.

The post This Spring’s Housing Market Is Unseasonably Slow As Iran War, High Costs Curb Demand appeared first on Redfin Real Estate News.

This post was originally published here

Zillow has signed an agreement with REMAX that makes its Zillow Preview and Zillow Showcase listing products available to REMAX agents nationwide through the REMAX Marketing Studio, according to an announcement on Tuesday. 

Zillow had previously announced REMAX as one of the original firms to sign up for Zillow Preview, its pre-marketing platform for coming soon listings. 

Zillow Showcase is a paid, AI-powered premium listing product designed to boost on-market visibility through richer media and interactive design. According to Zillow, together, the two products create an end-to-end listing marketing workflow focused on generating demand ahead of launch and maximizing engagement once a listing is active.

Zillow framed Preview and Showcase as part of a broader pivot toward helping agents win and convert listings, not just generate buyer leads — a notable shift from the industry’s long emphasis on buyer-side lead volume.

REMAX will integrate Zillow Showcase into its REMAX Marketing Studio platform, giving its more than 145,000 agents access to the product on a per-listing basis. That integration means agents can turn Showcase on as needed without committing to long-term contracts, according to the announcement.

Broker-owners and franchisors can also offer Showcase at scale across their networks. Zillow and REMAX position this as a way to standardize a higher baseline for listing marketing while adding a recruiting and retention lever in a highly competitive brokerage landscape.

“Agents need marketing solutions that can evolve with the shifting landscape and help deliver results for buyers and sellers,” REMAX president and chief growth officer Chris Lim said in the release. Lim said the combination of Preview and Showcase gives REMAX agents “a stronger way to compete from the very first conversation” with clients.

Bobbi Jo Price, vice president of agent sales at Zillow, said the partnership gives REMAX agents something “tangible” to show in listing presentations that differentiates them from competitors.

Showcase adoption has been growing beyond REMAX. The product appeared on 3.7% of new listings on Zillow in the fourth quarter of 2025, up from 1.7% a year earlier, according to Zillow’s Q4 2025 shareholder letter. While that remains a small share of overall listings, the more than twofold year-over-year increase suggests growing demand from agents and sellers for premium presentation, according to Zillow.

This article was generated using HousingWire Automation and reviewed by a HousingWire editor before publication. The system helps convert company announcements and industry data into HousingWire-style news coverage.

This post was originally published on here

A borrower’s age should shape every financing recommendation, yet it is often treated as a secondary detail when a senior wants, or needs, access to a portion of their equity.

Consider that most mortgage advice is built on the assumptions that the borrower will continue working and has time and resources to recover from financial setbacks. Those assumptions break the moment someone retires. And if the assumptions change, the strategy should too.

For example:

  • At age 45, risk is manageable, income is active, time is an asset, and debt can be used strategically. 
  • At age 70, the equation shifts. Income is often fixed, expenses become less predictable, time is limited, and financial setbacks carry more weight because there is less opportunity to recover.

That shift should change the goal of home equity lending. At older ages, it is no longer about maximizing leverage or optimizing interest rates. Rather it is about protecting cash flow, preserving flexibility, and reducing financial pressure. When financing recommendations fail to recognize this reality, loan products can do more harm than good.

Unfortunately, homeowners tend to gravitate to what they know, like HELOCs and cash-out refinances. Maybe they are enticed by newer options like Home Equity Investments that only appear simple and safe. 

The HELOC trap

On the surface, a Home Equity Line of Credit (HELOC) appears flexible. It allows borrowers to access funds as needed rather than taking everything upfront. But it comes with a built-in problem for retirees: required payments. Even during an interest-only period, there is still a monthly obligation, and that obligation can rise if rates increase. Eventually, the loan converts to full repayment, which can create significant payment shock. 

HELOCs are also not fully under the borrower’s control. Lenders can freeze, reduce, or cancel the line. This has happened in past market downturns, often at the exact moment borrowers need funding the most. 

The refinancing game

Refinancing presents a different challenge. It feels straightforward and familiar because many senior homeowners have done it… many times. But a cash-out refinance creates a new mortgage with required monthly principal and interest payments. It resets the loan term and assumes stable, ongoing income. 

That assumption does not always hold in retirement. Instead of reducing financial pressure, a refinance often increases it by introducing a fixed obligation at the wrong stage of life. It also forces the borrower to take a lump sum, which means interest begins accruing on the full amount, whether the funds are needed or not. What worked during earning years can become a burden during retirement.

What about home equity investments? 

Home Equity Investments (HEI) or Home Equity Agreements (HEA) are gaining attention because of how they are marketed. No loan! No interest! No payments! The message is simple, and simplicity is appealing.

But the structure tells a different story. These agreements require the homeowner to give up a significant portion of the home’s future value in exchange for cash today.

The cost is tied, in part, to home appreciation. This can cause the repayment amount to grow significantly. In many cases, the homeowner ends up giving up far more than they anticipated. Because the cost is not labeled as interest, it is ambiguous and easy to underestimate. But from a financial perspective, the outcome often resembles a very expensive form of borrowing.

If a borrower receives funds and later owes much more because of how the agreement is structured, the label does not matter. The outcome does. When the cost is difficult to understand, easy to overlook, and overwhelmingly favors the provider, the product deserves serious scrutiny. In many cases, the math appears predatory.

The reverse mortgage is age-appropriate

When you step back and evaluate the previous options through the lens of age, their limitations become clear. Most mortgage products are designed for borrowers in their working years and then adapted, often poorly, for retirement.

The reverse mortgage stands apart because it was specifically built for this stage of life. At its core, it removes the requirement for monthly principal and interest payments. The borrower must simply occupy and maintain the home and pay all property charges. This  directly addresses one of the biggest challenges in retirement: managing cash flow with limited income.

It also offers a line of credit that behaves very differently from a HELOC. It cannot be frozen or reduced due to market conditions so long as the loan is in good standing. Even more important, it grows over time, increasing the amount of funds available in the future. This turns home equity into an expanding financial resource rather than a static one.

When financing is evaluated through the lens of age, the reverse mortgage shines bright. The best solution is not the one that feels familiar. Rather it is the one that fits the needs and desires of the borrower at their stage of life.

Dan Hultquist is a co-founder of REVERSE plus, and author of “Understanding Reverse” and “Navigating Reverse.”
This column does not necessarily reflect the opinion of HousingWire’s editorial department and its owners. To contact the editor responsible for this piece: zeb@hwmedia.com.

This post was originally published on here

New York Governor Kathy Hochul is reversing course and throwing support behind a proposed annual tax on high-end second homes in New York City.

Hochul, who had previously resisted the measure, now says affluent property owners — particularly those with multimillion-dollar second homes — should help shoulder the burden of growing revenue gaps.

The proposed “pied-à-terre” tax would apply to second homes valued above $5 million, with higher rates for properties exceeding $15 million and $25 million.

Lawmakers estimate it could generate roughly $500 million annually and affect around 13,000 properties.

Urgency for new revenue streams has been heightened by New York City’s looming multi-billion dollar budget shortfall — which was left by Eric Adams’ administration.

Real estate industry groups have pushed back hard on the tax proposal, warning it could weaken the broader economy, reduce construction jobs and depress property values.

Bill Kowalczuk, a real estate broker at Manhattan-based Coldwell Banker Warburg, said the policy would likely cool — but not derail — the top tier of the market.

“It would slightly reduce demand,” he told HousingWire. “The ultra-luxury market is strong due to limited inventory, but a new annual cost will give buyers a reason to pause or negotiate. It doesn’t break the market, but it takes some urgency out, especially for second-home buyers at this price point.”

Kowalczuk noted that second-home buyers make up a significant share of the luxury segment — and their motivations matter when assessing the policy’s impact.

“About 30% to 40% of ultra-luxury buyers are getting second homes and many come from other countries or live in New York part-time,” he said. “While they aren’t all ‘refugees,’ many seek something stable, want to spread out their money and have a place in the city.”

Is pushback overblown?

Rather than abandoning New York upon the new tax being implemented, Kowalczuk expects most wealthy buyers to adjust financially.

“Most will negotiate harder on the price,” he said. “At this level, buyers won’t walk away from New York that easily, but they will absolutely adjust pricing to offset the new costs of ownership. A smaller group may look more seriously at places like Florida, but New York will always hold a unique position domestically and globally.”

Kowalczuk also pushed back on industry warnings of severe economic fallout.

“It’s a fair point, but I believe it is overstated,” he said. “There could be some pressure on values at the very top end and potentially slower new development activity, but the ultra-luxury market is resilient; the numbers seem really large to the average person. But, someone who has a $10M second home won’t see it the same way. It [the market] won’t stop. It may just not move as aggressively as it has lately.”

On why the proposal may gain traction now despite failing in the past, Kowalczuk pointed to shifting political and fiscal realities.

“You now have support at both the state and city levels, and the need for revenue is more immediate,” he said. “The proposal feels more real this time, but it still comes down to the final details and what everyone agrees to.”

Surging demand at the very top — despite uncertainty

Debate comes as the ultra-luxury market shows surprising strength — even amid economic uncertainty and geopolitical instability.

HousingWire Data indicates pending sales in the ultra-luxury single-family segment — defined by a $4.3 million median price — jumped 200% in the most recent weekly period.

At the same time, price cuts dropped to 11.8%, well below the city’s long-term average of 17.9%.

That momentum suggests deep-pocketed buyers are still actively competing for scarce inventory.

Outside the ultra-luxury segment, however, conditions are more mixed.

New listings in the broader luxury market — including condos and townhomes with a $2 million median price — fell 17% to 179 properties. The co-op sector saw an even steeper 26% decline in new listings, pointing to persistent supply constraints.

As New York’s market dynamics and state lawmaker negotiations play out, the proposed tax could provide a revenue solution while also testing one of the world’s most exclusive housing markets.

This post was originally published on here

The Landmarks Preservation Commission voted unanimously Tuesday to approve the demolition of two mid-20th-century commercial buildings in Tribeca’s historic district to make way for a luxury residential development. Proposed by SilverLining Development, the 8-story project at 31–35 Lispenard Street in the Tribeca East Historic District will feature 19 apartments, likely rentals, as Tribeca Citizen first reported, with a facade inspired by the cast-iron buildings in neighboring Soho. Aden Wiener, founder of SilverLining, said the development will introduce a “new concept of living” to the area, with ground-floor retail and a boutique collection of “highly amenitized” loft residences.

The current site.

SilverLining purchased the two-lot parcel for $7.5 million in an off-market transaction. The deal also included the purchase of air rights from an adjacent property at 325 Church Street. The seller was real estate investment firm Urban Standard Capital, which had planned a seven-story residential building with ground-floor retail at the site. LPC approved that plan in 2019, but it was never built.

Both corner businesses, the Dominican diner Westside Coffeeshop and a barber shop at the site, closed in fall 2024, according to Tribeca Citizen.

The previous proposal featured a limestone facade with horizontal reveals carved into the building, a penthouse floor and bulkhead designed to match the overall color of the building, and a rear brick facade.

Marin Architecture has been tapped to design the project in collaboration with Charlap Hyman & Herrero. Marin designed 685 Fifth Avenue, the former Gucci headquarters, which it later transformed in 2024 into the 29-story Mandarin Oriental Residences. The firm also designed Brooklyn’s first Apple store at 247 Bedford Avenue in Williamsburg.

Ground floor design rendering.
Facing west.

The residential building will feature four units on the second and third floors: two studios, a one-bedroom, and a two-bedroom. The fourth through sixth floors will contain two one-bedroom units and one two-bedroom unit per floor, while the seventh and eighth floors will house two duplex units.

The facade will feature metal cladding, a material that has drawn concern from local advocacy groups. In Tuesday’s presentation, Christina Conroy of the Victorian Society New York said the group supports many aspects of the proposal but questioned the use of metal cladding in a district where masonry is the dominant historic facade material.

“A new building in any historic district should be considered not just on its own merits, but for the way it relates to the streetscape,” Conroy said. “This proposal seems to have strayed into the neighborhood from the SoHo Cast Iron Historic District, so we urge the applicant and the commission to rethink this aspect of the design.”

The applicant’s spokesperson said they understood concerns about the metal palette and assured those worried about the design that the team plans to use high-quality materials and is in discussions with manufacturers to determine the ideal thickness of the aluminum panels.

While the two lots, measuring roughly 3,120 square feet, reside within the historic district, the buildings were never a contributor to the historic character of the area.

The district’s 1992 designation report lists 35 Lispenard’s original architect as Mac L. Reiser, who designed it between 1954 and 1956. An alteration during that period demolished two upper stories of a brick building previously occupied by merchants of cloaks and suits. It was later converted into a boarding house, and subsequently into a ground-floor saloon with storage and factory space above.

The building’s current marble facade is the result of an alteration application filed in 1969, though the work was not completed until 1991. During the 1960s, the space operated as a retail store and was later replaced by a restaurant.

Construction is expected to begin this summer, although no building permits have been filed yet. The building is as-of-right and does not require additional approvals or zoning changes.

RELATED:

The post Landmarks approves 8-story cast-iron-inspired rental in Tribeca first appeared on 6sqft.

This post was originally published here

Artificial intelligence (AI) tools equip real estate agents with unprecedented capabilities. While ChatGPT has become a go-to tool for many of us, there are tons of AI tools for real estate that offer a more efficient, data-driven approach to generating new client leads. From automated chatbots that qualify incoming leads and analytics to predict upcoming sellers, AI saves time and provides endless solutions for real estate professionals.

Since real estate tech changes by the hour these days, we did a deep dive into the most helpful AI tools for real estate agents on the market today. Here’s a list of our favorites (so far!), and we’ll keep updating this guide as helpful new AI tools get on our radar.

At-a-glance: The best AI tools for real estate agents

AI Lead Generation and Nurturing Tools

Logo-iNCOM

Best overall

Top Producer’s Smart Targeting

Jump to details ↓

VISIT

SmartZip logo.

Best for predictive analytics

Smartzip

Jump to details ↓

VISIT

rechat-logo

Best all-in-one solution

Rechat.

Jump to details ↓

VISIT

Fello new logo

Best CRM add-on for lead conversion

Fello

Jump to details ↓

VISIT

Logo Ylopo

Best for AI-powered lead generation + nurturing

Ylopo’s AI voice + text lead nurturing

Jump to details ↓

VISIT

AI Marketing Tools

trolto-logo

Best for AI-powered property marketing

Trolto

Jump to details ↓

VISIT

REimagineHome logo

Best for AI virtual staging + image enhancement

REimagineHome

Jump to details ↓

VISIT

Collov AI logo

Best for affordable AI home staging

Collov AI

Jump to details ↓

VISIT

Logo-Canva

Best for AI design

Canva

Jump to details ↓

VISIT

Scout logo

Best for AI email marketing

Scout

Jump to details ↓

VISIT

AI-Enhanced CRMs

Logo-Lofty

Best for AI chat and CRM

Lofty’s AI Assistant

Jump to details ↓

VISIT

Sierra-Interactive logo; a real estate CRM or customer relationship management software

Best for AI chat and SEO

Real Geeks’ Geek AI & SEO Fast Track

Jump to details ↓

VISIT

Property valuation and market analysis

image_056b0a

Best for AI property valuation reports

HouseCanary

Jump to details ↓

VISIT

Screenshot 2026-02-25 100926

Best for market data

Cotality

Jump to details ↓

VISIT

AI Productivity for agents

ListedKit AI logo.

Best for transaction management

ListedKit AI

Jump to details ↓

VISIT

Sidekick Logo

Best overall AI productivity tool

Sidekick

Jump to details ↓

VISIT

At-a-glance: The best AI tools for real estate agents

AI Lead Generation Tools

Best overall

Top Producer’s Smart Targeting

VISIT

Jump to details ↓

Best for predictive analytics

Smartzip

VISIT

Jump to details ↓

Best all-in-one solution

Rechat.

VISIT

Jump to details ↓

Best CRM add-on for lead conversion

Fello

VISIT

Jump to details ↓

Best for AI-powered lead generation + nurturing

Ylopo

VISIT

Jump to details ↓

AI Marketing Tools

Best for AI-powered listing marketing

Trolto

VISIT

Jump to details ↓

Best for AI virtual staging + image enhancement

REimagineHome

VISIT

Jump to details ↓

Best for affordable AI home staging

Collov AI

VISIT

Jump to details ↓

Best for AI design

Canva

VISIT

Jump to details ↓

Best for AI email marketing

Scout

VISIT

Jump to details ↓

AI-Enhanced CRMs

Best for AI chat and CRM

Lofty’s AI Assistant

VISIT

Jump to details ↓

Best for AI chat and SEO

Real Geeks’ Geek AI & SEO Fast Track

VISIT

Jump to details ↓

Property valuation and market analysis

Best for AI property valuation reports

HouseCanary

VISIT

Jump to details ↓

Best for market data

Cotality

VISIT

Jump to details ↓

AI Productivity for agents

Best for transaction management

ListedKit AI

VISIT

Jump to details ↓

Best overall AI productivity tool

Sidekick

VISIT

Jump to details ↓

AI lead generation tools

AI tools for lead generation use sophisticated algorithms that sift through vast amounts of consumer data, identify potential leads and even predict which prospects are most likely to become active buyers or sellers in the coming months. Using AI tools will streamline your lead generation efforts, helping you focus your time and energy on the most promising prospects.

1. Top Producer’s Smart Targeting

Phone and computer screenshots depicting Top Producer's AI tools for real estate agents

Starting price: $599 per month for CRM + Smart Targeting

AI tool: Smart Targeting predictive analytics

Best features:

  • Includes Top Producer CRM
  • Uses AI to analyze data and market trends to identify likely sellers
  • Personalized marketing campaigns include online ads, email marketing, postcards and handwritten letters
  • Automated lead follow-up 
  • Target zip codes or custom farm areas

Our take on Top Producer’s AI

Adding leading-edge AI lead generation technology to one of the most popular CRMs in history is a match made in heaven. Top Producer’s Smart Targeting uses proprietary AI to identify the top 20% of likely sellers in your farm area and gives you automated marketing tools to reach them. It’s the perfect way to introduce seasoned agents to AI without the intimidation factor.

Visit Top Producer

Top Producer Review

2. Smartzip

smartzip-screenshot

Starting price: ~$500 per month

AI tool: Smart Targeting predictive analytics

Best features:

  • Uses AI to analyze data and market trends to identify likely sellers
  • Smart Targeting product provides targeted, automated marketing
  • Over one billion points of property, behavioral, event and demographic data used in algorithm
  • Predicted 72% of listings last year
  • Landing pages that convert sellers

Our take on Smartzip

Smartzip is one of the first companies to offer AI-powered predictive analytics to find likely sellers. It aggregates hundreds of data points from more than 25 sources and uses its predictive analytics to identify the homeowners most likely to move within the next six to 12 months, maintaining 72% accuracy. Real estate agents using SmartZip gain immediate access to its CRM populated with leads and their data. Agents simply select their desired zip codes and set up automated direct mail marketing tools to reach sellers most likely to transact. It’s an ideal solution for new and experienced listing agents seeking a steady stream of warm seller leads.

Visit Smartzip

Smartzip Review

3. Rechat.

image

Starting price: ~$35 per seat, depending on team size + features

AI tool: Lucy the proactive assistant

Best features:

  • Produces competitive market analyses for client presentation
  • Creates a custom website in seconds
  • Builds marketing content for social media

Our take on Rechat.

Rechat.’s AI tool Lucy is your all-in-one personal assistant directly accessible on your cell phone. The amazing thing about Lucy is that it works behind the scenes to organize and create all the items that generally take up the most time for real estate agents. This includes creating marketing materials for new listings (digital and print), building branded websites and personalizing your communication. Lucy does it all so agents have time for what actually matters: working with clients.

Visit Rechat.

4. Fello

Fello new logo

Starting price: $165 per month

AI tool: Lead scoring, database enrichment, marketing

Best features:

  • Integrates with any CRM
  • AI lead scoring
  • Segmentation and organization of leads in your existing database
  • Enrich database with property records, contact information and ownership verification
  • Custom campaigns to engage potential sellers

Our take on Fello

Fello is a unique add-on tool that works in your CRM to identify, score and convert leads who are most likely to sell their home in the next six months. Primarily focused on converting buyer leads to sellers, Fello also leverages property and market data analysis to target previous owners. Fello starts by analyzing each lead in your database, scoring them based on their likelihood to sell and segmenting them for outreach. Fello’s AI then leverages millions of data points to create hyper-personalized AI-powered marketing campaigns to nurture them until they’re ready to talk to an agent. It’s best suited for agents and teams with large databases who want to drum up listings from “cold” leads.

Visit Fello

5. Ylopo

Logo Ylopo

Starting price: $600 per month

AI Tools: AI text and voice lead nurturing assistants, AI-powered video ads

Best features:

  • AI text and voice lead nurturing assistants 
  • AI-powered video ads for Meta
  • Direct integration with popular CRMs

Our take on Ylopo

Ylopo is an AI-first lead generation and nurturing platform that offers sophisticated AI-powered texting and voice assistants to help you generate, qualify and nurture leads. When a new lead is generated with Ylopo, their AI voice assistant calls on your behalf using an AI-generated voice that is nearly indistinguishable from a human voice. The company also offers leading-edge AI-powered ads that pull listing information and the best photos from your MLS to automatically create high-converting video ads for Meta.

Visit Ylopo

This post was originally published on here

Governor Kathy Hochul on Wednesday proposed a yearly tax on non-primary residences in New York City. After resisting calls to tax high-income earners led by progressive leaders like Mayor Zohran Mamdani, the governor is now embracing a surcharge on secondary homes in the five boroughs valued at $5 million and above. Known as pieds-à-terre, these properties are occupied by part-time residents who usually stay there while working or visiting the city. While it’s not the first time such a tax has been proposed in recent years, the new push for the surcharge comes as the city deals with a multibillion-dollar budget gap.

Homeowners who do not live or work full-time in New York City do not pay income taxes, limiting their contributions to public services, including fire and police departments, sanitation, parks, and transit systems. According to Hochul, the new pied-à-terre tax could generate at least $500 million annually in revenue for the city, which is currently facing a $5.4 billion budget gap.

“New York City is the greatest city in the world, and the people who call it home should not be left carrying the burden alone,” Hochul said.

“As Governor, I understand the importance of stabilizing the city’s finances without compromising on essential services New Yorkers count on. If you can afford a $5 million second home that sits empty most of the year, you can afford to contribute like every other New Yorker.”

As reported by the New York Times, Hochul plans to include the tax in the state’s budget, which was due April 1 and is still being negotiated. Details on the new surcharge were not released as of Wednesday, but previous proposals included a sliding scale model, with a higher tax on the most expensive properties.

Officials have called for a tax on luxury secondary homes since 2014, when Manhattan Borough President Brad Hoylman-Sigal, then a state senator, drafted legislation. The bill failed to move forward, but the effort was renewed in 2019 after Ken Griffin bought a $238 million apartment at 220 Central Park South as a “place to stay when he’s in town,” reviving interest in the tax.

Another part of a complicated tax system, city co-ops and condos are not taxed at market value, but instead are assessed by looking at comparable rental buildings. As 6sqft previously reported, that means Griffin’s apartment was assessed at $9.4 million, only 3.9 percent of the purchase price.

In 2017, there were 75,000 pieds-à-terre, according to the New York City Housing and Vacancy. The most recent survey by the group, with findings from 2023, found a significant drop off, with 59,000 units.

Several cities have implemented a tax on second homes, including Paris, Singapore, and Vancouver, not only to raise funds but also to return “empty or under-used properties to more active use as long-term rental homes,” according to a 2019 report from the Fiscal Policy Institute.

Hochul on Wednesday said it’s a matter of fairness to the residents who actually live in New York City.

“Those who benefit from the city without living in a full-time capacity should contribute to the costs that it takes to run the city: public safety, world-class parks, amenities, the roads, the subway system,” the governor said.

“This proposal simply ensures that they’re contributing in a meaningful way to keeping New York City the greatest city in the world.”

During his campaign, the mayor said he would call for taxes to be raised on the wealthiest New Yorkers to pay for his agenda of free buses and childcare. Earlier this year, Mamdani released his first preliminary budget, which included a $5.4 bullion budget gap.

He said if Albany does not raise taxes, the city would raise property taxes by 9.5 percent and tap into the city’s reserves to close the budget gap. Both ideas received criticism, and Mamdani backed away from the tax hike.

In February, Hochul announced an additional $1.5 billion over two years to help New York City’s fiscal crisis. In March, Mamdani announced that city agencies identified $1.7 billion more in savings.

“Thanks to the support of Governor Hochul, we are one step closer to balancing our budget by taxing the ultra-wealthy and global elites with a pied-à-terre tax — the first of its kind in our state,” Mamdani said.

“Alongside the governor, our administration is fighting every day to make sure we address this fiscal deficit fairly, where the wealthy contribute what they owe and our budget reflects our commitment to the working New Yorkers being priced out of our city.”

RELATED:

The post Hochul proposes pied-à-terre tax on NYC second homes worth over $5M first appeared on 6sqft.

This post was originally published here

Mortgage industry veteran Jeremy Moreithi has joined Waterstone Mortgage Corp. as branch manager of its office in Ashburn, Virginia, the company announced Wednesday.

Moreithi, who has more than 20 years of mortgage lending experience, will be based in Ashburn but will primarily serve homebuyers in the Greater Washington D.C., Maryland and Virginia metropolitan areas. He is listed in HousingWire‘s Mortgage Rankings with a 2025 volume of $46.4 million across 92 loans while serving with Envoy Mortgage.

In his new role, Moreithi will offer loans backed by WaterStone Bank while using Waterstone Mortgage’s tools, programs and support to work with a wide range of homebuyers. The company said this structure is intended to support more customized financing options for borrowers with varying financial profiles.

“I made the move to Waterstone Mortgage because it represents the next step in elevating how I serve my clients and partners,” Moreithi said in a statement. “The company’s extensive array of programs allows me to provide better solutions tailored to each client’s needs. Most importantly, their full commitment to support ensures I can continue delivering the highest level of service possible.”

Waterstone said the hire aligns with its strategy to grow by adding experienced originators and branch leaders in key markets. Lenders are competing aggressively for seasoned producers in the Mid-Atlantic region as higher mortgage rates and tight inventory pressure lending volumes.

“Having had the privilege of working with Jeremy for over 15 years, I can confidently say his integrity, expertise and client-first mindset are unmatched in our industry,” said Margie Hennessey, vice president of Eastern sales for Waterstone Mortgage. “Beyond being a seasoned mortgage professional, he is a trusted colleague and a great friend whose contributions will undoubtedly elevate our entire organization.”

This article was generated using HousingWire Automation and reviewed by a HousingWire editor before publication. The system helps convert company announcements and industry data into HousingWire-style news coverage.

This post was originally published on here

Williston Financial Group (WFG) announced a series of executive appointments, including Ryan Ozonian taking over as senior director of innovation and AI at MyHome.

In the role, he will guide artificial intelligence (AI) and automation initiatives across the organization — working to integrate new technologies into existing workflows and improve transaction processes.

“Ryan’s appointment reflects the intentional way we have scaled innovation across the WFG family of companies,” said Marty Frame, president of MyHome. “We are not approaching AI as a standalone initiative. We have integrated it into how we operate, how we deliver product and how we create value.

“Ryan will play a critical role in bridging that strategy across our organization, ensuring our investments in AI and automation translate into real, practical impact for our agents, customers and partners and the consumers they serve.”

WFG National Title Insurance announced that Shaun Gonzales has been appointed chief operations officer for direct operations — where he will oversee title and settlement functions.

Gonzales brings more than 25 years of industry experience and previously held senior leadership roles managing multi-state operations.

Noah Blanton will transition to chief growth officer in the coming months — focusing on market expansion and long-term development initiatives. He currently serves as division president in Oregon and has led regional growth efforts.

Josie Hyde will expand her leadership responsibilities to include Oregon in addition to her existing oversight of markets in Washington state.

“These leadership moves reflect who we are as a company and where we’re going,” said CEO Steve Ozonian. “Our focus has never been on being the biggest; it’s on being the best. The strength of this team, and the way we continue to develop and elevate leaders from within, positions us to deliver an even higher level of performance for our clients while continuing to help shape the future of our industry.

[Chairman Patrick Stone] and I are as engaged as ever, and we’re building the bench around us that will allow WFG to keep leading for decades to come.”

Stone added, “From the beginning, we set out to build a company designed for long-term success; one grounded in strong leadership, clear vision and a culture that supports both. What you’re seeing here is a continuation of that vision.” 

This article was generated using HousingWire Automation and reviewed by a HousingWire editor before publication. The system helps convert company announcements and industry data into HousingWire-style news coverage.

This post was originally published on here

Auction.com announced Tuesday that it has appointed President Ali Haralson as co-CEO and a member of its board of directors, formalizing a shared leadership structure with Jason Allnutt at the distressed real estate marketplace.

Haralson, who has served as president since 2021, will lead the company alongside Allnutt, who took on the CEO role in 2018 and will remain on the board.

“Ali is an extraordinary leader, with exceptional market insight and deep industry relationships,” said Jim Carlisle, managing director and head of the technology business solutions investment vertical at THL Partners, which owns a majority stake in Auction.com.

“Her long-standing partnership with Jason makes this co-CEO structure a natural fit, and we’re confident in their joint leadership of Auction.com’s continued growth.”

As president, Haralson’s responsibilities spanned operations, business development, client partnerships and culture initiatives. In the co-CEO role, she will continue to work closely with Allnutt on company strategy, execution and growth, the firm said.

Allnutt will continue to focus on technology and product teams, with an emphasis on tools that improve the buying experience for the platform’s more than 8 million registered users. He will also work to broaden participation in distressed property auctions by more first-time homebuyers and other owner-occupant buyers.

“I’m proud to have Ali formally step into the role of co-CEO within a leadership structure we developed together and have been operating under for some time,” Allnutt said. “Over the past few years, we’ve had the opportunity to test this model while running Auction.com and see it work. We’re confident it’s the most effective way to position our company for continued growth and success in the years ahead.”

Haralson said the co-leadership model has proven effective as the company has scaled and navigated shifting market conditions in the distressed housing space.

“Jason has led the company with vision and resolve over the past decade, and it’s been a privilege to partner with him in that leadership journey,” Haralson said. “Together, we’ve come to value the strength of a co-leadership model, and I truly believe it will continue to serve our buyers, sellers, employees, and board in the years to come.”

The company’s private equity backers also signaled support for the new leadership structure.

“Auction.com has built a leading platform, and we’re proud of the team behind it. We believe Ali and Jason are exactly the right leaders for its next chapter,” said Agha S. Khan, co-head of private equity at Stone Point Capital.

This article was generated using HousingWire Automation and reviewed by a HousingWire editor before publication. The system helps convert company announcements and industry data into HousingWire-style news coverage.

This post was originally published on here

Side has embedded a new suite of AI tools into its proprietary Side App to automate document checks, extract offer details, auto-tag signatures and deliver real-time business reporting for real estate agents and team leaders.

The San Francisco-based brokerage platform announced the launch at Side x Side 2026, its annual community event. The firm said this release targets what Side describes as one of the industry’s largest hidden costs: administrative drag in the transaction process. The new capabilities are built directly into the Side App, which Side said has supported hundreds of thousands of transactions since its 2017 debut. By integrating AI into existing workflows, the company aims to reduce errors, accelerate transaction prep and give leaders clearer visibility into performance.

As part of the launch, Side is rolling our four AI core features: AI document validation, which checks files in real time for missing information and disclosures; AI offer extraction, which scans uploaded offer packages and converts them into structured deal summaries in the Side App; AI auto-tagging, which detects and places signature, initial and date fields across contract packages automatically; and Reporting with AI insights, which uses conversational AI layered over Side’s reporting engine so agents and team leaders can ask plain-language questions about performance, growth and lead trends getting real-time insights and recommendations.

“At Side, we don’t approach AI as a standalone or a hype feature. We are building core transaction workflows with it,” Ryan Smith, chief technology officer at Side, said in the announcement. “The result is a Side App that understands documents, automates agent’s tasks, interprets offers, anticipates compliance needs, and surfaces strategic insights in real time.”

Co-founder and CEO Guy Gal said integrating AI directly into the Side App is intended to compress hours of administrative work into “moments,” freeing agents to spend more time with clients and in their communities.

Side said the tools will help its partner firms operate with more predictability in a market where margins are narrowing and productivity per agent is closely watched. The company said that Side partners who participated in the beta program reported measurable workflow improvements.

“These new AI capabilities represent a major step forward in how Side supports agents and teams,” Jose Medina, co-founder of Chez Realty in Miami, Fla., said in a statement. “From contract preparation to offer analysis, compliance readiness, and business insights, the Side App eliminates the manual friction that slows transactions down.”

In 2025, Side closed 28,894 transaction sides totaling $25.77 billion in sales volume, earning the company the No. 12 and No. 9 ranks for sides and volume, respectively, in the 2026 RealTrends Verified Rankings.

This article was generated using HousingWire Automation and reviewed by a HousingWire editor before publication. The system helps convert company announcements and industry data into HousingWire-style news coverage.

This post was originally published on here

For Stuart Siegel, the conversation around brokerage growth starts with what it isn’t about.

“We focus on growth, not for growth sake,” Siegel said.

Instead of chasing market share or scale for headlines, Siegel said Engel & Völkers is prioritizing a more measured approach — one tied directly to the success of its franchisees.

“Market share, for me, is a function of what every one of our franchisees feels they need to achieve to be successful, not only in their market, but as business owners and operators,” he said.

That philosophy shapes how the company balances expansion with brand consistency. “It’s really an issue of understanding the balance between … headline growth, with growth that creates sustainable profitability, sustainable credibility and sustainable value to the brand,” Siegel said.

Seven brokerages affiliated with Engel & Völkers made the 2026 RealTrends Verified top brokerage list. Utah-based Engel & Völkers Gestalt Group was ranked No. 39 by sales volume.

Positioned to compete with consolidation

As consolidation accelerates across the brokerage landscape, most notably with the Compass/Anywhere acquisition, Siegel sees Engel & Völkers as a deliberate alternative. “We provide an alternative to consolidation,” he said.

Unlike competitors operating under multibrand portfolios, Siegel emphasized the company’s singular structure. “We’re a singular brand with a singular owner. … We’re not hedging against other brands that have come in as part of a consolidation,” he said.

That distinction, he argues, is increasingly resonating with agents and franchisees evaluating their options. “There are those who basically said, ‘I don’t need to be part of this bigger monolith,’” Siegel said.

Targeted global growth

The company’s expansion strategy reflects that same discipline, with growth concentrated in select international markets. “We have been having tremendous success in Mexico … tremendous success in Central America,” Siegel said, highlighting Panama, the Dominican Republic and Costa Rica as key areas of momentum.

Across regions, the focus remains consistent. “Choose your markets carefully, grow, choose who you grow with carefully and protect the overall quality integrity of the brand,” he said.

Consumer-first approach to industry change

Amid ongoing industry shifts — from lawsuits to portal competition and private listings — Siegel says the company is staying grounded in a simple principle: “Follow the needs of the consumer. If you do what’s in the consumer’s best interest, you will not fail,” he said.

That perspective informs his stance on listing strategies.

“Our job is not to sell real estate. Our job is to get it sold,” Siegel said. While acknowledging that some high-profile or unique properties may require a more limited approach, he made clear that broad exposure remains the default.

“Real estate sells through maximum exposure, full stop,” he said.

Reading the luxury market

Operating in the upper-tier segment, Engel & Völkers is seeing signals that extend beyond luxury into the broader housing market. “This is a market that defies prediction and defies definition,” Siegel said.

What stands out most, he added, is a shift in consumer psychology. “The biggest canary in the coal mine is this continually decreasing consumer confidence,” he said. Rather than focusing solely on rates or pricing, Siegel pointed to liquidity concerns as a key driver.

“That means I have to take $200,000 [out of the bank for a down payment] and $200,000 becomes illiquid the moment I close,” he said. “That’s what’s impacting the psychology of the market.”

At the high end, however, activity remains strong — particularly among ultra-wealthy buyers and sellers. “The number of $5 million-plus deals we’re doing [is] really responsible for the vitality of the company,” Siegel said.

Brand stability in uncertain times

Siegel attributes agent retention to a mix of local leadership and consistency at the brand level. “We’re not the bright, shiny object. We know who we are,” he said.

That clarity, he added, becomes even more important during periods of uncertainty. “In times of uncertainty, the consumer moves to brands they recognize,” Siegel said.

Over the next five years, Siegel expects a familiar cycle to play out as consolidation gives way to renewed competition. “After any kind of consolidation, the consolidation breeds competition again,” he said.

For brokerages looking to come out ahead, he pointed to a few defining traits. “The brokers who will win will be passionate, consumer-focused and maintain their brand integrity,” Siegel said.

For Engel & Völkers, that means staying the course. “We don’t aspire to be anything other than the best at selling real estate,” he said.

This post was originally published on here

Homebuilder confidence is now at its lowest level since September 2025 amid rising mortgage rates, economic uncertainty and shaky consumer confidence. 

The National Association of Home Builders (NAHB)/Wells Fargo Housing Market Index (HMI)’s builder confidence gauge remained negative in April, falling four points to a reading of 34. 

The drop in homebuilder confidence comes as builders near the apex of the spring selling season. Builders reported cautious optimism and “green shoots” during the International Builders Show in February, but the conflict with Iran appears to have stalled any momentum, at least for now. 

It’s not only about rising mortgage rates. Higher gas prices and fears over inflation pushed consumer confidence to a record low this month, according to a recent University of Michigan survey. 

Jackson Su, co-managing partner at Bridge Tower Properties and its subsidiary, Westfield Homes, said that his team had an active start to the year and is still seeing conversions and traffic. But rising mortgage rates over the past several weeks have impacted demand as many buyers take a wait-and-see approach. 

“A modest move in rates shows up immediately with buyer behavior and conversion, so that’s the hesitation point for commitment and conversion,” Su told HousingWire’s The Builder’s Daily. 

According to NAHB, current sales conditions fell four points, sales expectations for the next six months dropped seven points, and traffic from prospective buyers declined by three points.

The survey also found that 36% of builders cut prices in April, with an average price reduction of 5%, largely unchanged from prior months. About 60% of builders reported using sales incentives, representing the 13th consecutive month with a share of at least 60%. 

“The year started with hopes for housing momentum growth, but risks with respect to the Iran war, energy costs and declines for consumer confidence have slowed the market,” NAHB Chairman Bill Owens said in a statement. 

Additionally, the BTIG/HomeSphere monthly homebuilder survey of small and midsized homebuilders, released earlier this week, found that demand in March cooled after early-year gains in January and February. More builders reported year-over-year sales declines, consumer traffic ticked down and sales versus internal expectations weakened, the survey indicated.

But in a nation of more than 340 million people, not all markets are created equal. Ken Krivanec, president of Tri Pointe Homes’ Washington and Utah division, told The Builder’s Daily that Utah is performing markedly better than Washington right now. 

In Utah, a high-growth state that Tri Pointe entered less than three years ago, there is still strong demand, Krivanec said. But the Seattle market is more challenged, he explained, with affordability posing a big concern, and layoffs in the tech sector impacting the local economy and housing market. 

Another big issue in the Seattle market is the Trump administration’s homebuying restrictions on individuals with an H-1B visa. Last year, the administration began prohibiting H-1B visa holders from accessing mortgages insured by the Federal Housing Administration (FHA). This policy change has had a noticeable impact in the Seattle area, which has a high concentration of high-income workers with an H-1B visa. 

Tri Pointe’s more established move-up and luxury buyers aren’t immune to economic uncertainty or mortgage rate volatility either. 

“Affordability is a challenge in general. When you look at that, it is the interest rates, but then there’s the consumer confidence, which is something that in Seattle is lower than it is in Utah. And that’s because gas is over $5 a gallon,” Krivanec said. 

This post was originally published on here

The Agency and Realty ONE Group Excel have joined the growing number of real estate entities who have settled the homebuyer commission lawsuit claims via the Tuccori lawsuit opt-in settlement. 

The two firms informed Illinois-based Judge Georgia Alexakis, who is overseeing the Cwynar homebuyer commission lawsuit that they are both defendants in, of their decision to opt-in to the Tuccori settlement in a filing on Tuesday. In the filing they ask Judge Alexakis to stay proceedings in the Cwynar lawsuit pending the approval of their settlements in the Tuccori lawsuit. 

The financial terms of the settlements were not disclosed.

The window to opt-in to the Tuccori settlement closed earlier this week. The settlement is currently still waiting on final approval. 

Late last week, the National Association of Realtors (NAR) announced its decision to settle the homebuyers commission litigation through the opt-in function in the Tuccori settlement. In doing so, NAR joined several other firms including Anywhere Real Estate and Hanna Holdings. However, these settlements have not been without drama. Plaintiffs in the Batton suit, have been pushing back against defendants opting to settle these homebuyer commission lawsuit claims with the Tuccori plaintiffs. 

In March, these plaintiffs sought to block both Anywhere and Hanna Holdings from proceeding with their proposed settlements. 

These motions were denied, but the Batton plaintiffs have also sought to appoint the Tuccori plaintiffs’ attorneys as interim co-lead counsel in the Batton lawsuit. It remains to be seen if the Batton plaintiffs will also pushback against NAR’s choice to opt-in to the Tuccori settlement.

This post was originally published on here

Florida-based AD Mortgage released a study this week that compares the costs of renting and owning a home, with the analysis showing that home equity accumulation often pays more over time versus the alternative of renting and investing a potential down payment in the stock market.

The analysis compared typical city-level home values and rents using Zillow data. It also assumed the use of a standard 30-year fixed-rate mortgage at 6.11%, then projected outcomes over a 10-year period using state-level home price growth and an S&P 500 benchmark return of 10.35% compounded annually.

“Our goal with this study is to provide a clear, data-backed perspective on one of the most important financial decisions consumers face,” Max Slyusarchuk, CEO of AD Mortgage, said in a statement. “By analyzing long-term outcomes, we aim to support more informed conversations between borrowers and mortgage professionals.”

The lender’s study looked at the five most populous cities across all 50 states — 250 cities in total — using home value and rent price data as of March 17, 2026. It assumed that ongoing property taxes, homeowners insurance and maintenance would cost 2.5% of a home’s value annually.

Additionally, future home price growth was projected using the past 10 years of state-level price data from the Federal Housing Finance Agency. For renters, the study assumes any potential down payment was invested in the S&P 500. These total returns were compared to projected home equity accumulated after 10 years of homeownership to determine whether renting or buying was more profitable.

Homeownership was the more profitable choice in all 250 cities in the analysis when assuming a renter reinvested a potential down payment in stocks. And even when assuming a household reinvested both the down payment and any monthly savings from renting, homeownership came out ahead in 199 cities, or nearly 80% of the sample size.

Markets where homeownership wins

Many fast-growing markets in the Sun Belt show a large “equity advantage” for homeowners, even in locations where the monthly cost of owning exceeds that of renting, AD Mortgage found.

Miami topped this list as accumulated equity over 10 years was projected to top $1.043 million, largely tied to estimated home price growth of 149% over that period. The advantage of owning in Miami totals $509,451 after 10 years, even though the monthly cost of owning there ($3,981) is significantly higher than the cost of renting ($2,964).

Three other Florida cities were listed in the top five nationally in terms of having an equity advantage: St. Petersburg ($361,852), Tampa ($340,562) and Orlando ($317,027).

Idaho also ranked highly for owner profitability as Meridian was No. 3 nationally with an equity advantage of $349,590 after 10 years. And the other four cities in the Gem State that were analyzed — Boise, Nampa, Caldwell and Idaho Falls — each had equity advantages of at least $234,000.

Other major cities where homeownership paid off relative to renting included Las Vegas ($222,457 more than renter-investors), Charlotte ($123,308) and Seattle ($90,628).

These markets illustrate the study’s core point: Even when the monthly gap between owning and renting is large and results in negative cash flow for homeowners, long-term home equity growth can dominate the renter-investor path under the stated assumptions.

AD Mortgage also uncovered 26 cities where the monthly cost to own a home was less than renting. Detroit led the way as owning a typical home there costs $799 per month less than renting one. Other major markets that fell into this category include Cleveland ($556 per month less); Baltimore ($407); Birmingham, Alabama ($375); Philadelphia ($143); and Chicago ($125).

“These cities represent the strongest ownership case in the study: markets where buying does not require a monthly affordability sacrifice and still provides the long-term wealth-building benefits of leverage, appreciation, and principal paydown,” the study explained.

Markets where renting and investing wins

In a smaller set of cities — often high-cost or low-growth markets — the renter-investor path outperforms homeownership on a 10-year horizon.

In Los Angeles, for example, even as projected equity accumulation totals more than $1.15 million after 10 years, renters who invest their hypothetical down payment and monthly savings come out ahead by roughly $163,000.

Three other California cities — San Jose, San Diego and San Francisco — also saw long-term advantages for renters ranging from about $169,000 to $449,000.

AD Mortgage singled out low-cost markets in North Dakota where equity disadvantages of $105,000 to $160,000 emerge after 10 years, which are “driven by relatively modest projected price growth versus the assumed equity market returns.” Similar disadvantages for homeowners can also be found in higher-cost markets like Cambridge, Massachusetts; Pearl City, Hawaii; and Arlington, Virginia.

For real estate agents and mortgage loan officers, these markets underscore the importance of aligning home purchase decisions with buyer’s expected holding period, income volatility and risk tolerance, rather than assuming that homeownership will always dominate on a 10-year timeline.

The analysis mentioned multiple “assumptions and limitations” that should be taken into consideration, noting that “these are modeled outcomes under fixed assumptions, not personalized guidance.”

For example, the 6.11% mortgage rate and 10.35% compounded return for stocks that were used for analysis purposes are “static and backward-looking,” the study noted, and “actual results will vary with future rates and market returns.” Similarly, state-level home price appreciation data “may overstate or understate outcomes in individual neighborhoods.”

Full details of the 250 cities analyzed by AD Mortgage are available here.

This post was originally published on here

Mortgage lenders and servicers are facing strict new artificial intelligence (AI) and machine learning guidelines from the government-sponsored enterprises (GSEs) that industry attorneys warn will significantly impact daily operations.

The requirements apply well beyond obvious applications like underwriting engines or credit decisioning models. They extend across multiple business areas and stakeholder touchpoints, creating new liability for companies that fail to follow the rules, they said. 

Fannie Mae issued its AI and machine learning governance standards through a lender letter on April 8, with the rules taking effect in August, 120 days after publication. This follows Freddie Mac‘s own AI requirements that became effective March 3.

In the case of Freddie Mac, companies must implement companywide controls to map, measure and manage AI risks related to bias, security vulnerabilities and performance. Documented roles, responsibilities and escalation paths must support this framework. It applies to any usage, including vendor tools embedded in document processing, fraud detection, quality control, customer communications and other operational workflows.

“Freddie Mac raised the bar on how approved Seller/Servicers govern artificial intelligence and machine learning,” Troy Garris, co-managing partner at Garris Horn LLP, wrote in a blog post. “Section 1302.8 will move beyond basic policy requirements and into a clear expectation: approved mortgage companies must operate an auditable AI governance program.”

Garris advised mortgage leaders to inventory all AI tools across their enterprise. This inventory should document the business purpose, owner, and connection to origination or servicing activities for each tool.

Companies also need governance structures to determine which executive owns AI risk, monitor model performance, assess specific threats and prepare for audits.

“AI governance is not a future compliance project. It is a present-tense operational requirement,” James Brody, a founder and managing partner at Brody Gapp LLP, wrote in a newsletter to clients. 

Brody and his partner, Ron Gapp, wrote in a guide for the new framework that Freddie Mac takes a prescriptive approach by telling companies exactly what to build, while Fannie Mae relies on a principles-based standard.

Under Fannie Mae‘s framework, companies must ensure transparency for personnel with AI responsibilities, incorporate ethical AI characteristics and reflect legal requirements. Lenders must also calibrate risk management to their tolerance levels and designate an owner to review policies at least annually.

Lenders and servicers must also comply with Fannie Mae’s security and business resiliency supplement starting Aug. 12, 2025. This covers cybersecurity controls, 36-hour incident notification and business continuity. Companies must manage vendor AI risks and prepare to disclose their AI governance practices upon request.

Brody and Gapp pointed out that Fannie Mae omits specific requirements for segregation of duties, audits, AI security threats or audit trails — all of which Freddie Mac requires. Consequently, lenders that build to Freddie Mac’s stricter standard will likely satisfy Fannie Mae’s rules.

According to them, every mortgage company must be ready to produce an AI tool inventory, operational documentation, safeguard descriptions and governance records on demand.

This post was originally published on here

Southeast MLS Alliance has expanded its regional data-sharing network with the addition of realMLS, extending coverage into northeast Florida and increasing connectivity across the Southeast.

The alliance — which includes CHS Regional MLS in Charleston, South Carolina; Realtracs in Nashville, Tennessee; Canopy MLS in Charlotte, North Carolina; and Georgia MLS — now represents more than 118,000 subscribers across multiple metropolitan markets.

Leaders said the initiative is designed to provide agents and brokers with greater access to listing data across participating MLS systems, allowing for increased exposure of properties and more referral opportunities across state lines.

Nicole Jensen, CEO of realMLS, said expanding into Florida aligns with the organization’s focus on improving access to data and reducing friction for users.

“This opportunity for realMLS to join the Southeast MLS Alliance aligns with our commitment to transparency, efficiency and better outcomes for agents and the consumers they serve,” she said. “Expanded access to listing data across the Southeast, available directly within the realMLS platform supports our ongoing efforts to eliminate barriers and empower our customers with the information they need to succeed.”

CHS Regional MLS CEO Joseph Cullom said expanding the network increases value for participants across the system.

“The Southeast MLS Alliance was built on the idea that stronger regional connections lead to better outcomes for everyone in the transaction — agents, brokers, and consumers,” he said. “Adding realMLS and the Northeast Florida market to that network is a natural fit.

“Each addition to the Alliance expands the value of membership for every MLS and every professional already part of it.”

This article was generated using HousingWire Automation and reviewed by a HousingWire editor before publication. The system helps convert company announcements and industry data into HousingWire-style news coverage.

This post was originally published on here

The Lubbock Association of Realtors (LAR) is partnering with buy-side technology firm Gitcha to integrate its Buyer Listing Service platform into the association’s multiple listing service (MLS), according to an announcement on Monday. 

The trade group said this partnership gives more than 1,700 members the ability to publish standardized “want-listings” alongside traditional for-sale inventory. The integration will be available to all LAR members through the MLS.

Gitcha’s Buyer Listing Service (BLS) is designed as an MLS workflow tool that lets buyer agents convert active client needs into structured, shareable listings. Those “want-listings” become a new listing segment that sits next to conventional for-sale listings, giving listing agents visibility into real-time, unserved demand. Gitcha positions the tool as a way to standardize buyer representation, reinforce agent cooperation and improve market transparency.

“Agents have long shared buyer needs in private Facebook groups and informal networks, often leading to fragmented cooperation and the rise of exclusive private listing networks that undermine market transparency,” Cade Fowler, executive officer of LAR, said in the announcement. “By integrating Gitcha’s BLS into our MLS, we’re building stronger, direct connections among all of our agent members in a structured environment, empowering them to match buyers and sellers more efficiently while setting a standard for inclusive, data-driven practices.”

Gitcha CEO Dan Cooper said LAR’s leadership viewed the move as an opportunity to move beyond traditional saved-search tools for buyer agents. The company is marketing BLS as a way for MLS organizations to adapt to ongoing industry changes by explicitly documenting buyer-agent activity and value inside the MLS rather than in off-platform channels.

The BLS also ties into Gitcha’s public-facing portal, where licensed agents’ buyer want-listings are displayed in a searchable marketplace. That environment is designed to help surface demand to sellers, builders and investors, and to inform local planning decisions with current buyer-intent data, according to the announcement.

This article was generated using HousingWire Automation and reviewed by a HousingWire editor before publication. The system helps convert company announcements and industry data into HousingWire-style news coverage.

This post was originally published on here

Baby boomers remain the largest share of homebuyers in the U.S. — while first-time buyers have dropped to the lowest level on record, according to the National Association of Realtors (NAR).

Boomers accounted for 42% of all home purchases, unchanged from the prior year, according to the NAR 2026 Homebuyers and Sellers Generational Trends report.

Millennials made up 26% of buyers, down from 29%, while Gen X rose slightly to 25%. Gen Z and the Silent Generation each represented 4% of buyers.

At the same time, first-time buyers accounted for just 21% of all transactions — down from 24% a year earlier and the lowest level since the organization began tracking the data in 1981.

“The housing market remains sharply divided between homeowners with equity and first-time buyers trying to break in — many of whom are younger Millennials,” said NAR Deputy Chief Economist Jessica Lautz. “For many younger households, affordability challenges and limited inventory are still making homeownership difficult to achieve.”

Data takes home transactions into account that were completed between July 2024 and June 2025.

First-time buyers lose ground

The report showed a decline in first-time buyers across nearly all age groups.

Among younger Millennials, 60% were first-time buyers — down from 71% the previous year. Older Millennials also saw a decline, with 33% entering the market for the first time compared with 36% a year earlier.

Shares among older generations remained low. Just 8% of younger Boomers and 4% of older Boomers were first-time buyers, while the Silent Generation dropped to 3%.

Data reflects broader affordability challenges and higher mortgage rates that have made it more difficult for new buyers to enter the market.

Move-up buyers, multigenerational buying

While Millennials lost overall market share, older members of the generation are increasingly purchasing larger homes and leveraging accumulated equity.

Older Millennials reported the highest median household income among all buyer groups at $132,700. They also purchased the largest homes — with a median size of 2,100 square feet — and were less likely to be first-time buyers compared with their younger counterparts.

“Older Millennial buyers are now entering middle age, and with that comes a shift,” Lautz said. “This cohort is now the highest-earning generation of homebuyers, buys the largest homes and is most likely to have children living with them. Those traits were once more commonly associated with Gen X buyers, who are now increasingly looking toward empty-nesting and retirement.”

Multigenerational home purchases declined overall, accounting for 14% of all transactions and down from 17% the previous year.

The trend varied by age group. Younger and older Millennials increased their participation in multigenerational purchases, while Gen X, Boomers and the Silent Generation saw declines.

Common reasons for these purchases included caring for aging parents, reducing housing costs and accommodating adult children returning home.

Gen Z reshapes early homeownership trends

Gen Z buyers — though still a small share of the market — are beginning to influence homeownership patterns.

Among Gen Z buyers, 35% were single women, the highest share among all generations. Another 17% were unmarried couples, also the highest among age groups.

“What stands out about Gen Z is how confidently they’re beginning to define homeownership for themselves,” Lautz said. “They may still be a small share of the market, but they’re already challenging old assumptions about who buys a home and when.

“For many of these buyers, marriage and children are no longer the defining milestones before a home purchase. The driving force is simply the desire to own a home of their own.”

Boomers lead home sellers

Baby Boomers also dominated the selling side of the market, accounting for 55% of all home sellers.

Across all generations, sellers typically remained in their homes for a median of 11 years. Younger Millennials sold after about five years, while older Boomers stayed in their homes for roughly 15 years before selling.

“Baby Boomers are at a point in life when they have the flexibility to move, often with housing equity to help purchase their next home,” Lautz said. “In earlier years, Baby Boomers — like Millennials today — may have moved because of a job change or the need for a larger home.

“Today, many Baby Boomers are embracing choice and moving to be closer to friends and family, to downsize, or to retire and enjoy a work-free lifestyle.”

Agents remain central to transactions

Despite changes in buyer demographics, most transactions continue to involve real estate agents.

Among buyers, 88% purchased their home through an agent and 91% said they would use their agent again or recommend them to others.

On the selling side, 91% of sellers worked with an agent. Homes typically sold for a median of 99% of the final list price.

Older Millennials were the most likely to use an agent when selling, at 92%. Younger Millennial sellers were among the most likely to exceed asking price, with 19% selling for 101% to 110% of list price and 11% selling for more than 110%.

Jonathan Delozier reported and wrote this article with drafting assistance from HousingWire Automation, an editorial tool that helps transform announcements and industry data into HousingWire-style news coverage.

This post was originally published on here

Mortgage applications increased 1.8% from one week earlier, according to data from the Mortgage Bankers Association (MBA)’s weekly mortgage applications survey for the week ending April 10, 2026.

On an unadjusted basis, the index increased 2% compared with the previous week.

The refinance index increased 5% from the previous week and was 15% higher than the same week one year ago.

The seasonally adjusted purchase index, meanwhile, decreased 1% from one week earlier. The unadjusted purchase index was unchanged compared with the previous week and was 3% lower than the same week one year ago.

“Given the evolving situation in the Middle East and its impact on energy and commodity prices, mortgage rates declined last week. The 30-year fixed rate decreased to 6.42%, its lowest level in a month,” said Joel Kan, MBA’s vice president and deputy chief economist.

“This dip in rates helped to support an increase in conventional refinance applications, which had declined for five consecutive weeks. Purchase activity remained subdued as potential homebuyers remained hesitant given the current economic uncertainty, which kept purchase applications below last year’s level for the second consecutive week. Conventional purchase applications were essentially unchanged over the week, while FHA and VA purchase applications declined.”

The refinance share of mortgage activity increased to 45.5% of total applications from 44.3% the previous week. The adjustable-rate mortgage (ARM) share of activity decreased to 8.4% of total applications.

By product, the Federal Housing Administration (FHA) share of total applications decreased to 18.2% from 19.3% the week prior, the U.S. Department of Veterans Affairs (VA) share of total applications decreased to 15.7% from 16.1% the week prior, and the U.S. Department of Agriculture (USDA) share of total applications remained unchanged at 0.5%.

The average contract interest rate for 30-year fixed-rate mortgages with conforming loan balances decreased to 6.42% from 6.51%, and rates for 30-year fixed-rate mortgages with jumbo loan balances decreased to 6.48% from 6.54%.

The average contract interest rate for 30-year fixed-rate mortgages backed by the FHA decreased to 6.14% from 6.22% and rates for 15-year fixed-rate mortgages decreased to 5.85% from 5.90%. The average contract interest rate for 5/1 ARMs increased to 5.63% from 5.60%.

Xactus Mortgage Intent Index

Xactus‘s Mortgage Intent Index — which analyzes aggregated, anonymized credit-pull activity across the Xactus Intelligent Verification Platform — increased week over week by 1.52% to a reading of 140.4. That’s up from last week’s 138.3 reading.

“Intent volumes continue to show a high degree of sensitivity to the rate environment,” said Thomas Lloyd, chief strategy officer for Xactus. “The Xactus Mortgage Intent Index increased approximately 1.5% week over week as mortgage rates eased modestly, reflecting how quickly borrower activity responds to even small rate movements.

visualization

Lloyd said that even though rates are below levels from a year ago, intent is still down “roughly 5.5% compared to the same week last year — marking the fourth consecutive week of year-over-year declines.”

He continued, “In the near term, overall market dynamics will remain closely tied to mortgage interest rate movements.”

This post was originally published on here

Lamacchia Realty has acquired Somerset, Mass.-based Rosewood Realty and its affiliated Rosewood Real Estate School, expanding the brokerage’s footprint and training platform in Bristol County and across Massachusetts, the company announced Monday.

The deal brings Rosewood’s brokerage operation and its real estate licensing school under the Lamacchia Companies umbrella, while Rosewood broker-owner Eric Alberto and 16 agents will join Lamacchia’s Fall River office, according to the announcement.

Rosewood Realty, founded in 2013, has built a presence in Bristol County around community ties, education and a client-first model. Alberto started his real estate career in 2004, became a broker in 2007, and previously worked with Century 21 Anchor and at his own firm, Eric Alberto Realty, before launching Rosewood.

This acquisition deepens Lamacchia Realty’s coverage of Massachusetts’ south coast, adding Rosewood’s Somerset-based team to Lamacchia’s existing Bristol County offices in Easton, Fall River and New Bedford, as well as its East Providence, Rhode Island, location.

In 2025, Lamacchia Realty recorded 5,944 transaction sides, totalling $3.27 billion in sales volume earning it the No. 68 and No. 79 ranks in the nation for sides and volume, respectively, in the 2026 RealTrends Verified Rankings.

“I’m excited to have Rosewood Realty join Lamacchia Realty. Eric has built a great company, and we are thrilled to welcome him and his [real estate professionals],” Jackie Louh, Lamacchia Realty’s chief operating officer, said in the announcement. “We now have a real estate school, with Eric at the forefront of that — we now have an even bigger opportunity to invest in agents at every stage of their careers.”

Alberto said the move will give his agents more tools and support while aligning with his focus on education.

“I couldn’t be more excited to join forces with Anthony and his team at Lamacchia Realty,” Alberto said. “The tools, systems and technology they provide are second to none and will put our agents in a position to grow, succeed and most importantly, better serve their clients. Their dedication to educating agents aligns perfectly with our mission through Rosewood Real Estate School.”

In addition to the brokerage, the acquisition also includes Rosewood Real Estate School, founded in 2019. The school, which offers pre-licensing and continuing education courses, will now operate within Crush It In Real Estate, the training brand owned by Lamacchia Companies.

Alberto will retain an ownership stake in the school and remain its head teacher. Lamacchia Companies plans to expand the school’s reach by adding virtual classes and on-demand video coursework modeled on the Crush It In Real Estate training program that Lamacchia launched more than a decade ago.

By the end of summer 2026, the licensing courses led by Alberto are expected to be available across Massachusetts, according to the announcement.

Lamacchia Companies owner Anthony Lamacchia said having an in-house real estate school is a strategic step for agent recruitment and development.

“There is no doubt that we are all stronger working together than apart,” Lamacchia said. “We will not only grow it in this region but also across Massachusetts and likely beyond.”

Part of a broader acquisition strategy

The Rosewood deal marks Lamacchia Realty’s 14th acquisition in New England in about two and a half years as the company pursues scale across the Northeast and in select Sun Belt markets. Earlier this month, the firm announced its acquisition of Weichert RealtorsBriotti Group, expanding its Connecticut presence with new offices in Waterbury and Wolcott. 

The company said it is also working on acquisitions in South Florida, signaling the growth of its Florida operation. 

The company said it will be “business as usual” for existing Rosewood clients after the acquisition. All current listings and pending sales are expected to continue without interruption, and Lamacchia plans to roll out its lead-generation tools, services, technology and training to the former Rosewood agents in the coming weeks.

This article was written by Brooklee Han and generated with the assistance of HousingWire Automation. It was reviewed by a HousingWire editor before publication. The system helps convert company announcements and industry data into HousingWire-style news coverage.

This post was originally published on here

Bronx residents will have easier access to the New York Botanical Garden thanks to a new pedestrian access ramp that opened Monday. The $4 million project transformed the pedestrian overpass over the Bronx River Parkway, long plagued by safety and accessibility issues, into a fully ADA-compliant ramp with handrails, landings, and stairs. The new walkway ensures visitors of all ages and abilities can safely access the garden.

“Every New Yorker deserves equal access to the incredible green spaces our city has to offer, and this project delivers exactly that,” NYC Parks Commissioner Tricia Shimamura said.

“The new ADA-compliant ramp at Bronx Park East removes a long-standing barrier between local residents and one of the world’s great botanical gardens, making travel safer and more welcoming for seniors, families with young children, and people of all abilities.”

Backed by $4 million in City Council funding, design work on the project began in June 2022. Procurement started in July 2023, with an initial estimated completion date of July 2024, though the phase was not completed until February 2025. Construction began last March.

The finished project was designed to weave around the area’s existing trees, featuring an accessible ramp system with ADA-compliant grading, handrails on both sides, and intermittent landings that allow visitors to rest and safely traverse the overpass in all weather conditions and regardless of physical ability.

“This investment is about making sure every Bronx resident can fully experience the spaces that make our borough special. The new ADA-accessible ramp at Bronx Park East removes long-standing barriers and creates a safer, more welcoming connection to New York Botanical Garden for seniors, families, and individuals with disabilities alike,” Council Member Kevin C. Riley said. 

“By prioritizing accessibility and thoughtful design, we are expanding opportunity and ensuring our public spaces reflect the needs of the entire community.”

RELATED:

The post NYC opens accessible pedestrian ramp connecting Bronx Park and New York Botanical Garden first appeared on 6sqft.

This post was originally published here

This April 15 marks the first Tax Day under the One Big Beautiful Bill Act (OBBBA). Signed into law on July 4, 2025, this landmark legislation introduces significant benefits for the commercial real estate sector. NAIOP was a strong advocate for the commercial real estate industry during the negotiation of OBBBA and has continued to engage with the Treasury Department and the Internal Revenue Service (IRS) as regulations to implement provisions important to NAIOP members have been promulgated.

Below are summaries of these key provisions and the strategic efforts undertaken by NAIOP’s government affairs team to ensure our members can fully leverage them.

Permanent 100% Bonus Depreciation: Perhaps the most impactful provision of the new law is the permanent extension of 100% bonus depreciation for assets placed into service after Jan. 19, 2025. By allowing businesses to deduct the full cost of qualifying assets in the year they are put into service, this policy provides the long-term certainty necessary for strategic investment. This permanent extension creates a powerful incentive for owners to modernize facilities, automate production and reinvest in critical equipment, aligning tax strategy with immediate operational needs.

Navigating Section 163(j)(7) and New IRS Guidance: The transition from the Tax Cuts and Jobs Act of 2017 (TCJA) to the OBBBA created a technical hurdle for many in the industry. Under the TCJA, real property trades or businesses (RPTOB) were often forced to make irrevocable elections to either take bonus depreciation or avoid stricter limits on business interest deductions.

To address this, the IRS recently issued Revenue Procedure 2026-17. This guidance is essential for taxpayers who made an RPTOB election under Section 163(j)(7) prior to Jan. 20, 2025. It allows businesses to retroactively withdraw elections made for the 2022, 2023 or 2024 tax years, effectively unlocking the ability to benefit from the updated bonus depreciation provisions.

NAIOP’s Advocacy in Action: The availability of this retroactive relief is a direct result of NAIOP’s advocacy:

  • In February, NAIOP President and CEO Marc Selvitelli sent a  letter to Treasury Secretary Scott Bessent, urging expedited action to provide the clarifications real estate businesses needed before this year’s filing deadline.
  • NAIOP members and staff also engaged directly with the House Ways and Means Committee to communicate the urgency of this issue to the Treasury Department.

Without this specific IRS guidance – which NAIOP and our industry allies worked to secure – many real estate businesses would have remained locked into prior elections, unable to access the full suite of benefits offered by the OBBBA.

Additional Real Estate Tax Benefits

Section 199A (Pass-Through Deduction): The new law permanently extends the 20% deduction for pass-through business income and REIT dividends. This creates better parity between pass-through owners (effective rate of 29.6%) and corporations (21%).

Taxable REIT Subsidiary (TRS) Test: To increase operational flexibility, the allowable percentage of REIT assets held in a TRS will increase from 20% to 25% for tax years beginning after Dec. 31, 2025.

Business Interest Expense Limitation: For tax years beginning after Dec. 31, 2024, the calculation for the interest expense limitation is permanently shifted to EBITDA (Earnings before interest, taxes, depreciation and amortization). By allowing the add-back of depreciation and amortization, businesses gain significant borrowing flexibility.

Excess Business Losses: The law permanently extends the disallowance of deductions for excess business losses. The $250,000 threshold is now indexed for inflation, and excess losses will continue to be treated as net operating loss (NOL) carryovers.

Factory Expensing: Owners of qualified production property can now expense 100% of costs if construction begins between Jan. 19, 2025, and Jan. 1, 2029, and the property is placed in service before Jan. 1, 2031.

  • Note: This applies only to owner-occupied nonresidential buildings used for manufacturing, production, or refining.

Condominium Construction: Developers are now granted an exception to the “percentage of completion” accounting method for certain residential contracts. The construction contract period has been extended from two to three years, effectively eliminating “phantom income” issues previously faced by condo developers.

Community and Housing Incentives

Opportunity Zones (OZ): A permanent OZ policy has been established with rolling 10-year designations starting Jan. 1, 2027. While it maintains the original TCJA process, it tightens eligibility by updating “Low-Income Community” (LIC) definitions and removing the “contiguous tract” loophole.

New Markets Tax Credit (NMTC): Originally set to expire at the end of 2025, the NMTC is now permanently extended, providing long-term certainty for urban and rural subsidy planning.

Low-Income Housing Tax Credit (LIHTC): Starting in 2026, the legislation permanently increases state credit allocations by 12% and lowers the bond-financing threshold to 25%, aimed at revitalizing developer interest in affordable housing.

Clean Energy Incentives

While many Inflation Reduction Act incentives have been scaled back, the following remain active under specific timelines:

Incentive Requirement / Deadline
Wind and Solar (48E) Must start construction within 12 months of July 4, 2025; placed in service by Dec. 31, 2027.
Commercial Buildings (179D) Expanded deduction available for projects starting construction by June 30, 2026.
Energy Efficient Homes (45L) Credits expire for homes acquired after June 30, 2026.

Adaptive Reuse

The bipartisan Revitalizing Downtowns and Main Streets Act (H.R. 2410), introduced by Representatives Mike Carey (R-OH) and Jimmy Gomez (D-CA), remains a top priority for NAIOP’s government affairs team. This legislation would create a tax incentive to offset the costs of converting commercial properties into residential units, providing communities with a vital tool to increase the rental housing supply.

Congress returned to Washington this week, with hopes of getting an agreement to resolve the funding standoff for the Department of Homeland Security. Republican congressional leaders and the White House are proposing another reconciliation package to circumvent the Democratic filibuster in the Senate. 

While there is uncertainty about the path ahead, reconciliation could potentially create a legislative vehicle for the inclusion of tax provisions, and NAIOP’s government affairs team will work with members of both the House and Senate to advocate to have adaptive reuse included in that legislation. 

This post was originally published here

As Americans file their taxes this week, many are seeing firsthand how housing policy shapes their financial future.

For homeowners, prospective buyers and real estate professionals, this year’s returns reflect the real impact of last year’s tax reform legislation, the One Big Beautiful Bill Act. The takeaway is straightforward. Pro-growth tax policy is delivering results.

That did not happen by accident.

The Trump administration, working with leaders in Congress, made a deliberate decision to prioritize economic growth, small business stability and homeownership. Those choices are now showing up in tangible ways as many Americans are seeing lower tax bills and higher refunds.

Before leading advocacy at the National Association of Realtors, I worked on financial services policy in Congress and at the U.S. Department of the Treasury. I saw how decisions made in Washington translate into outcomes for families and businesses. Today, representing more than a million Realtors, I see those outcomes playing out across housing markets nationwide.

This tax day, the benefits are clear

Homeowners are seeing the continued value of the mortgage interest deduction, which helps make homeownership more attainable and sustainable.

Small business owners, including most real estate professionals, are benefiting from a strengthened and permanent qualified business income deduction.  This big benefit allows them to reinvest in their businesses and their communities.

Families in high-cost states are seeing relief from an increased SALT deduction cap, helping ease their overall tax burden and making homeownership more feasible.

Long-standing tools like 1031 exchanges remain in place, continuing to support property investment, housing turnover and the supply needed to meet demand.

These are not abstract policy ideas. They are real savings and real incentives showing up in tax filings across the country.

They are also the result of sustained advocacy. Realtors have worked with policymakers on both sides of the aisle to protect pro-housing provisions and push for reforms that reflect today’s market. This law builds on that work and delivers one of the most meaningful tax outcomes for real estate in years.

At a time when affordability remains a challenge and the nation continues to face housing supply and inventory shortages, policy certainty matters. It gives buyers confidence, supports investment and helps keep the housing market moving.

Recent NAR polling highlights strong voter support for targeted tax solutions, with 84% backing tax-free savings for down payments, 76% supporting a one-time home sale with no capital gains taxes and majorities favoring expanded capital gains relief and incentives to boost housing supply.

There is more work ahead. Expanding supply and unlocking inventory will require continued focus and smart policymaking.

But this tax day offers a moment to recognize what is working.

When policymakers prioritize housing, support small businesses and focus on long-term growth, the benefits show up where they matter most. In communities, in markets and in the financial futures of American families.

Shannon McGahn is the first female Chief Advocacy Officer for the National Association of REALTORS with an extensive background in financial services and housing policy.

This column does not necessarily reflect the opinion of HousingWire’s editorial department and its owners. To contact the editor responsible for this piece: tracey@hwmedia.com

This post was originally published on here

A wave of ultra-luxury deals made coastal Florida the center of America’s priciest home sales in March. Other notable sales include Tom Cruise’s former Beverly Hills estate and a Tennessee ranch. 

Mark Zuckerberg and Priscilla Chan bought 7 Indian Creek Island Road, a waterfront estate on a Miami island known as the “Billionaire Bunker,” for $170 million in March. That was far and away the most expensive home sale in the U.S. last month, and it was also the most expensive home ever sold in Miami-Dade County. 

Coastal Florida is also home to the second-priciest sale of March, a modern mansion in Manalapan. A Beverly Hills compound previously owned by Tom Cruise rounds out the top three, bringing in $47 million. 

All in all, seven of March’s 10 most expensive home sales were in coastal Florida, which has  become a magnet for ultra-wealthy Americans, partly because it has no state income tax. Outside of the Sunshine State, two of last month’s priciest sales were in California, and one was a Tennessee ranch. 

All 10 sold for more than $30 million. 

These are the most expensive U.S. home sales of March:

  1. 7 Indian Creek Island Rd., Indian Creek, FL 33154: Sold for $170 million
  2. 1460 Ocean Blvd., Manalapan, FL 33462: Sold for $51.2 million
  3. 1111 Calle Vista Dr., Beverly Hills, 90210: Sold for $47 million 
  4. 9111 Collins Ave. Unit N-PH6, Surfside, FL 33154: Sold for $44 million 
  5. 870 S. Ocean Blvd., Palm Beach, FL 33480: Sold for $37.1 million 
  6. 160 Clarendon Ave., Palm Beach, FL 33480: Sold for $36 million 
  7. 998 Dickinson Ln., Franklin, TN 37069: Sold for $35 million 
  8. 6480 Allison Rd., Miami Beach, FL 33141: Sold for $33.3 million 
  9. 190 Almendral Ave., Atherton, CA 94027: Sold for $32.5 million 
  10. 387 Ocean Blvd., Golden Beach, FL 33160: Sold for $32.5 million 

And these are the most expensive U.S. home sales of 2026 so far:

  1. 7 Indian Creek Island Rd., Indian Creek, FL 33154: Sold for $170 million in March
  2. 1940 S. Ocean Blvd., Manalapan, FL 33462: Sold for $68.3 million in February
  3. 70 Vestry St Unit PHS, New York City, NY 10013: Sold for $57 million in February 
  4. 8 E. 62nd St., New York City, NY 10065: Sold for $55 million in February
  5. 4296 Cutlass Ln., Naples, FL 34102: Sold for $55 million in January
  6. 432 Park Ave., 78th Floor, New York City, NY 10022: Sold for $52.5 million in February 
  7. 1460 Ocean Blvd., Manalapan, FL 33462: Sold for $51.2 million in March 
  8. 1111 Calle Vista Dr., Beverly Hills, 90210: Sold for $47 million in March 
  9. 36 E. 63rd St., New York City, NY 10065: Sold for $46.8 million in February 
  10. 919 Lakeshore Blvd., Incline Village, CA 89451: Sold for $46 million in February 

The post A Billionaire Beach Party: Mark Zuckerberg’s $170 Million Florida Purchase Tops March’s Most Expensive Home Sales appeared first on Redfin Real Estate News.

This post was originally published here

  • 7% of American workers are canceling plans to make a major purchase, such as buying a home or car, due to their feelings about job security, according to a Redfin survey. Close to one-third (30%) are delaying these major purchase plans.
  • 16% say they have already made a major purchase sooner than expected due to job security concerns. Another 17% say they will make a purchase earlier than originally planned for the same reason.
  • 69% of workers are confident about their job security, while 27% are concerned. 
  • Among workers who are concerned about their job security, company performance (29%) and the impact of artificial intelligence (18%) are the top-cited reasons.
  • 15% of workers have been late to make a rent or mortgage payment or missed a rent or mortgage payment entirely in the past three months.

More than one in three (36%) American workers are delaying or canceling a major purchase like a home or car due to their feelings about job security. On the flip side,  31% have either already made a major purchase sooner than expected, or plan to due to their feelings about job security.

That’s according to a Redfin survey conducted by Ipsos between March 9-10, 2026.  The nationally representative survey was fielded to 1,005 U.S. residents, including 452 who are employed full-time and 112 who are employed part-time. The results for the combined group of workers have a credibility interval of +/- 5.1 percentage points.

More than one in three  (36%) of respondents say their feelings about job security have no impact on their timeline for any major purchase decisions. 

In August 2025, when we asked the same question to American workers, 42% said they were delaying or canceling plans to make a major purchase due to feelings about job security, six percentage points higher than today. However, the shares who said in August that they had already made (or planned to make) a major purchase sooner than expected (29%) is largely unchanged from today—as is the share who said they had made no changes to their plans (32%).

Most American Workers Are Confident About Job Security


Roughly two-thirds (69%) of workers say they are either somewhat confident or very confident about their job security—a similar share (66%) said the same last August.

In comparison, 27% now say they are either somewhat concerned or very concerned about their job security.

Nearly One in Three Workers More Concerned About Job Security Now Than Six Months Ago


Roughly one-third (32%) of workers are more concerned about their job security than six months ago. In comparison, 18% are more confident about their job security.


When we asked the same question in August 2025, 37% of workers said they were more concerned about their job security today than six months ago, while 21% said they were more confident. 

Company Performance and AI Are Top Reasons for Job Insecurity


Roughly three in ten  (29%) workers who are concerned about their job security cited their company’s performance as the primary reason; a near-equal share (32%) said the same in August 2025.

 Currently, the next most-cited reason for job security concerns is the impact of artificial intelligence (18%), followed by government restructuring efforts (14%) and personal performance (12%). 

Nearly 20% of Workers Have Recently Missed Rent, Mortgage Payment or Paid Late


Seven percent of workers say they have missed a rent or mortgage payment entirely in the last three months, and another 10% say they have been late on a housing payment. 

These shares were notably higher among those who are concerned about their job security. Nearly three in 10 members of this group (28%) have missed or been late on a recent housing payment. An overwhelming majority (70%) of workers who are confident in their job security have made all recent housing payments on time.

Roughly one in seven (15%) workers say they are “very” or “somewhat” likely to be late on their mortgage or rent in the next three months. Thirteen percent say they are “very” or “somewhat” likely to miss a housing payment entirely in the next three months.

A Slim Majority of American Workers Have an Emergency Fund for Housing Payments


Most (55%) workers say they have an emergency fund to cover their monthly rent or mortgage payments if they face a financial crisis, while approximately one-third (34%) do not have such a fund. 

These figures vary slightly among workers who expressed concern about their job security and those who are confident; the former are slightly less likely to have a housing emergency fund (50%), while the latter are slightly more (59%).

When asked how many months of housing payments their emergency funds cover, one in five workers with one say six months. Three months (16%) was the next most-selected time frame.


Methodology

This report is based  on a Redfin survey conducted in partnership with Ipsos between March 9-10, 2026.  The nationally representative survey was fielded to 1,005 U.S. residents, including 452 who are employed full-time and 112 who are employed part-time. The results for the combined group of workers have a credibility interval of +/- 5.1 percentage points.

The post Over One-Third of American Workers Are Delaying or Canceling Major Purchases Due to Job Security Concerns appeared first on Redfin Real Estate News.

This post was originally published here

Culture isn’t something you define once. It’s something you prove every day through what you reward, what you allow, and what you model when no one’s watching.

That distinction matters because most organizations treat culture as a document. They write the values, post them on the wall, and move on. But if culture only exists in a values deck, it doesn’t exist at all. What leaders consistently demonstrate becomes the standard. What they tolerate becomes the norm.

At our organization, we talk about being both a “coach and a player.” That’s not a metaphor, it’s a job description. Leadership isn’t about setting expectations from a distance. It’s about embodying them in real time, especially under pressure, especially when it’s inconvenient.

Hiring is where culture gets tested

Once a leadership standard exists, hiring is where it either holds or quietly erodes.

Most organizations underestimate hiring or treat it as transactional. Building a strong organization requires more than comfort. It requires intentionality. Before you can hire for culture fit, you have to be able to articulate what your culture actually is.

And culture fit isn’t assessed through a single answer. It’s revealed through patterns.

I pay close attention to how candidates talk about their past. Do they take accountability, or do they default to blame? Strong candidates say “I,” not “they.” If everything was someone else’s fault before, it will be again. I also listen to how they talk about previous teams, even difficult ones. How someone speaks about their last team is how they’ll speak about yours.

The questions candidates ask often tell you more than their answers. Strong candidates want to know how decisions get made, how success is measured, and how feedback flows. That curiosity (paired with self-awareness and honesty about both strengths and gaps) is one of the clearest signals of coachability. You learn the most when the script runs out.

Here’s the piece most hiring managers miss: you’re not just evaluating candidates. They’re evaluating you. Every interview is a cultural artifact. It either reinforces what you say you stand for or quietly contradicts it. Even candidates you don’t hire should leave wanting to work for your organization. The interview process is not just an evaluation; it’s a reflection.

You’re not hiring talent. You’re deciding what behaviors you’re willing to scale.

Culture lives in the moments you don’t plan for

Strategy sessions don’t build culture. Neither do values workshops or all-hands decks.

Culture is built in the moments that are easy to overlook: how feedback gets delivered when something goes wrong, how accountability is handled when it’s uncomfortable, how decisions get made under pressure. These repeated behaviors define what a culture actually is.

Feedback is one of the clearest tests. In strong organizations, it’s timely, direct, and rooted in respect. It doesn’t wait for formal reviews. When feedback is handled well, it creates clarity and builds trust. When it’s avoided or rendered useless, it creates confusion and erodes confidence over time. How leaders give and receive feedback shapes how it shows up everywhere else.

The smaller moments matter too. Team lunches, happy hours, or something as simple as a cross-state Secret Santa may seem small, but they create connection. Especially in a distributed organization, these moments help bridge gaps, build relationships, and reinforce that every individual is part of something bigger. Over time, these small investments build trust, strengthen psychological safety and create a culture people genuinely experience.

Culture isn’t a question of whether your organization has one. Every organization does. The only question is whether you’re shaping it with intention or letting it form by default.

Jamie Bridges is Director of People Operations at HousingWire.
This column does not necessarily reflect the opinion of HousingWire’s editorial department and its owners. To contact the editor responsible for this piece: zeb@hwmedia.com.

This post was originally published on here

As interest rates remain elevated compared to historic, pandemic-era lows, many homeowners are rethinking how to access cash without giving up the favorable rates they locked in just a few years ago. For originators, that shift is creating a clear opportunity. Demand for home equity lines of credit (HELOCs) is gaining momentum, as borrowers seek flexible ways to tap into home equity while keeping their existing first mortgages in place.

In today’s market, HELOCs have evolved from a secondary product into a primary revenue driver for originators. From consolidating higher-interest debt to funding renovations and investment opportunities, borrowers are turning to home equity to support longer-term financial goals. 

To better understand how these trends are taking shape in practice, I spoke with Fredrik Megerdichian, President of Icon Mortgage. Together, we explored borrower demand, how HELOCs are being integrated into product strategies, and the overall outlook for activity through 2026.

What’s driving HELOC demand today

The fundamental driver of the HELOC trend is simple: interest rates and record-breaking home equity. With millions of Americans locked into mortgage rates below 4%, refinancing can be a tough sell. Simultaneously, homeowners today hold nearly $35 trillion in total home equity and roughly  $11 trillion in tappable home equity — a staggering figure that represents a level of financial security they’ve never had before.  

For originators, that dynamic is showing up in the types of conversations they’re having with clients, as more borrowers look for ways to access cash without giving up their existing first mortgages. Megerdichian noted that much of that demand is tied to borrowers looking to consolidate higher-interest debt, often using home equity to lower monthly payments and manage more expensive obligations.

At the same time, borrowers are expanding how they use home equity, creating more opportunities for originators to support both near-term needs and longer-term goals. Megerdichian observed this trend toward expansion: “We are seeing a tremendous amount of interest from borrowers to buy more property using those funds and to also renovate,” highlighting how these products are being used as proactive financial tools. In some cases, that extends to major life expenses as well, as borrowers may use home equity to cover large costs that might otherwise require higher-cost financing.

Where HELOCs fit in today’s originator toolkit

For originators, this isn’t a signal to wait for the market to “return” to old patterns. Instead, it’s an invitation to master a different set of tools. As borrower needs continue to shift, HELOCs are providing originators greater flexibility to broaden their offerings and meet a wider range of clients. Rather than relying solely on traditional refinancing, many are using HELOCs to expand their product mix and stay engaged with clients when markets may otherwise be quiet. 

What stands out in practice is how consistently these products are coming up in day-to-day activity. Megerdichian noted that this flexibility is resonating with borrowers and driving consistent interest. “Second liens have become very big part of our everyday transactions,” he said, adding that “every day there’s a call inquiry about these things.”

That steady interest also helps originators address needs that do not always fit neatly within traditional lending standards. HELOCs can be a strong fit for self-employed borrowers, entrepreneurs, and others with more complex financial profiles. When paired with non-QM solutions, they can help expand access to capital for borrowers who may not qualify through traditional banks.

Outlook for HELOC activity through 2026

As we look toward the next 6 to 12 months, the outlook for HELOC activity remains steady, even amid ongoing rate uncertainty. That shift also creates new opportunities for originators to reconnect with past clients and reintroduce lending solutions that may not have made sense in a higher-rate environment.

Megerdichian expects that demand to hold, regardless of marginal rate fluctuations. “If rates do drop, I think it will spark even more demand to borrow,” he explained. Lower rates would decrease the cost of the “draw” on a HELOC, making it even more appealing for homeowners to pull the trigger on those delayed renovations or property investments.

The consensus among industry leaders is that we have moved past the era where the HELOC was a “secondary” or “emergency” option. It has transitioned into a cornerstone of the modern lending landscape, likely to remain a dominant force through 2026 and beyond.

Leading with Value

The rise of the HELOC is a sign of a maturing, equity-rich housing market. Homeowners are no longer looking for the simplest way to get a lower rate; they are looking for the smartest way to manage their total household wealth.

For originators, the opportunity lies in education and proactive outreach. By utilizing second-lien options and non-QM flexibility, you are positioning yourself as a vital resource in a complex economy. The $11 trillion in equity is a massive opportunity, but it requires an originator who knows how to unlock it. Those who embrace this shift today will lead the market tomorrow.

Tom Hutchens is the President of Angel Oak Mortgage Solutions.
This column does not necessarily reflect the opinion of HousingWire’s editorial department and its owners. To contact the editor responsible for this piece: zeb@hwmedia.com.

This post was originally published on here

The American Dream has a math problem. Millions can’t afford homes. Those who can, can’t find them. And many who already own don’t have enough saved to retire. It’s gridlock, compounding and dangerous enough to stifle homeownership as a pathway to stability, wealth creation, and retirement longevity. There’s been no shortage of possible fixes suggested, but they’ve largely existed in silos depending on who’s proposing them. Nothing systemic has materialized. 

What’s needed is a framework spanning the entire ecosystem: housing inventory, buyer access, mortgage structure, lending standards, capital markets, tax policy.

Every element is reliant on the other, which makes implementation incredibly difficult and, perhaps for that reason, more likely to actually work. Of course, some aspects will require deeper policy and legal analysis to validate before it can be implemented, tested, and scaled. 

Where it starts: The lock-in 

Homeowners locked into generationally low pandemic-era rates have no financial reason to move regardless of life circumstances. FHFA‘s National Mortgage Database shows that as of Q4 2025, about 50% of outstanding mortgages carry a rate below 4% with nearly 20% below 3%. Many homeowners also sit on significant equity appreciation that would generate capital gains taxes above existing exclusion thresholds if they sold. For those at/near retirement, both locks are compounded by a third: their home is their primary retirement asset, and current policy makes it nearly impossible to convert it into retirement savings without a severe tax event. 

Here’s what an interdependent framework could look like: 

The trigger: Rate portability & capital gains waiver 

Homeowners can choose one of two options for a predetermined period of time: Option A: sell their home and port the existing rate to the next purchase; Option B: sell their home with capital gains above the existing exclusion waived up to a defined percentage of the sale price, accepting the prevailing interest rate on the next purchase or buying in cash. 

Homeowners will have 120 days to transact before the window expires. If they fail to sell during that time, there’s a 120 day penalty period before the process can be restarted. 

Retirement-age incentives 

Option A Incentive: The window to port an existing rate to the next home purchase extends to 180 days, giving homeowners more time to sell.

Option B Incentive: Sellers receive a higher capital gains waiver, and if those gains are deposited into a qualified retirement account they receive additional favorable tax treatment to convert housing equity into retirement savings without penalty. This acknowledges the reality that a generation of Americans treated their home as their retirement plan and creates a mechanism to actually execute that plan. 

For retirement-age sellers who still carry a mortgage and are purchasing their next home in cash, a third path exists: assumability. Rather than surrendering their existing low rate at closing, they can leave it with the property and allow the buyer to assume it. The buyer inherits the rate and bridges the gap to the purchase price with a second mortgage or cash. For anyone priced out at current rates, stepping into a 2.8% mortgage is a meaningful advantage. Fannie Mae and Freddie Mac notes are technically assumable today, but the policy framework to make it a standard option is what’s missing.

The Self-Sorting Mechanism 

Tranche 1 (Rate Portability): Sellers whose primary barrier is monthly payment shock. Trading a 2.8% rate for a 6% rate is financially prohibitive, so portability is their path forward.

Tranche 2 (Capital Gains Waiver): Sellers sitting on significant appreciation where the capital gains tax hit is the barrier to selling will likely take the waiver. Retirement-age sellers in this tranche automatically receive a higher capital gains waiver, and those who deposit those gains into a qualified retirement account receive an additional tax benefit, converting housing equity directly into retirement savings.

The chain reaction 

1.Downsizer. Many fall into Tranche 2, often with retirement-age incentives. They’ve been in their home for 20 or 30 years with appreciation well above exclusion limits. The capital gains waiver removes the tax barrier and the retirement account provision gives them a reason to act now. They sell and family sized inventory returns to the market. Downsizers purchasing in cash who still carry a low-rate mortgage may also choose the assumability path, passing that rate to the buyer and making their property more competitive in the process. 

2.Upgrader. Many fall into Tranche 1. They bought a starter home three or four years ago at around 3% and haven’t built the kind of equity that makes capital gains the issue. Their problem is rate shock. Portability lets them buy a larger home, whether that’s the one the downsizer just freed up or new construction that was unreachable at current rates. The starter homes they vacate return to the market.

3.First-time buyer. They never touch either rate portability or the capital gains waiver directly, but benefit from both downstream. That’s because as upgraders move out, more starter homes become available at realistic listing prices driven by seller urgency. Some benefit directly from assumability, stepping into a seller’s existing low-rate mortgage rather than financing at current rates. This is who the entire chain reaction is designed to serve.

4.Homebuilder. Upgraders choosing new construction give builders a market for mid-range and upper mid-range homes that has been largely frozen. As starter homes turn over and first time buyers enter the market, builders see sustained demand at lower price points, giving them a stronger business case to build homes that serve the first time buyer. Federal incentives for affordable construction already exist, but are less effective when the broader market isn’t moving. Building more homes adds net new units to housing stock and creates jobs and economic activity in many other areas beyond housing.

5.Institutional investor. For Tranche 1 transactions, the rate spread between the portable rate and the prevailing interest rate gets securitized in a structure similar to how mortgage backed securities already work. The government packages the total expected spread across a pool of portability transactions as a fixed income security. Investors buy at a discount and collect returns over time, subject to the same prepayment and default risks that traditional MBS investors already price for. Institutional capital that was previously buying physical homes now has a familiar, liquid alternative that generates returns without removing a single unit of housing stock. Tranche 2 transactions generate zero rate spread to securitize, further reducing the overall cost of the program. Assumability transactions present no disruption to existing MBS pools. The loan stays exactly as securitized, and at current loan-to-value ratios the credit profile of an assumed loan is generally stronger than it was at origination.

How it gets funded 

Tranche 1’s securitization model mirrors the existing MBS framework facilitated through Ginnie Mae, Fannie Mae, and Freddie Mac. The mechanism isn’t new, only its application is.

Tranche 2 costs the government foregone capital gains tax revenue, but generates zero rate spread. The retirement account provision carries its own cost in foregone revenue, offset to some degree by reduced future pressure on social safety net programs. The self-sorting mechanism means the government isn’t bearing all costs on every transaction. 

Assumability carries no direct cost to the government. The rate stays with the property, the loan stays in the existing pool, and no tax revenue is foregone.

The underwriting layer 

Everything above increases supply and creates pricing pressure that favors buyers. But none of it matters if qualification standards haven’t evolved. If lending guidelines are still built around income documentation models that don’t reflect how people actually work and earn today, the chain reaction stalls at the most critical point. Underwriting reform is what determines whether housing mobility actually translates into ownership.

This framework isn’t a silver bullet, but it might bring enough people to the table to stop talking in silos. Congress should convene a steering committee spanning every industry touched by this framework, hammer out a pilot program with a defined timeline, stand it up where the gridlock is most acute, and then scale it.

Bill Dallas is Chairman of Dallas Capital and Mike Boccio is President of Pragmative Communications.
This column does not necessarily reflect the opinion of HousingWire’s editorial department and its owners. To contact the editor responsible for this piece: zeb@hwmedia.com.

This post was originally published on here

In the male-dominated space of real estate tech companies, 26-year-old Brynn Carmody stands out. 

“It is definitely hard walking into serious spaces like AI and being taken seriously,” Carmody said. “I’m young, I’m a woman and it’s a bootstrapped company, so I don’t have those typical signals people look for, for credibility, but what I do have is a product I actually built and the lived experience as a [real estate] agent that a lot of my competitors in this space don’t have.” 

Carmody’s experience as an agent inspired her to create Her Market Lab (HML), an enterprise AI infrastructure platform designed for individual agents. She officially launched the product on Monday. 

After studying marketing and advertising, Carmody entered the real estate space, first as a marketing and transaction coordinator before getting her real estate license and joining a two person real estate team.

“In that first year I had my license, I implemented systems I had honed as a transaction coordinator, and I drove our gross commission income growth by over $250,000,” Carmody said. “This showed me that systems were the answer to many common brokerage challenges.” 

But with herself as the center point of these systems, Carmody said she quickly found herself burning out. 

“Every follow-up, every piece of content, every listing prep for the team ran through me,” Carmody said. “So, every time deal flow picked up, which is the ultimate goal of everything, our back end and my brain, which was processing all of it, would be in chaos. Content would go dark, leads would slip through the crack — it was just a chaotic mess. I was simultaneously our biggest asset and the source of your biggest bottleneck, and it just burned me out. I had no way to keep up when things got busy.” 

Stepping back from the chaos

This burn out forced Carmody to take a step back and examine the challenge she and thousands of other agents were facing as they work to keep up with not only their business, but also the rapid pace of technology evolution. 

“Everyone was using some version of the same broken tech stack,” Carmody said.

This inspired her to create HML. Built on SaaS platform Go High Level, HML incorporates a smart CRM, email marketing capabilities, a social media publishing platform and a fully integrated AI layer, according to Carmody. 

“The AI layer is like having Claude or ChatGPT inside of your CRM. It has access to all of your business details, data and transactions,” she said. “We also have a brand studio built in, so agents can input their brand voice and the AI will pull from that when responding to leads.” 

In addition, agents can input compliance and regulatory documents to ensure that the response generated by the AI comply with local regulations. 

Building a community

While HML is a tech platform, Carmody is also using it to create a community of agents. 

“Not only are members getting a whole suite of business tools, from their CRM to AI employees, they are also gaining access to a community of [real estate professionals],” she said. “We do a weekly ‘lab’ where I teach them how to actually implement these AI tools into their business.

Carmody acknowledges that the onslaught of AI tools being marketed to agents can be overwhelming and agents don’t have hours to spend testing out new products to figure out what works best for them and their business. So, as part of HML she is earmarking time to research and try new products so she can help agents sort through all of the AI noise. 

“The weekly lab is a point where agents can come together and collaborate and learn from each other, so challenges and implementing new tools can be less overwhelming and more accessible.” 

HML is currently onboarding agents who wish to be beta testers. Agents who sign up before the end of the month will receive a discount on HML. Carmody also acknowledged the risk she is taking by marketing the platform specifically to female real estate professionals. 

“Right from the beginning agents and mentors of mine asked why I would cut out half of my potential audience by marketing specifically to women,” Carmody said. “I feel that real estate is a woman’s business. The numbers show that the majority of Realtors in North America are women. I think we are very relationship-based people, we’re empathetic and able to connect, and I think those are the qualities top agents build their businesses on.” 

Looking ahead, she says her immediate focus is proving that her model works and that there is a need for her product. 

“I want to gather real case studies and show what actually changes for an agent when they have the right infrastructure to build their business,” she said. 

In addition to this, she is currently working on integrating MLS data into the HML platform enabling agents to create and run their own IDX websites and set up listing alerts. In the future, she hopes to expand HML for teams and brokerages and find a way for agents who run ancillary operations like a coaching business to integrate all aspects of their business into the platform. 

“Big picture, I want Her Market Lab to become the default infrastructure for women in real estate, not just one of the options,” Carmody said.

This post was originally published on here

The White House estimates that the U.S. has a housing shortage of 10 million single-family homes, according to the annual Economic Report of the President released on Monday. This shortage is largely a product of overregulation, the report claims.

To combat the housing deficit, White House economists detailed possible regulatory cuts they say could spur new construction. They set their sights on numerous local regulations, in addition to Biden-era federal climate restrictions that allegedly raise housing costs and hinder development.

But the White House’s housing shortage estimate — and its criteria for calculating it — is under dispute. While economists and industry insiders generally believe that the nation needs to build more housing, most estimates place the national housing deficit well short of the 10-million mark. 

How big is America’s housing shortage?

In 2024, Freddie Mac estimated that the housing shortage was 3.7 million units, and earlier this year, Realtor.com similarly pegged the housing supply gap at just over 4 million homes. The National Association of Home Builders (NAHB) estimates a more modest 1.2 million-unit shortage based on 2024 data. 

Brad Case, chief residential economist at Homes.com, told HousingWire‘s The Builder’s Daily that housing shortage estimates can vary depending on the criteria used. He questioned the White House’s housing shortage estimate, as well as its sole emphasis on owner-occupied, single-family housing. 

On the other end of the spectrum, some argue that there is no true housing shortage because everyone, other than those who are experiencing chronic homelessness, finds a place to live, even if these housing situations aren’t ideal. For example, some people may have to live with roommates or with parents for longer than desired.

Case estimates the housing shortage is somewhere between 4 and 5 million homes. But this estimate accounts for all housing types, not just single-family.

“I look at the number of households relative to the number of adults, and that’s what we call the headship rate. And typically, there’s about one housing unit per two adults, so half an adult per housing unit. And I think that there are people who would like to form their own households that aren’t able to because they can’t afford to, right? And that’s what tells me that we have something that can be called a housing shortage,” Case explained. 

Decline in residential construction rates

Between 1983 and 2007, the average number of housing starts per year was about 6,000 homes per 1 million people. Since 2008, the White House says, average starts are running at about half that number, or roughly 3,000 starts per 1 million people. This is the methodology it used to calculate the housing shortage. 

“If homebuilding and the growth of the single-family housing stock had continued at their historical pace instead of falling dramatically after 2008, there would be 10 million or more additional single-family homes today,” the report read. 

But assuming that construction should have continued at the pace seen before the Great Recession isn’t necessarily the right approach, Case argues. 

Residential construction peaked in the early 1970s. In 1972, annual housing starts reached a high point of nearly 2.5 million units, about 1 million more than the levels experienced as of January 2026.

Housing starts generally trended downward after the early 1970s, despite some peaks and valleys, before experiencing a resurgence in the late 1990s into the early 2000s. After the Great Recession, starts dropped precipitously and have not yet fully recovered.

As Case puts it, the decline in housing starts from the early 1970s was at least partially driven by increased local regulations. Many municipalities deliberately favored building larger, more expensive homes, often for adults without children, to maximize property tax revenue while minimizing public service expenses such as schools. 

By the late 1990s, the federal government began easing underwriting standards, supporting low down payment loans and relaxing credit requirements in an effort to make homeownership more accessible. This stimulated additional housing demand, at least for a period. 

“When you stimulate demand for something, there’s going to be a supply response. So there was a supply response, but that was always built on a little bit of an artificial boost in demand for housing,” Case said. “So that’s why there is that blip in the early 2000s that didn’t last. The demand evaporated.”

Federal push to increase supply, cut regulations

The Trump administration has made housing affordability and increased homeownership a top economic priority. In a speech at the World Economic Forum in Davos in January, President Donald Trump exemplified this platform as he declared that “America will not become a nation of renters.”

The Economic Report of the President, drafted by the White House Council of Economic Advisors, set its sights on making homeownership more attainable. Overall, the strategy is to expand housing supply through regulatory reform. The expectation is that increased construction — especially in supply-constrained, high-cost markets — will put downward pressure on prices and improve affordability over time.

The report argues that excessive regulations are a major factor in higher home prices, claiming that government regulations add more than $100,000 in costs to each single-family home. While some regulations are necessary to ensure quality and safety, the report cites numerous local and state rules that it deems counterproductive. 

For example, exclusionary zoning practices that favor single-family housing only — rather than allowing flexibility for accessory dwelling units, duplexes and small multifamily buildings — can restrict density and supply in certain high-demand areas. 

The report also calls for reduced regulatory burdens that directly affect construction costs, such as building codes and heavy impact fees. While maintaining safety standards, it advocates for eliminating duplicative or burdensome rules that do not overtly contribute to health or safety. 

While these regulations are determined on the municipal and state levels, the federal government could decide to tie federal funding to state and local governments to a reduction in certain regulations. The bipartisan 21st Century ROAD to Housing Act, for example, would incentivize municipalities to streamline residential construction by making federal Community Development Block Grant funding contingent on an increase in housing supply. 

At the federal level, the report goes after Biden-era green energy mandates, such as stricter energy-efficiency standards, that Trump’s White House economists believe have increased construction costs. 

Another administration priority is a proposed federal ban on institutional investors that own 350 or more single-family homes from purchasing additional homes. That proposal is one of the provisions in the 21st Century ROAD to Housing Act, which Trump has not yet signed into law. Some detractors worry that the regulation could harm rental supply, but administration officials counter that it could boost homeownership. 

Why aren’t builders just building more?

If the U.S. has an undersupply of millions of homes, why don’t developers and homebuilders just build more housing? After all, an increase in supply would likely reduce home prices and rents, thereby making the American dream of homeownership more attainable.

For homebuilders specifically, the answer is often a business decision, one that they deem necessary. Affordability remains constrained and mortgage rates are still relatively high. These factors, combined with an excess of new-home supply in certain high-growth Sun Belt markets, pushed new-home prices down 2% year over year between December 2024 and December 2025.

At the same time, construction costs and other expenses like labor and land remain high. As a result, homebuilder margins continue to compress, with many public homebuilders reporting a drop of several hundred basis points in gross profit margins over the past year. 

The following are examples of year-over-year declines in gross profit margins, pulled from public homebuilders’ latest earnings reports.

  • KB Home: 15.3%, down from 20.2%. 
  • Smith Douglas Homes: 19.9%, down from 25.5%.
  • Lennar: 15.2%, down from 18.7%
  • Meritage Homes: 16.5%, down from 23.2%

Amid this trend, homebuilders are now faced with a dilemma. For many, if they increase housing starts too much — or at all — it could require concessions on price or incentives that might push margins down even further. This is part of the reason why single-family housing starts fell 7.3% last year

The Trump administration has made housing affordability and fewer regulatory burdens a central pillar of its economic agenda. Not everybody agrees on the specifics of the agenda, but among homebuilders, there is broad consensus on making housing affordability part of the national conversation. 

This post was originally published on here

California lawmakers are weighing yet another tool in the housing toolbox to jumpstart high-rise construction in the state’s largest downtown areas.

Assembly Bill 2074, dubbed the Downtown Revitalization Act, would ease approvals and offer state-backed, low-interest financing near major transit hubs. The bill calls for seeding a loan fund with $500 million.

The bill is moving through the committee gauntlet after passing unanimously in the Housing and Community Development Committee last week.

California lawmakers have passed a slew of bills in recent years to cut red tape and build more housing in a state with long-running affordability problems. Their work has served as one model for other states seeking to solve their own housing affordability challenges.

Gov. Gavin Newsom signed a landmark bill last year to override local zoning authority and allow more density near public transit.

What the bill would do

It would require California’s seven largest and transit-rich cities — Los Angeles, San Diego, San Jose, San Francisco, Sacramento, Oakland and Long Beach — to map regional transit districts. These districts would cover areas in and around their central business areas.

Within the transit districts, the bill sets a baseline building height of 150 feet. At least one-quarter of the land would have to allow towers of 450 feet or more. Projects that meet the bill’s labor and affordability standards would qualify for streamlined approvals. The goal is to cut local permitting delays that can stall dense housing for years.

Authored by Assemblymember Matt Haney, a San Francisco Democrat, the measure is sponsored by California YIMBY and the State Building and Construction Trades Council of California. Haney framed the bill as both a housing and economic development measure. He said it targets urban cores still reeling from the pandemic-era shift to remote work.

“I’ve spoken with city leaders across California and the message is clear: our downtowns are still struggling and need new energy,” Haney said in a statement. “AB 2074 makes that possible by building dense housing where it’s needed most, while creating good-paying jobs in the process.”

A central feature is a Downtown Revitalization Loan Fund to be administered by the California Housing Finance Agency. The revolving fund would provide low-interest loans to qualifying high-rise residential and mixed-use projects that meet state-defined labor and affordability benchmarks. The loans would be repaid at completion to support additional projects.

Closing a funding gap

Proponents say the fund is designed to close persistent capital stack gaps that often make tall buildings in California’s expensive markets financially unfeasible compared with mid-rise construction.

Brian Hanlon, president and CEO of California YIMBY, said the bill is intended to tackle the core structural barriers to building tall in job-rich downtowns.

“For too long, the economics of building high-rise housing in California’s downtowns simply haven’t worked. AB 2074 changes that,” Hanlon said, arguing that it’s “time to build up.”

Supporters say more predictable heights and faster approvals would give developers and lenders more certainty. They say union labor and affordability provisions would ensure projects deliver long-term public benefits.

The bill declares that its standards address a statewide concern and would apply to all eligible cities. That includes charter cities that typically wield broad control over local zoning. California YIMBY describes AB 2074 as part of a wider 2026 housing package. The group says the package aims to revive downtowns and lower construction costs through state intervention in both permitting and finance.

California budget woes

For Haney and the bill’s supporters, seeding the fund is the biggest challenge. California faces recurring budget shortfalls because tax revenues from high-income earners swing sharply. Analysts also blame rising ongoing spending and new cost pressures from federal cuts.

The Legislative Analyst’s Office projected an $18 billion budget deficit for 2026-27 in a report released last November. It warned that California could face large ongoing gaps without structural fixes. But Newsom’s budget, released in January, showed what he described as a manageable deficit of $2.9 billion.

California YIMBY officials note that the $500 million would turn into a revenue-neutral fund as developers pay back the loans with interest.

This post was originally published on here

Mortgage rates and inflation are expected to remain elevated through 2026 as pressures tied to geopolitical tensions keep Federal Reserve rate cuts on hold. That’s according to Mike Fratantoni, chief economist and senior vice president of research and business development at the Mortgage Bankers Association (MBA).

Speaking during an economic outlook session at the MBA’s National Advocacy Conference on Tuesday, Fratantoni said the U.S. economy is marked by “uncertainty along so many dimensions,” with a murky job market and renewed inflation risks shaping the outlook for interest rates and housing.

The labor market, he said, is “neither terribly strong nor terribly weak.” Monthly job growth averaged about 15,000 in 2025 and has risen to roughly 70,000 so far in 2026, although the data remains volatile and subject to revision. The unemployment rate is hovering around 4.3% as of March, with signs of softening.

At the same time, rising oil prices linked to global conflict are pushing inflation higher than previously expected. As a result, Fratantoni said that contrary to MBA’s original forecast of 3.2% inflation, he sees a figure closer to 4% by the end of 2026.

“That’s an inflation event for the United States,” Fratantoni said about the war in Iran, adding that rates could move higher if geopolitical risks intensify.

The MBA also removed expectations for any Federal Reserve rate cuts this year. The federal funds rate is expected to remain in its current range of roughly 3.5% to 3.75%, with little movement anticipated into 2027. Longer-term rates are also expected to hold steady.

On housing supply, Fratantoni pointed to declining effective rents in many markets, especially across the Sun Belt. Slowing population growth, lower fertility rates and tighter immigration are all curbing demand just as supply has increased, he said.

Affordability, however, remains strained. Wage growth is gradually improving affordability, but recent borrowers are more vulnerable and the market is risky, Fratantoni said.

Almost 17% of 2024 vintage Federal Housing Administration (FHA) loans and more than 25% of U.S. Department of Veterans Affairs (VA) loans are now underwater, Fratantoni added, compared with very strong equity positions for borrowers who bought in earlier years.

Delinquencies tell a similar split story. Conventional loan delinquencies are “about as low as they’ve ever been,” he said, while FHA delinquencies have climbed to about 11.5%, driven by changes to loss mitigation and genuine credit deterioration.

When asked at the end of his session whether the war, inflation or debt would have a bigger impact on mortgage rates, Fratantoni answered that the war would have a great impact over the next six months.

“It’s all about oil prices,” he said. “As for inflation, what we showed over the past five years is that this economy is so much more susceptible to inflation than anybody would have guessed. … Think back to the Silicon Valley Bank experience in 2023. People have re-remembered that inflation can jump quickly, and again, that immediately shows up in longer-term yields.”

This post was originally published on here

Brenda Tracy, who reported sexual harassment against former Michigan State University head football coach Mel Tucker, is suing United Wholesale Mortgage (UWM) and CEO Mat Ishbia.

Tracy claims the mortgage lender and its chief executive inserted themselves into a matter that was “none of their business.” UWM called the lawsuit fabricated, stating it “is about money and nothing more.”

According to the complaint filed March 23 in Oakland County, Michigan, Ishbia and UWM treated Tracy not as a “person whose privacy mattered, but as a problem to be managed once her complaint threatened Ishbia’s interest and investments tied to Tucker, the football program and the Michigan State University brand.” 

A UWM spokesperson vehemently denied the allegations.

“Ms. Tracy first sued Coach Tucker, but that case was thrown out of court. She then sued Michigan State, and the University has since filed a motion to dismiss that case as well,” the spokesperson told HousingWire. “Following those failures, her lawyers have filed a new complaint now naming Mat and UWM in an attempt to capitalize on the same unfounded allegations.”

The spokesperson noted the claims rely solely on communications from David Zacks, UWM’s former general counsel who passed away last year.

“That said, David Zacks and Mel Tucker were longtime friends, and their communications were personal in nature and had nothing to do with Mat Ishbia or UWM,” they said.

Tracy said in a social media post that “lawsuits are not just about money. They’re also about injunctive relief, which is what I am seeking.”

Tucker signed a 10-year, $95 million contract as Michigan State’s head football coach in November 2021 — which included $14 million directly contributed by Ishbia, the lawsuit claims. In December 2022, Tracy reported to the university’s Office of Institutional Equity (OIE) that Tucker sexually harassed her in April of that year. MSU terminated Tucker in October 2023 following an investigation in which Tracy participated.

The lawsuit alleges that during the investigation, Tucker’s attorney requested communications with Tracy’s office also be sent to Zacks at his UWM email address.

“Ishbia and UWM had a direct corporate stake in communications sent to or through Zacks because the emails and related electronic records belonged to UWM and were created, received, maintained, or routed through UWM systems while Zacks was serving as UWM’s general counsel,” the complaint states.

The lawsuit alleges Ishbia was interested in the case because he was MSU’s largest single donor at the time. It claims Zacks had no reason to be included in communications other than “keeping Ishbia in the loop,” noting Zacks was never identified on the record as Tucker’s attorney or adviser.

Disclosing confidential OIE information to people outside MSU violates statutory duty and constitutes unlawful action, according to the lawsuit. It alleges the information was used for reputational management and media purposes.

“Between December 2022 and January 2024, OIE staff transmitted emails or attachments concerning plaintiff’s investigation to one or more @uwm.com addresses,” the lawsuit states.

Tracy’s lawsuit includes counts of tortious interference with business expectancy, civil conspiracy, public disclosure of private facts and intentional infliction of emotional distress. The amount in controversy exceeds $25,000.

This post was originally published on here

After the release of the March existing home sales report, which missed estimates, the fact that housing inventory growth is slowing down has caught some people off guard. States like Florida, which some people said would see worse-than-2008 housing inventory increases in 2026, are already negative year over year.

visualization

Even the Dallas-Fort Worth-Arlington metro has negative year-over-year inventory.

visualization

Why is this happening? Slowing inventory growth is more rooted in how housing economics works, which, if properly told, isn’t always an exciting story, just a truthful one. I discussed this topic in today’s episode of the HousingWire Daily podcast and I want to go through the basics here.

Housing inventory is getting back to normal

I wasn’t a fan of the housing market from 2020 to early 2022 because housing inventory reached levels I deemed savagely unhealthy. Record-low levels of listings created massive price inflation that we are still dealing with today. Think about it: We had 3.25%-5% mortgage rates in the decade before COVID, but we never had home-price growth run rampant because inventory was higher then.

Normal inventory, according to the National Association of Realtors, is between 2 and 2.5 million. I think the housing market is perfectly fine as long as we have 1.52-1.93 million total active listings and 4 months plus of supply. This is what we had last year during the peak seasonal inventory period and what we should have this year, just breaking over 1.52 million. Currently, we are at 1.36 million so we should still get above 1.52 million at some point this year. 

visualization

Now, because inventory is getting back to normal, it’s going to take a lot more demand weakness or new listings growth to get inventory growth to really pick up from here. The peak 33% inventory growth rate we had last year was good, but it was working from a lower bar. Also, mortgage rates have been above 6.50% for most of the year.  For all the drama we have had with events in 2026, it’s still the lowest mortgage rate curve for spring in many years. We can all thank a mortgage spread for that!

visualization

As you can see in the chart below, existing home sales have gone nowhere for years, but inventory has grown from record-depressed levels to almost normal again. At this point, we need to see more demand weakness, meaning homes take longer to sell, to have a similar type of growth to what we had in 2025.

Now imagine if mortgage rates were under 5.75%… It would be even harder to get more inventory growth. Even if total inventory is negative this year, we are working from a higher level, keeping prices in check and having wages outgrow home prices again in 2026.

Harder year-over-year comps

A big theme of my work since mid-June of 2025 has been that the housing market has shifted, and it did so after a year of really good inventory growth. The shift is that when rates go lower, it’s harder for inventory to grow, especially in this market when rates drop below 6.64% and head down toward 6%. The comps for 2026 will be very difficult to show much growth until we get toward mid-June.

visualization

New listings data isn’t taking off

New listings data is key to understanding how many people are listing their homes for sale — most of whom go on to buy another home. Since 2020, we haven’t had a normal year of new listings data. It didn’t matter when rates were at 3% or 8%; we never really had a year where the seasonal high period had many weeks where new listings data was running between 80,000 and 100,000.

So far this year, nothing big is happening again. We should get toward 80,000 new listings per week like we did last year, but it’s not going to be a normal year again in 2026.  For some context here, during the housing bubble crash period, new listings data was running between 250,000 -400,000 per week for years.

visualization

Conclusion

When trying to understand inventory, don’t make it complicated. Inventory is up from record-low levels, mortgage rates are lower this year than in previous years, purchase application data is at multi-year highs, new listings data isn’t back to normal yet and we are working from extreme hard comps until mid-June. That’s it. It’s not a sensationalist story, just based on solid data.

This post was originally published on here

Retirement planning has long required navigating many financial risks — from outliving savings to market volatility and rising health care costs.

But new research from the Center for Retirement Research at Boston College finds that uncertainty surrounding federal policy has sharply intensified these challenges since early 2025.

A recent survey of retirees and near-retirees shows growing unease about the future. Concerns about financial security have increased significantly, while confidence in government policy has declined.

Many older Americans are responding defensively by delaying retirement, boosting emergency savings and shifting toward more conservative investments. The survey data builds on earlier findings by examining whether financial advisers can help clients manage that uncertainty. The answer appears complicated.

Policy risk weighs on households

Researchers define “policy risk” not as policy changes themselves, but as unpredictability about future decisions.

Even the possibility of change — such as during a closely contested election — can force households to prepare for multiple outcomes.

Research shows that such uncertainty tends to harm the broader economy — dampening activity, increasing market volatility and reducing investment. At the household level, the authors of the brief said it raises anxiety and can prompt costly precautionary behavior.

For older Americans, the most pressing concerns center on Social Security, Medicare and federal debt. Questions about how policymakers will address projected funding shortfalls — through tax increases, benefit cuts or both — loom large.

Survey data shows these concerns are not abstract. Many respondents reported increased media consumption about economic and policy developments, alongside a significant rise in financial anxiety.

Investor reaction, reverse mortgage perception

Older investors are not standing still.

The survey found that 21% of those still working have postponed retirement. Meanwhile, 28% have increased their emergency savings and one-third have shifted toward more conservative investments.

These actions reflect an effort to guard against uncertainty, although research suggests such defensive moves can carry their own costs.

Overall, the findings suggest that older Americans are keenly aware of increased policy uncertainty and are taking defensive responses, researchers said.

Some financial advisers have argued that part of the solution lies in better integrating housing wealth into retirement planning.

Ryan Ponsford, a veteran financial adviser, said during a February webinar that isolated negative experiences for potential reverse mortgage clients have impeded the process.

“You think your job is hard because you have a product that people have a bad impression of, believe they’ve had a bad experience or have heard bad things about — most of which is untrue,” he said. “But a lot of them have had a bad experience with people in the industry.”

He estimated that roughly 33 million baby boomers who own homes — excluding the wealthiest households — could represent a potential market, with those holding $500,000 to $3 million in assets forming a “sweet spot.”

Speaking last year at the National Reverse Mortgage Lenders Association’s annual meeting, Ponsford shared similar sentiments and pointed to industry barriers that include a lack of education, reputational concerns, and the perception that reverse mortgages are a “loan of last resort,” even as millions of homeowners could potentially benefit.

Jonathan Delozier reported and wrote this article with drafting assistance from HousingWire Automation, an editorial tool that helps transform announcements and industry data into HousingWire-style news coverage.

This post was originally published on here

On a leafy Greenpoint block, the pretty brick townhouse at 143 Milton Street fits right in with its historic neighbors. Inside, the completely renovated three-bedroom home, asking $4,195,00, offers four levels of comfortable living from day one, with an elevator providing easy access to all floors. Classic contemporary design won’t go out of style, and plenty of private outdoor space takes advantage of the neighborhood’s greenery.

The garden level holds a private entertaining space with a large rec room/bar and a full bath. At the back, step out onto a private landscaped garden for outdoor gatherings.

The parlor floor is, in keeping with townhouse tradition, the home’s formal living and entertaining space. An elegant south-facing living room, framed by deep decorative molding and pale wood floors, opens onto another private garden. A sleek, well-appointed kitchen fills a rear extension.

The primary suite is on the second floor, enhanced by custom closets and an elegant, renovated bath. A smaller bedroom on this floor makes a perfect nursery or extra-large dressing room.

On the home’s highest level, you’ll find a skylit bedroom with access to a private balcony. There is a full bath on this floor as well.

Elegant finishes, outdoor space, and elevator access are complemented by central A/C and a washer/dryer. In its newest incarnation, the 1899 townhouse represents the timelessness of the city’s beautifully preserved historic architecture.

[Listing details: 143 Milton Street by Nicholas Maclean Lounsbury, Justin Hopwood, Adrian Radomski, and Julio Izquierdo of Compass]

RELATED:

The post An elevator makes this $4.2M Greenpoint townhouse a timeless forever home first appeared on 6sqft.

This post was originally published here

Bob Broeksmit, president and CEO of the Mortgage Bankers Association (MBA), called on industry members to intensify advocacy efforts on Capitol Hill, outlining a series of next steps as lawmakers weigh key housing and financial policy changes.

Speaking at the MBA‘s National Advocacy Conference on Tuesday in Washington, D.C., Broeksmit said that while this year’s conference involves less uncertainty than last year’s — which was marked by “DOGE cuts,” “Liberation Day” tariffs and a possible global trade war — the association’s advocacy work is far from finished.

Broeksmit reminded the audience about the trade group’s advocacy wins in 2025 and urged members to press Congress to address provisions in the 21st Century ROAD to Housing Act.

“The Senate‘s package, taken as a whole, has the potential to meaningfully improve housing supplies and affordability,” Broeksmit said. “It is rare to see unanimous bipartisan agreement on major legislation, an indication that elected officials clearly recognize voter concerns about rising housing costs and limited availability.”

But Broeksmit added that MBA has “several concerns that must be addressed.” This includes a “drafting error related to Federal Housing Administration (FHA) multifamily loan limits, which would have the effect of lowering them [and] second, a single-family housing investor ban that would ironically restrict the flow of capital into rental housing.”

Broeksmit said the MBA, due to its concerns regarding the potential ban on institutional investors, met with Treasury Secretary Scott Bessent in February and addressed its concerns. Bessent reportedly told Broeksmit that the proposal to ban certain institutional investors in the single-family housing market gained significant traction after polling showed it resonated strongly with the public.

That signal, Broeksmit told his audience, prompted the MBA to assemble a coalition to mitigate potential unintended consequences, particularly for multifamily housing.

“The last thing that we have a real issue with on the ROAD to Housing (Act) is a proposal to divert funds from the FHA Mutual Mortgage Insurance Fund to support foreclosure counseling, not only for FHA borrowers, but for U.S. Department of Veterans Affairs (VA) borrowers and U.S. Department of Agriculture (USDA) borrowers, something that should occur through the normal appropriations process,” Broeksmit said.

An overhaul to credit reporting requirements remains a central priority for the MBA. Broeksmit said the group will continue pushing policymakers to eliminate the tri-merge credit report mandate, arguing that it reduces competition and increases borrowing costs.

“Our goal is to fix the underlying problem, which is a lack of competition in a safe, data-driven manner,” he said, adding that members should advocate for “timely action” from regulators and lawmakers.

On bank capital standards, the MBA plans to submit formal comments on the latest Basel III proposal released by federal regulators, while continuing to push for reforms that better reflect mortgage risk and expand liquidity. Broeksmit said changes to capital treatment for mortgage servicing rights and warehouse lending would “benefit the entire market.”

The group is also engaging with federal agencies on regulatory reforms aimed at easing compliance burdens and expanding access to credit. Broeksmit said recent discussions between MBA’s Residential/Single Family Board of Governors (RESBOG) and the Consumer Financial Protection Bureau (CFPB) signaled openness to adjusting mortgage rules to better support lenders of all sizes.

“We need you to carry the message to Capitol Hill that MBA will work with the White House, federal agencies and industry stakeholders to ensure these reforms are effective, practical and beneficial,” he said.

This post was originally published on here

Veterans United Home Loans, owned by Mortgage Research Center, filed a motion to dismiss a class-action lawsuit that accuses the lender of falsely presenting itself as affiliated with the federal government and steering borrowers toward more costly loans.

The lender argues that the plaintiffs failed to present “any concrete and particularized injury” and to state a claim. Attorneys for the plaintiffs declined to comment.

The original complaint alleges the private, for-profit corporation misled homebuyers into believing it is connected to the U.S. Department of Veterans Affairs (VA). It claims that multiple real estate agents and loan officers say they routinely lose business because borrowers believe they must use Veterans United since it’s part of the VA.

The company was founded and is run by three individuals with no military service records, the original complaint states.

In its motion to dismiss, Veterans United includes two screenshots of its website — one attached to the original complaint and another to the motion itself — demonstrating that its site features a disclaimer stating it is not a federal agency. Notably, the disclaimer in the screenshot attached to the original complaint appears smaller.

The motion to dismiss was filed Monday in the U.S. District Court for the Western District of Missouri by Veterans United Home Loans, Realty Search Solutions (dba Veterans United Realty) and Mortgage Research Center.

The plaintiffs — homeowners who obtained loans from Veterans United between 2022 and 2025 — allege violations of the Real Estate Settlement Procedures Act (RESPA).

They say Veterans United distributes leads to preferred agents who, upon closing a home sale, pay the company roughly 35% of their commission (usually part of 3% of the transaction fee). Agents who do not refer loans back to Veterans United allegedly stop receiving leads. The plaintiffs claim Veterans United loans are more costly and carry higher interest rates compared to what homebuyers could obtain with other lenders

In its motion, Veterans United argued the RESPA rule exempts cooperative brokerage and referral arrangements. The lender claims the plaintiffs failed to plead the statutory requirements for liability — including any referral, thing of value or charge paid by them — and that some plaintiffs extrapolated the one-year limitations period.

The lender also argues the plaintiffs made a copy-and-paste error from other pending cases by claiming quota violations without alleging any actual referral quotas exist.

Additionally, Veterans United pushed back against a claim regarding violations of the Missouri Merchandising Practices Act, noting the transactions occurred outside the state. Regarding a common-law unjust enrichment claim, Veterans United said the plaintiffs do not allege they conferred any benefit on the defendants.

Veterans United argues the plaintiffs seek recovery for conduct covered by a contract and that the claims are based entirely on deficient RESPA allegations. Additionally, the motion notes the plaintiffs sued the wrong entity — Realty Search Solutions instead of Realty Search Solutions Network — and incorrectly labeled Veterans United Realty a “shell company” when the correct firm actually employs hundreds of licensed agents.

Chad Moller, corporate communications manager at Veterans United, told HousingWire in a statement that this “meritless lawsuit gets next to nothing right. It’s filled with nonsensical allegations and cut-and-paste complaints from lawsuits filed against other mortgage lenders — none of which hold up to common sense, let alone legal scrutiny.

“To be crystal clear, Veterans United Home Loans and Veterans United Realty have never held themselves out as the VA or any other government agency. Never.”

Attorneys representing the plaintiffs said they filed claims after speaking with roughly half a dozen real estate agents and loan officers across the country who have firsthand experience with VA home loans.

“First, we believe Veterans United has engaged in blatantly illegal practices that have harmed homebuyers through predatory loan practices,” Steve W. Berman, managing partner and co-founder of Hagens Berman, said in a statement when filing the lawsuit. “Second, Veterans United has sought to deceive our nation’s military servicemembers by masquerading as affiliated with the U.S. Veterans Administration.”

The plaintiffs have until the end of April to respond to the motion to dismiss but the deadline can be extended upon request. The complaint states that the total amount in controversy exceeds $5 million.

Hagens Berman also represents clients in a case involving Rocket Companies, following settlements tied to real estate brokerage commissions that totaled more than $1 billion.

This post was originally published on here

A colorful mural opened at Lincoln Center on Monday, part of an ongoing effort to transform its western edge into a more welcoming public space. Designed by artist Vanesa Álvarez and assistant artist Derval Fairweather in collaboration with ArtBridge, “The Future We Create” draws on themes and imagery shaped by community input. The mural is installed on construction fencing along the perimeter of Damrosch Park, where Lincoln Center plans to remove longstanding barriers separating its campus from Amsterdam Avenue and improve access to surrounding neighborhoods.

According to W42ST, the 4,000-square-foot mural translates drawings, memories, and ideas gathered from locals through community workshops into vibrant graphic figures. The artwork features present-day residents alongside references to San Juan Hill, the predominantly Black and Latino neighborhood razed in the 1950s to make way for Lincoln Center.

It replaces a stretch of fencing that once displayed the Ex Vandals’ San Juan Hill mural, which will be converted into a digital format and displayed inside David Geffen Hall.

“I’m so thrilled to unveil ‘The Future We Create,’” Álvarez said.

“This is more than a piece of art—it’s a story. Behind this mural is a history of community: of joy, of color, of people spending time together, creating together, believing in the arts, and being part of making it.”

The mural’s unveiling marks an important step in the Stavros Niarchos Foundation Lincoln Center West Initiative, first announced in 2023. Led by Hood Design Studio, Weiss/Manfredi, and Moody Nolan, the project focuses on the campus’s Amsterdam Avenue-facing side, where a five-foot wall at 62nd Street rises to 20 feet at 65th Street, acting as a barrier between the campus and neighborhoods to the west.

For decades, residents of NYCHA’s Amsterdam Houses and Addition, along with students at Fiorello H. LaGuardia High School of Music & Art and Performing Arts and the five schools within the Martin Luther King Jr. Educational Complex, have been physically separated from the Lincoln Center campus, lacking the same access found on the east side.

View of the grove within Damrosch Park with shade and seating, looking east.

The project also includes changes to Damrosch Park, which is city-owned and operated by Lincoln Center. After a participatory planning process that included feedback from more than 3,400 New Yorkers, the design team was selected to transform the space into a public park with a modern performance venue, as 6sqft previously reported.

New gardens at the park’s entrance will provide public seating, while new art and light installations will enhance the concourse connecting Amsterdam Avenue to the 1 train entrance on Broadway. Much of the park’s new geometry echoes the historic forms of Lincoln Center’s iconic modernist design.

View of amphitheater and audience area during performance looking southeast towards 62nd Street.

Anchoring the new park will be a performance venue featuring a permanent theater and an open plaza with seating for about 2,000 guests, designed for both artistic and community use.

“The new design for Damrosch Park will repair what for so long has been one of the great failures of Lincoln Center, the cold shoulder it turns toward its neighbors to the west, replacing an uninviting open space with a vibrant new park gracefully connected to its surroundings,” Paul Goldberger, architectural scholar and historian, said, according to Lincoln Center.

The project is supported by a $335 million capital campaign, with 65 percent of the funds raised as of last May. Support has come from the LCPA Board of Directors, who championed the project from the start, as well as a $10 million commitment from the State of New York.

The Stavros Niarchos Foundation is a founding partner in the project, awarding a $75 million grant. The gift includes early support when the initiative first launched and builds on the foundation’s backing of Lincoln Center’s Summer for the City free programming.

The mural will remain in place for about two years while construction on the project continues, which is slated for completion in 2028.

RELATED:

The post Lincoln Center unveils new mural honoring San Juan Hill ahead of major renovation first appeared on 6sqft.

This post was originally published here

Mayor Zohran Mamdani on Tuesday announced plans to build a city-owned grocery store in East Harlem, advancing one of his core campaign promises. Located under the Park Avenue Viaduct between 111th and 116th Streets, La Marqueta was opened by Mayor Fiorello LaGuardia in 1936 as one of the city’s original public markets. Over the years, the marketplace has struggled and has shrunk its footprint and its number of vendors. As the New York Times first reported, the city plans to spend $30 million to build the store at the site of La Marqueta, which is expected to open by 2029.

Schomburg Center for Research in Black Culture, Photographs and Prints Division, The New York Public Library. “Park Avenue Market being visited by families, in East Harlem.” The New York Public Library Digital Collections. 1960-1969.

LaGuardia opened the Park Avenue Retail Market in 1936 to bring hundreds of the neighborhood’s pushcart vendors under one roof, allowing food to remain affordable and conditions to be more sanitary. According to the city, as the neighborhood “transformed from Italian Harlem to Spanish Harlem,” the market became known as La Marqueta. In addition to selling Latin American and Caribbean goods, the market has served as a retail and cultural anchor in East Harlem.

According to Mamdani, grocery prices increased in New York City by nearly 66 percent between 2013 and 2023. The city-supported store, to be run by a private operator that “answers to standards” set by the city, according to the mayor, will require that basic staple groceries like eggs and bread be discounted. The city will waive rent and real estate taxes. The private operator will be selected through a request for proposals.

“Just as LaGuardia used government to respond to the challenges of the Great Depression, we will use government to respond to rising prices and unaffordable groceries,” Mandani said during a press conference on Tuesday.

The mayor said 65,000 New Yorkers live within a 10-minute walk of La Marqueta, including 5,000 NYCHA residents on either side of Park Avenue. About 40 percent of East Harlem residents received public assistance or SNAP benefits in the last year.

“At its peak, La Marqueta served 25,000 customers per day,” Mamdani said. “We hope to make a similar impact in this very neighborhood, continuing LaGuardia’s legacy.”

The East Harlem grocery store will be built on a vacant, city-owned lot and will not displace any existing vendors, according to the Times. Mamdani proposed $70 million in capital funds to open five grocery stores, one in every borough, by the end of 2029. The plan requires approval by the City Council.

The first city-owned store will open within an existing building in a different borough by the end of 2027. It’s unclear, as of now, where this store will be located.

Overseen by the city’s Economic Development Corporation (EDC), the city’s network of public markets includes Essex Market, Moore Street Market, Arthur Avenue Market, Gourmet Glatt, and Jamaica Farmers Market.

The EDC will oversee the construction of the new La Marqueta store.

“Today, we take the first major step in delivering New York City’s first public grocery stores and NYCEDC is proud to work with Mayor Mamdani and his administration in delivering these public stores that will help address food insecurity and affordability while ensuring good paying, quality jobs and a dignified, enjoyable shopping experience for New Yorkers,” NYCEDC Interim President & CEO Jeanny Pak said.

RELATED:

The post Mamdani announces plans for city-owned grocery store in East Harlem first appeared on 6sqft.

This post was originally published here

The ceasefire in the Middle East that runs until April 22 has temporarily put the brakes on rising mortgage rates, but returning the cost of a home loan closer to a 6% anytime soon is contingent on a long-term resolution between the U.S. and Iran.

Mortgage News Daily reported Monday that 30-year fixed rates averaged 6.43%, down 4 basis points in the past week. MND rates are based on best-execution pricing from lender rate sheets.

HousingWire’s Mortgage Rates Center, which analyzes locked loans across all borrower credit profiles, showed that 30-year conventional loan rates were at 6.47% on Tuesday, down 5 bps from one week ago. Rates for 30-year mortgages backed by the Federal Housing Administration (FHA) dropped 3 bps during the week to 6.18%, while rates for 30-year jumbo loans rose 4 bps to 6.33%.

Melissa Cohn, regional vice president at William Raveis Mortgage, said in written commentary that the war in Iran is having “far-reaching effects” that include the housing market.

She also noted that last week’s Consumer Price Index data, which showed rising annual inflation of 3.3% in March, and downward revisions to year-end 2025 gross domestic product growth figures, are illustrative of a slowing economy. But these factors aren’t expected to influence the Federal Reserve to cut rates at the end of April.

“Where oil goes is where mortgage rates and the rate of inflation will go,” Cohn said. “So, if this cease-fire actually holds, and they can resolve and end the war and oil prices settle back down, then rates will come back down.”

The CME Group’s FedWatch tool shows that 99.5% of interest rate traders are expecting the Fed to hold rates steady this month. The vast majority of traders anticipate the federal funds rate to stay at its current range of 3.5% to 3.75% through the end of 2026, with the share who predict a cut rising to a peak of only 26% in December.

Housing market response

In this week’s Housing Market Tracker, HousingWire Lead Analyst Logan Mohtashami wrote that softening conditions are most visible in shrinking levels of for-sale inventory. At its peak last year, inventory growth reached 33% year over year, but it slowed to 3.21% as of last week. Figures could move into negative territory in the near future, he added.

But a silver lining is also present in the form of lower mortgage spreads, which dropped from 2.11% to 2.05% over the past week. The difference between the 10-year Treasury rate and the 30-year mortgage rate was significantly higher in each of the past three years, meaning that mortgage rates could be between 6.88% and 7.45% today if the same spreads existed.

Still, prospective homebuyers have significant headwinds in their purchase journey, as indicated by the University of Michigan’s Consumer Sentiment Index for April. The initial index reading of 47.6 for this month was down significantly from March and represented the lowest level in the 70-plus-year history of the survey, according to reporting by The Wall Street Journal.

Data released Tuesday by Optimal Blue showed positive momentum in the mortgage market last month. Rate-lock volume for March was up 13% from February and 26% higher on an annualized basis. The company reported that purchase loans were leading that growth as refinance activity has waned in the face of higher rates.

“Purchase demand is carrying the market forward even as rates move higher,” said Mike Vough, Optimal Blue’s senior vice president of corporate strategy. “That’s a strong sign for the spring market, especially with the refinance share still at 28%, well above where it spent most of 2025.”

But mortgage application data, a leading indicator for closed loans and home sales, continues to trend lower, with the Mortgage Bankers Association’s latest purchase index down 7% year over year without accounting for seasonal adjustments.

“For the spring season to truly break out, instead of just policy announcements, we will need more policy stability,” said Lisa Sturtevant, chief economist for Bright MLS. “Until there is a clearer resolution to the international conflict and energy prices stabilize, both buyers and sellers will likely remain in ‘wait-and-see’ mode.”

This post was originally published on here

Big banks JPMorgan Chase and Wells Fargo saw mortgage volumes decrease more than expected in the first quarter of the year despite a regulatory push to make them more active in the space.

JPMorgan Chase’s origination volume hit $13.7 billion in the first quarter, down 14% from the prior quarter and up 46% from the same period last year. Retail channels drove most of the production, accounting for 63.5% of the total. The bank’s home lending revenues reached $1.23 billion in the first quarter, up 2% year over year.

Similarly, Wells Fargo originated $6.3 billion from January to March, down 16% from the prior quarter but up 43% compared to the same period last year. Total home loan revenue declined 9% year over year to $787 million, according to filings with the Securities and Exchange Commission (SEC).

Mortgage volumes fell by an average of about 15% quarter over quarter at the banks. This came in below the Mortgage Bankers Association‘s estimate of a 6% decline, according to Keefe, Bruyette and Woods (KBW) analysts. But margins increased modestly, they said. 

“Net/net, we’d characterize the quarter as largely in line. While the volumes were a bit light, gain-on-sale (margins) was probably slightly higher than expected,” the KBW analysts said. 

In the servicing business, third-party mortgages serviced by Wells Fargo totaled $386.6 billion, down 3% quarter over quarter as the bank continues to reduce exposure to the business. At JPMorgan Chase, they were down 1% in the same period to $656.4 billion.

Overall, Wells Fargo delivered $5.2 billion in net income, compared to $4.8 billion in the same quarter last year. Chairman and CEO Charlie Scharf told analysts that despite volatile markets, the economy remains resilient.

“Upper-income consumers continue to benefit from elevated equity prices, home equity and cash buffers accumulated earlier in the cycle, allowing discretionary spending to remain firm,” Scharf said. “By contrast, lower-income households are more exposed to higher interest rates and energy prices. Financial markets have absorbed these cross-currents with resilience, but we expect continued volatility driven by geopolitical headlines and outcomes as well as the unfolding impact of higher commodities prices.”

Scharf called the new capital proposals for banks a “constructive step.” He noted that if the proposals remain as written, the bank’s risk-weighted assets could decrease by approximately 7% based on its current balance-sheet composition.

In mid-March, federal bank regulators introduced proposals to overhaul capital rules, impacting how depositories treat mortgage assets. The package included revisions to the Basel III framework for large internationally active banks, changes to the Global Systemically Important Bank surcharge and updates to the U.S. standardized approach. Regulators previously abandoned a broader Basel III proposal introduced in 2023.  

Meanwhile, JPMorgan posted $16.5 billion in net income, compared to $14.6 billion in the same period last year. Chairman and CEO Jamie Dimon attributed U.S. economic resilience to tailwinds such as increased fiscal stimulus, deregulation, AI-driven capital investment and the Federal Reserve‘s asset purchases.

He cited geopolitical tensions, wars, energy price volatility, trade uncertainty, large global fiscal deficits and elevated asset prices as primary risks. And in addressing the new regulatory proposals, Dimon said they will force the bank to hold onto $20 billion more capital “for no good reason.”

“Every company in the world has operational risk, and they artificially create risk-weighted assets which do not exist, and this locks up a lot of capital liquidity for eternity for no good reason,” he said.

This post was originally published on here

Compass is rapidly increasing its residential real estate market share in several large U.S. metros, raising questions about market dominance, double-ending and industry rules, according to a report from the Consumer Policy Center (CPC) released Tuesday

The study, “Compass Expansion: New Data on Market Share and Double-Ending,” analyzed 5,000 recent home sales — 1,000 each in Boston, Washington, D.C., Chicago, Austin and San Diego — and found that Compass controls between 30% and 40% of unit sales in those markets, with even higher shares when measured by dollar volume.

“In four of the five cities, Compass’s share of unit sales is at least four times larger than that of its main competitors and 2.5 times larger in the fifth market,” CPC senior fellow Stephen Brobeck, the report’s author, said in the announcement.

Brobeck said Compass’s share “is not only very large but also much larger than that of major competitors,” adding that the company is becoming “so dominant in some local markets that consumers will feel both pressure and attraction to list and purchase properties through Compass agents.” 

After its acquisition of Anywhere, which closed earlier this year, the CPC’s data shows that Compass has 32.4% market share in Boston, 39.5% in Washington, D.C., 35.0% in Chicago, 29.7% in San Diego and 29.7% in Austin. 

The report links Compass’s growth to its emphasis on private listings and elevated levels of double-ending, where one brokerage represents both sides of a transaction, often through one or two agents at the same firm.

In the first private listing phase of Compass’s three-phased marketing strategy, the CPC said, consumers can only access those private exclusive listings through a Compass agent. That closed access “appears key” to the company’s double-ending rates, the report found. In Washington, D.C., the double-ending rate for Compass prior to its acquisition of Anywhere exceeded 40%, according to CPC.

Compass says report relies on a partial dataset

In an emailed statement, a Compass spokesperson told HousingWire that these statistics “do not reflect the full scope of [Compass’s] business and appear to rely on a partial dataset.”

“Our real estate professionals are expected to act in their clients’ best interests, regardless of which brokerage or agent has written an offer on the property,” the spokesperson added. 

The company has previously stated that the majority of its private exclusive listings that sell off-MLS are co-brokered with a non-Compass agent. The firm has also continued to maintain that all buyers and real estate agents can access Compass’s private exclusive listings by contacting a Compass agent or visiting a brokerage office. 

The report also claims that Compass has a new policy that 10% of the commission an agent receives will be given as a referral fee to another Compass agent if they are the source of the referral, which the CPC believes will result in an increase in double-ended deals. 

Compass responds

In response to this, a Compass spokesperson told HousingWire that “buyer inquiries from listings on Compass.com have always been sent directly to the Compass listing agent, ensuring the real estate professional who earned the seller’s trust and knows the home best is the first to receive the opportunity.”

“In February, we announced a ‘Listing Agent Lead and Referral Program’ that provides Compass agents with added flexibility. They can handle buyer inquiries themselves or refer them to a vetted Compass buyer’s agent and earn a 10% referral fee if the transaction closes within 24 months,” the spokesperson wrote in an email. “This creates a new way for Compass listing agents to generate passive income while maintaining full control over their business.”

Dissecting Compass’s expansion strategy

The report also examines Compass’ expansion strategy, finding that it consists of a combination of acquisitions, partnerships, double-ending, which the report claims it will increase by steering more buyers to Compass agents through its partnership with Rocket-Redfin, and its expansion into ancillary services like mortgage and title. 

Other aspects of Compass’s growth strategy highlighted in the report include acquisitions and partnerships. Examples of this include Compass’s recent acquisition of Anywhere and its partnership with Rocket-Redfin to pre-market the firm’s coming soon listings, while also expanding access to mortgage services for agents and consumers through Rocket’s Preferred Pricing Program. 

“The dream of Compass Chairman and CEO Robert Redkin and other Compass leaders appears to be domination of the most profitable local markets through overwhelming numbers of agents and listings that attract and pressure consumers to list and purchase properties through Compass agents,” the report states. 

These strategic growth moves by Compass have not come without warning, as Compass founder and CEO Robert Reffkin, who now also helms Compass International Holdings (CIH) the parent company that oversees Compass, Anywhere and @properties Christie’s International Real Estate, has touted his goal of holding 30% market share in 30 markets. 

Compass’s growth impact on industry

While the report does raise concerns over how the firm’s market share will impact consumers, it also looks at how the company’s growth may impact the industry. As Compass has grown, it has “challenged, worked around or flouted traditional industry rules,” the CPC report said, pressuring the broader industry — including the National Association of Realtors (NAR), large brokerages and portals such as Zillow — to change policies and practices.

“Instead of inadequate industry rules, increasingly there are no rules effectively governing industry conduct,” Brobeck said in the release.

The report suggests that shifting norms around pocket listings, off-MLS marketing and private listing networks are reshaping how inventory is shared, how buyers find homes and how listing exposure is managed. For agents and teams, this could affect lead flow, referral dynamics and the value of MLS participation in markets where one brokerage controls a large share of listings.

As a result, moving forward, the CPC said Compass’s expansion raises risks for both competitors and consumers. As Compass’s presence grows in local markets, sellers may increasingly gravitate to its brand and distribution, including listings that omit information about days on market and price changes, the report said. Additionally, buyers may feel pressure to work with Compass agents to access private listings.

The report also forecasts that Compass will likely pursue stronger national branding through broad advertising campaigns, similar to recent Super Bowl ads by Rocket and heavy TV spending by large insurance carriers.

But while CPC does see an expansive runway for Compass, the report also identified several challenges that could complicate the firm’s growth trajectory, including the cost and integration challenges of acquisitions, potentially greater cooperation and coordination among rival brokerages, public and private antitrust actions related to alleged market power or exclusionary practices and consumer skepticism over conflicts of interest, transparency and data access. 

This article was written by Brooklee Han and generated with the assistance of HousingWire Automation. It was reviewed by a HousingWire editor before publication. The system helps convert company announcements and industry data into HousingWire-style news coverage.

This post was originally published on here

Adaptive reuse

A record 90,000 apartments are now in the U.S. pipeline of office-to-apartment conversions, according to RentCafe’s latest analysis of Yardi data – a sign that each year shifts adaptive reuse even more from niche strategy to mainstream development tool. The surge comes as office vacancy persists under hybrid work and housing demand remains strong in supply-constrained cities.

“Office-to-residential conversions are no longer just a workaround for distressed buildings – they’re becoming a strategic tool for adding housing in supply-constrained markets,” said Doug Ressler, senior analyst and manager of business intelligence at Yardi Matrix.

A FAST-GROWING PIPELINE FUELED BY MARKET SHIFTS

The rise in conversions reflects two key trends coming together: higher office vacancy rates and an ongoing need for more housing. As companies reassess how much space they need, some office buildings – particularly older ones – are seeing lower demand. At the same time, renters continue to face limited housing options in many desirable urban locations.

This imbalance is creating opportunities for developers to reposition office assets into residential units. Compared to ground-up construction, conversions can offer a faster path to delivery in well-located areas where zoning and land availability might otherwise slow new development.

Still, not every building is a good candidate. “The feasibility of office conversions depends heavily on building design – factors like floor depth, window access and structural layout can make or break a project,” explained Peter Kolaczynski, director of data and research at Yardi.

Most conversion activity is concentrated in properties built between the 1960s and 1990s, which tend to have layouts better suited for residential use.

WHY OLDER OFFICE BUILDINGS ARE LEADING THE WAY

A defining feature of the current conversion wave is the age of the buildings involved. Most projects focus on offices that are already several decades old – not because they are outdated in every sense, but because their design makes them easier to adapt.

Older buildings typically have narrower floor plates, which allow more units to access natural light – a key requirement for residential use. They also often feature operable windows and structural layouts that simplify reconfiguration.

By contrast, newer office buildings tend to have deeper floor plans and large glass facades, which can complicate residential conversions. In many cases, these properties are better suited for continued office use or full redevelopment rather than conversion.

In practice, not every office building can be converted. Even as more projects move forward, only certain properties have the right layout and features to make the switch to residential use.

NEW YORK CITY LEADS, BUT ACTIVITY IS SPREADING NATIONWIDE

New York City leads the office-to-apartment conversion landscape, with the largest pipeline of units nationwide in 2026: over 16,000 units. A combination of older office stock, strong demand for rental housing, and supportive policy changes has helped position the city at the forefront of adaptive reuse.

But the trend is no longer limited to coastal gateways. Cities across the Midwest and South are increasingly embracing conversions to reinvigorate downtown areas and add housing without relying solely on new construction.

Chicago and Cleveland, for example, are making use of historic office buildings to bring residents back into their urban cores. Washington, D.C., is another key player, supported by local incentives aimed at encouraging office repositioning. Meanwhile, Los Angeles is seeing steady activity, particularly in its downtown area.

Future office-to-apartments by metro area (Table)

Smaller metros are also embracing the trend. In these markets, conversions can play a key role in revitalizing central business districts that have seen reduced foot traffic in recent years.

POLICY SUPPORT HELPS CLOSE THE GAP

Office conversions can be complex and costly, often requiring significant upgrades to meet residential building codes and tenant expectations. That’s where policy support comes into play.

Cities across the country are introducing zoning changes, tax incentives and streamlined approval processes to encourage adaptive reuse. New York City, for instance, has expanded eligibility for office-to-residential conversions, opening the door for more projects. Washington, D.C., has implemented financial incentives aimed at jumpstarting activity.

These measures are helping bridge the financial gap that can make conversions challenging, particularly in markets where construction costs remain high.

At the same time, public-private collaboration is becoming increasingly important. By aligning development goals with housing needs, cities can use conversions as a tool to address both office vacancies and housing shortages.

CHALLENGES PERSIST, BUT MOMENTUM IS BUILDING

Despite its growth, the conversion trend still faces limitations. Structural constraints, financing hurdles and high construction costs can all impact project feasibility. In some cases, developers may find that only a portion of a building can be converted, or that costs outweigh potential returns.

Even so, as office demand stabilizes at lower levels and housing needs remain pressing, conversions are likely to remain part of the development mix.

Beyond adding units, these projects also contribute to more balanced urban environments. They help bring residents into office-heavy districts and support local businesses by attracting increased foot traffic and creating more active neighborhoods.

A PRACTICAL PATH FOR ADDING HOUSING

Office-to-apartment conversions are not a silver bullet for the housing shortage, but they are becoming an increasingly practical solution in the right contexts. For developers, they offer a way to reposition underperforming assets. For cities, they provide a strategy to breathe new life into downtown areas. And for renters, they expand housing options in locations that might otherwise see little new supply.

For more insights, charts and a detailed methodology, read the full report on RentCafe.com.

This post was originally published here

Shant Banosian doesn’t believe that retail mortgage lenders are at a cost disadvantage when pitted head-to-head against wholesale competitors.

Banosian, the Massachusetts-based originator and president of Chicago-based Rate, pointed to data showing that independent mortgage banks (IMBs) and their retail-heavy presence are responsible for 84% of single-family mortgages in the U.S.

Although wholesale lenders do not carry the overhead costs of the retail branch model, individual brokers do. And retail lenders, he said, compete against the collective wholesale market despite the continued dominance in that arena by United Wholesale Mortgage and Rocket Mortgage.

Banosian also pointed to his company’s large technology investments, which he says have resulted in lower costs and additional savings for borrowers through competitive rates and lower fees. He labels Rate’s model as “relationship-driven,” with the core of the business centered on partnerships rather than consumer-direct outreach.

“There’s nothing more powerful in the entire mortgage industry than those relationships with our consumers, with our partners, like real estate agents and financial advisers,” Banosian said.

It’s these factors that led Rate to place 424 of its loan officers on the inaugural HousingWire Mortgage Rankings, which measured 2025 production and included LOs who did at least 60 loans or $20 million in volume.

Rate’s 424 LOs on the list accounted for $20.64 billion in volume, or nearly $49 million per producer, according to HousingWire’s AI-driven internal data analysis. And Banosian was the country’s second-ranked producer with $638.6 million across 901 loans.

Dissecting the numbers

HousingWire’s analysis found that Rocket Mortgage led the way by a wide margin with 1,729 Top Originators by Loan Amount. Second place went to CrossCountry Mortgage at 743, with JP Mortgage Chase and Mortgage Research Center (dba Veterans United Home Loans) next at 595 and 555, respectively.

Measured by aggregate volume, the top producers at Rocket originated $64.12 billion in 2025, followed by CrossCountry ($35.61 billion), Chase ($29.36 billion), DHI Mortgage ($25.68 billion) and Veterans United ($23.29 billion).

visualization

Heather Lovier, chief operating officer of Rocket Companies, told HousingWire that Rocket’s success in 2025 is attributed to a multifaceted approach — including its mission to help everyone buy a home, brand positioning and strategic investments in AI to enhance efficiency.

“The last five years, more intensely the last three years, being so heavily focused on AI and creating efficiencies for our mortgage bankers … has been a strategic priority, and it’s really starting to pay off, which we saw in 2025,” Lovier said. 

Lovier also said that Rocket’s acquisitions of Mr. Cooper Group and Redfin put more products on the table that were not previously available. Specifically, the acquisition of Redfin’s mortgage arm, Bay Equity, has been a key driver. 

“Purchase is absolutely a main focus for us to continue to drive market share in that facet. And because of our acquisitions, we’ve been able to expand into the market,” she said. “For example, Rocket Local, which has our loan officers out in the market, we have more than doubled the folks there with the Bay Equity acquisition. So we have over 500 folks out in the local markets, helping clients and agents as we continue to expand our reach.”

As for specific products to boost growth for the Detroit-based fintech, Lovier said that the company’s closed-end second-lien product has been a “game changer,” with most of the loans closing in as little as 10 days.

Keeping up the momentum

After taking on the role of company president last year, Banosian said he has focused on teaching LOs to be “rainmakers” and the “CEOs of their business.” Their winning formula, he explained, is platform + people + playbook, with lead generation, scaling and relationship management at the forefront of strategy.

Along with that three-pillar formula, Banosian said it’s crucial to understand that structuring specific deals is an art form, so the LOs who are experts on product guidelines and can explain the benefits to clients will win more business.

“I win deals because I am a professional loan officer. … I’ll win a deal where a competitor could offer the same product — the loan officer just doesn’t know about it or doesn’t know how to articulate it,” he said.

Lovier, meanwhile, expects to see continued heavy investments in AI and in the company’s wholesale arm, Rocket Pro. While the end goal is efficiency and “meeting clients where they are,” the rollout of any offerings is intentional. 

“I think the way that we think about it is, we don’t try to roll out new products or new offerings every single week. We try to limit it to either monthly or quarterly, because you also want to give time for folks to adjust and adapt,” she said.

This post was originally published on here

SERHANT. is expanding into California, opening across Los Angeles, San Diego, Orange County, San Francisco and Tahoe with agents who closed more than $2 billion in sales over the past 12 months, the brokerage announced Tuesday.

The firm said this move marks its largest market launch by sales volume. The company will base its California operations in Beverly Hills.

The California launch follows SERHANT.’s entry into Massachusetts in January and brings the firm’s footprint to 16 states and Washington, D.C. since it began expanding outside New York in 2023. The company now operates in Arizona, California, Connecticut, Florida, Georgia, Maryland, Massachusetts, New Jersey, Nevada, New York, North Carolina, Pennsylvania, Rhode Island, South Carolina, Virginia and Washington, D.C., with more than 2,000 agents and 200 full-time team members.

SERHANT. said it focuses on building around local principals rather than acquiring existing brokerages, emphasizing an “agent-first” model.

“The demand for SERHANT. in California made this move a natural next step,” Ryan Serhant, the company’s founder and CEO, said in the announcement. “Agents today want to stand out, build their brand and plug into a technology platform that drives real growth. That is what we have created. We’re not expanding for the sake of it, we’re expanding because the market is demanding it.”

The firm’s California operations will be led by managing director and principal broker Ezra Leyton, based out of Beverly Hills. Leyton is a 23-year industry veteran with a background in luxury residential and commercial real estate, capital markets and alternative investments. He previously served as executive director and COO of MARQUIS Commercial Properties and executive director, head of North America operations for MARQUIS Capital Management, overseeing multi-billion-dollar portfolios. Over his career, Leyton has sold more than $2.5 billion in residential and commercial properties, recruited and trained more than 300 agents and brokers, and advised institutional clients including Credit Suisse, Pretium Partners, Angelo Gordon, RBS, UBS and Goldman Sachs.

“There is only one brokerage that embodies an experienced-based approach to real estate, which is SERHANT. Our vision and goals align in bringing the very best in residential and commercial real estate investments to our clients across the globe,” Leyton said in a statement.

In Los Angeles, SERHANT. is recruiting a roster of high-volume agents with strong media and luxury credentials. The agents include Ben Belack, who is joining from The Agency and will serve as executive vice president, California; Courtney Poulos, the founder of ACME Real Estate, is joining as a founding member and broker associate and coming to SERHANT. with more than 21 years of experience in the industry; and Patrick Michael, a luxury focused team leader, who is joining as a broker associate and founding member.

In Orange County, SERHANT. is welcoming former Compass-agent and leader of The Annie Clougherty Team, Annie Clougherty, who brings more than 20 years of experience and nearly $1 billion in career sales. Other agents joining the Orange County operation include Todd Davis, Jorge Anzaldi and Greyson Benson who are also joining SERHANT. from Compass under Team Todd; and Brooks Bailey, a former eXp Realty agent who is joining as a founding member.

Malena Boetel and Amber Welch, who are based in San Diego, are also joining SERHANT. from eXp. They are joining as founding members and co-leaders of Exclusive Group. Also based out of San Diego are Manuel Sanchez, who is coming from The Agency, Robyn Flint, who is making the move from The Real Brokerage and is the leader of Dwell Group.

In the San Francisco Bay area, SERHANT. is welcoming Lisa Smith the leader of Smith & Co. from Engel & Völkers; Milana Ostroy, who serves as president of the Women’s Council of Realtors and has over 25 years of experience; Viviana Cherman, a Pleasanton-based agent, who specializing in the Tri-Valley; and Amie Quirarte, who is coming from Chase International Real Estate and join as a founding member and founder of Q Group Tahoe, a boutique team focused on luxury lakefront and high-value residential sales across North Lake Tahoe in California and Nevada.

In 2025, SERHANT. closed $7.13 billion in sales volume, good enough for the N0. 22 rank in the nation in the 2026 RealTrends Verified Rankings.

This article was written by Brooklee Han and generated with the assistance of HousingWire Automation. It was reviewed by a HousingWire editor before publication. The system helps convert company announcements and industry data into HousingWire-style news coverage.

This post was originally published on here

There is a special flavor of exhaustion that only independent contractors know. It is not the regular tired that comes from a long day. It is the deep-space fatigue of being your own boss, HR department, marketing team, IT help desk, billing office, custodian, and emotional support animal. You do not clock out. Then layer on top of that being “on” for hours and hours every day as you shepherd people through one of the most stressful transactions of their lives. You just eventually pass out with your laptop still open and your phone sitting on your chest like a needy toddler.

So let’s talk about self-care and boundaries in a way that does not require lighting sage or screaming affirmations into a mirror. Because for people who work for themselves, self-care is not a luxury. It is plumbing. It keeps the whole system from exploding.

And, unfortunately, it is also harder for you than for almost anyone else.

Why self-care is harder when you work for yourself

Your job demands and resources are wildly misaligned

Employees complain about stress, and that is fair. But independent contractors play on a different difficulty setting. Psychologists have this thing called the Job Demands-Resources model, which is a fancy way of saying burnout happens when the seesaw tips too far in the wrong direction. Who knew it had a name… not me. Now we all do.

Traditional employment: High demands, but also built-in resources. Paid time off. Sick days. A manager. Coworkers to vent to. An IT person who shows up when the printer starts making sounds like a dying goose.

Your world: High demands on top of demands. Emotional labor. Sales calls. Client crises. Financial uncertainty. And your only built-in resource is… you. And coffee. And possibly a second, emergency coffee. With a whiskey neat screaming, “Put me in coach!”

Everything in the structure of independent work pushes you toward burnout unless you actively build rails to keep yourself upright. That imbalance is not a moral failing. It is math.

Your boundaries are basically a suggestion unless you enforce them

Employees get boundaries baked into the job. They have work hours. They have an office. They have a boss who might send a message at 9 p.m., but at least there is the illusion that this is unusual.

You, however, have none of that. What you have is a phone that never sleeps with three backup batteries and a culture that constantly whispers, “If you are not available 24 hours a day, you clearly do not care about your business.”

Independent contractors live in a constant tug-of-war between wanting to be responsive and wanting to lie on the floor in silence for an hour. And since no one protects your time except you, you end up being the worst boss you have ever had. Longer hours, fewer breaks, and a general sense of “I’ll rest when everything is done,” which is adorable because everything is never done.

Your inner manager is often a tyrant with a motivational poster problem

Employees get supervisors. You get self-talk. And for many people who work for themselves, that inner voice is less like a supportive leader and more like a judgmental gym teacher from the 80s yelling, “You could be doing more.”

But here is the catch. All the research on self-compassion shows that people who treat themselves with kindness under stress are more productive, more resilient, and more likely to follow through on their goals. In other words, you would get more done if you stopped talking to yourself like a disappointed parent at a middle school talent show. (One note here, my middle schooler crushes talent shows… just in case she reads this someday)

This mix of structural pressure, fuzzy boundaries, and harsh inner dialogue is a perfect recipe for burnout. Which is why self-care is not optional. It is survival.

Self-care that works in the actual real-life messiness of independent work

Let’s skip the Pinterest version of self-care. No bubble baths unless that is your thing. No “just breathe more” nonsense. Below are moves that real independent contractors can actually implement without quitting their jobs to go herd goats in Iceland.

Put your work hours in writing, even if it feels silly

One of the biggest predictors of burnout is not how many hours you work. It is the fact that you never truly stop working. When you work for yourself, the day has no edges. Your tasks sprawl into the evening, leak into your weekends, and occasionally slide into the moments when you should be sleeping but instead are Googling “how to invoice politely.”

Here is the fix. Write down your work hours. Not the hours you wish you worked. The hours you realistically plan to work. Then add a hard stop time every day, a weekly deep focus block, and a weekly no-work block where even your brain is not allowed to pretend to solve problems.

Will you break these rules sometimes? Sure. But structure is not about perfection. It is about giving your life an outline so your work has somewhere to live that is not inside your skull 24 hours a day.

Treat boundaries as a professional tool instead of a personal failing

People act like boundaries are personality traits. Like some people are naturally good at saying no, and the rest of us are defective golden retrievers who keep fetching the ball no matter how tired we are. Boundaries are a skill, not a temperament.

Here is the mindset shift: a boundary is not a wall to keep people out. It is a guardrail that keeps you from driving off a cliff.

Here is a conversation I have often:

Me: “When is the last time you took a day off?”
Agent: “A few months ago, we went to Hawaii.”
Me: “Did you have an email auto responder on, and did you change your voicemail?”
Agent: “Um… no.”
Me: “So you took the day off but didn’t tell anyone, then got annoyed when they messaged you, called them back anyway, and did it all again 45 minutes later…” Sound familiar?
Agent: “Well, when you put it that way, I haven’t taken a day off in years.”

So maybe try this:

“Fridays are the day I normally take off. Of course, I can jump in if something urgent pops up, but that’s the one day I try to put myself first, so I’m fresh and sharp for you the other six days of the week. If something truly cannot wait, just give me a heads up, and I’ll step in. Otherwise, I’ll hit the ground running Saturday.”

Notice how none of that apologizes for existing.

They will still call you on your day off. But now it sounds like, “Hi… SO sorry to call you on your day off, no rush…” And yes, you will probably still call them back because you’re wired that way. But the difference is you didn’t have to. That is the shift.

Build a tiny daily reset that keeps you human

You do not need a spiritual awakening. You need a reset button. Fifteen minutes. That is it. Two minutes of reading something grounding. Three minutes of quiet. Five minutes of journaling on one question: “What is weighing on me right now?” Five minutes choosing one action that would lighten that weight today.

It is not glamorous. It is maintenance.

For me, it is what I call my “clot walk.” I got a blood clot last year from sitting too much. My career literally tried to kill me (ok, that is a bit hyperbolic, but you get it), so now, a few times a day, I take a quick walk. Five minutes on a bad day, fifteen on a good one. A little outside time, a playlist, or a podcast… it works.

Stop trying to be an island with WiFi

Isolation is one of the most corrosive parts of self-employment. Humans need other humans who get it. Not motivational quotes. Not hustle memes. Real conversation.

So pick one: a weekly check-in with a colleague, a small peer group, or a therapist or coach who will call you out when you start working like a raccoon running on adrenaline and hope.

Independence does not mean isolation. You can be self-employed without being self-contained. Shoot, I do all three… so why pick one?

Create one selfish habit and defend it with unreasonable loyalty

There is nothing noble about sacrificing every minute of your life to your business. It does not make you more committed. It makes you unreliable because eventually you break.

Pick one selfish habit and make it non-negotiable. A daily walk without your phone. Seven to eight hours of sleep. Reading something that has zero business purpose. A workout you actually enjoy. A hobby that reminds you that you are not just a productivity appliance.

One habit. Defended aggressively.

Mine is 20 minutes of reading a day. Somehow, I still feel guilty when I sit down to do it, which is ridiculous because it makes me better at running companies, writing, and everything else I do. It is literally part of the job.

The quiet promise beneath all this

You are the engine of your business. That is the gift and the curse. If the engine breaks, everything stops.

Self-care is not softness. It is a strategy. It is the only insurance policy that actually works. It is the decision to stay human inside a career that can turn you into a machine if you are not careful.

You do not need to overhaul your entire life. You need one boundary. One habit. One moment of structure. One conversation you have been avoiding.

The goal is not perfection. The goal is still liking yourself a year from now.

And that starts with one small step that protects the human doing all the work.

Keith Robinson, Co-CEO for NextHome, Inc. and co-host of the Real Estate Insiders Unfiltered podcast.

This column does not necessarily reflect the opinion of HousingWire’s editorial department and its owners. To contact the editor responsible for this piece: tracey@hwmedia.com

This post was originally published on here

The National Association of Realtors (NAR) has notched another favorable legal outcome.

On Monday, Florida-based U.S. District Court Judge William Dimitrouleas dismissed NAR, as well as 11 Florida associations/MLSs from the lawsuit on the recommendation of Magistrate Judge William Matthewman.

In early March, Judge Dimitrouleas adopted another report by the magistrate judge dismissing Connecticut Association of Realtors (CT Realtors) and Connecticut-based Smart MLS, as well as Arizona-based West and Southeast Realtors of the Valley (WeSERV) from the lawsuit. 

The parties have been dismissed from the suit without prejudice meaning that the plaintiff Jorge Zea could refile his lawsuit. This ruling comes after Zea failed to file any objections to Magistrate Judge Matthewman’s report, which was filed in late March. 

The associations dismissed from the lawsuit are: Beaches MLS; Broward, Palm Beaches & St. Lucie Realtors; Miami Realtors; Orlando Regional Realtor Association; Florida Gulf Coast MLS; Stellar MLS; Space Coast MLS and Space Coast Association of Realtors; RealMLS; Northeast Florida Association of Realtors and Central Panhandle Association of Realtors.

Lawsuit claims a coordinate scheme

Filed in August, the lawsuit claims that the defendants engaged in a “coordinated scheme” to restrict consumer choice and maintain elevated prices, harming his brokerage model.

Zea runs www.snapflatfee.com, a brokerage that charges sellers a listing fee in exchange for limited services. Zea’s firm syndicates listings data to the MLS data feeds and forwards all buyer leads “regardless of their origin” directly to the seller.

According to Zea, buyer’s agents associated with the defendants steer clients away from properties that offer a reduced or nonexistent buyer’s agent commission. In his complaint, he argues that this steering is the result of the NAR and the other defendants not enforcing their own rules. 

The rules in question relate to the mandatory display of a listing broker’s contact information on the listing page in an IDX display; the commission lawsuit mandate for buyer agency agreements; and the prohibition of MLS platforms from allowing users to search or filter results by the name of the listing broker or agent, or by the amount of compensation offered.

By allegedly refusing to enforce these rules, Zea claims that the defendants have competitively disadvantaged his discount-brokerage business.

In his report, Magistrate Judge Matthewman called the complaint “deficiently pled” and recommended it be dismissed. Additionally, the judge highlighted several instances of the cases cited by Zea in his filings not existing and being the result of AI hallucinated law. Due to this, the magistrate judge recommended that the court admonish Zea for this. In his ruling Judge Dimitrouleas adopted this recommendation and admonished the plaintiff  “over his improper use of artificial intelligence and concomitant misrepresentations to the Court.” 

If Zea continues this behavior, the judge wrote that “severe sanctions may be imposed” against him.

In an emailed statement, an NAR spokesperson wrote that the trade organization is pleased with the court’s decision. 

“As we have previously stated, the National Association of Realtors fosters a fair, transparent, and competitive real estate marketplace,” the spokesperson wrote. “Steering is a prohibited practice under NAR policy and the Realtor Code of Ethics. The Code of Ethics is enforced by state and local Realtor associations, and the enforcement of MLS rules are handled by each MLS.”

This ruling comes just days after NAR announced that it has settled the homebuyer commission lawsuit claims by opting into the Tuccori lawsuit settlement.

This post was originally published on here

The Pride flag will be displayed permanently at Stonewall National Monument in Greenwich Village after the Trump administration agreed to reverse its decision to remove it. As part of a court settlement reached on Monday, the federal government agreed to reinstall three flags on the monument’s flagpole within a week, according to the Associated Press. Filed by a group of nonprofits after the flag’s removal on February 9, the lawsuit argued that the administration illegally targeted LGBTQIA+ people and violated a policy allowing the National Park Service (NPS) to display “non-agency” flags at federal sites when they provide historical context.

“This is a victory for the LGBTQ+ community and for our entire city. It’s a reminder that New Yorkers won’t let our history be rewritten,” Mayor Zohran Mamdani said in a post on X. “Our administration will keep working to ensure LGBTQ+ New Yorkers can live safely and with dignity in our city.”

The flag was removed in February due to a January 21 guidance issued by the U.S. Department of the Interior, which stated the NPS may fly “only the US Flag, flags of the DOI, and the POW/MIA flag.” This includes limited exceptions for flags “provide historical context, such as earlier versions of the U.S. flag at a historic fort, or are part of historic reenactments or living history programs.”

On February 17, a coalition of nonprofits led by a foundation honoring Gilbert Baker, the artist who created the Pride flag in 1978, filed a federal lawsuit against the administration in an effort to restore the symbol. The suit argued that the Pride flag falls under those limited exceptions allowing “historical context” at federal sites, as reported by the New York Times.

The coalition, which also includes Village Preservation and Equality New York, argued that the decision to remove the flag was not about adhering to the guidance but instead another attack on the LGBTQIA+ community by the Trump administration.

Days after it was removed, NYC officials and hundreds of New Yorkers re-raised the flag at the site, where it has since flown in an unofficial capacity, though it could have been removed at any time. Weeks later, Sen. Chuck Schumer and Rep. Dan Goldman introduced legislation to make the Pride flag congressionally authorized, seeking to amend the guidance.

Manhattan Borough President Brad Hoylman-Sigal, who helped organize February’s flag re-raising, celebrated the settlement.

“We fought the Trump administration—and we won. I’m thrilled that after we rallied and re raised the Pride flag with elected officials and advocates on February 13, the Trump administration has blinked and backed down from its contemptuous attempt to erase American history,” he said.

Located next to the historic Stonewall Inn on Christopher Street, the monument commemorates the June 28, 1969, police raid that sparked three days of protests and ignited the modern LGBTQ+ rights movement, as 6sqft previously reported.

In 2016, former President Barack Obama designated the site, including the bar, Christopher Park, and surrounding streets, as a national monument. During the Biden administration, advocates successfully pushed the federal government to allow a Pride flag to fly on federal land within the park, according to Gay City News.

The flag’s removal in February marked a continued assault on the LGBTQIA+ community by the Trump administration.

Last year, the NPS also removed transgender references from its Stonewall National Monument webpage. The agency deleted the words “transgender” and “queer” from the LGBTQ+ acronym on the site, following a series of executive actions by Trump that rolled back transgender rights, including banning trans people from women’s sports, the military, and minors from receiving gender-affirming care, as 6sqft previously reported.

Months later, the NPS removed several references to the word “bisexual” from the site. In 2025, the administration also discontinued the existing Pride flag design, which displayed black and brown stripes and Trans flag colors, and permitted only the standard Pride flag to fly on the flagpole.

RELATED:

The post Trump administration agrees to display Pride flag at Stonewall after lawsuit first appeared on 6sqft.

This post was originally published here

Chris Martin, a senior economist on Glassdoor’s economic research team, also provided data and analysis for this report.

From higher starting salaries to affordable starter homes, some cities give young people a serious leg up. From Omaha to Anchorage to Hilton Head Island, here are the standout big, medium, and small cities for recent college graduates. 

The tassels are turned, the diplomas are framed, and next comes the big question: Where should recent college grads plant roots? This new Redfin and Glassdoor analysis reveals which big, mid-sized and small U.S. cities offer the best mix of career opportunity, housing affordability and work-life balance for young professionals. 

Washington, D.C. ranks as the best big city in the U.S. for recent college graduates, according to a new Redfin and Glassdoor analysis. The nation’s capital tops the list because recent grads earn big paychecks relative to other large cities, there’s a lot of career opportunities, and the city offers great work-life balance. 

New Orleans comes in first for mid-sized cities, largely because starter homes are  affordable and early-career wages are growing at a faster clip than rent. Springfield, IL leads among small cities, with recent college grads attracted to its high starting salaries, strong job-growth potential and transit friendliness.

This is according to a Redfin-Glassdoor ranking of the best U.S. metro areas in the U.S. for recent college graduates, broken into three categories: Big, medium-sized and small. For this report, metro areas are referred to as “cities.” We ranked places based on factors related to housing, jobs, and quality of life using several different metrics. Please see the end of this report for more details on methodology.  

Big Cities


1. Washington, D.C.


Average annual early-career earnings: $79,857

Price of typical starter home: $320,000

Years to save for down payment: 4 years, 2 months

Monthly mortgage payment as % of income: 31.6%

Monthly rent as % of income: 34%

What makes the city rad for recent grads: Work-life winner  //  Strong starting salaries  // Jobs galore

The nation’s capital ranks as the best big city for recent college grads because it has a robust entry-level job market offering strong salaries, and while housing isn’t exactly cheap, it’s more affordable than many other big coastal cities. The top sector for early-career workers is tech, but D.C. also offers junior jobs aplenty in government and government-adjacent organizations, like think tanks, defense contractors, consultants and law firms. D.C. has 19 job postings per 100 workers, the most of any big U.S. city. But it’s not all work, all the time: The U.S. capital is one of the cultural centers of the U.S., offering not only unique landmarks, but a thriving food and drinks scene at places like The Wharf and Union Market.

“D.C. is a place of opportunity,” said Andre Margutti, a local Redfin Premier agent. “Students graduate from Georgetown or George Washington University, and they stay because there are so many job prospects. Or they graduate from school in an entirely different part of the country, and they move here for the same reason. And it’s not just in the federal government and related industries–our area attracts a lot of doctors, and a lot of international students stay in the area to work in finance for a place like the IMF or the World Bank.”

2. Omaha, NE


Average early-career earnings: $59,123

Price of typical starter home: $195,000

Years to save for down payment: 3 years, 8 months

Monthly mortgage payment as % of income: 26%

Monthly rent as % of income: 28%

What makes the city rad for recent grads: Job variety  //  New grads love their jobs  //  Work-life winner

A starter home in Omaha costs less than $200,000, which is affordable to someone earning the typical entry-level salary of around $59,000. The most popular career path for recent grads in the Nebraska town is healthcare, but it’s also home to several Fortune 500 companies, including Berkshire Hathaway, Union Pacific and Mutual of Omaha. Not only do college grads report enjoying their jobs, but they also report strong work-life balance–especially for those immersed in the city’s thriving music and brewery scene. 

“I’m currently helping a young couple move from North Carolina to Omaha,” said Justin Gomez, a Redfin Premier agent in Omaha. “People move here from many different parts of the country because there’s a great community for the younger crowd: We have a lot of colleges in the area, and there are so many fun events like the annual college baseball tournament. It doesn’t hurt that we have a lot of well-paying jobs, including at the University of Nebraska Med Center and the Offutt Airforce Base–and with a lot of homes selling for under $300,000, young grads actually have a shot at purchasing a house.”

3. Boston, MA


Average early-career earnings: $80,026

Price of typical starter home: $460,000

Years to save for down payment: 6 years, 8 months

Monthly mortgage payment as % of income: 45.3%

Monthly rent as % of income: 53%

What makes the city rad for recent grads: Strong starting salaries  //  Work-life winner  //  Pedestrian paradise

The typical recent grad in Boston earns $80,000 per year, the highest average starting salary of all the cities in this top 10 list. The city’s most popular sector for recent grads is tech, though it’s also home to a lot of jobs in biotech, healthcare, education and research. Boston is also a work-life winner, with twenty-somethings working hard by day and catching a game at Fenway Park or meeting friends at a beer garden at night. 

“Boston naturally has a big population of young people because there are so many colleges here, from Harvard to MIT to Boston College,” said Aditi Jain, a local Redfin Premier agent. “A lot of employers have offices in Boston to attract grads from those prestigious places and keep them in the city. There’s also a strong startup culture across biotech, finance and software, and a lot of those companies also offer well-paying jobs, enticing both people who attended college in Boston and those who are moving there from a different part of the country. We have a lot of new condos, which are perfect for young professionals, and the city is walkable and has fantastic public transportation; you can get anywhere for two dollars and a subway ride.”

4. Dallas, TX


Average early-career earnings: $67,451

Price of typical starter home: $240,000

Years to save for down payment: 4 years, 1 month

Monthly mortgage payment as % of income: 28%

Monthly rent as % of income: 26%

What makes the city rad for recent grads: Career-growth potential  //  Rent won’t bust budget

Dallas is home to 24 Fortune 500 company headquarters, including American Airlines, AT&T and Toyota, offering abundant entry-level jobs. The Texas city is known for legendary barbecue spots and live music, perfect for young professionals unwinding after a long week of work. Dallas is unique because it’s well-rounded; it is relatively affordable, fairly high-paying for early-career workers, and there’s plenty to do for young professionals.

5. Chicago, IL


Average early-career earnings: $72,786

Price of typical starter home: $202,000

Years to save for down payment: 3 years

Monthly mortgage payment as % of income: 21.9%

Monthly rent as % of income: 28%

What makes the city rad for recent grads: Affordable starter homes  //  Strong starting salaries  //  Transit friendly 

The Windy City is home to iconic attractions like Wrigley Field and Navy Pier, along with countless comedy clubs, deep-dish pizza spots and bars. Chicago has a plethora of jobs for early-career workers, from finance to tech to working corporate jobs for companies like McDonald’s or United Airlines.

6. Houston, TX


Average early-career earnings: $ 65,369

Price of typical starter home: $215,000

Years to save for down payment: 3 years, 7 months

Monthly mortgage payment as % of income: 25.9%

Monthly rent as % of income: 18%

What makes the city rad for recent grads: Job variety  //  Bounced back strong from pandemic  //  Rent won’t bust budget

Everything’s bigger in Texas–especially the number of job opportunities. Houston has a mix of industries, from aerospace engineering at NASA to healthcare at the Texas Medical Center, the world’s largest medical facility. It’s also known for vibrant nightlife, including live music venues and food halls.

7. St. Louis, MO


Average early-career earnings: $ 61,834

Price of typical starter home: $ 150,000

Years to save for down payment: 2 years, 7 months

Monthly mortgage payment as % of income: 19.1%

Monthly rent as % of income: 23%

What makes the city rad for recent grads: Plenty of starter homes  //  Job variety  //  Work-life winner

Not only does St. Louis have a lower cost of living than coastal cities, but it’s also home to a variety of entry-level jobs. The most popular industry is healthcare, and there are also opportunities in finance, tech and engineering, among other industries. Twenty-somethings enjoy free attractions like the City Museum and Gateway Arch, along with world-class museums and dining.

8. San Diego, CA


Average early-career earnings: $ 74,053

Price of typical starter home: $ 615,000

Years to save for down payment: More than 10 years

Monthly mortgage payment as % of income: 65.4%

Monthly rent as % of income: 64%

What makes the city rad for recent grads: Strong starting salaries  //  New grads love their jobs  //  Work-life winner

When San Diegans aren’t working, they’re at the beach: riding bikes along the coastline, scuba diving, surfing, kayaking or simply sunbathing. But don’t let the city’s laid-back vibes fool you: It’s one of the country’s biggest biotech hubs, and it’s also home to many entry-level positions in industries like healthcare and gaming. Living in San Diego is worth it for those who can afford higher housing costs.

9. Miami, FL


Average early-career earnings: $ 62,748

Price of typical starter home: $ 210,000

Years to save for down payment: 3 years, 11 months

Monthly mortgage payment as % of income: 26.4%

Monthly rent as % of income: 33%

What makes the city rad for recent grads: Career-growth potential  //  Job variety  //  Bounced back strong from pandemic

Whether grads want to work in retail, wholesale, construction, real estate, tourism, aviation, healthcare, or any of Miami’s many industries, the city has entry-level jobs for everyone. Add Miami’s white-sand beaches, turquoise water and endless nightlife, and the South Florida city is a twenty-something’s dream.

10. Austin, TX


Average early-career earnings: $ 72,025

Price of typical starter home: $ 276,600

Years to save for down payment: 4 years, 1 months

Monthly mortgage payment as % of income: 30.3%

Monthly rent as % of income: 35%

What makes the city rad for recent grads: Jobs galore  //  Work-life winner  //  New grads love their jobs

The “Live Music Capital of the World” is home to music venues and festivals like SXSW and Austin City Limits, and places like Barton Springs Pool and Lady Bird Lake also make it a paradise for water lovers. Industries like healthcare, tech and education offer many entry-level jobs, and Austin’s slow housing market makes it a good time for young buyers to break in.

Mid-Sized Cities


1. New Orleans, LA


Average early-career earnings: $ 57,414

Price of typical starter home: $ 175,000

Years to save for down payment: 3 years, 1 months

Monthly mortgage payment as % of income: 24%

Monthly rent as % of income: 32%

What makes the city rad for recent grads: Job variety  //  Pedestrian paradise  //  Transit friendly

New Orleans is unique: Recent grads can catch live jazz on Frenchmen Street, eat the famous beignets at Cafe du Monde and take ghost tours in the French Quarter–and once a year, they have front-row seats to Jazz Fest and Mardi Gras. 

It’s a great city for young professionals because in addition to the nonstop fun, New Orleans has a lower cost of living than many other major cities, and there are lots of jobs in industries like hospitality, energy, education and aerospace. The most popular sector for recent grads is healthcare. 

“New Orleans is a whole vibe,” said Jason Gale, a local Redfin Premier agent. “There’s Mardi Gras and Jazz Fest, of course, but every day of the year there’s live music, world-class food, endless parties–and almost everything is walkable. You can stay in your own neighborhood for an entire weekend, walk to different bars, restaurants and shops, and never run out of things to do. For young, first-time buyers, now is a good time to get into the market because sellers are cutting their prices.”

2. Palm Bay, FL


Average early-career earnings: $ 65,010

Price of typical starter home: $ 210,000

Years to save for down payment: 3 years, 9 months

Monthly mortgage payment as % of income: 25.4%

Monthly rent as % of income: 25%

What makes the city rad for recent grads: Strong starting salaries  //  Work-life winner

Palm Bay, located on Florida’s east coast about halfway between Daytona Beach and Palm Beach, is a hidden gem for recent grads–and it’s not just because it’s more affordable than other coastal towns. It’s about an hour away from both Orlando’s theme parks and Kennedy Space Center, and it’s home to outdoor adventures like bass fishing and kayaking. Plus, Palm Bay is one of Florida’s fastest-growing tech hubs, with many entry-level positions at aerospace companies like SpaceX and Blue Origin. It also has plenty of retail jobs. 

“Here’s the thought process for recent grads: ‘I can move to Palm Bay or somewhere else in Brevard County and get a great, high-paying job right out of school, pay off my student loans, live in a nice, new property without paying too much or dealing with too much maintenance, and get to a beautiful beach within 15 minutes on the weekend,” said Juan Castro, a Redfin Premier agent in the Orlando area. “Palm Bay is known as the ‘Space Coast’ because it’s home to Blue Origin and many other companies focused on space exploration. For young people, living there is attractive because it’s less expensive than neighboring towns but still offers proximity to a lot of jobs.”

3. Wichita, KS


Average early-career earnings: $ 55,285

Price of typical starter home: $ 144,535

Years to save for down payment: 3 years, 1 months

Monthly mortgage payment as % of income: 20.6%

Monthly rent as % of income: 17%

What makes the city rad for recent grads: Plenty of starter homes  //  Affordable starter homes  //  Career-growth potential

Wichita may fly under the radar for college grads from the coasts, but it’s worth considering for its affordable cost of living, unique entertainment and potential for major career growth. The city’s number-one industry for recent grads is aerospace, and it’s also home to Cargill, one of the nation’s biggest food and agricultural companies. To wind down after work, twenty-somethings can head to one of the city’s famous retro arcades or take in a dinner theatre show.

4. Mobile, AL


Average early-career earnings: $ 53,030

Price of typical starter home: $ 169,900

Years to save for down payment: 3 years, 5 months

Monthly mortgage payment as % of income: 25.2%

Monthly rent as % of income: 23%

What makes the city rad for recent grads: Pay outpaces rent  //  Career-growth potential  //  Low rents relative to income

A little known fact about Mobile: It’s the birthplace of Mardi Gras in the U.S., predating New Orleans’ celebrations, and it still hosts elaborate celebrations and costume parades through historic districts. The affordable Southern city also has a walkable downtown and proximity to Gulf Coast beaches. On the work side, Mobile is a major hub for aviation manufacturing and shipbuilding, and it also has opportunities in healthcare, logistics and construction.

5. Anchorage, AK


Average early-career earnings: $ 65,864

Price of typical starter home: $ 240,000

Years to save for down payment: 3 years, 11 months

Monthly mortgage payment as % of income: 28.7%

Monthly rent as % of income: 31%

What makes the city rad for recent grads: Strong starting salaries  //  Career-growth potential

Anchorage is one of the only places in the country where you can spend the day photographing glaciers and fishing for salmon and the night dining at a four-star restaurant. The land of the midnight sun offers grads jobs in oil and gas, tourism, government, transportation, fishing, healthcare and several other industries.

6. Lincoln, NE


Average early-career earnings: $ 53,871

Price of typical starter home: $ 212,000

Years to save for down payment: 4 years, 7 months

Monthly mortgage payment as % of income: 31%

Monthly rent as % of income: 23%

What makes the city rad for recent grads: New grads love their jobs  //  Work-life winner  //  Low rents relative to income

Whether recent grads work in education at the University of Nebraska or manufacturing at Kawasaki Motors, Lincoln is a major employer. And after work, young professionals can take in a college football game or a touring Broadway show, attend farmers markets or take in an outdoor concert.

7. Trenton, NJ


Average early-career earnings: $ 74,570

Price of typical starter home: $ 220,000

Years to save for down payment: 4 years, 9 months

Monthly mortgage payment as % of income: 23.2%

Monthly rent as % of income: 33%

What makes the city rad for recent grads: Affordable starter homes  //  Strong starting salaries  //  Jobs galore

Trenton is more affordable than many other East Coast cities, and it has a strong entry-level job market in industries like education and government. The New Jersey capital also has easy access to both New York City and Philadelphia, and young professionals sticking around Trenton for the weekend can partake in the city’s vibrant art galleries, famous barbecue restaurants and minor league baseball games.

8. Bridgeport, CT


Average early-career earnings: $ 72,503

Price of typical starter home: $ 330,000

Years to save for down payment: 5 years, 11 months

Monthly mortgage payment as % of income: 35.9%

Monthly rent as % of income: 38%

What makes the city rad for recent grads: Strong starting salaries  //  Job variety  //  Transit friendly

Whether grads are looking for a job in manufacturing, healthcare, education, finance, law or construction, Bridgeport is a good place to look. The city offers a fairly affordable cost of living with big-city access, and it’s home to unique recreational activities like outdoor yoga, an award-winning distillery and a famous cabaret theater. 

9. Waco, TX


Average early-career earnings: $ 50,430

Price of typical starter home: $ 180,000

Years to save for down payment: 4 years, 9 months

Monthly mortgage payment as % of income: 28.1%

Monthly rent as % of income: 31%

What makes the city rad for recent grads: New grads love their jobs  //  Career-growth potential

From education to retail to customer service to aerospace, Waco has thousands of entry-level jobs for recent college grads–and it has a lower cost of living than nearby big cities like Dallas or Austin. Outside of work, new grads may enjoy Magnolia Market, made famous by Chip and Joanna Gaines, or hiking and biking along the Brazos River. 

10. Lexington, KY


Average early-career earnings: $ 52,648

Price of typical starter home: $ 211,000

Years to save for down payment: 5 years

Monthly mortgage payment as % of income: 31.6%

Monthly rent as % of income: 34%

What makes the city rad for recent grads: Bounced back strong from pandemic  //  Pedestrian paradise

The University of Kentucky, the state government and a huge Amazon distribution center are some of the biggest employers in Lexington. The “Horse Capital of the World” offers young grads the opportunity to take in world-famous horse racing, and it’s also home to renowned bourbon distilleries.

Small Cities


1. Springfield, IL


Average early-career earnings: $ 59,925

Price of typical starter home: $ 128,000

Years to save for down payment: 2 years, 3 months

Monthly mortgage payment as % of income: 16.8%

Monthly rent as % of income: 16%

What makes the city rad for recent grads: Affordable starter homes  //  Strong starting salaries  //  Work-life winner

Springfield offers young grads career opportunities in healthcare, state government, public policy and education, along with many other industries. Plus, the Illinois capital has a low cost of living, a lively music scene and outdoor recreation along Lake Springfield.

2. Santa, FE, NM


Average early-career earnings: $ 81,848

Price of typical starter home: $ 359,950

Years to save for down payment: 5 years, 7 months

Monthly mortgage payment as % of income: 34.6%

Monthly rent as % of income: 39%

What makes the city rad for recent grads: Strong starting salaries  //  Career-growth potential  //  Work-life winner

Santa Fe draws people in their twenties with a unique arts-and-culture vibe, offering galleries, music venues and outdoor activities in the high desert. For early-career workers, Santa Fe’s economy offers opportunities in state government, tourism and hospitality, healthcare, the arts and nonprofits.

3. Panama City, FL


Average early-career earnings: $ 61,160

Price of typical starter home: $ 230,000

Years to save for down payment: 4 years, 8 months

Monthly mortgage payment as % of income: 29.6%

Monthly rent as % of income: 46%

What makes the city rad for recent grads: Career-growth potential  //  Work-life winner  //  Pay outpaces rent

Panama City is a Gulf Coast playground for people in their twenties, with a laid-back beach lifestyle, waterfront festivals, live music spots and outdoor adventures on St. Andrews Bay. The local economy leans on tech, tourism, hospitality, healthcare, shipbuilding, and government jobs tied to military bases. It offers early-career gigs in hospitality, retail, healthcare support, public services and small businesses. 

4. Hilton Head Island, SC


Average early-career earnings: $ 51,887

Price of typical starter home: $ 317,500

Years to save for down payment: More than 10 years

Monthly mortgage payment as % of income: 48.2%

Monthly rent as % of income: 60%

What makes the city rad for recent grads: Plenty of starter homes  //  Job variety  //  Work-life winner

Recent grads craving a unique out-of-college experience may turn to Hilton Head Island, a classic beach town with miles of coastline to bike, surf, kayak or chill on the beach. When it comes to work, early-career workers will find jobs in an economy fueled by tourism and hospitality, with gigs including retail, resort management and food service. Some people who work on Hilton Head Island live in the South Carolina Lowcountry, just across the bridge.

5. Macon, GA


Average early-career earnings: $ 55,037

Price of typical starter home: $ 139,000

Years to save for down payment: 3 years, 1 months

Monthly mortgage payment as % of income: 19.9%

Monthly rent as % of income: 25%

What makes the city rad for recent grads: Affordable starter homes  //  Jobs galore  //  Job variety

For young adults, Macon is full to the brim with live music, beer gardens and arcade bars. The Southern town’s growing job market is anchored by healthcare, manufacturing and logistics–and as a bonus, housing is affordable.

6. Champaign, IL


Average early-career earnings: $57,356

Price of typical starter home: $ 157,000

Years to save for down payment: 3 years

Monthly mortgage payment as % of income: 21.6%

Monthly rent as % of income: 24%

What makes the city rad for recent grads: Affordable starter homes  //  New grads love their jobs  //  Transit friendly

Champaign is a college town that’s also friendly to recent grads. From eclectic bars to arts festivals and farmers markets to an annual St. Patrick’s Day festival, Champaign keeps twenty-somethings entertained year-round. It also has a strong scene for young workers, with plenty of jobs at the University of Illinois and the growing healthcare, tech and service sectors–plus, there are lots of networking opportunities and job fairs. 

7. Greenville, NC


Average early-career earnings: $ 52,195

Price of typical starter home: $ 187,000

Years to save for down payment: 5 years, 3 months

Monthly mortgage payment as % of income: 28.2%

Monthly rent as % of income: 26%

What makes the city rad for recent grads: Rent won’t bust budget  //  High number of job openings per worker

Aside from offering affordable housing options, Greenville keeps the fun rolling for young professionals with a lively uptown district full of bars, restaurants, live music and parks. For early-career workers, the area has a growing job market in industries like healthcare, education, manufacturing and biotech.

8. Columbia, MO


Average early-career earnings: $ 51,379

Price of typical starter home: $ 199,900

Years to save for down payment:  4 years, 6 months

Monthly mortgage payment as % of income: 30.7%

Monthly rent as % of income: 28%

What makes the city rad for recent grads: Work-life winner  //  Career-growth potential  //  New grads love their jobs

Columbia packs college-town buzz with fun vibes for people in their twenties, from indie music venues to eclectic festivals like the True/False Film Fest to art crawls to bike trails. The city’s diverse job market is anchored by the University of Missouri, and it offers early-career jobs in education, healthcare, tech, public service and small businesses.

9. Bend, OR


Average early-career earnings: $ 65,866

Price of typical starter home: $ 359,999

Years to save for down payment: 8 years, 2 months

Monthly mortgage payment as % of income: 43.1%

Monthly rent as % of income: 56%

What makes the city rad for recent grads: Strong starting salaries  //  Job variety  //  Work-life winner

Bend attracts outdoor enthusiasts with its mountain biking, hiking, skiing and river rafting. Recent grads also love the Oregon town for its craft-beer and music scenes. For early-career workers, the job market offers opportunities in tourism and outdoor gear manufacturing, along with more traditional industries like tech. 

10. Rochester, MN


Average early-career earnings: $ 68,496

Price of typical starter home: $ 215,000

Years to save for down payment: 3 years, 5 months

Monthly mortgage payment as % of income: 24.7%

Monthly rent as % of income: 19%

What makes the city rad for recent grads: Strong starting salaries  //  New grads love their jobs  //  Pedestrian paradise

Rochester blends a laid-back Midwestern vibe with live music, indie art, local breweries and outdoor trails and farmers markets. Its early-career scene is anchored by the Mayo Clinic and a strong healthcare sector, with solid growth in manufacturing, retail and small business.

Here’s a video on what makes these cities rad for recent grads, featuring Redfin Chief Economist Daryl Fairweather and Redfin Premier agent Juan Castro:


Methodology


This report is based on a Redfin-Glassdoor ranking of the best U.S. metro areas in the U.S. for recent college graduates, broken into three categories: Big, medium-sized and small. For this report, metro areas are referred to as “cities.” Redfin and Glassdoor  ranked places based on 13 indicators across housing affordability, career opportunity and urban quality of life. Indicators were normalized (using z-scores) and averaged within those three broad categories. Overall rankings are based on the weighted sum of ranks across the factors. Here are more details on each broad category:

Housing affordability

  • Starter home availability: Starter homes sold per 1,000 residents 
  • Ownership cost:  early-career income divided by median starter home price 
  • Ownership cost trend: Early career earnings growth minus starter home price growth 
  • Rent-to-income ratio: Average monthly condo/co-op cost, divided by monthly early-career salary

Career opportunity

  • Early-career income: Early-career workers  
  • Economic diversity: Concentration of early-career workers in particular sectors 
  • Overall job satisfaction: Average employer ratings from early-career workers 
  • Career opportunity satisfaction: average career opportunity rating from early-career workers 
  • Job availability: Number of distinct job postings  per 100 workers 
  • Post-pandemic job availability trend: Five-year trend in job posting volume

Urban quality of life

  • Average work-life balance ratings: Early-career workers 
  • Median Walk Score 
  • Median Transit Score

Metrics were calculated using 563,000 Glassdoor salary reviews collected in 2025 from early-career workers, 662,000 Glassdoor employer reviews collected from early-career workers between 2023 and 2025, over 22 million job postings on Glassdoor from 2025, and over 2.5 million 2025 property sales from Redfin.

Metrics were calculated for all available MSAs, and MSAs were excluded from consideration if four or more indicators were missing.

Trend data (housing prices, early-career wages, and job posting volume) were generated by regressing available (logged) values between 2018-2025 (2020-2025 in the case of job postings) to calculate an annualized trend.

The post From Nebraska to Alaska: Redfin and Glassdoor Rank the Top U.S. Cities For New Grads appeared first on Redfin Real Estate News.

This post was originally published here

Mortgage activity remained resilient as purchase demand strengthened, despite interest rates climbing, according to Optimal Blue’s March 2026 Market Advantage report, released on Tuesday.

Total rate-lock volume increased 13% from February and 26% from a year earlier. Purchase activity drove the gains, with purchase lock volume rising 38% month over month and 20% year over year.

Refinance activity was mixed. Cash-out refinance volume rose 9% from February and 21% from March 2025, while rate-and-term refinance volume fell 34% month over month but remained more than 66% higher than a year ago. Refinance share accounted for 28% of total production in March, down from earlier in the year but still above 2025 levels.

“Purchase demand is carrying the market forward even as rates move higher,” said Mike Vough, senior vice president of corporate strategy at Optimal Blue. “That’s a strong sign for the spring market, especially with refinance share still at 28%, well above where it spent most of 2025.”

Mortgage rates increased across all major loan types during the month

Optimal Blue’s 30-year conforming fixed rate index rose 45 bps to 6.35%. Jumbo rates climbed 41 bps, U.S. Department of Veterans Affairs (VA) rates rose 44 bps and Federal Housing Administration (FHA) rates increased 21 bps.

The 10-year Treasury yield ended March at 4.30%, up 33 bps, while the spread between the 10-year Treasury and the 30-year mortgage rate widened to 205 bps.

On the secondary market side, execution trends shifted modestly. Best-efforts-to-mandatory spreads tightened for 30-year products, while agency cash window executions increased by 100 bps and securitization activity eased. Mortgage servicing rights (MSR) values rose 6 bps as higher rates dampened refinance expectations.

“In a higher-rate environment, lenders have to be more deliberate about how they execute and where they find value,” Vough said. “We saw some movement toward the cash window in March, but the more telling signal was MSRs moving higher as refinance expectations came down. That’s the market adjusting to a higher-rate backdrop.”

Purchase loans picked up

Purchase loans accounted for just over 71% of total volume in March, reflecting seasonal momentum as the spring homebuying season picked up. Conforming loans made up just over half of total volume, while FHA and non-conforming loans each represented 18%. VA loans accounted for 13% and USDA loans held steady at 1%.

Adjustable-rate mortgage (ARM) usage reached 12% of total production, marking the highest level since October 2022, Optimal Blue said.

Planned unit development (PUD) share, often seen as a proxy for new construction, rose to 28% of total volume, though it remained below year-ago levels.

Pricing trends showed some tightening in execution spreads. Best-efforts-to-mandatory spreads declined by 3 bps for conventional 30-year loans and 5 bps for government 30-year loans, while the spread for conforming 15-year loans increased by 7 bps. The share of loans sold at the highest price tier slipped to 79%, while loans in the lowest tier declined to 4%.

In loan delivery channels, agency mortgage-backed securities accounted for 41% of hedged executions, down slightly from the prior month. Meanwhile, sales through the agency cash window increased to 28%.

Borrower profiles remained relatively stable. First-time homebuyers represented 46% of conforming purchase locks and more than 70% of FHA volume, while VA first-time buyer share held near 46%. Debt-to-income ratios edged lower for FHA and VA loans and held steady for conforming loans, all below year-ago levels. The average purchase FICO score was 732.

Loan sizes remained elevated. The average loan amount dipped to just over $401,000 from $404,586 in February but stayed well above levels seen a year earlier. The average loan-to-value ratio was 81.32%. Regional differences persisted, with average loan amounts ranging from $888,536 in the San Francisco area to $306,283 in Indianapolis, and loan-to-value ratios spanning from 69.88% in the Bay Area to 89.47% in San Antonio.

This post was originally published on here

If you’re a Realtor or loan officer advising today’s homebuyer, your role has never been more important, or more misunderstood. Many buyers are sitting on the sidelines with the same belief: “I’m going to wait until interest rates come down.” On the surface, that sounds reasonable. But as professionals, it’s our responsibility to help clients understand that real estate decisions are not made on rates alone, they are made on the total market dynamic. When we fail to properly consult, we’re not protecting the client, we’re allowing them to make a partial decision based on incomplete information.

Right now, the market is offering something buyers haven’t had in years: LEVERAGE. Inventory has increased, sellers are more flexible, and concessions such as closing-cost assistance and rate buydowns are back on the table. Just a few years ago, buyers had lower rates, but they had almost no negotiating power. They were overpaying, competing in bidding wars, and waiving protections just to secure a home. Today, while rates are higher, the ability to negotiate price, terms, and incentives can often outweigh the difference in interest rate. This is where strong consultation matters, helping buyers understand that price, terms, and timing work together, not in isolation.

We also have to educate clients on what happens when they try to “time the market.” Why? Historically, when rates drop, demand increases. More buyers enter the market, competition rises, and prices follow. The same buyer waiting for a lower rate may end up paying more for the home and competing under pressure. On the other hand, a buyer who purchases today can often secure a better deal and refinance later if rates improve. As advisors, we must shift the conversation from “waiting for perfect” to “making the best move in the current market.”

Another critical factor that often gets overlooked is equity and opportunity cost. Every month a buyer waits is another month they are not building wealth through homeownership. Instead, they are continuing to rent, contributing to someone else’s equity rather than their own. Our job is to help them see beyond the interest rate and understand the long-term financial impact of their decisions. Homeownership is not just a purchase, it’s a wealth-building strategy, and time in the market often matters more than timing the market.

This is where the real skill of a Realtor or Loan Officer comes into play. As Ben Affleck famously said in the movie The Boiler Room, “There is no such thing as a no-sale call. A sale is made on every call you make. Either you sell the client some stock, or he sells you a reason he can’t buy it. Either way, a sale is made. The only question is, who’s gonna close? You or him?” In our world, that doesn’t mean pushing a client into a deal. It means having the clarity, confidence, and conviction to properly educate them, so they don’t unknowingly sell themselves on hesitation, fear, or incomplete information.

The truth is, there is no perfect market. There are only different market conditions, each with its own pros and cons. As professionals, we must guide our clients to see that today’s market offers real opportunities, options, and negotiating power that may not exist when interest rates eventually decline. The goal is not to “sell” them a house, it’s to help them make an informed, strategic decision that positions them to win both now and in the future.

Bobby Bryant is the CEO of homehub.
This column does not necessarily reflect the opinion of HousingWire’s editorial department and its owners. To contact the editor responsible for this piece: zeb@hwmedia.com.

This post was originally published on here

Real estate valuations have customarily leaned heavily on historical data as one of the most important factors used to determine the appraised value of homes. This data includes comparable transactions and cap rates from prior years, along with historical real estate market data. However, there are a few areas that the past-anchored valuation system fails to build into the appraisals, leaving an appraisal gap that is becoming difficult to ignore in 2026. For lenders, this creates a problem when appraisals fall short of the initial estimated property value, or exceed it, and loans need to be restructured as a result. 

Major climate events

An important lesson that has been discovered more recently in the real estate industry is that not all properties in climate-impacted or high-volatility markets fit standard comps. This means that the insurance industry has had to make adjustments around forward-looking models that factor in major climate events like flooding and wildfires. As a result of recent climate incidents, many insurers have pulled out of high-risk markets, and transaction volume has dwindled. As a result, appraisers are left using fewer, older comps that are outdated and don’t reflect the current market conditions. This has all culminated in significant appraisal gaps in these areas. 

The AVM issue

The latest technology in real estate has pushed lenders towards Automated Valuation Models (AVMs) as a faster appraisal tool. However, AVMs are another factor contributing to the 2026 appraisal gap problem. While these models help lenders speed up their loan processing, the accuracy of AVMs is not flawless when the underlying data is sparse or outdated. To help combat this, regulations were put in place in October 2025, which require lenders to use quality control standards for AVMs being used in credit decisions.  

Fewer comparable properties 

For several years, mortgage rates have been elevated and constraining the market. This has meant that comp volume has been lower than pre-pandemic times. Less transaction data means less data for appraisals. It also means that the appraisal data is a little less accurate, increasing the likelihood of an appraisal gap. As rates slowly start coming down and the market shifts into a more active space, this is a natural solution to this problem. However, as with most things in real estate, the correction will take time. 

Geographic impact

According to the NAR, one of the defining factors impacting the market in 2026 is geographic shifts. Markets with newer homes are slowing down in areas that were once bustling, while other markets are strengthening. When it comes to a national appraisal model, there’s no way to account for all these local nuances, so geography has become one of the most important variables in the appraisal gap equation.  

While appraisal gaps are nothing new, 2026 is showing us a different version of them. Traditionally, appraisals would come in below the contract price in busy markets, but in 2026, appraisals are coming in higher than the contract price. In fact, statistics show that only around 10% of home appraisals are below the asking price. While the gap may be going in a different direction, the result is still the same, inaccurate valuations leave both lenders and borrowers with a problem to solve. 

How originators can weather the appraisal storm

The effect of appraisal gaps on loans is longer lock-up periods, more extensions, more renegotiations, and ultimately a higher rate of deals falling through. To stay ahead of this, originators need to consider a few solutions for managing appraisal gaps as the second quarter of 2026 begins. 

Start by building the appraisal gap into the loan structure from the beginning. Deals should factor in all the risks associated with appraisals. Whether that’s through insurance or a higher down payment, an appraisal gap needs to be accounted for, and building that into the loan structure early on provides both lender and borrower with a safety net. Developing an internal appraisal risk score can also be useful to sort deals into low, medium, and high appraisal risk off the bat. 

Environmental due diligence needs to improve, which means that climate checks may need to be done manually to rule out any errors. Along with this, there should be a shift to a more forward-planning climate risk analysis of each property. Climate risk data needs to be a standard part of the loan origination process, so that lenders can make better decisions upfront on how loans should work in high-risk zones. Geography can be used as an early signal for climate risk and to plan accordingly, because the appraisal most likely won’t be factoring that all in. 

Hybrid valuation workflows make the most sense in 2026, with AVMs still coming in useful when paired with a wider dataset. The goal is to flag the high-risk properties as soon as possible and make sure to implement the right structures to mitigate any potential appraisal gap. 

Climate volatility, geographic divergence, thin comp pools, and the limits of automated modeling have all landed at the same time. The appraisal gap in 2026 reflects an older version of the market, and a pivot is required. Lenders who build the appraisal risk at the front end of their loan process will be better prepared for future gaps. 


Kirill Bensonoff is the CEO and Co-Founder of New Silver Lending
.
This column does not necessarily reflect the opinion of HousingWire’s editorial department and its owners. To contact the editor responsible for this piece: zeb@hwmedia.com.

This post was originally published on here

New York has joined the growing list of states exploring legislation designed to govern the use of private listing networks for residential real estate listings. 

In mid-March, Assemblywoman Michaelle Solages introduced the “Fair and Transparent Real Estate Listings Act,” which has since been referred to the committee on judiciary. 

If passed, the bill would require real estate professionals to publicly advertise or market a residential property they list on platforms accessible to the general public. 

The bill defines a private listing network as a system or platform operated on behalf of a brokerage, franchise, MLS or group of licensees that restricts access to some or all listing information to a definite subset of brokers, licensees or buyers and that is not “broadly accessible” to the general public and all licensees representing the prospective buyers. 

According to the bill, within one calendar day of the start date of a written listing agreement, a listing agent must publicly advertise or market the listing for sale in or on a publication, platform or website “that is broadly accessible to the general public and any real estate licensees representing prospective buyers and shall not satisfy this requirement by advertising or marketing solely through a private listing network or other restricted-access platform.” 

Seller can give informed, written direction

Under the bill, listings could be non-publicly marketed if the seller “gives informed, written direction after receiving a standardized state disclosure that clearly explains the risks and tradeoffs of withholding a listing from public marketing.” Additionally, the bill allows the listing agent to restrict public marketing if the seller has a “bona fide private, safety or similar need” where any public marketing would be “reasonably likely” endanger their health or safety. Even with this carve out, the seller must still give written consent to the agent to not publicly market the property.

If a seller wishes to not publicly market their home, the listing may only be shared with “individual, identified prospective buyers or their agents on a case-by-case basis consistent with applicable fair housing and anti-discrimination laws.” 

While the bill would require a seller to sign a disclosure enabling their listing agent to not publicly market their property, the proposed disclosure provides sellers with a right to change their mind, stating that at “any time” they may provide written notice to their agent directing the agent to publicly advertise the property. 

A spokesperson for the New York State Association of Realtors (NYSAR) told HousingWire that it does not have a position on the bill as it is currently drafted. 

“Generally, we are supportive of the principal goals of the legislation to ensure visibility of real estate listings to the public while at the same time preserving consumer choice regarding the marketing of their property,” the spokesperson wrote in an email. “We are in conversations with industry partners regarding the legislation and potential amendments, and we will be conveying NYSAR’s perspective to state lawmakers and the Governor’s office.”

Last month, Washington Governor Bob Furgeson signed a bill into law banning the exclusive marketing of listings to select groups of buyers. This came roughly four months after Wisconsin Governor Anthony Evers signed a bill into law making the public marketing of a property the accepted default. The law is slated to go into effect on January 1, 2027. In addition to these two laws, there are bills pending in Illinois, Connecticut and Hawaii seeking to regulate private listing networks.

This post was originally published on here

A potent mix of global instability and financial anxiety is supercharging demand for New York City’s priciest homes — even as broader luxury segments grapple with stubborn inventory shortages.

HousingWire Data shows pending sales in the ultra-luxury single-family market — defined by a $4.3 million median price — surged 200% in the latest weekly period.

At the same time, price reductions among those high-end properties have fallen to 11.8% — well below the historical New York City average of 17.9%.

“The luxury market now is very undersupplied and extremely busy,” said Ian Slater, founder of Manhattan-based Trove Partners at Compass. “[I’ve been] busier than I have been in a long time. I think more people and more wealthy people are nervous about the stock market and volatility.

“I think they’re wanting to put their money into hard assets. So, real estate is obviously like a great hedge against that.”

Slater said he is seeing an increased number of families relocating from Dubai, which experienced an enormous post-COVID market surge as wealthy individuals fled London and New York.

He has shown listings recently to two families living in Dubai who now want to move to New York — and move quickly.

“Theoretically, you think that people are nervous and don’t want to make big decisions and don’t want to pull the trigger,” said Slater. “But real estate is a hard asset, and because of the general safety and stability of New York, a New York apartment or house seems like a pretty good option.”

On domestic political unrest, Slater said clients have grown somewhat numb.

“There’s less reactivity to things that he [the President] says than there used to be.”

Supply constraints impeding demand

While demand signals are positive in the highest price tier, the broader luxury market shows a more nuanced picture.

New listings in the multi-family luxury segment — condos and townhomes at a $2 million median — dropped 17% to 179 properties. The co-op market saw a 26% decline in new listings.

“We have a serious supply problem for things at the high end, up at the top of the market that are renovated, a very serious problem,” Slater said. “I have a lot of clients who want to move that don’t want to renovate. They want something bigger because they’ve got significantly wealthier in the past five years, and we don’t have a significant amount of people selling.”

Slater described an environment where ultra-wealthy owners are collecting real estate as opposed to selling one property and reintroducing another to the market.

“My entire inbox is frequently brokers looking for inventory, and people calling me and asking me if I have anything off market or coming up,” he said. “Buyers are looking at the market and not really finding anything that they like.”

Renovation-ready properties a hidden value

For buyers willing to look beyond turnkey offerings, Slater said opportunities exist in homes needing renovation — a segment many wealthy purchasers still avoid due to lingering fears about costs and timelines.

“I just left a client looking at townhouses,” he said. “I’m looking at things that I think are priced about 20% under where they should be, because they are in need of renovation. The length of time on the market has gotten very extensive for those things.”

The other overlooked opportunity, he said, lies outside Manhattan’s hottest enclaves — the Upper East Side, Upper West Side, West Village, Tribeca and Brownstone Brooklyn.

“If anyone is willing to look outside of these types of super-hot neighborhoods, you’re going to find better deals and a lot more optionality,” said Slater.

Local election drama fades

Concerns about New York City’s election of Mayor Zohran Mamdani drew concern from some wealthy buyers last fall — but those have largely receded, Slater said.

“I have personally only lost one deal because of fear of the mayor,” he said. “There was a lot of talk around him more in the summer. New York is this giant beast. It’s very hard to change it. So, even the wealthiest of the wealthy, who you think would be the most sensitive to anti-business rhetoric, they have to be here.

“Their [limited partnerships] are here. Their analysts are here. The talent is here. The schools are here. That’s not changing under the mayor. The reality of New York isn’t changing.”

All in all, the Big Apple’s biggest real estate clients seem to be doubling down, sometimes renovating where others won’t and showing that New York real estate remains a rain-or-shine powerhouse.

This post was originally published on here

A potent mix of global instability and financial anxiety is supercharging demand for New York City’s priciest homes — even as broader luxury segments grapple with stubborn inventory shortages.

HousingWire Data shows pending sales in the ultra-luxury single-family market — defined by a $4.3 million median price — surged 200% in the latest weekly period.

At the same time, price reductions among those high-end properties have fallen to 11.8% — well below the historical New York City average of 17.9%.

“The luxury market now is very undersupplied and extremely busy,” said Ian Slater, founder of Manhattan-based Trove Partners at Compass. “[I’ve been] busier than I have been in a long time. I think more people and more wealthy people are nervous about the stock market and volatility.

“I think they’re wanting to put their money into hard assets. So, real estate is obviously like a great hedge against that.”

Slater said he is seeing an increased number of families relocating from Dubai, which experienced an enormous post-COVID market surge as wealthy individuals fled London and New York.

He has shown listings recently to two families living in Dubai who now want to move to New York — and move quickly.

“Theoretically, you think that people are nervous and don’t want to make big decisions and don’t want to pull the trigger,” said Slater. “But real estate is a hard asset, and because of the general safety and stability of New York, a New York apartment or house seems like a pretty good option.”

On domestic political unrest, Slater said clients have grown somewhat numb.

“There’s less reactivity to things that he [the President] says than there used to be.”

Supply constraints impeding demand

While demand signals are positive in the highest price tier, the broader luxury market shows a more nuanced picture.

New listings in the multi-family luxury segment — condos and townhomes at a $2 million median — dropped 17% to 179 properties. The co-op market saw a 26% decline in new listings.

“We have a serious supply problem for things at the high end, up at the top of the market that are renovated, a very serious problem,” Slater said. “I have a lot of clients who want to move that don’t want to renovate. They want something bigger because they’ve got significantly wealthier in the past five years, and we don’t have a significant amount of people selling.”

Slater described an environment where ultra-wealthy owners are collecting real estate as opposed to selling one property and reintroducing another to the market.

“My entire inbox is frequently brokers looking for inventory, and people calling me and asking me if I have anything off market or coming up,” he said. “Buyers are looking at the market and not really finding anything that they like.”

Renovation-ready properties a hidden value

For buyers willing to look beyond turnkey offerings, Slater said opportunities exist in homes needing renovation — a segment many wealthy purchasers still avoid due to lingering fears about costs and timelines.

“I just left a client looking at townhouses,” he said. “I’m looking at things that I think are priced about 20% under where they should be, because they are in need of renovation. The length of time on the market has gotten very extensive for those things.”

The other overlooked opportunity, he said, lies outside Manhattan’s hottest enclaves — the Upper East Side, Upper West Side, West Village, Tribeca and Brownstone Brooklyn.

“If anyone is willing to look outside of these types of super-hot neighborhoods, you’re going to find better deals and a lot more optionality,” said Slater.

Local election drama fades

Concerns about New York City’s election of Mayor Zohran Mamdani drew concern from some wealthy buyers last fall — but those have largely receded, Slater said.

“I have personally only lost one deal because of fear of the mayor,” he said. “There was a lot of talk around him more in the summer. New York is this giant beast. It’s very hard to change it. So, even the wealthiest of the wealthy, who you think would be the most sensitive to anti-business rhetoric, they have to be here.

“Their [limited partnerships] are here. Their analysts are here. The talent is here. The schools are here. That’s not changing under the mayor. The reality of New York isn’t changing.”

All in all, the Big Apple’s biggest real estate clients seem to be doubling down, sometimes renovating where others won’t and showing that New York real estate remains a rain-or-shine powerhouse.

This post was originally published on here

Georgia lawmakers left the state’s main construction incentive for affordable housing untouched this year. And they offered no new relief from rising property tax valuations on apartments that rely on the Low-Income Housing Tax Credit (LIHTC) program.

Senate Bill 476 served as a centerpiece of a Republican push to finance income tax cuts. The bill would have reduced the state credit from a full match of the federal LIHTC to 50% for new projects starting in 2027. It would also have imposed a future sunset date.

Georgia’s program ranks among the most generous in the country. Many states offer their own versions of a match with the federal LIHTC program, often focusing on preserving existing affordable housing rather than building more.

Demand for affordable housing runs so strongly that some programs have closed their application process because they reached capacity. The Minnesota Housing Finance Agency, for example, closed its application process hours after opening it in February because it received more applications than available slots.

Michigan Gov. Gretchen Whitmer has proposed creating a state housing tax credit program this year to address affordable housing. Kansas lawmakers, however, decided last year to phase out that state’s program three years after launching it, saying the hit to tax revenue was much larger than expected.

The Georgia Senate passed its bill in February as one revenue offset to reducing personal and business income taxes. Leaders folded it into a larger tax package, which never cleared the House before adjournment this month.

Housing advocates and developers warned that the LIHTC proposal would chill the construction of affordable apartments. They said it would sharply cut the amount of equity that projects can raise.

Business groups also raised concerns about changing the rules midstream for a program many local governments use to support new rental housing. With the package dead for the year, the state credit remains a one-to-one match with the federal program. It continues without a legislated end date.

Constitutional push

At the same time, lawmakers revived a proposal to amend the state constitution. The change would allow LIHTC properties to be treated as a distinct class for property tax purposes.

The measure, House Resolution 1392, returned after an earlier version cleared committee two years ago but never reached a floor vote. Sponsors billed it as a way to stabilize assessments for rent-restricted projects.

The renewed push followed years of fights over how assessors value income-restricted apartments. It also arrived amid efforts to scale back the tax credit that finances much of Georgia’s affordable rental stock.

In several counties, assessments on LIHTC properties have spiked. In some cases, tax bills rival or exceed a property’s annual revenue. That result occurs when tax credits are effectively treated as income despite court rulings against that approach.

For developers, the outcome keeps the front-end financing tool stable but leaves a key operating cost unchecked. Higher assessments threaten project feasibility and long-term affordability.

Lawmakers in both chambers signaled they may revisit LIHTC funding levels and property tax treatment in a future session. The stance sets up another fight over how Georgia balances cheaper rents with lower taxes.

This post was originally published on here

In an industry that is not known for bold marketing, Taylor Morrison is looking to set itself apart with an out-of-the-box collaboration featuring Liquid Death.

The homebuilder and popular beverage company recently announced that they are collaborating to give away a Taylor Morrison house to one lucky winner. 

To garner headlines and attention, the prize home will be equipped with a 1,000-gallon tank that will deliver Liquid Death soda-flavored sparkling water from every water fixture and faucet. It will have about a three-day supply of Liquid Death water. After that, the property’s plumbing will return to normal. 

In an interview with The Builder’s Daily, Taylor Morrison‘s Chief Marketing Officer Stephanie McCarty says that the campaign, which kicked off on March 31, generated over 3,500 leads in the first 24 hours alone. Although the announcement came out on the eve of April Fool’s Day, the campaign is real — and it’s earned Taylor Morrison exposure in places where homebuilders rarely get attention. 

A mutually beneficial partnership

The collaboration between the two companies began when McCarty and Mike Cessario, founder and CEO at Liquid Death, shared the stage at the Pacific Coast Builders Conference last summer. 

There, the two executives discussed what makes great marketing in the modern age. After the panel, they brainstormed ways that Taylor Morrison and Liquid Death could collaborate. After some back and forth, the idea for the free home giveaway was born. 

McCarty presented the concept to the executives as more than just a fun idea, but also as an investment that will yield dividends, and more importantly, leads. Contestants can earn one entry into the giveaway contest for every can of Liquid Death they purchase. Meanwhile, every participant who tours a Taylor Morrison community can earn five entries. 

“If I know I’m going to get the brand lift in awareness, how do I get the lead generation to get the organization excited? That’s where the sweepstakes came in,” McCarty explained. 

The contest will carry on until June 30. After that, one lucky winner will win a free, roughly $355,000 home in either the Indianapolis, Orlando or Houston markets. 

The collaboration is an unlikely pairing, but it works. For Taylor Morrison, the opportunity to leverage Liquid Death’s following and fan base is invaluable. They are one of the most followed beverage companies on social media, with more than 7 million followers on Instagram alone. 

“They are a premium product. They’re not the cheapest water; people seek them out. They have built a billion-dollar brand in less than five years, and their target demographic is squarely within ours,” McCarty explained. 

Exposure in unexpected places

Liquid Death sells its drinks in a variety of retailers, like Target, Walmart, convenience stores and grocery stores. The marketing initiative with Taylor Morrison is now displayed prominently in many of those locations.

“This is a lead generator. It is also going to lift our brand awareness and put us into the culture in a more relevant way. It’s going to give us brand exposure and advertising in locations that I couldn’t, regardless of how much it costs, otherwise be in,” McCarty said. “Tell me the last time you saw a homebuilder advertised in a grocery store.”

The campaign doesn’t end there. The two companies jointly created a 60-second hero commercial and a 30-second ad to run on TV. To give the initiative another boost, Taylor Morrison stocked model homes with Liquid Death and added QR code displays for entries. The team also emailed all leads who haven’t visited to encourage them to tour a community.

The timing of the announcement was intentionally aligned with the onset of the spring selling season, a pivotal selling period for homebuilders. It’s become increasingly difficult to get prospective buyers to show up, but thousands will provide their information if they think they could win a free house. 

McCarty hopes that the idea will lead to more creative marketing campaigns in the homebuilding industry, which isn’t known for out-of-the-box marketing concepts.

“People think of resale before they think of new home construction. We are trying to flip that script and be known, be culturally relevant and be part of conversations where it’s not very expected,” McCarty said. “I hope, at least for me, when we prove out the success, and we attribute future sales and all the momentum, it just leads to more disruptive, bold, innovative marketing. Because man, our industry needs it.”

This post was originally published on here

Americans ages 60 and older filed 201,266 complaints with the FBI’s Internet Crime Complaint Center (IC3) in 2025. And they reported losses totaling $7.75 billion — a 59% increase over the prior year, according to the agency’s annual report.

The average loss per senior victim was $38,500, with more than 12,400 older complainants losing more than $100,000 each. Investment fraud — much of it involving cryptocurrency and fake trading platforms — inflicted the heaviest financial toll on seniors, with reported losses of $3.52 billion in 2025.

Tech and customer support scams ranked second among older victims at $1.04 billion, followed by confidence and romance scams at $584 million, the report explained.

“The scammers typically initiate contact through text messages, social media sites, advertisements, or dating applications and then quickly move the conversation to a messaging platform,” the report said. “Often, the victims are introduced to investment groups representing themselves to be knowledgeable industry insiders offering guidance on trading or investing in cryptocurrency or gold.”

Business email compromises — schemes that frequently target seniors closing on home sales — cost older victims $568 million across 4,566 complaints.

California saw the largest number of senior complaints at 22,157, followed by Florida with 17,147 and Texas with 14,410. California seniors also led in losses by dollar volume at $1.4 billion.

AI powers ‘grandparent scams’

Artificial intelligence (AI) is giving traditional elder fraud new and dangerous sophistication.

The IC3 received more than 3,100 complaints from seniors referencing AI in 2025 — with losses exceeding $352 million.

Voice cloning can also be used to request wire payment in so-called “grandparent” or “distress” scams, in which voice cloning technology is used to mimic the sound of a loved one in distress. Victims claimed losses of more than $5 million in 2025 tied to distress scams.

Data also shows this scam model evolving to mimic other family members or close friends in different types of emergency scenarios.

Seniors filed 42,271 complaints amounting to losses of $4.35 billion involving cryptocurrency in 2025.

Cryptocurrency ATMs and kiosks were a particular vulnerability. Victims 60 and older reported 6,188 such incidents, losing $257.5 million — a 58% increase in losses from 2024.

The FBI said that scammers increasingly direct seniors to physical crypto kiosks, where cash can be converted to digital currency and sent instantly to overseas fraud rings.

To compound problems, the report added that criminals are now impersonating government officials and fake law firms to approach seniors who have already lost money — offering bogus recovery services for an upfront fee.

Seniors reported $540 million in losses to recovery scams in 2025.

Fighting back

The FBI’s Recovery Asset Team froze $32.9 million of the reported $65.4 million in elder fraud cases initiated through the Financial Fraud Kill Chain in 2025.

Officials recommend that older adults and their families take several immediate steps, including;

  • Enabling multifactor authentication on all financial accounts
  • Never sending cryptocurrency to someone met only online
  • Verifying any urgent request for money by calling the alleged family member directly using a known phone number — not the number provided in the suspicious message.

Seniors who have lost money to any cyber-enabled scam are urged to file a complaint at ic3.gov, regardless of the amount.

Jonathan Delozier reported and wrote this article with drafting assistance from HousingWire Automation, an editorial tool that helps transform announcements and industry data into HousingWire-style news coverage.

This post was originally published on here

The World Series of New York City trivia returns to the Queens Museum for its 15th anniversary this Friday. Hosted by the City Reliquary, the Panorama Challenge uses the museum’s iconic Panorama of the City of New York, a huge scale model of the five boroughs created for the 1964-65 World’s Fair, to test participants’ knowledge of places and events tied to neighborhoods across the city. Taking place on April 17, this year’s competition will feature a new set of NYC-themed questions, including viral moments, Broadway, and other facets of the city’s cultural history and lore.

The Panorama of NYC. Credit: Shinya Suzuki on Flickr

Teams of returning pros and new challengers will work to answer the questions, reinforcing the City Reliquary’s mission to highlight how every city block is rich with stories and meaning. The City Reliquary hosted the first Panorama Challenge in 2007 to engage the public in that mission, turning knowledge of the city into a participatory cultural experience.

The winning team will have its name etched onto the Panorama Challenge trophy alongside previous victors, becoming a part of the event’s history.

This year’s panel of judges includes Kevin Walsh of Forgotten New York, former Manhattan Borough Historian and sewer alligator expert Michael Miscione, tattoo artist and Daredevil Tattoo owner Michelle Myers, and other local figures. Quizmaster Jonathan Turer and emcee Gary Dennis return to run the game and have devised a set of challenging questions.

“Reaching the 15th installment of the City Reliquary’s Panorama Challenge feels really special to me,” Turer said. “Every year I look forward to crafting the questions. I love digging into the strange, wonderful details of New York history and turning them into puzzles that make people look a little closer at the city around them.”

“Seeing players connect the dots, argue over clues, and get excited when something clicks is incredibly rewarding. After all these years, it still feels like a celebration of curiosity, community, and the endless stories hidden throughout the five boroughs.”

The trivia utilizes the famed Panorama of NYC, currently on long-term view at the museum. Conceived by urban planner Robert Moses and created for the 1964–65 World’s Fair, the model was built by a team of more than 100 people at the acclaimed architectural model-making firm Raymond Lester & Associates over the course of three years.

Ticketing and team registration are still open. Admission is $25 in advance, $30 at the door, and $20 for City Reliquary members.

A free shuttle will run between the 111th Street 7 train station and the Queens Museum.

“The Panorama Challenge really captures what the City Reliquary is all about,” Dave Herman, founder of the City Reliquary, said. “It invites people to look more closely at the city around them. It turns curiosity into a game and brings together people who love the strange, overlooked, and fascinating details of New York life.”

He added, “Reaching the 15th edition of the Panorama Challenge is a huge milestone, and it’s exciting to see how much enthusiasm the community still brings to it every year. It’s a perfect example of how a small, quirky idea can grow into a beloved tradition.”

RELATED:

The post NYC trivia returns to Queens Museum for 15th ‘Panorama’ Challenge first appeared on 6sqft.

This post was originally published here

First America Homes, the homebuilding division of Texas real estate developer The Signorelli Co., has hired homebuilding executive David Assid as division president for the Houston region, the company announced.

Assid will oversee operations across the builder’s communities in the Greater Houston area. He brings more than 37 years of homebuilding experience and joins the firm as it looks to expand in one of the most competitive housing markets in Texas and the U.S. In his new role, Assid will focus on broadening First America Homes’ product offerings and strengthening the company’s position in central Houston communities and established submarkets.

Most recently, Assid served as Houston division president for Chesmar Homes. Before that, he spent 24 years with Toll Brothers, moving from project management roles in Dallas-Fort Worth to senior executive leadership in Houston, including division president. At Toll Brothers, he oversaw significant growth in the Houston division and helped expand the company’s portfolio.

Earlier in his career, he held key roles at General Homes and Huntington Homes, managing construction across multiple communities and leading teams delivering luxury home projects in Dallas-Fort Worth. His career has included positions as construction manager, project manager, senior project manager, division vice president and division president.

“We’re excited to welcome David to First America Homes; I don’t think we could have found a more perfect leader for our ambitious plans for this dynamic market,” John Winniford, president of First America Homes, said in a statement. “David brings an abundance of industry knowledge and experience in the Houston MSA. These intangibles will serve us well as we pursue enhancing brand awareness and increasing market share.”

First America Homes builds in major Texas markets, including Houston, San Antonio and Dallas-Fort Worth. The builder was recently ranked as the 64th-largest private homebuilder in the U.S. and is recognized in the Builder 100 rankings. The company has constructed more than 4,450 homes across Texas and is in expansion mode, having recently opened a Dallas-Fort Worth office and acquired lot positions in the Austin area.

“As a privately owned company, First America Homes is a business driven by strong values and a focus on what matters most – delivering quality products and helping buyers achieve their dream of homeownership,” Assid said. “I am excited to contribute to its growth and success.”

First America Homes leverages The Signorelli Co.’s master-planned development platform. The company currently has 30 active communities and 15 additional communities planned.

The Woodlands, Texas-based developer currently has 13 master-planned communities in development, including Austin Point, a 4,700-acre residential and mixed-use project in Fort Bend County. Valley Ranch, a 1,400-acre community in northeast Montgomery County, includes more than 2,000 single-family and 1,000 multifamily homes, with additional single-family neighborhoods underway.

This post was originally published on here

Closing more deals in 2026 means using multiple lead generation methods, not just relying solely on your sphere of influence and networking to build your pipeline. Lead generation companies find qualified real estate leads actively buying and selling now — using the latest tech, like artificial intelligence (AI) and predictive analytics. These companies will do most of the heavy lifting to get leads straight to your inbox.

We pinpointed the top real estate lead generation companies for 2026 based on their cost, software features, the lead quality and whether those leads are exclusive to you. We’ll review eight exceptional real estate lead generation companies that can supercharge your lead generation efforts and get you to the closing table faster (and more often).

Our picks: The 8 top real estate lead generation companies for 2026

Logo-AgentFire-2

Best for full-service marketing suite + exclusive leads

Market Leader

From $189

Jump to details ↓

VISIT

Logo-AgentFire-2

Best for seller leads

Smartzip

From $500

Jump to details ↓

VISIT

Logo-AgentFire-2

Best for geo-targeted lead generation

CINC

From $899

Jump to details ↓

VISIT

Logo-AgentFire-2

Best for buyer leads based on location

Zillow

From $20

Jump to details ↓

VISIT

Best affordable, all-in-one lead generation platform

Real Geeks

From $399

Jump to details ↓

VISIT

ylopo

Best for AI-powered lead generation & conversion

Ylopo

From $395

Jump to details ↓

VISIT

Logo-AgentFire-2

Best for affordable à la carte seller leads

REDX

From $60

Jump to details ↓

VISIT

Logo-sold-com

Best for pay-at-closing lead gen

Sold.com

From $0

Jump to details ↓

VISIT

Our picks: The 8 top real estate lead generation companies for 2026

Best for full-service marketing suite + exclusive leads

Market Leader

From $189

VISIT

Jump to details ↓

Best for seller leads

SmartZip

From $500

VISIT

Jump to details ↓

Best for geo-targeted lead generation

CINC

From $899

VISIT

Jump to details ↓

Best for buyer leads based on location

Zillow

From $20

VISIT

Jump to details ↓

Best affordable, all-in-one lead generation platform

Real Geeks

From $399

VISIT

Jump to details ↓

Best for AI-powered lead generation & conversion

Ylopo

From $395

VISIT

Jump to details ↓

Best for affordable à la carte seller leads

REDX

From $60

VISIT

Jump to details ↓

Best for pay-at-closing lead gen

Sold.com

From $0

VISIT

Jump to details ↓

Market Leader: Best for full-service marketing suite + exclusive real estate leads

Market Leader logo: a real estate CRM solution

From $189

As its name suggests, Market Leader is known for offering a complete marketing suite with features like email, print and SMS marketing tools, lead capture forms and a built-in lead management CRM. The real estate lead generation company provides in-house advertising experts who send buyer and seller leads exclusively to you, streamlining lead management and marketing efforts.

Market Leader is a strong option for real estate professionals seeking lead generation and marketing solutions in one platform. Its full marketing suite and real estate lead exclusivity set it apart, although it would stand out even more if it offered a concierge service and a free trial option. Users have praised its efficient CRM capabilities but noted challenges with lead responsiveness in some cases.

Features

  • Automated workflow
  • Social media integration
  • Customizable reports
  • Network Boost: generates affordable leads through social media ad campaigns
  • HouseValues: helps you get seller leads from a desired ZIP code
  • Leads Direct: helps run pay-per-click advertising campaigns

Exclusivity: Yes

Trial period: No

Contract requirements: Six-month minimum

Pros & Cons

  • Guaranteed number of leads each month
  • Automated email and SMS marketing and lead nurturing
  • Built-in lead management CRM
  • Lead capture forms
  • Exclusive real estate leads
  • Full marketing suite
  • Lead responsiveness can be an issue
  • Does not offer a concierge service
  • Limited analytics
  • No free trial period

Pricing

  • Professional for Agents: $189 per month
  • Professional for Teams: $329 per month plus additional per-user charges
  • Network Boost: 30 leads per month for $300 per month

Visit Market Leader

Market Leader Review

Smartzip: Best for seller leads

Logo-Smartzip

Smartzip uses predictive analytics to identify likely sellers six to 12 months in advance, offering a first-mover advantage in tight inventory markets. The company provides robust marketing and nurturing tools, including pay-per-click (PPC) ads, home valuation landing pages, email and direct mail campaigns, a comparative market analysis tool and more. Marketing campaigns are personalized for each lead and feature your personal branding to stay top of mind.

Smartzip primarily benefits experienced listing agents, yet any agent willing to nurture seller leads can thrive with this platform. To generate real estate leads, Smartzip employs a proprietary predictive analytics algorithm that sifts through consumer data from credit card companies, market data from the Multiple Listing Service (MLS) and other demographic information.

Real estate agents using Smartzip gain immediate access to its CRM, which is populated with leads and their associated data. This dashboard displays a list of property owners in the agent’s target area, based on the client’s likelihood of selling within the next 18 months. Armed with this data, agents can use the included automated marketing tools to market directly to sellers who are most likely to transact.

Features

  • Predictive analytics
  • Smart CRM
  • Direct mail campaigns
  • Automated email marketing
  • Home valuation landing pages
  • CMA tool
  • CheckIn app
  • Local trend reports

Exclusivity: No

Trial period: No

Contract requirements: Annual contract is required

Pros & Cons

  • Predictive analytics targets likely sellers with high accuracy
  • Comprehensive marketing and nurturing tools
  • Marketing campaigns are personalized with leads’ home valuation data
  • System can nurture leads from any source, not just leads from Smartzip
  • Design quality of marketing materials
  • Automated home valuations
  • Leads are not exclusive and are generally top-of-funnel
  • Not recommended for new agents; relatively pricey
  • Nurture times can be long

Pricing

Starting at $500 per month, with an average monthly spend of $1,000.

Visit Smartzip

Smartzip Review

CINC: Best for geo-targeted lead generation

CINC logo; a real estate CRM or customer relationship management software

CINC is an all-in-one lead generation platform that combines sophisticated paid advertising, IDX websites and an AI-powered CRM to generate and nurture leads. CINC’s advertising team excels at targeting leads in micro-niches such as neighborhoods, school districts and even specific property types, including waterfront homes or golf communities. Upgrades include cash offer ads and Google Local Service Ads (LSAs) to generate high and mid-funnel seller leads.

CINC is an ideal choice for productive agents and teams who work in competitive geographic or property-type niches and want automated systems to engage and nurture leads. Entry-level pricing is higher than other lead generation companies, but unlike its competitors, CINC includes buyer leads in its pricing.

Features

  • Sophisticated geographic and property-type lead targeting 
  • Integrated IDX website and CRM 
  • AI-powered chatbot trained by top-producing agents 
  • Mobile app 
  • Referral network 
  • 3-line auto dialer available

Exclusivity: Yes

Trial period: No

Contract requirements: 6 months

Pros & Cons

  • Targets leads in dozens of geographic and home-type niches
  • Sophisticated IDX website and CRM
  • Highly skilled PPC advertising team leverages data from 50,000 agents and teams
  • Fully automated lead nurturing powered by AI
  • Industry-leading training and support
  • Starting price is higher than competing platforms
  • IDX websites have limited customization options
  • Sold as an all-in-one platform – cannot purchase leads or software separately
  • CINC AI chatbot is a $200 per month upgrade

Pricing

CINC’s pricing starts at $899 per month for solo agents and $1500 per month for teams (includes buyer leads). Pricing can vary widely based on the market and property type niche. Software and lead generation services are not sold separately.

Visit CINC

Zillow Premier Agent: Best for buyer leads based on location

Logo-Zillow-Premier-Agent-2

As a major player in the real estate industry, Zillow is hard to overlook. Zillow dominates Google search results, driving over 230 million page views per month, nearly double the traffic of Realtor.com. Its market dominance makes it a top choice for consumers searching for properties. That’s good news for agents and brokers looking to attract real estate leads.

Zillow Premier Agent (ZPA) is Zillow’s paid advertising program that connects agents to buyer leads. Zillow Premier Agent offers enhanced visibility for its members on Zillow’s platforms, giving ZPA agents priority placement in property listings and exclusive access to real estate leads. The platform’s high traffic volume, effectiveness and straightforward CRM make it a top choice for lead generation. If you want to cast a large net of lead generation, Zillow Premier Agent can help you reach more real estate leads in your area.

Features

  • Automatic lead placement in Zillow’s CRM
  • Priority status when claiming properties on Zillow
  • Ease of automating follow-ups for lead conversion
  • Direct integrations with most real estate CRMs

Exclusivity: No

Trial period: No

Contract requirements: Vary

Pros & Cons

  • Agent’s profile is displayed on every listing their leads visit on Zillow
  • Leads are sent via phone calls, emails and tour requests
  • Excellent for building brand awareness
  • CRM monitors leads’ behavior on Zillow, providing actionable insights for follow-up
  • Lacks robust lead follow-up tools
  • Leads aren’t necessarily qualified or exclusive
  • Price per lead can be higher than other companies
  • Leads are not exclusive

Pricing

Zillow’s pricing depends on the ZIP code and home price, ranging from around $20 to $60 per lead. Unfortunately, Zillow isn’t very transparent about the cost of leads through their Zillow Premier Agent program. It depends mainly on your market.

Visit Zillow Premier Agent

This post was originally published on here

Seattle-based Friday Harbor, an AI-powered mortgage underwriting platform, has hired two mortgage industry veterans, naming Kate Schilling as director of sales and Melina Stayton as customer success manager, the company announced Monday.

Schilling brings more than 13 years of mortgage experience to the newly created sales role. Stayton adds nearly 15 years of banking and mortgage experience on the customer success side, where she will work directly with lender clients using Friday Harbor’s technology.

Their hirings come as lenders are under pressure to cut fulfillment costs, improve loan quality and adopt AI tools without disrupting already strained operations. Pre-underwriting platforms like Friday Harbor aim to help lenders automate income and asset review earlier in the process, which can shorten cycle times and reduce repurchase risk.

Schilling joins Friday Harbor from Dark Matter Technologies, where she served as a senior account executive supporting mid-market banks, credit unions and independent mortgage banks, according to a press release. In that role, she sold and supported mortgage technology solutions across a broad range of lender sizes and channels.

Before Dark Matter, Schilling was a mortgage originator at CrossCountry Mortgage, giving her firsthand experience with retail production and borrower-facing workflows. She also spent more than six years at National MI as a regional team leader and account executive, serving more than 100 lender clients and working directly with capital markets and operations teams on mortgage insurance execution.

Schilling began her mortgage career as a loan processor at a regional independent mortgage bank in New England. She is based in Boston and holds a bachelor’s degree in English from North Carolina State University and an MBA from Louisiana State University at Shreveport.

Stayton joins Friday Harbor as customer success manager after nearly 15 years in banking and mortgage, including a decade at Evergreen Home Loans. She started there as a loan officer assistant before moving into operations leadership.

Most recently, Stayton was a production operations supervisor, where she helped lead companywide technology implementations, managed point-of-sale and CRM platforms, and worked to align sales and operations teams during process and system changes.

Her background as a licensed loan originator gives her direct experience with borrower interactions and pipeline management, which the company said will support adoption and change management for lender clients using Friday Harbor’s AI tools. Stayton holds a bachelor’s degree in history from Western Washington University and lives in Port Orchard, Washington.

This article was generated using HousingWire Automation and reviewed by a HousingWire editor before publication. The system helps convert company announcements and industry data into HousingWire-style news coverage.

This post was originally published on here

High on a Columbia County hilltop overlooking the Taconic and Helderberg mountain ranges, this secluded 40-acre property at 411 Texas Hill Road is a modernist’s dream. The seller, Mark McDonald, known as “Mr. Modernism,” has been instrumental in creating a market for 20th-century modern design in America for over four decades. Asking $3,350,000, the estate features a 1966 mid-century main house designed by architect George Post.

At the end of a long driveway, the three-bedroom main house is served by a guest suite, an artist’s studio with a sauna, and a bespoke barn. Surrounding 4,000 square feet of total living space are gardens, walking trails, and spring-fed ponds.

The main house offers three bedrooms, a guest suite, and a two-car garage. The spaces are connected by covered walkways. The home has been updated for the 21st century with central air and radiant heated floors throughout.

The main living room, dining room, and kitchen form a large great room anchored by a central stone fireplace. Sliding glass doors that wrap the room offer views of the surrounding landscape. A vaulted wood ceiling, walnut hardwood floors, and custom built-ins add architectural integrity and warmth, highlighted by iconic designer lighting throughout.

The kitchen maintains its mid-century feel with minimalist cabinetry and stainless steel countertops. The kitchen is served by a mudroom and laundry room.

Down the home’s central hallway is a primary bedroom with an ensuite bath. Glass doors slide open onto a private patio. There are two more bedrooms, each with a bath.

From the main house, a covered walkway leads to the one-bedroom guest suite with its own living room, kitchen, and full bath. In a separate building, an artist’s studio offers a private sauna. A craftsman-style barn offers even more possibilities for living space or storage.

The lovingly landscaped grounds feature stone patios, fire pits, native and exotic trees and shrubs, rock outcroppings, a swimming pond, and wooded walking trails.

Providing a special modernist touch is a front gate designed by Frank Lloyd Wright. The private Hudson Valley estate is just 20 minutes from the town of Hudson.

[Listing details: 411 Texas Hill Road by Marina Schindler and Stephen Kingsley of Compass]

RELATED: 

The post For $3.35M, this 40-acre upstate retreat embodies the spirit of modernist architecture first appeared on 6sqft.

This post was originally published here

REMAX Premier announced that Sharon Rizzo — a Chicago real estate professional with more than four decades of experience — has joined the firm’s new Lake Forest, Illinois, office along with her team, The Rizzo Group.

Rizzo has been recognized as a Chicago Association of Realtors Golden Eagle Award recipient after closing more than $114 million in residential sales in a single year as a sole agent.

“Joining REMAX Premier and the luxury North Shore offices allows us to elevate the level of service and exposure we provide our clients,” she said. “The strength of the REMAX brand, combined with REMAX Premier’s leadership and collaborative culture, creates an exceptional platform for our team and the clients we serve.”

Her team reported more than $25 million in volume on last year’s RealTrends Verified rankings.

“Sharon’s career speaks for itself,” said Janice Corley, founder and CEO of REMAX Premier. “Her depth of experience and long-standing relationships across the market align seamlessly with our luxury North Shore offices. As we continue expanding our presence on the North Shore and beyond, Sharon and The Rizzo Group represent the caliber of professionals we seek to attract.”

As a sales manager for condominium conversions in Chicago’s Gold Coast, Rizzo oversaw six major high-rise residential projects — including Lake Point Tower.

Earlier in her career, she worked as a medical reporter and on-air broadcaster for NBC News and later served as a national spokesperson for two divisions of the Big Three automakers.

In addition to her brokerage work, Rizzo and her daughter, Realtor Kimberly Rizzo, co-developed the nationally presented seminar “Building Wealth Through Real Estate,” which highlights real estate as a long-term investment strategy.

The Rizzo Group will operate out of REMAX Premier’s Lake Forest office effective immediately — continuing its focus on luxury homes, investment properties and development opportunities across Chicago and the North Shore.

This article was generated using HousingWire Automation and reviewed by a HousingWire editor before publication. The system helps convert company announcements and industry data into HousingWire-style news coverage.

This post was originally published on here

Denver-based Mortgage Cadence on Monday announced the appointment of industry veteran Joe Zeibert as chief revenue officer, tasking him to align sales, customer success and go-to-market strategies as the company expands under new ownership.

The move comes as Mortgage Cadence, now part of PartnerOne, pushes to grow adoption of its Mortgage Cadence Platform (MCP) and related tools in a market where lenders are under pressure to cut costs, boost pull-through rates and cautiously implement artificial intelligence (AI) while staying compliant.

Zeibert, who has more than 20 years of experience across banking, fintech and mortgage technology, previously held leadership roles at Anchor Loans, FICO, Nomis Solutions, Ally Financial and Bank of America, according to a press release. His background spans pricing, credit and capital markets strategy, as well as deployment of analytics and automation to improve lender performance.

“What makes Joe’s addition especially meaningful is his rare blend of deep technology expertise and authentic lender perspective,” Mortgage Cadence CEO Mike Detwiler said in a statement. “He understands that growth doesn’t come from selling more, it comes from serving customers better.”

Zeibert said the role is a continuation of work that began during the financial crisis of the late 2000s, when he saw both “strengths and shortcomings” in mortgage origination.

“This inspired me to believe there was a better way to manufacture mortgages, and I committed myself to helping the industry evolve,” Zeibert said. “My goal is to create greater efficiency for lenders while ultimately improving outcomes for consumers.”

As CRO, Zeibert will work across Mortgage Cadence’s sales, customer success and delivery teams to deepen existing relationships and open new ones, with an emphasis on helping lenders extract more value from MCP through connected, collaborative engagement. This includes guidance on how lenders use automation and analytics to streamline workflows, reduce manual touches and support compliance.

The company said Zeibert will support the continued evolution of MCP and its surrounding ecosystem, with a focus on intelligent automation, operational efficiency and “human-in-the-loop” innovation that keeps loan officers and operations staff in control of AI-enabled processes.

“Joe understands that our success is directly tied to our customers’ success,” Detwiler said. “His role is not just about growth, it’s about ensuring we continue to deliver on our promise to serve while innovating the future.”

Zeibert’s hiring underscores how loan origination system (LOS) and mortgage tech providers are reorganizing around revenue operations and customer success as lenders demand clear, measurable return on investment from technology contracts signed during the post-pandemic refinance boom.

With volumes still below peak levels and origination costs elevated, vendors are being pushed to prove that automation, integrations and AI can translate into turn-time reductions, better secondary market execution and improved borrower experience.

For lenders evaluating or already using MCP, Zeibert’s mandate suggests Mortgage Cadence plans tighter alignment between its sales promises and live production outcomes, as well as potentially more structured programs involving implementation, optimization and ongoing value realization.

This post was originally published on here

U.S. homebuilders reported that sales softened in March compared to February amid economic volatility and a spike in mortgage rates, according to the BTIG/HomeSphere monthly homebuilder survey.

Demand cooled after early-year gains, the survey of small and midsized homebuilders found. In March, 35% of builders reported year-over-year sales declines, up from 23% in February. At the same time, 34% saw higher sales, only slightly better than 32% in February.

Consumer traffic softened more clearly too as 33% of builders reported higher year-over-year traffic, down from 43% in February, while 35% reported lower traffic versus 18% the prior month.

At the same time, sales versus internal expectations weakened. In March, 26% of builders said sales were better than expected (down from 33% in February), and 26% said sales were worse (up from 22% in February), bringing the “better-minus-worse” spread to 0 from +11.

For traffic, 24% of builders viewed results as better than expected (down from 40% in February), while 21% saw traffic as worse (up from 11%), taking the corresponding spread down to +3 compared to +29 in February.

Fewer builders raised their base prices in March. According to the report, 17% of builders increased some, most or all base prices, down from 19% in February. More reported cutting prices, with 23% lowering some, most or all base prices versus 21% in February.

The use of incentives also moved higher. In March, 24% of respondents increased some, most or all incentives, up from 18% in February. About 6% decreased incentives, and 59% kept them unchanged, similar to last month.

Commentary from participants also turned more cautious. Builders in multiple regions cited the conflict in Iran, rising gas prices and reaccelerating mortgage rates as near-term headwinds on buyer urgency and confidence. These macroeconomic pressures appear to be amplifying ongoing affordability and inventory challenges just as the industry enters the peak spring selling window.

For homebuilders, the March reading suggests the early-year improvement in demand is fragile. Higher borrowing and energy costs are pushing some buyers to the sidelines, forcing many builders to lean harder on incentives and selective price adjustments to protect absorption and backlog quality heading into the heart of the selling season.

Tyler Williams reported and wrote this article with drafting assistance from HousingWire Automation, an editorial tool that helps transform announcements and industry data into HousingWire-style news coverage.

This post was originally published on here

This Week In A Nutshell: Mortgage rates have been steadier for the last few weeks. But the risk of outsized mortgage moves remains as markets await the outcome of Iran war ceasefire negotiations.

Upcoming Attractions


This week is light on market-moving economic data, as we’ve now gotten the key labor market and inflation indicators for the month. The next Fed meeting is still two weeks away. We will get the producer price index (PPI) on Tuesday, which will help round out the March inflation picture alongside last week’s consumer price index (CPI) data. 

Markets will continue to focus on any progress toward reopening the Strait of Hormuz. Currently only about a dozen ships per day are passing through, down from about 100 last year. Bond market volatility has declined sharply since late March, with current volatility more similar to late February/beginning of March. But significant news on ceasefire talks could still move rates sharply.

Last Week’s Highlights


We’re starting to see some of the expected effects of the Iran war in economic data. Overall inflation in the March CPI data spiked, but outside of energy prices and the most energy sensitive sectors (airfares), there was limited bleed through from the conflict so far. Consumer sentiment, measured by a University of Michigan survey, fell more than expected post-conflict to a historical low, while inflation expectations jumped sharply as consumers reacted to gas prices. The Fed is particularly sensitive to changes in inflation expectations, which they see as a self-fulfilling prophecy. 

Importantly, consumer sentiment is seemingly reacting more to higher gas prices than the higher tax refunds consumers are also currently receiving. Finally, Chase reported that their credit card spending data for March indicates that consumers are not yet cutting back on spending. This may reflect higher tax refunds or consumers may simply be cutting back on savings for now. Research on prior episodes of gas price changes suggest that there should be a sizable response eventually, however, which should cause economic growth and the labor market to slow.

Diving a Little Deeper


We recently passed the one-year anniversary of Liberation Day (April 2, 2025), when President Trump introduced historically high tariffs. Both the Iran War and last year’s tariffs are what economists call stagflationary events–that is, they slow economic growth and spur inflation. In that vein, it’s helpful to reflect on what has transpired in the past year:

  • Labor market: While economic growth remained healthy, the labor market slowed significantly to the point where some worry that we’re in a labor market recession. Notably, the economy has essentially created no new jobs in the last year. Much of this slowdown is because of new immigration restrictions, but tariffs also played a role.
  • Inflation: Core inflation (which excludes food and energy prices) has remained relatively stable. Tariffs did drive the prices of goods higher, but service inflation came down offsetting much of that change. In addition, goods prices did not rise as much as feared initially as companies declined to pass some of the cost onto consumers.
  • Mortgage rates: Mortgage rates rose initially on inflation fears post Liberation Day, but fell steadily starting in the summer as growth fears dominated inflation worries.
  • Housing market: Home sales data, including the read for March released this morning, show that we continue to bounce along the bottom eerily similar to the past three years despite a nearly one percentage point drop in mortgage rates over the course of 2025 and more inventory in the housing market. The lack of response to lower mortgage rates coincides with the slowdown in the labor market over the same period and increasingly worse vibes among consumers.

Redfin Housing Market Reports


A Record 34% of February Home Sellers Cut Their List Price

  • February home sellers who cut their price lowered it by $41,000, on average, or 7.3%.
  • Home sellers in Texas and Florida were most likely to make price cuts, while sellers in the Bay Area were least likely.

Pending Home Sales Post Biggest Decline in 3 Months

  • U.S. pending home sales fell 2.4% year over year during the four weeks ending April 5. 
  • Sales fell most in Providence, RI (-15.5%), Houston (-15.4%) and New York (-15.3%). They increased most in West Palm Beach, FL (20.9%), San Francisco (16.7%) and San Jose, CA (11.4%).
  • On the selling side, new listings dipped 2.6% year over year, the biggest decline in a month.

The post Redfin Economists’ Weekly Take: Mortgage Rates Hold Steady, but Iran Ceasefire Talks Keep Risk of Sudden Swings on the Table appeared first on Redfin Real Estate News.

This post was originally published here

Pink bought a yellow Greenwich Village townhouse. The pop star paid $21.5 million for the historic six-story home at 125 West 11th Street, as the Wall Street Journal first reported. Built in 1849, the cheerfully painted Greek Revival mansion has served as a haven for artists for over a century, most recently the same family for 70 years. Following a three-year renovation, the roughly 7,900-square-foot home first hit the market for $25 million in 2024 before being reduced by $3.5 million last fall.

According to the WSJ, Pink, aka Alecia Beth Moore, relocated to New York so her teenage daughter could study theater and experience Broadway. The musician and her family continue the trend of artists living in the Greenwich Village home.

As 6sqft previously reported, Daniel Chester French, the sculptor who created the Abraham Lincoln statue at the Lincoln Memorial in Washington, D.C., lived there in the late 1880s. French designed and built the home’s paneled studio, which measures 54 feet deep with soaring ceilings and three huge skylights. In this studio, decades later, dancer Valerie Bettis created choreographic routines for Hollywood stars like Rita Hayworth.

The Fonseca family has owned the home for the last 70 years, starting with Uruguayan sculptor Gonzalo Fonseca and painter Elizabeth Kaplan Fonseca and their children, one of whom is author Isabel Fonseca, as the New York Times reported.

The 22-foot-wide single-family home has an elevator that connects all six floors, including the rooftop terrace with sweeping city views.

The garden level’s stunning artist studio steals the show, accessible via exterior wrought-iron doors. The sprawling space features two 30-foot peaks with three colossal skylights. A lofted area is reached by a spiral staircase.

On this floor, there are two wood-burning fireplaces, a kitchenette, a full bath, a washer and dryer, and access to the cellar. French doors lead to a back patio.

Up the classic stoop, the parlor level features a spacious living room with 10-foot ceilings and one of the three wood-burning fireplaces. This level also includes a well-equipped kitchen, a dining area, and a powder room.

With lots of space to work with, the home could easily deliver seven bedrooms. Currently, the third floor is configured as two bedrooms with a shared bathroom, but could become the primary suite or home office.

Facing the tree-lined street, the primary bedroom takes up the fourth floor and includes a large dressing room and an en-suite bath with a double marble vanity, soaking tub, and separate shower. The fifth floor features two more bedrooms, one of which has access to a private south-facing terrace.

Photo from the 2024 listing shows the distinct skylights. Photo courtesy of Brown Harris Stevens

The top floor offers beamed ceilings reaching over 13 feet high and casement windows. There’s a wet bar with a wine fridge, a full bath, and a rooftop terrace offering views across lower Manhattan.

[Listing details: 125 West 11th Street at CityRealty]

[At Compass by Nick Gavin and Mary Ellen Cashman]

RELATED:

The post Pink buys historic yellow Greenwich Village townhouse for $21.5M first appeared on 6sqft.

This post was originally published here

New York City wants to close a chaotic street between Grand Army Plaza and Prospect Park, connecting the plaza to the 585-acre green space with a new car-free pedestrian space. Mayor Zohran Mamdani on Monday announced a proposal to remove the four-way crossing next to the Soldiers’ and Sailors’ Memorial Arch and ban cars from Union Street to Eastern Parkway along the plaza’s southern edge. The redesign also includes new bike lanes and bus priority upgrades aimed at improving service on the B41 and B6, two of Brooklyn’s busiest routes.

(L) Proposal redesign of Grand Army Plaza, (R) current design. Credit: NYC DOT

Grand Army Plaza was designed in 1867 by Frederick Law Olmsted and Calvert Vaux as the formal entrance to Prospect Park.

Those who visit the plaza’s iconic arch and Prospect Park are familiar with the hectic experience of crossing the wide avenue between the landmark and the green space, where Park Slope and Prospect Heights converge, and the main entrance to the park.

Residents and advocacy groups have complained about traffic in the area for decades. In 1955, one publication described the traffic circle as “the only concrete asphalt and roulette wheel in the world,” according to the New York Times. Between 2021 and 2025, there were 219 traffic injuries along the plaza’s roadways and outer ring.

The proposal seeks to address these long-standing concerns by making the experience of visiting the arch and park less stressful. The redesign would add roughly three-quarters of an acre to the 14-acre plaza, a 42 percent expansion, and reduce the number of pedestrian crossings from 39 to 24.

Redesigning the roadway would also improve bus speeds, the Department of Transportation (DOT) told the Times, as the project would ease congestion in and around the circular roadway. The effort would be complemented by the ongoing redesign of Flatbush Avenue, which connects to Grand Army Plaza and includes center-running bus lanes.

Credit: NYC DOT

“Grand Army Plaza is the gateway to Brooklyn’s backyard, Prospect Park—and it should welcome New Yorkers with street design that puts safety first,” Mamdani said.

“Anyone who’s tried to cross here knows how dangerous and chaotic the streets can be. This redesign is long overdue and will provide a sense of ease and enjoyment to one of Brooklyn’s most important public spaces.”

Plans to redesign the plaza began circulating in 2022 under former Mayor Eric Adams, but have since stalled. The project has now been revived under the Mamdani administration. The selected plan would remove cars from the plaza’s southern edge and divert traffic to adjacent streets.

In 2024, workshops showed substantial community support for the project, with over 85 percent of the 3,600 survey respondents supporting a plan that would better connect the park and plaza to the arch.

“We’re ecstatic that NYC will be connecting Grand Army Plaza’s arch to the rest of Prospect Park,” Ben Furnas, executive director of Transportation Alternatives, said. “This is a major step forward for everyone who visits Brooklyn’s backyard, and a restoration of Olmsted’s original vision for his favorite park.

Furnas added: “With this proposal, one of Brooklyn’s most confusing and harrowing intersections will transform into a new marquee public space for all to enjoy—on foot, on a bike or on the bus.”

The DOT will finalize the project’s design through a series of public workshops beginning April 23. More information and a public survey will be posted online on the day of the workshops and will be available online through May 31.

Once capital project scope development concludes this year, the DOT will explore ways to reconstruct the roadway to include new pedestrian and cyclist amenities.

The April 23 workshop will be held from 4 to 6 p.m. at the DOT tent south of the archway in Grand Army Plaza. In case of rain, the event will move to the Grand Lobby of the Brooklyn Public Library. On April 25, another workshop will take place at the same location from 10 a.m. to 1 p.m.

On April 29 from 6 to 7:30 p.m., the DOT will host a virtual workshop on Zoom. You can register here.

Last summer, the city and the Prospect Park Alliance announced the completion of a $8.9 milion renovation of the Soldiers’ and Sailors’ Memorial Arch. As 6sqft reported, the project replaced the arch’s roof, cleaned the brick and stone structure, repaired interiors, like the cast-iron spiral staircase, and added new lighting. The landscape surrounding the arch was also revitalized with new plants, trees, paving, and an accessible curb cut.

RELATED:

The post NYC to connect Grand Army Plaza and Prospect Park with car-free pedestrian space first appeared on 6sqft.
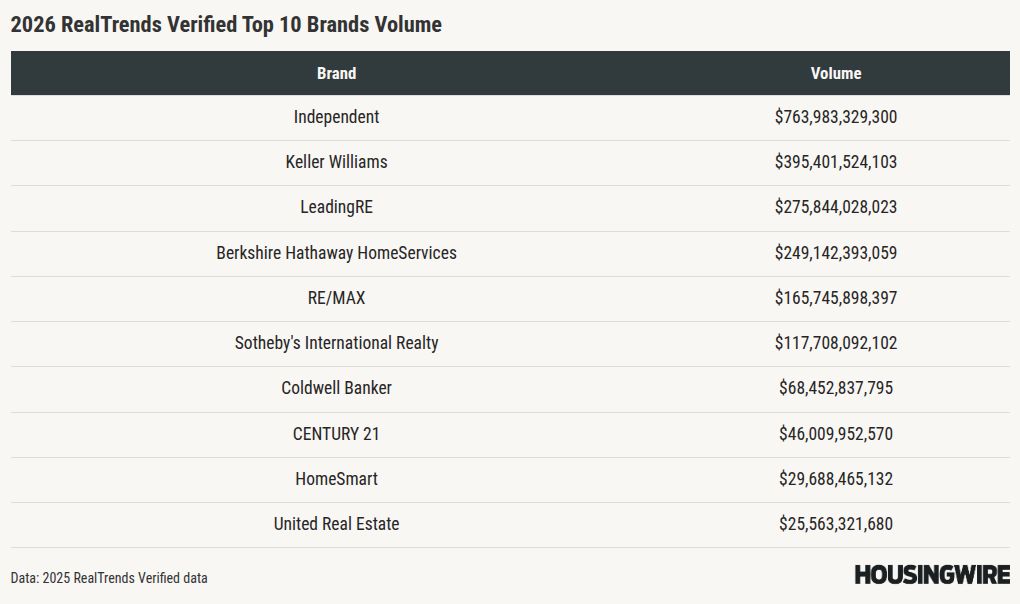
This post was originally published here

Hedge fund and activist CoStar Group investor Third Point has sold its shares of the Andy Florance-helmed firm. This news was first reported by Reuters and confirmed to HousingWire.

Third Point CEO Daniel Loeb informed investors of his firm’s decision to sell its shares in CoStar in a letter on Friday. 

​​The size of Third Point’s stake in CoStar remains unknown, but the hedge fund was ranked among CoStar Group’s 15 biggest investors.

Third Point did not immediately return HousingWire’s request for comment on its decision to divest its shares of CoStar Group. 

In an emailed statement, a CoStar Group spokesperson wrote that the company is “focused on executing our proven playbook to build on our momentum as we enter our next chapter of margin expansion and profitable growth. 

“We look forward to continuing to engage with stockholders as we continue to unlock the tremendous value of our digital ecosystem,” the spokesperson added. 

This move comes roughly two and a half months after Third Point sent a letter to CoStar’s board of directors calling on the firm to replace the majority of the board with “more qualified directors,” refocus on the firm’s core commercial real estate business and consider “strategic alternatives” for Homes.com, including shuttering or selling the platform. 

In response, CoStar has said that divesting Homes.com would cause the firm and its investors “irreparable harm.”

This letter came nearly a year after Third Point called on CoStar to embark on a journey of “meaningful self-help” and forcing the company to shake up its board. 

“So little progress has been made that we are convinced the Company never intended to do any of the things we discussed when we entered into the agreement,” Third Point wrote in its letter earlier this year. 

In January, CoStar provided investors with an update on financial and corporate governance initiatives for 2026, much of which they said was the result of a “robust review” of the company by the Capital Allocation Committee. While the update painted a fairly rosy picture for the firm as a whole in 2026, with estimated 18% year-over-year revenue growth to between $3.78 and $3.82 billion and a net income of $175 million to $215 million for the year, things did not look quite as strong for CoStar’s Homes.com. 

Although Homes.com has recorded a 337% increase in subscribers since Q1 2024, according to CoStar, the firm said it does not expect Homes.com to attain positive adjusted EBITDA until 2030. 

While CoStar Group is no longer facing activist investor pressure from Third Point, investor D.E. Shaw has also called on CoStar to divest Homes.com.

This post was originally published on here

After rising in February, existing home sales slowed again in March, according to data released Monday by the National Association of Realtors (NAR). 

Existing home sales fell 3.6% month-over-month in March to a seasonally adjusted annual rate of 3.98 million. Year-over-year this represents a 1.0% decline and the slowest pace of March home sales since 2009. 

According to NAR’s chief economist Lawrence Yun, lower consumer confidence and softer job growth are to blame for the decline in sales pace. 

As the pace of home sales slowed, inventory had the chance to accumulate, rising 3.0% from a month prior, finishing March with 1.36 million units for sale, representing a 4.1 months’ supply at the current sales pace. Compared to a year prior, inventory was up 2.3% in March.

“Inventory remains a major constraint on the market,” Yun said in a statement. “The inventory-to-sales ratio, or supply-to-demand ratio, is below historical norms. An additional 300,000 to 500,000 homes for sale would help bring the market closer to normal conditions and allow consumers to make purchase decisions without feeling rushed.”

Yun attributed the 1.4% annual increase in the median existing home sales price, which hit $408,800 in March, to the constrained inventory. This increase represents the 33rd consecutive month of annual price increases. 

While the pace of home sales slowed in March, the median time on market for properties declined month-over-month dropping from 47 days in February to 41 days in March. Annually, this is up 11 days from the 36 days recorded in March 2025. The share of first time homebuyers remained flat on a yearly basis, but declined two percentage points to 32% in March, while the share of all cash transactions also fell on a monthly basis, dropping from 31% a month ago to 27% in March, up from 26% in March 2025. 

Regionally, the sales pace for existing homes fell month-over-month in all four regions, with the Northeast (430,000 units) recording the largest decline at 8.5%, followed by the Midwest (-4.2% for a sales pace of 920,000 units ), the South (-3.1% for a sales pace of 1.86 million units) and the West (-1.3% for a sales pace of 770,000 units). On an annual basis, existing home sales were down in the Northeast (12.2%) and the Midwest (3.2%), but up in the South (2.2%) and the West (1.3%).

visualization

Additionally, while housing affordability improved on an annual basis in March, with NAR’s Housing Affordability Index rising nearly 10-points from a year prior, the index fell on a monthly basis, dropping to 117.5 in February to 113.7 in March. 

“The momentum of the spring market remains fragile,” Lisa Sturtevant, the chief economist at Bright MLS, said in a statement. “The ongoing conflict with Iran continues to create significant geopolitical uncertainty and is a primary driver of volatile mortgage rates and higher gas prices. A resolution to the conflict will help support a rebound in the housing market. However, if uncertainty, higher prices and mortgage rates persist, this could be a very slow spring.” 

With March’s data largely reflecting home sales that went under contract in January and February, prior to the conflict in Iran escalating, industry leaders expect to see further declines in the coming months. 

“Heading into 2026, the housing market had real momentum — mortgage rates were easing, affordability was improving and sidelined buyers were starting to reengage, keeping March activity relatively steady. Since then, the market has naturally become more deliberate, with some buyers and sellers pausing amid uncertainty while others move forward based on life-driven needs like job relocations, growing families and estate decisions,” Kamini Lane, the CEO and president of Coldwell Banker Realty, said in a statement.

‘The data reflects a market that’s becoming more thoughtful, not stalled. We’re seeing a shift from broad-based urgency to more intentional, life-driven decisions and for buyers and sellers ready to move, that often creates opportunity in moments when others hesitate and can be an advantage when conditions stabilize even more in the months ahead,” she adds.

In addition to the slower existing home sales pace, NAR also announced that it had revised its 2026 housing forecast downward, with the trade group now expecting existing home sales to rise 4.0% annually. The trade group also said it expects new home sales to now remain flat in 2026, down from its initial estimate of a 5.0% yearly gain. Despite these downward revisions, NAR said it still expects home sale prices to rise 4.0% in 2026. 

“Mortgage rates have been rising, and that has led us to trim our home sales outlook for the year,” said Yun. “Even with a more modest pace of sales growth, home prices continue to steadily increase due to minimal inventory growth.”

This post was originally published on here

The Jackson Arnett Group, a top-producing luxury real estate team in Rancho Santa Fe, has joined Douglas Elliman Realty in Rancho Santa Fe and North County coastal San Diego after more than seven years at Compass, the brokerage announced Monday.

Led by Delorine Jackson and Ian Arnett, who both serve clients along side agent Bayley Bachiero, the team will be based in Douglas Elliman’s Del Mar office, overseen by Dan Tomasi, executive manager of sales for San Diego, according to the company announcement.

In 2024, The Jackson Arnett Group closed 17 transaction sides totally over $52 million in sales volume, according to RealTrends Verified data. This performance earned the small team the No. 188 rank in the state for sales volume in the 2025 RealTrends Verified Rankings.

Douglas Elliman said the team’s move will deepen its footprint in Rancho Santa Fe and along the North County coastal corridor, two of Southern California’s highest-priced and supply-constrained luxury markets.

“We are thrilled to welcome Delorine, Ian and Bayley to the Douglas Elliman family,” Michael Liebowitz, president and CEO of Douglas Elliman Inc., said in the announcement. “Their extraordinary track record, deep roots in Rancho Santa Fe and North County San Diego, and commitment to excellence align perfectly with our vision of empowering elite agents to deliver unmatched service in California’s premier luxury markets.”

Jackson, a longtime Rancho Santa Fe resident, brings more than 20 years of experience as a luxury real estate advisor and entrepreneur. Her background includes commercial property investments focused on revitalizing Rancho Santa Fe’s downtown village, tying the team’s business strategy directly to local economic development.

“After more than two decades building our business in Rancho Santa Fe and North County Coastal San Diego, this move to Douglas Elliman represents the next meaningful chapter for our team and our clients,” Jackson said in a statement.

Arnett, a native of the greater San Diego region, has been a licensed real estate agent for more than 27 years. He is known for pairing local market knowledge with a design-forward, ROI-focused approach to listings, helping clients increase equity through targeted upgrades, floor-plan changes and cost-effective improvements.

“Joining Douglas Elliman is a strategic and exciting step forward for our team,” Arnett said in a statement. “This move will enhance our ability to maximize opportunities for buyers and sellers — from strategic property enhancements to publicizing high-end transactions — all while maintaining the personal, integrity-driven service our clients have come to expect.”

“Delorine, Ian and Bayley’s unique blend of market mastery, entrepreneurial spirit and community impact provide unlimited opportunities for buyers and sellers across San Diego’s high-end residential sector,” Bill Begert, the chief operations officer of brokerage, Western Region, Douglas Elliman, said in a statement. “The addition of the Jackson Arnett Group underscores Elliman’s unwavering commitment to supporting top-producing teams.”

This article was written by Brooklee Han and generated with the assistance of HousingWire Automation. It was reviewed by a HousingWire editor before publication. The system helps convert company announcements and industry data into HousingWire-style news coverage.

This post was originally published on here

RealTrends Verified’s 2026 brokerage rankings reveal clear momentum for technology-fueled challengers, with The Real Brokerage and LPT Realty again emerging as significant movers.

The Real Brokerage, led by CEO Tamir Poleg, held steady at No. 5 by sales volume with $65.2 billion.

But the company’s more notable achievement came in transaction sides, where it jumped to No. 5 — overtaking Hanna Holdings — and led all brokerages with a 40,749 yearly side gain.

Meanwhile, LPT Realty, headed by founder and CEO Robert Palmer, delivered one of the breakout performances of the rankings.

The firm vaulted from No. 10 to No. 7 in transaction sides — increasing its total to 61,04 and ranking third nationally with a 24,672 increase.

Poleg: ‘Agents follow value’ — not sign-on bonuses

For Poleg, Real’s sustained growth comes down to a single bet; agents will pay for tools that actually work.

“Real is the only brokerage that managed to grow so substantially in 2025 and 2024 as well, while we actually increased our pricing and increased our fees three times in the past three years,” he told HousingWire. “Typically, in times like these, brokerages cut fees and add a lot of concession and promotions, but we did exactly the opposite.”

That strategy, he argued, proves that agents follow value — not the lowest price, sign-on bonuses or recruiting checks.

“We just believe that the model by itself is very attractive,” Poleg said, pointing to Real’s proprietary platform reZEN as the technological backbone of that value proposition.

“reZEN consists of multiple features and products for agents, but essentially it’s like an operating system for an agent business,” Poleg said. “It gives full visibility into the agent’s business and finances on our platform. It’s been a huge, huge driver and we keep adding more layers to reZEN.

Roughly 18 months ago, Real added Real Wallet — allowing agents to open checking accounts, access lines of credit and more.

The results have been striking, Poleg said.  

“We have over 7,000 agents right now banking with us on the wallet,” Poleg said. “Their churn is about 80% lower compared to agents that are not on the wallet.”

That retention metric has helped keep revenue churn at its lowest level in five years.

“We are determined to think very long term,” Poleg said. “That means investing in technology that will give our agents an unfair advantage in the next five or 10 years. We are thinking about profitability, but at the same time, we put a lot of resources into tech development.

“In 2026, our [research and development] budget has increased, but we were able to both grow significantly, lower our operating expenses per transaction, and invest heavily in technology, all three together, which is outstanding.”

When asked about the risk of a growth plateau — a common concern for rapidly expanding firms — Poleg dismissed the idea.

“If you look at the past three years, we were able to add anywhere between 5,000 to 10,000 agents on an annual basis for three years in a row,” he said. “I think that that trajectory will continue. What’s happening right now is a paradigm shift in real estate. Agents are migrating from traditional models such as Keller Williams or Century 21 to newer models like Real and even LPT and eXp.

“Agents today are looking for something else. They’re looking for more freedom, more flexibility, more technology and just a brokerage that is a platform for them to grow their businesses on — rather than a brokerage that you join and you actually build somebody else’s business.”

Palmer: Meeting agents where they are

For LPT Realty’s Palmer, the secret to his firm’s rapid ascent — from No. 10 to No. 7 in transaction sides — is rooted in a philosophy of individualized support rather than a one-size-fits-all model.

“A big part of what we did is we built models that meet agents where they are,” Palmer said. “Instead of trying to force them to be something for us, we try to meet them where they are in their career.”

That approach centers on what Palmer calls an “individual definition of success.”

“Whether that’s an agent selling three, four or five houses a year, or a team leader who wants to build a 2,000-unit-a-year team, we’ve got a plan and infrastructure here at LPT to help them grow and achieve that definition of success,” he said. “I think that’s probably been our single biggest differentiator.”

On compensation, Palmer pushed back against the notion that agent-friendly cap models necessarily hurt brokerage margins.

“When people think about the cap model, if you look at the other publicly traded cloud models, having too many high producing agents is actually more damaging to your margin than our model is,” he said. ”We have lots of high-producing agents. I think we’re submitting 600-plus agents and teams for [RealTrends Verified’s rankings] this year.

“We also didn’t leave the smaller agent behind. We didn’t leave the agent who’s just getting going behind. It’s really helped us balance out the business.”

Recruiting, Palmer said, has been driven by productivity — not just headcount.

“You’ll see in our rankings there, our transaction count grew faster than our agent count,” he said. “Agents continue to become more productive as they get on the platform.”

On the question of a potential growth plateau, Palmer shared similar sentiments to his counterpart at The Real Brokerage.

“We’re the fastest brokerage to ever reach the top 10 — the fastest brokerage to ever reach No. 7,” he said. “But we’ve actually been pretty judicious about the growth. We’re focused geographically and a dominant force in the state of Florida. We’re the number one brokerage by agent count and transaction count in Central Florida, where we originally launched.

“We’ve got dominant agent counts and transaction counts in California and Texas, but there’s still a lot of room for us to grow.”

As for commission compression following the NAR settlements, Palmer said LPT’s average price point in the high $300,000s insulates the firm.

“We’re very much helping the average first-time homebuyer, the average American buy a home,” he said. “We’re not specializing in multi-million-dollar properties, which is where I think you see the most commission compression. The nature of our cap and our flat fee means that we’re really in a great position to [hit financial goals] and still give the agent plenty of room to succeed if there is a little bit of commission compression.

“But I can tell you to date, we haven’t seen any commission compression happening across our business.”

Steve Murray: Plateaus hard to avoid

Longtime industry expert Steve Murray — senior advisor for HousingWire and founder of RealTrends and RTC Consulting — offered a dose of perspective for Real and LPT.

“They still have room to grow, but the big factor is when you’re the new guy and you have a different model,” he said. “When you’re using equity in your business as a means to recruit agents, sooner or later, you run out of equity, as Compass found out. Sooner or later, you can’t just keep offering your stock to agents and teams.”

On the question of a growth ceiling, Murray was unequivocal.

“Every firm I’ve ever noted in my years of doing this — they use various means to grow rapidly — and every one of them seems to hit a plateau of some kind,” he said. “Then it becomes harder to keep growing at that rate, because there’s always new forms of competition offered out there.

“At their current levels of production, [Real and LPT] would need to quadruple in size to be doing enough transactions to break through to the top three.”

Even if a slower growth period comes for one of or both companies, Murray said what Real and LPT have achieved demands respect and acknowledgement.

“At one time, REMAX was the new guy on the block,” he said. “At another time, Keller Williams was the new guy on the block. eXp was the new kid with the new model and new offerings. They all grew extraordinarily rapidly. Then they all seemed to hit a certain level, and they’ve all kind of plateaued. It’s just the nature of our industry and the way it works.

“Still, [Real and LPT] should be proud of what they’ve achieved, and I’m greatly respectful of what they’ve accomplished.”

This post was originally published on here

Over the past year, consolidation has consumed the real estate industry, with many questioning if mid-sized regional independent firms would be able to survive, let alone contend in this emerging environment dominated by national monoliths like eXp Realty and Compass International Holdings. The 2026 RealTrends Verified Rankings, however, make these concerns seem irrelevant. 

Independent brokerages accounted for 28.79% of market share in this year’s rankings, which are based off of 2025 production, up from 26.98% last year.

This is exemplified by the impressive jump made by LeadingRE, a network of independent real estate firms, leaping from the No. 5 brand in 2025 to the No. 2 brand by transaction sides and increasing its market share to 11.08%, up from 8.93%.

Included in LeadingRE’s network are many top-producing brokerages including Hanna Holdings, which ranked No. 6 by both sides and volume, William Raveis Real Estate, John L. Scott Real Estate, Brown Harris Stevens, The Keyes Company/Illustrated Properties, Baird & Warner and First Team Real Estate. In total, the LeadingRE network closed 462,910.4 transaction sides totaling $275.844 billion in sales volume in 2025.

Private independent firms prove they can compete against public companies

“While many people think the model of a privately owned independent brokerage is destined for the dustbin, the data seems to say otherwise,” Steve Murray, the co-founder of RealTrends Consulting, said. “Anybody who says that a privately owned independent, local, regional brand can’t compete, doesn’t know what they’re talking about.”

Kate Reisinger, the chief operating officer of LeadingRE, shared a similar sentiment. 

“Over the past few years, the industry has gone through so much change — market shifts, consolidation, the evolution of the business model — and in that environment, independent firms have navigated the complexity with laser sharp focus, determination and optimism,” Reisinger said. 

Hyperlocal equals consumer trust

Resinger, in part, attributes the success of these companies to their local nature.

“These are firms that are so entrenched in their communities. They are hyper-local, and that allows them to stay close to their agents and clients,” Reisinger said. “In a time of so much change and uncertainty, not only in our industry but also in national news, consumers are craving very clear direction, assurance, expertise and trust. Those are all strengths of these independent companies, in part because they are so deeply embedded in their communities. We have companies in our network that are over 100 years old. They aren’t just operating in a market; they helped build the community.”

For Murray, the strong performance by independent firms in 2025, exemplified by the LeadingRE Network, illustrates that a firm with a good leader, no matter if they are a large national company or a regional independent firm, will be successful. 

“As long as this business is still mostly about the ability to recruit and develop and retain good agents, any good leader of a brokerage company, whether they’re with a brand or they’re independent, has an equal opportunity to compete and grow,” Murray said. “Since RealTrends started ranking brokerages, we’ve consistently said that the data shows that by far, the most important characteristic of a successful growing brokerage company is the leadership — not the tech and not the brand.”

Attracting talent

The strong ability of many of LeadingRE’s broker-owners to attract talent and grow was reflected in the many M&A deals conducted by LeadingRE firms in 2025. Notable acquisitions in 2025 include Baird & Warner’s acquisition of Dream Town, Lamacchia Realty’s acquisition of Tirrell Realty, Portside Real Estate Group’s merger with Swan Agency Real Estate and Howard Hanna’s entrance into New York City with its acquisition of Elegran Real Estate

“It is clear that leading independents have been actively engaged in acquisitions as a means of growth,” Murray said. 

While many leading independent firms have been acquired over the past few years, including Compass’s acquisition of Latter & Blum, Murray said independents have a way of “regenerating.” 

“Even with the acquisitions, independents continue to be leading companies in many markets,” Murray said. 

Reisinger attributes this to leaders being able to identify and capitalize on opportunities.

“Independents are able to be nimble and they can make decisions quickly, says Reisinger. “With large homogenized brands, decision making often takes longer and sometimes the choices made do not always reflect the realities or priorities of the local market or culture,” she said. “Independent firms are adapting in real time and changing and evolving with change. Rather than being disrupted by it, many of our firms are using it as an opportunity to strengthen their position.”

While Reisinger acknowledges that consolidation continues to be the norm right now in the real estate industry, she still believes that there will continue to be opportunities for independents to succeed. 

“We are seeing a bifurcation in the market right now,” Reisinger said. “On one side are large scale organizations and on the other are hyper-local, highly focused firms that, according to the data, are outperforming the market. That is where we lean in, continuing to inspire trust in our markets and demonstrate our expertise because we perform best when we capitalize on those strengths.”

This post was originally published on here

The housing market doesn’t turn all at once.

But over the past decade, one pattern has shown up again and again: Housing cycles tend to unfold in a recognizable sequence, and the earliest signals appear when pricing behavior and buyer response start to diverge.

That’s the real playbook for navigating today’s housing market.

Housing cycles tend to follow a sequence

Looking back across the past 10 years — from post-recession recovery to pandemic acceleration to today’s more fragmented market — the same pattern tends to repeat.

Demand builds. Sellers push pricing. Buyers begin to push back. The market resets. Then recovery begins again, often unevenly.

Not perfectly. Not on a fixed timeline. But consistently enough to matter.

The signals that matter most

Across markets, three signals are defining how housing is actually behaving right now: pricing behavior, market response and friction.

Pricing behavior: where sellers are pushing

List prices show where sellers want the market to go.

Right now, median list prices are near $440,000, while roughly one-third of listings are cutting price. At the same time, buyers are accepting prices below asking, creating a clear 9% gap between seller intent and market reality.

This is not a collapsing market. It is a market negotiating.

Market response: whether buyers are following

The next question is whether buyers are actually agreeing.

Demand remains functional, but uneven. Well-priced homes are still selling in 63 days, while overpriced homes are sitting significantly longer — pushing the average to 121 days. That 58-day spread is what defines today’s two-speed market.

Friction: where expectations start to break

This is where markets turn.

Withdrawals now account for 22% of weekly activity, and deal fallout continues to show up across markets — clear signs that transactions are failing to close at initial expectations.

That pressure is what eventually forces pricing to adjust.

How housing cycles actually unfold

Across cycles, housing markets tend to follow the same sequence: Sellers push prices higher, buyers initially keep pace, and then acceptance begins to weaken. Price cuts rise, deals stall and the market resets.

The key insight is that markets do not turn when prices fall. They turn when pricing and buyer behavior fall out of sync.

This has played out repeatedly in recent cycles. In 2022, markets like Phoenix made it clear. Sellers continued pushing prices even as buyer follow-through weakened, and the gap between asking and accepted prices widened into double digits before the market reset.

What this cycle looks like now

Today’s data points to a market in negotiation, not one moving in lockstep.

With price cuts hovering around one-third of listings and a meaningful gap between asking and accepted prices, today’s market looks very different from the unprecedented acceleration of 2021 and the challenging recalibration of 2023.

That view aligns with Logan Mohtashami’s latest weekly Housing Market Tracker, which shows inventory growth slowing sharply, new listings still constrained and demand soft but not broken. Mortgage rates below 7% are keeping the market functional, even as momentum remains capped.

In other words, supply is no longer expanding the way it was, but demand has not fully rolled over either. That leaves housing in a market-by-market balancing act, not a clean national upswing.

The real story is local

Markets diverge before they turn.

Some metros reaccelerate earlier. Others show stress sooner through wider pricing gaps, more price cuts or slower conversion. That divergence is not noise. It is often the signal.

Local markets tend to turn before national averages do, making them the earliest read on where the cycle is heading.

What to watch next

The next phase of this cycle will likely be determined by one thing: whether pricing and buyer behavior move back into alignment — or further apart.

If the gap between asking and accepted prices widens, it would signal more friction ahead, with additional pressure on sellers and a higher likelihood of price adjustments.

If that gap narrows, it would suggest buyer acceptance is strengthening and that the market may be stabilizing or beginning to reaccelerate in select areas.

The signal will not come from price alone. It will come from whether buyers are actually following.

Takeaway: Watch the gap, not just the price

Pricing shows intent. It tells you where sellers want the market to go.

Buyer behavior shows acceptance. It confirms whether the market is actually following.

Price cuts and deal fallout show friction. They signal when expectations are breaking.

The earliest signals are local. Market shifts tend to show up in specific metros before they appear in national data.

The bottom line

Over the past 10 years, housing cycles have been defined by behavior.

Sellers push. Buyers respond. When the two fall out of sync, the market has to adjust.

That is the signal to watch.

To track real-time pricing, demand and market signals at the national, metro and ZIP-code level, explore HousingWire Intelligence. For deeper context on rates, demand signals and the macro backdrop shaping housing activity, read HousingWire’s Housing Market Tracker weekly analysis.

HousingWire used HousingWire Data to source this story. This article is based on single-family residence data through April 10, 2026. For enterprise clients looking to license the same market data at a larger scale, visit HousingWire Data.

This post was originally published on here

As consolidation reshapes the mortgage landscape, Bayview Asset Management’s acquisition of Guild Mortgage is emerging as a case study in how to scale without disruption, particularly in the often-misunderstood reverse mortgage space.

In a conversation with HousingWire‘s Reverse Mortgage Daily, Jim Cory, managing director of reverse mortgages at Guild Mortgage and co-chair of the board for the National Reverse Mortgage Lenders Association (NRMLA), shared details on how the transition has unfolded, why the deal is viewed as a “massive net positive,” and how broader shifts like product innovation and growing participation by large independent mortgage banks are redefining the trajectory of reverse mortgage lending.

Editor’s note: This interview has been edited for length and clarity.

Sarah Wolak: Has Bayview’s acquisition changed or enhanced Guild’s reverse division?

Jim Cory: The acquisition went very smoothly. Bayview basically said, “We want Guild to run as Guild” and kept all the management in place. So as far as that goes, it’s the same group overall at Guild, including on the reverse side.

Bayview is excellent at developing products, and we see this as a benefit. It brings a lot of capital to the table, so we’ll see what changes happen going forward, but we’re seeing this as a massive net positive.

Wolak: That’s interesting, since acquisitions can involve companies deciding to clear house and start from scratch. How has the transition been?

Cory: Not easy, but it hasn’t been disruptive. That’s the best way to put it. It’s a massive net positive.

Wolak: Shifting to the state of reverse, many stories over the past few months have centered on concerns about the Home Equity Conversion Mortgage (HECM) program. Are there any concerns or emerging trends that you’re noticing?

Cory: I’d point to no concerns; I see the reverse business being stronger than ever. I see two major trends going on, though. One is the development of new products. People look at HECM and say there aren’t as many being made and it doesn’t seem like it’s growing.

But what is growing is the sheer number of products, and usage is really taking off. It’s easy to find HECM numbers but much harder to track proprietary reverse products or loans being sold as retirement mortgage solutions. We’re seeing a significant increase in the usage of reverse mortgages and retirement loan strategies. It’s very healthy.

The second trend is the inclusion of large forward independent mortgage bankers, like Guild. All the major IMBs not just sell reverse but have thriving reverse departments. They’re doing things like underwriting and funding their own reverses, and really growing in the space.

Wolak: Are there specific strategies that are gaining traction?

Cory: One of the latest is second-mortgage strategies — whether it’s a HELOC or a HELOAN. It could be a reverse, meaning no payment and age-based, or something similar to a reverse.

Also, when people express concern about HECM, I think some of the concern is when you only look at HECMs. I look at it differently. I’m thankful the current administration wants more proprietary lending. It’s not necessarily less FHA, but it’s a better balance between FHA and proprietary lending. That’s exactly what we’re seeing and it’s a good thing for the industry.

Wolak: Does the growth of larger lenders in the space help address stigmas and preconceived notions borrowers have about reverse mortgages?

Cory: Yes. We’re seeing a lot of growth, and it goes hand in hand with product. At Guild, the goal isn’t just to sell reverse. It’s to present an option to someone. If someone is purchasing or looking for a cash-out refi, we’ll give them multiple options. If they’re an elderly American, we’ll present reverse or reverse-like products. 

Wolak: What is most critical heading into 2026 from a policy standpoint, particularly through your work with NRMLA?

Cory: As co-chair of NRMLA, I’d say a lot of this stems from HUD’s request for information last year. NRMLA answered the RFI, a lot of other groups did too, and many of the answers seemed to be the same. 

Changes are needed to the mortgage insurance premium structure, especially the upfront MIP, which has stayed the same while lending amounts have declined due to higher rates. People are paying more upfront for less. There’s probably a better structure out there.

NRMLA also reinforced the importance of counseling. There’s been some turbulence in that area, and we think that counseling with HECMs and reverse mortgages overall, all of the different products require the borrower to be counseled. We think that is just absolutely important — and for a protected class, that’s really needed.

NRMLA also talked about indexing to the Secured Overnight Financing Rate (SOFR) instead of the Constant Maturity Treasury (CMT). We also mentioned servicing reform: HUD is currently in the servicing business due to loan assignments, and NRMLA offered HUD a way to get out of the servicing business and keep that servicing with the servicer, which would be less disruptive for the client and would alleviate some of those concerns.

Modernizing the second appraisal process is also a big one. On the forward side, you use a collateral underwriter, which analyzes the appraisal and has a couple of different things that basically forces a lender to do, at a minimum, running some automated valuation models (AVMs) and compare it with the collateral underwriter score.

It could involve a desk review. It could involve a second appraisal, but we find that a second physical appraisal is unnecessary, and is really disruptive and confusing for our senior clients.

Wolak: What’s the justification for the second appraisal process?

Cory: The original goal was to address overvaluation. The simplest solution was to require a second appraisal. Well, the confusion is now the borrower has two different appraisers come to their house. What if they have totally different opinions of the value? What if they have different opinions as to what repairs are required? It just causes concern and confusion for everyone involved. 

We did not recommend eliminating it but modernizing it to be similar to the forward side. For example, using a collateral underwriter score or a desk review instead of a second full appraisal.

Wolak: Are there other areas where reverse could be modernized?

Cory: Modernizing financial assessment. For example, you can’t pay off unsecured debt at closing to help a borrower qualify, which we do all day, every day on the forward side. It’s a key component of mortgage lending and it’s not allowed for HECMs.

In fact, in the 2017 HECM Final Rule, it said the FHA commissioner has the authority to allow the payoff of unsecured debt as a mandatory obligation paid at closing, and they never chose to do it. It’s unclear why that isn’t allowed.

The concern has been that borrowers might run debt back up. I don’t like that argument, because they could do the same thing on the forward side — and on the forward side, they’ve got a payment to make.

In reality, reverse borrowers often improve their credit. They get the reverse mortgage, they get cash at closing and they start paying down debt. They get rid of high-interest credit card debt. They pay off high-interest installment debt.

This post was originally published on here

You’re experienced. You’ve closed deals, navigated tough transactions and built a book of business. But your production hasn’t meaningfully changed.

One month is strong, the next is quiet. No matter how many hours you put in, it’s hard to build consistent momentum.

This is where a lot of agents stall.

According to the National Association of REALTORS®, agents with six to 15 years of experience close a median of 11 transactions per year. Those with 16+ years close 10. After years in the business, most agents aren’t scaling. They’re maintaining.

This article breaks down how to move past it, with a practical development plan built for agents who already know the basics but need a more intentional path forward. You’ll get a diagnostic framework, a way to reset your production math, a 90-day skill plan and a weekly operating system to tie it all together.

Step 1: Diagnose why you’re stuck

Before you build anything, you need to know which kind of plateau you’re dealing with. Not all stalls look the same.

Most plateaus fall into one of four categories. The key is identifying which one you’re in so you can stop guessing and start solving the right problem.

Lead generation plateau

This shows up when your pipeline feels unpredictable. You might have strong months followed by uncomfortable gaps, which usually means your lead flow isn’t consistent or diversified.

Ask yourself:

  • Is my pipeline consistently full, or am I scrambling every other month?
  • Are my leads coming from just one or two sources, with no backup plan?
  • Have I stopped actively prospecting because I feel like referrals should be coming in by now?

If this sounds familiar, the issue isn’t effort. It’s that your lead generation isn’t systemized. You’re relying on momentum instead of creating it.

Conversion plateau

You’re getting opportunities, but they’re not turning into closed deals at the rate they should. This is where a lot of experienced agents get stuck because they assume experience alone should carry the conversation.

Ask yourself:

  • Do my leads go quiet after the first call or showing?
  • Is my appointment-to-contract ratio flat or declining?
  • Am I losing listings at the presentation stage more often than I’d like to admit?

This usually points to gaps in follow-up, messaging or how you’re guiding clients through decisions. Small improvements here can have a massive impact on your income.

Positioning and brand plateau

This is less about what you do and more about how you’re perceived. If your brand isn’t clear, you’re competing on effort instead of authority.

Ask yourself:

  • Do people in my housing market know what I specialize in, or am I “just a real estate agent”?
  • Is my online presence doing any heavy lifting, or is it just sitting there looking dated?
  • Am I getting passed over for agents who seem less experienced but more visible?

When your positioning and brand are unclear, you end up chasing business instead of attracting it.

Skill and confidence plateau

This one is subtle but powerful. You’re experienced, but there are certain moments where you hesitate, avoid or play it safe.

Ask yourself:

  • Do I hesitate in pricing conversations or negotiations?
  • Am I avoiding certain deal types because they feel uncertain?
  • When was the last time I intentionally practiced a skill outside of an actual transaction?

At this stage, growth comes from refinement, not repetition. If you’re only practicing during live deals, you’re limiting how far you can improve.

Get reinspired by completing Colibri Real Estate’s Real Estate Leadership and Career Achievement (RELCA) Certification. The certification includes courses on strategy, as well as practical tools to help you break through a plateau.

Step 2: Reset your production math

A lot of agents stay busy but don’t have a clear target they’re working toward. They know they want to make more money, but they’re not tracking the numbers that get them there.

The fix is to get specific. When you understand your numbers, you can reverse-engineer your income goal into clear, weekly activity targets you can control. Here’s the framework:

  • Set your annual income goal: Define exactly how much you want to earn this year.
  • Calculate your average commission per transaction: Use your realistic average, not a best-case deal.
  • Determine the number of transactions needed: Divide your income goal by your average commission.
  • Identify your listings-to-buyers ratio: Focus on the side of the business that’s most efficient for your market and skill set.
  • Know your appointment-to-close conversion rate: Understand how many appointments it takes for you to secure a signed client.
  • Establish weekly activity targets: Work backward to determine how many appointments and conversations you need each week.

In short, flat production isn’t a bad market problem. It’s a plan problem.

If your goal is $120,000 and your average commission is $10,000, you need 12 closes to reach that goal. If half your business comes from listings and your listing-to-close rate is 60%, that means you need about 10 listing appointments per year, roughly one every five weeks. Every week you don’t hit that number, the math starts catching up to you.

Step 3: Build a 90-day skill acceleration plan

Here’s where most real estate agents get it wrong. They mistake being busy for developing. Showing 12 houses a week is activity; refining your listing presentation after every appointment is growth.

This 90-day plan focuses on leveraging skills because those are the ones that multiply results without multiplying hours.

Month 1: Listing mastery

Listings are the engine of a scalable real estate business. If you’re not consistently winning them, everything else is harder and more expensive.

  • Tighten up your listing presentation so it follows a clear, repeatable flow that you can deliver without notes.
  • Get sharper with your pricing strategy and how you walk through your CMA, so sellers trust your numbers before you even leave the room.
  • Level up how you handle the most common objections you hear, especially the ones that tend to throw you off.
  • Practice your full presentation out loud at least once a week. (Yes, actually out loud. It makes a difference.)

The goal isn’t perfection. It’s confidence built through repetition.

Month 2: Conversion optimization

Getting leads isn’t the finish line. Month two is about turning more of what you already have into signed contracts.

  • Develop a buyer consult script that builds trust fast and sets clear expectations upfront.
  • Build a follow-up cadence that doesn’t rely on your memory. (Your CRM doesn’t forget.)
  • Create a lead nurture sequence for the people who aren’t ready yet but will be in 60 to 90 days.
  • Practice negotiation scenarios, especially multiple offer situations and post-inspection conversations.

The typical REALTOR® earns only 20% of business from repeat clients and 21% from referrals, according to NAR data. That number climbs to 41% repeat business for agents with 16 or more years of experience. The gap isn’t time. It’s a system.

Month 3: Market authority

Month three is about planting the seeds that make the next six to twelve months easier. This is how you become the name people say when someone asks, “Do you know a good agent?”

  • Define a niche, whether that’s a neighborhood, price point or buyer type, and commit to it.
  • Show up consistently with local content: a monthly market update, a community newsletter or a social post that’s actually useful.
  • Build at least three referral partnerships with complementary professionals like lenders, attorneys or financial advisors.
  • Get visible in your community beyond your business profile.

This isn’t overnight work, but it’s what separates agents who hustle from month to month from agents who’ve built a business that generates business.

Weekly operating system for growth

One of the fastest ways to stay stuck is to have no structure to your week. Here’s a schedule built for agents serious about breaking through.

  • Two days, prospecting intensity: Spend two days on focused prospecting. Use dedicated time blocks for lead generation, outbound calls, database touches and neighborhood outreach.
  • One day, listing presentation improvement: Dedicate one day to improving your listing presentation by reviewing your last appointment, identifying one area to refine and practicing it before the next one.
  • One day, relationship expansion: Use one day to expand relationships by meeting with a referral partner, following up with past clients or getting involved in your community to build visibility.
  • One skill deep-dive block: Schedule one skill deep-dive session each week, such as completing a course module, joining a coaching call or participating in a role-play exercise.
  • One metrics review session: Hold one metrics review session where you analyze your numbers, compare them to your production goals and adjust what isn’t working.

This isn’t rigid. But agents who operate with a repeatable weekly structure consistently outperform agents who wing it.

How continuing education can be a growth lever (not just a requirement)

Most agents treat continuing education as a requirement to maintain their licenses. The agents who continue to grow treat it as a way to upgrade how they operate.

One option designed specifically for this stage is Colibri Real Estate’s Real Estate Leadership and Career Achievement (RELCA) Certification. It focuses less on transaction basics and more on how to build a more structured, scalable business.

The program includes:

  • Four self-paced courses (eight hours total) focused on business strategy and growth 
  • A set of practical tools, including business planning and career mapping resources
  • Applied assignments to translate concepts into your day-to-day operations
  • A certification exam and a credential upon completion
  • Ongoing access to the material for continued reference

The curriculum centers on defining a revenue model, setting measurable benchmarks, evaluating broker licensure decisions and building systems that support long-term growth rather than short-term production.

For agents who feel stuck despite experience, this type of structured development can provide a clearer path forward. It’s available free with Colibri Real Estate’s Pro or Premier CE Membership, or at a discounted rate for individual purchase with your CE membership.

Choose a CE Membership Package

This post was originally published on here

Mortgage servicers and their partners need dashboards for speed and transparency.

Interactive dashboards are a practical application of business intelligence (BI) technology, designed to make data accessible and actionable for day-to-day decisions. Microsoft Power BI and similar platforms allow users to filter, drill, and visualize data in an interactive way. Many leading dashboard platforms also offer emerging AI-driven capabilities that support faster insight discovery. 

As these tools continue to evolve, interactive dashboards are transforming how mortgage servicing teams access data and make decisions. This reporting format is quickly becoming a strategic requirement for transparency, compliance, and agility.

How interactive dashboards replace static mortgage reports

Traditional monthly or quarterly reports require teams to comb through data, export to spreadsheets, and build analyses manually. That process is time-consuming and introduces delays between data generation and action. Interactive dashboards flip that model. Users can filter, drill, export, and analyze instantly within a secure environment.

This shift replaces clunky manual work with real-time data access and enables fast responses to emerging issues. Decisions that once took days or weeks can now occur within minutes or hours.

Why mortgage servicers need real-time dashboard access

It is not just internal stakeholders who benefit. Lenders, servicers, and investors rely on comprehensive and timely reporting from their third-party partners. When this data is delivered through dashboards rather than static reports, users gain the ability to self-serve instead of being dependent on reporting cycles or turnaround times.

That autonomy is vital in today’s servicing environment, where loan-level information, such as delinquency triggers, insurance status, or catastrophe risk, can shift rapidly. Dashboards also help identify emerging risk trends and operational constraints quickly, supporting proactive decision-making during high-impact events. When third-party partners provide interactive, granular access, servicers can act quickly rather than rely on delayed updates that can limit responsiveness and heighten oversight risk.

How dashboards support regulatory transparency and compliance

This need for speed is more than convenience. It reflects broader regulatory and investor expectations. Agency programs like Freddie Mac’s Clarity Data Intelligence, introduced several years ago, have set the tone for transparency expectations. It established centralized access to loan-level credit risk transfer (CRT), mortgage-backed securities (MBS), and performance data, creating a baseline that servicers are expected to match. 

At the same time, regulators are tightening servicer obligations. The Consumer Financial Protection Bureau (CFPB) has proposed amending Regulation X to begin a loss mitigation review cycle as soon as a borrower requests assistance, requiring servicers to communicate decisions promptly and provide procedural safeguards. While the final rule has not been published, the proposal signals a clear expectation for timely communication. Interactive dashboards help meet these expectations by surfacing status updates in real time and reducing bottlenecks.

Data-driven culture: Empowerment speeds actions

Many firms acknowledge the value of BI and analytics. By 2025, over 78 percent of global enterprises had implemented at least one BI platform, and 65 percent of those were cloud-based. Self-service BI adoption grew 31 percent year-over-year. These figures are drawn from a 2024–2026 global analytics report compiling verified BI adoption and market data. 

While these figures reflect broader BI adoption, interactive dashboards are the practical, user-facing layer that turns this data into actionable insights for day-to-day decisions. Industry research shows that 81 percent of banks and insurers name generative AI and analytics among their top technology priorities. This matters because teams with dashboard access spend less time searching for data and more time acting on it. This helps organizations respond faster and make informed decisions with confidence.

Best practices for implementing interactive dashboards

The goal is not simply to deploy dashboards. It is to embed clarity and consistency across processes. 

Dashboards require discipline, including:

  • Clear definitions for key metrics
  • Automating alerts for exceptions
  • Mapping inputs back to source systems
  • Ensuring calculation rules are consistent and trusted across all reporting

This discipline turns dashboards into living systems of record rather than polished interfaces with stale or mismatched data.

The next step for servicing leaders

For mortgage servicers already using dashboards, the question is refinement: Is the data timely, consistent, and actionable? Are partners providing data access with similar rigor, or are they still delivering static reports with delayed updates?

For firms considering their first platform, now is the moment to invest strategically. Interactive dashboards are not just a tech trend. They are the infrastructure for fast, confident decision-making internally and across extended servicing ecosystems. Companies that embrace them with discipline will gain operational freedom and build stronger partnerships. Companies that delay will remain stuck in slow cycles and outdated visibility.

Jennah Morgan is Senior Director of Business Technology Strategy at National General Lender Services.
This column does not necessarily reflect the opinion of HousingWire’s editorial department and its owners. To contact the editor responsible for this piece: zeb@hwmedia.com.

This post was originally published on here

Is housing inventory about to go negative? Since mid-June 2025 I’ve been writing that housing market dynamics have shifted, which we could already see in our HousingWire data while it might take other sources six to nine months to show that.

This shift should create some negative year-over-year inventory in 2026 and if the Iran war didn’t happen, we might have already seen this happen. The first three months of 2026 has shown the lowest mortgage rate curve for several years — which has been one big driver of inventory growth slowing down.

A lot of this also has to do with very hard year-over-year comps as inventory growth was good last year but — very similar to 2023 — when rates get toward 6%, the growth rate of inventory just doesn’t grow as fast as it does when rates are above 7%. This Housing Market Tracker also shows the impact of the Easter holiday, but still, the growth rate of inventory is slowing down enough to possibly get negative national year-over-year data soon like we have seen in some specific parts of the U.S.

Housing inventory

Inventory is seeing its traditional seasonal increase and while we are on the verge of going negative over last year, inventory is in a much healthier spot than the COVID years. Easter weekend had some impact on last week’s data, but the growth rate is really running  into hard comps until mid-June.

We have gone from 33% year-over-year growth in inventory at the highest point in 2025, to 3.21% last week. In the past, inventory growth picked up amid higher mortgage rates, softening demand and rising year-over-year new listings. Even with the Iran conflict pushing rates higher from 5.99% toward 6.64% recently, 2026 has had the lowest rate curve for the housing market to work from since 2022 and rates have not gotten above 7% in a while. 

  • Weekly inventory change: (April 3-April 10): Inventory rose from 723,460 to 724,977
  • Same week last year: (April 4-April 11): Inventory rose from 691,173 to 702,436

New listings

I have been disappointed with the new listing data so far this year as I was hoping we would get some weeks where new listings ranged between 80,000-100,000 during the seasonal peak months, which would be what we would see in a normal year.

Last week new listings were again negative year over year. I can attribute some of that data to the Easter holiday but it’s still been a disappointing year with new listings as it looks very hard to get the range I wanted. For context, during the housing bubble crash, new listings ranged from 250,000 to 400,000 per week for several years.

Here is last week’s new listings data for the past two years:

  • 2026: 70,244
  • 2025: 76,271

visualization

Price-cut percentage

Typically, about one-third of homes undergo price reductions before they sell, reflecting the dynamic nature of the housing market. As mortgage rates and inventory rise together, the percentage of price cuts increases.

In my 2026 home-price forecast, I had a negative 0.62% call for the year nationally. However, mortgage rates were lower than I thought they would be at the start of this year and the FHFA’s announced purchase of mortgage-backed securities pushed mortgage spreads lower than I expected.

I believed we would see that improvement later on in the year. Spreads are higher than that level today due to the Iran conflict so if there was no Iran conflict my forecast would have been incorrect. Now, if rates head higher and stay higher for longer, I do have a shot at my call being more correct. Still, the percentage of price cuts is below this time last year.

The price-cut percentage for last week:

  • 2026: 34.30%
  • 2025: 35%

visualization

10-year yield and mortgage rates

In the 2026 HousingWire forecast, I anticipated the following ranges:

  • Mortgage rates between 5.75% and 6.75%
  • The 10-year yield fluctuating between 3.80% and 4.60%

Last week saw the 10-year get as low as 4.23% due to the ceasefire news, but ended the week at 4.32% as we all wait to see if a ceasefire can hold. Even amid higher oil prices, the 10-year yield didn’t reach its yearly high last week, holding mostly steady with news about the ceasefire and hotter inflation data. Mortgage rates didn’t budge too much this week as they started at 6.43% and ended the week at 6.39%.

visualization

Mortgage spreads

Mortgage spreads remain a positive story for housing in 2026, as mortgage rates would have easily been over 7% in 2023 and 2024 and close to 7% in 2025, with the current 10-year yield level and the worst spread levels. The spreads were already getting worse in February as yields fell, compressing volatility on the downside, and then got even worse due to the war, but now have moved slightly lower again. As you can see below, we are still at better levels than the past two years.

visualization

Historically, mortgage spreads have ranged from 1.60% to 1.80%. Last week, spreads closed at 2.05%, down from 2.11% the week prior.

However, I wanted to compare last week’s rates to the worst levels of the spreads over the past three years, with the 10-year yield at its current level.

  • If we had the worst mortgage spread levels of 2023, mortgage rates would be 7.45% today, not 6.39%.
  • If we had the worst levels of 2024, mortgage rates would be 7.08% today.
  • If we had the worst levels of 2025, mortgage rates would be 6.88% today.

Weekly pending sales

Our weekly pending home sales data provides a week-to-week perspective, though results can be affected by holidays and short-term fluctuations such as Easter weekend. Housing demand has slowed down with higher rates and last week we were down week to week and year over year. Again, some of this has to do with Easter weekend, so I am very interested to see next weekend’s data.

Weekly pending sales usually take 30-60 days to hit the sales data. Typically, mortgage rates above 6.64% and breaking over 7% really impact the data. Under 6.25% has been the sweet spot over the past several years, excluding short-term variables.

Weekly pending sales last week over the last two years:

  • 2026: 68,864
  • 2025: 71,632

visualization

Mortgage purchase application data

Purchase application data is a forward-looking indicator: growth here leads home sales by roughly 30-90 days. Last week, we saw week-to-week growth of 1% but purchase apps were down 7% year over year. So, higher mortgage rates are impacting this data but nothing too dramatic so far. We did have a hard year-over-year comp to work with, so again it will be interesting to see next weekend’s data.

For purchase apps, what I really value is at least 12-14 weeks of positive week-to-week data. If we can get that positive week-to-week data to go with year-over-year growth, then we have something cooking. For 2026, every week has shown positive year-over-year growth, but that growth rate has slowed for the last two weeks. 

Here’s 2026 so far:

  • 6 positive week-over-week prints
  • 6 negative week-to-week prints
  • 1 flat week-to-week print
  • 7 weeks of double-digit year-over-year growth
  • 12 weeks of positive year-over-year growth
  • 1 negative year over year print

visualization

The week ahead: Iran, plus inflation, Fed speeches and existing home sales

Monday morning we will all be waiting to see what happens with the ceasefire and whether there is a plan to end this conflict and gets ships moving again.

We will also have an existing home sales report on Monday and PPI inflation data and Fed speeches during the week. Again, I stress, it’s all about Iran right now. Once we can get this conflict behind us we can move back to a normal economic discussion that is not so much tied to this war.

This post was originally published on here

America’s workers are clinging to their jobs at a decade-low quit rate of 2%, driven by fear rather than fulfillment, new data shows.

The research from Economist Enterprise surveyed 2,063 full-time employed Americans ages 18 to 62 across industries, including energy, manufacturing, media, financial services and government.

It found that 62% of workers now prioritize long-term job security over seeking new opportunities.

Thirty percent said they’ve stopped looking for new jobs over the past five years because of security concerns — rising t0 35% in financial services and insurance and 34% in manufacturing.

Government workers reported the lowest rate at 23%.

“America’s workers are prioritizing job stability and a strong benefits package, signaling a shift in how workers weigh risk versus reward in today’s competitive labor market,” said Matt Terry, who led the research at Economist Enterprise. “This cautious approach reflects a broader trend; workers are increasingly valuing predictability over advancement, which could have lasting implications for career growth and economic mobility.”

Retirement a moving target

Workers now expect to retire nearly four years later than they had planned.

Among those anticipating working past their ideal retirement age, only 20% cite job satisfaction as the reason. Instead, rising living costs (47%) and health care expenses (41%) — the latter jumping to 50% among low-income workers — drive the delay.

Lower-income workers expect to retire roughly six years later than desired. Even Gen Z, many of whom just entered the workforce full time, anticipate a five-year delay.

Financial services and insurance workers face the longest expected delay at 5.1 years, followed by manufacturing at 4.5 years.

Government workers report the smallest gap at 2.9 years.

Raiding savings and delaying life decisions

About one-third of workers (35%) have taken hardship withdrawals or loans from retirement accounts, with rates highest in financial services and insurance (44%) and manufacturing (41%) and lowest among government workers (23%).

Thirty percent said they have cut back retirement savings, rising to 36% among high-income workers.

Seventy-three percent have postponed buying a home or car — hitting 82% among millennials — while 43% have delayed or skipped medical care, including 51% in manufacturing and financial services.

One in four workers (25%) have postponed having children.

“The data in this report should give every employer pause. When workers feel financially insecure, they delay retirement, and that has real costs – both administrative and financial — for organizations carrying expensive, experienced employees who are ready to move on but don’t believe they can afford to,” said Brendan McCarthy, head of Nuveen Retirement Investing, which supported research in the report.

“Employers have more power to change that than they might realize…At a time when employees are craving stability and certainty, employers can stand out as an employer of choice by delivering a more modern approach to benefits that can help employees navigate key life milestones with more confidence.”

Senior housing wealth dips slightly

Separately, housing wealth among homeowners aged 62 and older declined less than 1% in the fourth quarter of 2025 to $14.62 trillion, according to the latest National Reverse Mortgage Lenders Association (NRMLA)/RiskSpan Reverse Mortgage Market Index.

The 0.83% drop was driven by an approximate $100 billion decrease in home values — partially offset by a $21.8 billion rise in mortgage debt held by older homeowners.

“While we saw a modest dip in housing wealth at the end of 2025, the overall level of home equity among older Americans remains historically strong,” said Steve Irwin, president of NRMLA. “For many retirees, housing wealth continues to be a critical component of financial security and retirement planning.

“Even in a moderating market, reverse mortgages remain a valuable tool to help seniors access that equity and meet their evolving financial needs.”

This article was written by Jonathan Delozier and generated with the assistance of HousingWire Automation. It was reviewed by a HousingWire editor before publication. The system helps convert company announcements and industry data into HousingWire-style news coverage.

This post was originally published on here

Century 21 Circle — ranked among Century 21’s top 10 companies globally — has entered the Michigan market by bringing on the Sparta-based Kelley Real Estate Group.

Company leaders said the move reflects trends across Midwest markets surrounding Lake Michigan, where relocation patterns, second homebuyers and client referrals increasingly cross state lines.

“This isn’t just growth for us — it’s momentum,” said Melissa Archer-Wirtz, CEO of Century 21 Circle. “We’re very deliberate about where we go and who we partner with, and Michigan has always been part of the bigger picture. We’re building a dominant Midwest presence, and the Kelley Real Estate Group brings the kind of credibility and local strength that aligns with how we’re scaling. We’re expanding with purpose — and we’re not done.

“We’re seeing more clients and agents operating across state lines, especially within neighboring Midwest markets. Expanding into Michigan allows us to better support that movement and stay connected to the communities we serve.”

Century 21 Circle now operates with roughly 1,000 agents across nearly 40 offices in Illinois, Indiana, Florida and Michigan — with about $1.6 billion in annual sales volume.

The firm earned top-200 placement nationally for volume on last year’s RealTrends Verified rankings while also ranking just outside the top 100 for sides.

Felicia Kelley, Kyle Kelley and Rachael Austin also join Century 21 Circle as part of the expansion.

“The Kelley Real Estate Group has always been rooted in relationships, community, and doing what’s right for our clients,” Felicia Kelley said. “Joining Century 21 Circle allows us to expand on that foundation with the support of a globally recognized brand, innovative tools, and a leadership team that truly aligns with our vision for growth.”

This article was generated using HousingWire Automation and reviewed by a HousingWire editor before publication. The system helps convert company announcements and industry data into HousingWire-style news coverage.

This post was originally published on here

After painful delays following last fall’s government shutdown, labor market data is finally back on a consistent pace. Last week we filled in hiring, quits and layoffs from the BLS JOLTS report for February, plus unemployment numbers for March and the latest initial claims for the first week of April. Taken together, they help illustrate how the labor market drives the housing market in 2026, where housing is solid and where the risks are. 

The most surprising aspect of the 2026 labor market is that unemployment has stayed consistently low. The unemployment rate(U3) actually declined in March to only 4.3%. The weekly initial claims data jumped a little higher in the first week of April, and remains very low from historical standards. So based on the early initial claims data, the unemployment rate for April doesn’t look like it’s heading dramatically.

visualization

This matters because when unemployment moves dramatically higher, it creates a negative cycle of distressed mortgage borrowers. When you lose your job and can’t pay your mortgage, you may be forced to sell your house or go into foreclosure. Inventory, especially distressed inventory, rises.

One important insight about unemployment and distressed inventory: it typically takes nine to 12 months after the spike in unemployment before distressed inventory shows up on the market. Since unemployment is low now, distress is low. If unemployment were to climb later in the year, this is 2027 inventory, or perhaps even 2028. We’ve been on the watch for rising unemployment and distressed inventory for nearly five years now. It’s still nowhere in the system. 

If your housing market hypothesis assumes that the market will crash this year because people are losing their jobs, the data really does not support that hypothesis now. Americans by and large are employed. That data just does not seem to be changing quickly. 

By the way — when I talk about the employment data, one criticism I frequently hear is that the unemployment rate is “wrong” because everyone is driving Ubers now. I call this the “Uber excuse.” Yet the data refutes that hypothesis too. The number of people working part-time for economic reasons is also pretty low, as is the data for involuntary part-time work. The “Uber excuse” is not supported in the data. 

The cracks in the labor market

Unemployment is low, but that doesn’t mean the labor market is on solid footing. The total number of jobs created in the country has been very weak since the new administration took over. Tariffs and immigration policy are heavy burdens for businesses. We can see this burden in the Non-farm Payrolls report. 

Fortunately, in March, a pleasantly big payroll gain came as a rebound of February’s giant loss. 2025 was an anemic year for job growth across the country. 

But even more so than job creation, the housing market’s big challenge with jobs is that companies are not hiring. As a result, even though few people are unemployed, it’s really hard to get a job. People who lost jobs are taking longer to find a new one. If you have a job, you don’t want to leave. Unemployment is low, layoffs are low, quits are low and hiring is low.

It’s this last one, hiring, that matters for the real estate industry. 

I’ve said the hiring rate is the key macroeconomic stat that I’m watching in 2026 to learn if the housing market can finally grow. Unfortunately, the hiring data appears to be actually getting worse. Hiring is slowing, not improving. The hiring rate for March came in at just 3.1%, which is as low as the worst of the COVID shut-down period and nearly as bad as the depths of the Great Financial Crisis. 

visualization

Why does hiring matter more than unemployment in 2026? Because relocation-for-work is one of the primary drivers of home-purchase activity. We move for new jobs, we move to growth cities to find new jobs, we move up when we get new jobs. 

And we’re not getting new jobs in 2026. Until the hiring rate turns around, we should expect restricted growth on home sales. 

Why is hiring so low and what would turn it around? Hiring is low because we hired so many people during the pandemic. It’s low because high interest rates make it difficult for companies to expand. The heavy tariff and immigration policies make it very difficult for many businesses to grow. Low hiring is probably also related to AI (though the hard data for this hypothesis is elusive, first-hand experience sure seems like it’s related). 

How hiring could improve

To get hiring moving again, we need some of these trends to change. Perhaps the Fed helps later in the year. The administration has shown some willingness to reverse some of the most draconian damaging policies. Maybe AI productivity gains shift from contraction to expansion momentum. Keep your eyes on the hiring rate to know whether any of those are in the cards.

One last bright spot for housing in the labor data is related to incomes and wage growth. For many years, home prices rose faster than incomes and affordability got worse. Over the last few years, incomes have been rising at a 3-4% annual pace where home prices are flat or even negative. Every day with this trend means affordability slowly improves, and that’s a good thing.

Here’s how it all wraps together. As long as hiring remains weak, home sales will remain restricted. But since unemployment is still pretty rare, the distressed cycle is unlikely, probably until at least 2028. Meanwhile affordability slowly improves with income increases. 

Keep your eyes on the hiring rate rather than unemployment this year. 

This post was originally published on here

For Virginia state Sen. Jeremy McPike, the third attempt was the charm for a bill that lets municipalities rezone to encourage affordable housing. It just took a new governor.

Gov. Abigail Spanberger signed into law this week a measure giving every city and county in Virginia the authority to adopt an affordable housing program, marking a major shift in how local governments can use zoning to boost supply. Previously, only a handful of Northern Virginia home rule jurisdictions had the tool.

Like many states, Virginia lawmakers have tried to ease a housing affordability crisis by lowering regulatory barriers that drive up construction costs. They also have leaned on local governments to build more affordable housing through incentives or mandates.

Running on a campaign of improved housing affordability in general helped Spanberger win the governor’s race in November. McPike told HousingWire‘s The Builder’s Daily that for the first time in a year, economic development professionals around the state have cited housing affordability challenges as a major risk for recruiting and retaining employers.

“It’s very much on the minds of the electorate,” he said.

Third time is a charm

McPike introduced the legislation in the two previous years, and it passed with bipartisan support. Former Gov. Glenn Youngkin vetoed the bills both times.

Spanberger signed the legislation along with a slew of other housing-related bills as part of her agenda to improve affordability across the state.

“Virginians deserve results when it comes to contending with the high cost of living,” the governor said in a statement.

Shortly after winning in November, she outlined an agenda focused on making housing more affordable across the state.

McPike’s legislation was paired with a companion House bill sponsored by Del. Rae Cousins that passed the General Assembly with bipartisan support earlier this year.

Spanberger is also in the final throes of deciding how to handle McPike’s other bill that, by contrast, would preempt local zoning. That bill would let faith-based organizations build affordable housing on property they own without needing zoning changes.

“On one hand, you have to get tightened up and on the other give” power to local governments to address affordability, McPike said.

McPike noted that both bills passed with bipartisan support, and that helps with the Faith in Housing bill too.

Localities gain flexible zoning tools as builders warn of higher costs

The new law authorizes localities to offer developers optional increases in density in exchange for providing moderately priced housing, a form of voluntary inclusionary zoning.

Local governments also may use a mix of tools, including lot size reductions, dimensional or form modifications, higher floor area ratios, accessory dwelling unit allowances, and the option for builders to pay into a local housing trust fund instead of constructing units on-site.

Before adopting a program, a locality must establish an advisory committee that includes residents, developers, real estate professionals, finance experts and affordable housing advocates to help design and oversee the ordinance.

The Virginia Association of Counties supported the bill, saying the stakeholder panel will “help to craft successful programs at the local level” and that the expanded authority has already proven effective in jurisdictions that currently use it. But the organization opposes the faith-based housing bill because it preempts local authority.

Environmental and smart-growth advocates also backed the bill, calling it a key part of a housing and transit agenda that aims to steer more mixed-income development to walkable, transit-served areas.

Home builders and development groups raised concerns that expanding inclusionary tools could add costs to market-rate projects or discourage construction, particularly of so-called “missing middle” housing types.

The Home Builders Association of Virginia opposed the measure during the session, arguing that mandatory or quasi-mandatory affordability requirements could function as a de facto tax on new units and slow production.

This post was originally published on here

A newly filed class-action lawsuit accuses home equity investment (HEI) company Unison of misleading homeowners and structuring its products in ways that leave customers with far less equity than expected.

The complaint, filed April 6 in the U.S. District Court for the District of Colorado by plaintiffs Katharine and Charles Kane, alleges that Unison and affiliated entities deceptively market their home equity agreements as a simple, debt-free alternative to loans.

At the heart of the lawsuit, the Kanes are challenging Unison’s core product, which provides homeowners with an upfront cash payment in exchange for a share of the home’s future value, alleging that they are “trapped” in the agreement.

“As of March 31, 2026, Unison estimates the Kanes will owe up to $278,618 to terminate the contract, when they were advanced just over $87,000 after fees at the start of their agreement,” the suit says.

According to the lawsuit, Unison offers homeowners an upfront cash payment in exchange for a share of the home’s future value. The company promotes the product as having “no debt,” “no interest” and no monthly payments, while positioning itself as a “partner” that shares in both gains and losses.

The plaintiffs argue that these claims are misleading and that the product creates debt.

“The Unison transaction is a residential mortgage loan because it provides homeowners an upfront payment that at least most of the time, the homeowner will have to repay to Unison,” the suit claims.

The lawsuit contends the agreements function as loans that ultimately require repayment of the initial cash amount plus what amounts to interest, often through a large lump-sum payment at the end of the term. In many cases, the filing alleges, homeowners must sell their homes to satisfy the obligation.

“Homeowners will almost certainly be required to repay every penny they receive, plus interest in the form of a significant lump sum balloon payment,” the complaint states.

The suit also alleges that Unison structures its agreements to maximize its own returns while limiting risk. Among the practices cited are discounting a home’s initial value, requiring homeowners to cover all property-related costs during the agreement term, and maintaining control over the appraisal process that determines the home’s final value.

As a result, the plaintiffs claim, homeowners may walk away from a home sale with little remaining equity despite years of ownership.

The complaint seeks class-action status on behalf of similarly situated homeowners and includes claims that the company’s practices are deceptive and unfair.

The case comes at a time when home equity investment companies are increasingly under scrutiny for what the lawsuit calls “a deceptive” practice.

“In recent years, institutional and high-net-worth investors have been seeking a piece of that pie for themselves in ways that are increasingly deceptive and unfair to homeowners,” the suit reads.

This isn’t Unison’s first time in the legal hot seat. A separate lawsuit, filed in September in the Superior Court of California for the County of San Francisco, alleges that Unison uses predatory equity-sharing contracts that function as unlicensed, high-interest mortgages disguised as investment partnerships.

Lead plaintiff Patricia Gout, an 80-year-old retiree, said she received $97,256 from Unison in 2017 for home repairs and medical expenses but later learned she owed nearly $375,000, an effective interest rate of about 34.5%.

Other challenges against the company include a Ninth Circuit Court of Appeals ruling in Olson v. Unison that found its product functioned as a reverse mortgage under Washington state law and involved deceptive marketing practices.

Although Unison settled that case in October 2025, it also faces a separate lawsuit from the National Association of Consumer Advocates alleging the company misrepresents its product as a no-debt home equity option.

Other companies in the space are under scrutiny as well. Hometap was sued in Massachusetts, where Attorney General Andrea Joy Campbell argued the company’s product violates state usury laws.

Unison, founded in the early 2000s, created its business model to give investors exposure to the U.S. home equity market without requiring them to directly own property.

Neither Unison nor the plaintiffs’ legal team responded to HousingWire‘s requests for comment at the time of publication.

This post was originally published on here

Amid the growing presence of Japanese capital in American homebuilding, Osaka-based Hankyu Hanshin Properties Corp. (HHP), a leading Japanese developer, recently expanded its operations in the United States via a joint venture with Dallas-based Bridge Tower Homes.

The two parties announced a joint venture in January, and earlier this month, they broke ground on the joint venture’s (JV) inaugural development, a 97-lot community in Corinth, TX, a suburb of Dallas.

HHP already had a multifamily footprint in the United States, but the deal with Bridge Tower marked the company’s first-ever single-family residential venture in the states. The partnership will cover multiple projects and will focus on for-sale communities throughout the state of Texas.

“Japanese real estate companies tend to bring patient, long-term capital, which is exactly what development and homebuilding require. They’re not looking for a quick exit, which makes them natural partners for Bridge Tower, where we’re focused on building our platform rather than turning deals,” Jackson Su, co-managing partner at Bridge Tower Group, told The Builder’s Daily.

HHP’s parent company, Hankyu Hanshin Holdings, has a market cap of more than $7 billion, with a focus on residential, commercial and hospitality properties. Elsewhere, the company has international operations in Vietnam, Thailand, Indonesia, the Philippines, Malaysia, Singapore, Australia and Canada.

Like many Japanese developers, HHP has increasingly expanded internationally, including into the United States, as population growth domestically dips. Japan’s population peaked around 2010 and has steadily dropped in the years since.

This trend, combined with lower borrowing costs in Japan, has led to a significant uptick in investment in the American homebuilding market. After Sumitomo Forestry announced a $4.5 billion deal to acquire Tri Pointe Homes in February, Japanese firms now control an estimated six percent of new home construction in the United States.

“Japan’s domestic real estate market is facing real headwinds: declining population, slowing housing starts and flattening economic growth. For major firms with capital to deploy, looking internationally is a necessity. The U.S. Sun Belt is a natural place to deploy capital. Population growth, household formation, and sustained housing demand are fundamentals that simply don’t exist at scale in Japan right now,” Su explained.

For HHP, their JV with Bridge Tower Homes partners them with a well-established builder that has operated in Texas since 2013.

“We’re vertically integrated. The full residential life cycle, from entitlement, development, construction and sales, goes through Bridge Tower homes. We can control quality, timeline and cost end-to-end. For any international partner entering a new market, this reduces execution risk significantly,” Su explained.

Currently, Bridge Tower Group, the parent company of Bridge Tower Homes, in conjunction with its subsidiary Westfield Homes, delivers a mixture of for-sale and build-to-rent communities.

The JV will bring an infusion of capital that will enable the builder to leverage HHP’s scale to grow its operations in its core markets of Dallas, San Antonio and Houston. According to Su, Bridge Tower delivers about 400 homes a year, but they have the ability to triple that capacity now that HHP is on board as a capital partner.

This post was originally published on here

The FBI’s Internet Crime Complaint Center (IC3) received 1,008,597 complaints of cyber-enabled crime in 2025, with reported losses surpassing $20.8 billion — a 26% increase from the previous year.

Real estate fraud alone accounted for 12,368 complaints and $275.1 million in losses, showing a continued and growing threat for housing professionals and their clients.

Business email compromises — a scheme frequently targeting home closings and wire transfers — ranked second in total losses at $3.04 billion across 24,768 complaints.

Criminals are rapidly adopting artificial intelligence (AI) to enhance the credibility of their schemes. And IC3 received more than 22,000 complaints referencing AI in 2025, with adjusted losses exceeding $893 million.

“Chat generators can quickly create official-sounding emails mimicking a company’s CEO or other officials,” the report explained. “These emails can contain phishing links or directions to wire funds. Voice cloning can also be used to request wire payment.”

Investment scams — many leveraging AI-generated videos and deepfake endorsements from celebrities or trusted figures — produced the largest share of losses at $8.64 billion.

Confidence and romance scams, which often lead victims to liquidate assets or tap retirement funds, resulted in $929 million in losses.

Elder fraud a growing crisis

Complainants ages 60 and older filed 201,266 reports in 2025 — a 37% increase from 2024 — with losses of $7.75 billion, up 59% year over year.

More than 12,400 seniors reported losing at least $100,000 each.

Cryptocurrency remained the transaction method of choice for fraudsters. The report recorded 181,565 complaints with a crypto nexus — a 21% increase — and $11.36 billion in losses.

Scams often begin through text messages or dating apps before moving to encrypted messaging platforms.

The FBI’s Operation Level Up — launched in January 2024 to identify crypto investment fraud victims — has reportedly prevented more than $500 million in potential losses.

In 2025 alone, the operation notified 3,780 victims, and 78% were unaware they were being scammed.

“(The program) stopped a victim from cashing out $750,000 from his 401K,” the report states. (It also) stopped a victim from selling her house to invest $500,000.”

Protecting real estate transactions

For real estate agents and brokers, the IC3’s Financial Fraud Kill Chain offers a critical lifeline.

The recovery team initiated 3,900 incidents in 2025, freezing $679 million of $1.16 billion in attempted thefts — a 58% success rate.

One case detailed in the report involved a Missouri senior citizen attempting to close on a property.

The victim received a compromised email from a fraudulent title company with wire instructions for more than $1.3 million. The FBI froze the recipient’s account and later discovered the same account was targeted by a city government office in Oregon for a separate $6 million wire — which was also stopped.

The FBI urges anyone who discovers a fraudulent transfer to contact their financial institution immediately and file a complaint at ic3.gov

This article was written by Jonathan Delozier and generated with the assistance of HousingWire Automation. It was reviewed by a HousingWire editor before publication. The system helps convert company announcements and industry data into HousingWire-style news coverage.

This post was originally published on here

An affordable housing lottery launched this week for 75 mixed-income apartments at a 38-story residential tower in the Financial District. Developed by the Moinian Group, Aria 7 Platt at 7 Platt Street offers light-filled luxury residences and a range of indoor and outdoor amenities. New Yorkers earning 70 and 130 percent of the area median income can apply for the units, priced from $1,819/month studios to $4,484/month two-bedrooms.

Constructed by AECOM Tishman, the 250-unit tower is one of the last projects completed under the now-expired 421-a tax abatement program, which incentivized developers to include affordable housing in exchange for property tax exemptions.

Hill West is serving as the project architect and Rockwell Group as project designer for the 250,000-square-foot tower. Residences offer a fine blend of modern comfort and elevated design.

Indoor amenities include a penthouse lounge, fitness center, library, work pods, resident lounges, private dining spaces with terrace access, a gaming and virtual reality room, a communal kitchen, and laundry facilities.

Outdoor amenities include a rooftop sundeck with chaise lounges, a landscaped garden lounge, an outdoor movie screening area, dining spaces, and a co-working area.

ARIA 7 Platt is located near a range of public transit options, including the 1, 2, 3, R, W, J, and Z subway lines, multiple bus routes, and the NYC Ferry.

Leasing for market-rate units at the building launched in January. Current availability for these apartments starts at $4,491/month for a studio.

Qualifying New Yorkers can apply for the apartments until June 8, 2026. Complete details on how to apply are available here.

Questions regarding this offer must be referred to NYC’s Housing Connect department by dialing 311.

RELATED:

The post Lottery opens for 75 apartments at 38-story FiDi tower, from $1,819/month first appeared on 6sqft.

This post was originally published here

With more companies signing on to pre-marketing platforms, it appears that the new trend of pre-marketing listings is here to stay, at least for the moment. While the notion of a coming soon listing is nothing new, with numerous MLSs across the country offering some variation of this status, more and more listing portals and brokerages seem to be looking for ways to get those coming soon properties in front of more prospective buyers. 

The various products and programs launched so far have generated their fair share of conversation and confusion in the industry, so HousingWire has broken down three of the main programs announced so far to provide some clarity. 

Compass-Rocket-Redfin

Announced in late-February, the agreement between Compass International Holdings (CIH) and Rocket-Redfin to exclusively display Compass’s coming soon listings on Redfin was the first of these pre-marketing programs to hit the industry. The deal is mutually exclusive, meaning that Redfin cannot display the coming soon listings of other brokerages, and Compass cannot display its coming soon listings on other portals beyond its own brokerage website. 

Syndication of these coming soon listings began in mid-March with just Compass listings; however, CIH has said the program would expand to other brands in its portfolio in the coming months. Additionally, CIH said it is also exploring an experience like that on Compass.com, which gives consumers visibility into the number of Private Exclusives available in their area that would debut at a later date. 

As part of the program, Compass’s coming soon listings receive prime search result placement on Redfin, and days on market and price history are not displayed. While any Compass coming soon is eligible for display, sellers must consent to their coming soon listings being displayed on Redfin. In addition, in contrast to some of the other programs, coming soon listings can be pre-marketed on Redfin for as long as the seller would like.

According to Compass, the listing agent’s contact information will appear with the listing, and if a consumer submits a Contact Agent form on a Compass coming soon listing on Redfin, the lead will be routed first to the listing agent of record. That agent then has 24 hours to claim the buyer lead. If the lead remains unclaimed, it will be sent to an agent in the Compass Leads Program. Compass has also claimed that the program will create new opportunities for its agents to receive buyer leads directly from Redfin.com and Rocket.

The agreement also has a mortgage component, which is unique to this pre-marketing program, as the firms announced that CIH listings that close through Rocket-Redfin will be eligible for Rocket’s preferred pricing bundle, which the companies have said could result in up to $6,000 in closing cost savings to the consumer.

Zillow Preview

Announced in mid-March, Zillow Preview was the next portal pre-marketing product to hit the market, with syndicated coming soon listings hitting Zillow Preview this month. Like Compass’s arrangement with Rocket-Redfin, coming soon listings can only appear on Zillow Preview with a seller’s consent, but unlike the Compass agreement, coming soon listings displayed in Zillow Preview must follow local MLS rules. This means that if a listing cannot be publicly advertised for more than 24 hours before going active in the MLS, then the coming soon period can only be 24 hours. 

Additionally, with Zillow Preview, sellers can choose to display the number of days a listing has been on Zillow. However, if a seller chooses to display days in Zillow during the Preview, once the listing goes active in the MLS, the number of days the listing was in Preview will carry over, adding to its overall days on Zillow count. Zillow has also announced that statistics like saves and views also get carried over when a listing swaps from Preview to active.

The program is currently only available to agents at brokerages that partner with Zillow. So far, 58 brokerages and franchisors, including Side, United Real Estate, Keller Williams, REMAX, SERHANT., HomeServices of America, The Keyes Family of Companies and Engel & Völkers, have signed exclusive agreements with Zillow. Under these agreements, firms cannot display their coming soon listings on any other listing portal. However, Zillow has noted that some MLSs that offer a coming soon status syndicate those listings via IDX or VOW feeds, and Zillow will continue to display these listings regardless of whether the brokerage is part of Zillow Preview.

Listings displayed in Zillow Preview will have a contact agent button that will direct the consumer to the listing agent. If that consumer ends up working with the listing agent to purchase any property, including that listing, Zillow will not charge the listing agent for the buyer lead. The company has stated that any lead a listing agent receives from a Zillow Preview listing is always free. Listings will also have a “schedule a tour” button, allowing consumers to schedule a tour of the property for when it becomes an active listing. When a buyer requests a tour, the buyer is put in contact with an agent who is a Zillow partner agent. If that buyer then ultimately works with that agent, the agent will be charged what they normally are for a buyer lead, but the listing agent that the buyer initially selected to tour will receive 10% of the buyer agent’s overall commission.

Zillow has clarified that this will be made possible by the company slashing its cut of the buyer agent’s commission. So instead of keeping the entire 35% referral fee, it will only keep 25%, with the other 10% of the buyer’s agent commission going to the listing agent, whose listing initially put the buyer in contact with the agent.

“We’ve made a lot of noise in the past year about listing transparency and how sellers benefit from broad exposure, and buyers deserve equal access to inventory and shouldn’t be forced to work with a particular brokerage to get access to inventory,” Errol Samuelson, the chief industry development officer at Zillow, told HousingWire in mid-March. “So, the idea of the preview is to provide exposure to these pre-active listings to everybody. We think it is a continuation of our work for transparency.” 

eXp Realty signs non-exclusive deals

While Zillow Preview and Compass’s Rocket deal have generated the most buzz, eXp Realty, the nation’s largest firm by transaction side count, also announced plans to pre-market coming soon listings in late-March. In order to pre-market these listings, eXp Realty signed non-exclusive deals with Realtor.com, Homes.com and ComeHome.com, which is HouseCanary’s real estate portal that has partnered with Google to showcase listings in Google search results in select markets. As these are all non-exclusive agreements, eXp has said any portal may choose to receive eXp’s coming soon listings on equal terms, pending local MLS rules and the seller’s authorization. Additionally, the portals have issued their own statements welcoming other brokerages to join their programs.

Syndication of eXp’s listings, which will be up to the seller’s discretion, is slated to begin on April 15. Additionally, like Zillow Preview, the coming soon period for all listings is subject to local MLS rules and guidelines. 

Leo Pareja, the CEO of eXp Realty, told HousingWire in March that these agreements are a positive for consumers as they provide sellers with a broader listing exposure and they get coming soon listings in front of more consumers. His desire to get eXp’s listings in front of the widest audience possible is why Pareja said his company did not enter into an exclusive syndication agreement with just one portal.

“I am inviting any national portal that is willing to accept my feed on a non-exclusive basis to enter into a syndication deal because, in my opinion, the listings should be everywhere at the same time,” Pareja said. 

However, Pareja argues that the only reason eXp has had to sign these deals is because not all MLSs include coming soon listings in the IDX feeds they syndicate to portals and other sites. 

“If all the MLSs would just include the coming soon status listings in their IDX feeds and syndicate it to all the portals, then this would be a non-issue and none of us would have to do this,” Pareja said. “I believe that part of the MLS’s role is to make sure that they are listening to their customers. I believe in the MLS system, and I think I have been one of the loudest advocates for having a third party that is agnostic making rules. I think it is super important in order for us to have collaboration as an industry, but if something is going in a certain direction, I’d prefer all of it to exist at the MLS input level and then we wouldn’t have to figure out how to do it ourselves.”

This post was originally published on here

New American Funding (NAF) expanded its Midwest footprint with the launch of One Goal Mortgage powered by NAF, a new branch serving the Omaha, Nebraska, metro area and southwest Iowa, the company announced this week.

The move gives the California-based independent mortgage lender its first physical branch presence in Nebraska. The One Goal Mortgage team joined NAF in early 2026 and will operate alongside existing teams in Glenwood and Council Bluffs, Iowa.

The branch is led by producing area sales manager Rachel Pierce, who brings 17 years of mortgage industry experience. She and her team, which collectively has more than 50 additional years of mortgage expertise, focus on purchase, refinance and renovation financing through relationships with real estate agents, homebuilders and financial advisers across the region.

HousingWire Mortgage Rankings data shows that Pierce did $52.7 million in mortgages, with an average loan size of $256,000 across 206 units.

“After nearly a decade with my previous company, I spent more than 16 months carefully evaluating where I wanted to take the next chapter of my career and my team,” Pierce said in a statement. “New American Funding stood out for its unwavering commitment to championing the originator, investing in forward-thinking technology, and building a culture centered on teamwork and a high level of support.”

One Goal Mortgage offers conventional and government loan programs, as well as nonqualified mortgage (non-QM) and specialty products for borrowers with complex financial profiles, according to a press release. The team also has access to new-construction financing, medical professional loan programs and NAF Cash, an affiliated company that allows buyers to make cash-backed offers in competitive markets.

Pierce is joined by home mortgage advisers Meggan Jensen and Kelli Lichty; loan officer assistants Krystal Ameson, Amanda Shannon and Kolin Brace; senior processor Elisha Konecky; and production assistant Sammie Pierce.

Greg Griffin, regional manager of strategic growth and retention at New American Funding, said the hire fits into a broader regional growth strategy.

“New American Funding’s Midwest region is excited to welcome One Goal Mortgage Powered by New American Funding to our growing family,” Griffin said. “Led by Rachel Pierce, the team brings strong leadership, energy, and a clear commitment to excellence that aligns perfectly with New American Funding’s vision. The first time I met Rachel and her team, I knew they were the missing link.”

NAF reportedly services more than 277,000 customers representing $72 billion in unpaid principal balance and operates more than 300 locations nationwide. According to data from Inside Mortgage Finance, the company ranked No. 29 nationally with $16.33 billion in volume in 2025.

The company has announced multiple leadership changes at the regional level in the past year.

In October, it hired Nathan Ballentine, formerly of Wachovia/Wells Fargo and Movement Mortgage, as regional vice president in South Carolina. In August, Tim Sorenson joined NAF to head up lending and recruiting efforts in the Southwest, having previously served for eight years at Rate. And in July, Tony Blodgett and Andy Pettola were promoted to regional retail business managers, overseeing more than 270 branches and a sales force of nearly 1,400 loan officers and branch managers.

This post was originally published on here

The National Association of Realtors (NAR) agreed to a proposed settlement that would resolve nationwide homebuyer commission lawsuit claims in the Tuccori homebuyer lawsuit.

The agreement, announced Friday and subject to court approval, is structured as an opt-in component of the Tuccori master settlement. The opt-in window for the Tuccori master settlement closes next week. NAR was not a defendant in the Tuccori lawsuit.

NAR said it will contribute $52.25 million to a settlement fund over multiple years. The deal requires continued compliance with the business practice changes NAR agreed to in its settlement of the home seller commission lawsuit claims in the Sitzer/Burnett lawsuit. It does not impose additional business practice changes beyond those already in place, the trade group said.

NAR also said it will seek a stay in the Batton homebuyer commission case, in which it is a defendant, because its Tuccori settlement is intended to release the claims asserted in Batton.

According to NAR, its settlement in Tuccori protects state and local Realtor associations, regardless of whether they operate multiple listing services (MLSs). It also covers Realtor-owned MLSs, non-Realtor-owned MLSs and real estate brokerages with a Realtor as principal that have not previously settled or been named in similar litigation. These parties must meet specified eligibility criteria, including compliance with NAR rules and policies and not asserting claims contrary to the settlement.

NAR characterized the Tuccori deal as providing a broader level of protection and release than any of its prior settlements. By resolving these homebuyer claims through a single, nationwide structure, the trade group aims to reduce uncertainty and potential financial exposure for associations, MLSs and brokerages that opt in.

“In NAR’s 2026-2028 Strategic Plan, we committed to the industry that we would protect and advance the legal interest of Realtors. This settlement is a part of our efforts to fulfill that commitment and will promote a more resilient industry,” NAR CEO Nykia Wright said in a statement.

“This outcome, which provides a broader level of protection and release for the industry than has been secured in any previous NAR settlement, is a result of NAR’s new legal team’s diligent approach to addressing legal risk and reinforces our commitment to delivering greater value and stability for our members, so they can remain focused on their clients and getting to their next transaction.”

General counsel Jon Waclawski framed the agreement as part of the trade group’s more “deliberate and strategic” legal posture under its Strategic Plan.

“We sought this settlement to secure meaningful protections for our members and the industry. We moved decisively to resolve these claims in a way that avoids significant potential liability and positions NAR more effectively going forward, ensuring our members can continue unlocking the American Dream for generations to come,” Waclawski said.

NAR said the agreement is the latest in a series of favorable legal outcomes under its revamped legal leadership. These include the dismissal of multiple antitrust cases in the past nine months, most recently including the Hardy and DeYoung lawsuits.

Plaintiffs in the Batton suit have been pushing back against defendants opting to settle these homebuyer commission lawsuit claims with the Tuccori plaintiffs.

In March, the Batton plaintiffs filed a motion for a preliminary injunction seeking to prevent Hanna Holdings from proceeding with its proposed settlement in the Tuccori lawsuit. This came after the Batton plaintiffs filed a motion to intervene in the Tuccori lawsuit and a motion for a preliminary injunction seeking to block Anywhere Real Estate from obtaining preliminary approval for the settlement the firm negotiated in the Tuccori suit via the opt-in mechanism. 

These motions were denied, but the Batton plaintiffs have also sought to appoint the Tuccori plaintiffs’ attorneys as interim co-lead counsel in the Batton lawsuit. 

It remains to be seen if the Batton plaintiffs will also pushback against NAR’s choice to opt-in to the Tuccori settlement, which comes a little over two years after NAR announced its settlement in the Sitzer/Burnett lawsuit.

This article was written by Brooklee Han and generated with the assistance of HousingWire Automation. It was reviewed by a HousingWire editor before publication. The system helps convert company announcements and industry data into HousingWire-style news coverage.

This post was originally published on here

Earlier this week, Rocktop Technologies announced the formation of Rocktop Digital, a new business focused on digitizing and tokenizing mortgage and private credit assets. As part of the launch, Brett Benson was promoted to CEO of Rocktop Digital.

Benson, the former co-president of Rocktop Technologies, is stepping into his new role with the mindset that the next phase of mortgage innovation may not be about better loans, but better infrastructure.

Just days after the announcement, Benson sat down with HousingWire to outline how the new business is designed to rebuild the “plumbing” of the market, targeting the systems that govern how assets move rather than the assets themselves.

Editor’s note: This interview has been edited for length and clarity

Sarah Wolak: First, congratulations on the new role. You previously held a role at Rocktop Technologies, so what has the transition been like to CEO of Rocktop Digital?

Brett Benson: Just for background context, I kind of grew up on the trade desk. I started my career on the capital markets side. I worked at some big data companies for a period of time, both CoreLogic and Black Knight. For the last 11 years, I’ve been president and chief investment officer at Rocktop Technologies.

The transition here is a little bit of a fork. Rocktop Technologies is focused on some of the generative AI applications and data and documents, as well as automating some of the processes attached to default servicing and some of the trade operational pieces and capital markets.

For me, this is a little bit more of an infrastructure play. We’re more focused on the rails and kind of working on the plumbing of the industry, if you will, so things that would move assets and make the portability and transferability of assets more efficient. That becomes the Rocktop Digital play, as opposed to Rocktop Technologies, which is really focused on the asset itself and how to apply newer technologies to make an asset more efficient.

Wolak: You’ve described this as “rebuilding-the-market architecture.” What do you mean by that? Is something fundamentally broken?

Benson: Yeah, I’ll give an analogy first. So, for example, the DTC [Depository Trust Co.] in the ’70s really focused on the digitization of what were equity trades at that point. There were a lot of paper-driven functions, much like the mortgage industry, a lot of inefficiency in the ecosystem in terms of dealing with paper or manual tasks.

The DTC worked toward the digitization of assets and creating a more trusted, validated digital asset. Then, in 1999, the [Depository Trust & Clearing Corp.] created the clearing corporation that allowed for the transfer or trading of those assets.

We think about it the same way: The mortgage industry is 30 to 50 years behind other tradable assets. It’s not dissimilar from those paper-driven functions and manual tasks of, how do you validate an asset?

There are lots of redundant diligence and certification and recertification of the collateral pieces themselves. What we’re trying to do is create a more efficient system — fix the plumbing. How do you fix the rails on which all of this happens? And how do you create a trusted asset, taking into account some of the privacy pieces? Technology is now allowing for that at scale.

Wolak: What else is different now that makes it viable for Rocktop Technologies to have this new business and to go forward with that confidently?

Benson: It’s almost a separate company that we’re running here — you’ll also hear it called the registry. That function is trying to get ahead of how assets are transferred, and I know that you asked why now. … What we’ve found is that technology has reached a point where even manual tasks done by humans can now be done at a much faster rate and a much more proficient rate. We see errors in human calculations and in dealing with manually extracted data from documents.

It’s the combination of AI functions that are allowing for really the smart kind of technical, technological applications that create validation of assets, and then the blockchain pieces allow you to create an auditable record behind that. That’s how you create trust and the ability to move assets faster.

There’s a lot of inefficiency in the system, and the industry is naturally resistant to change. There are a lot of people making money on that inefficiency. … But now the technology is not only becoming faster, it’s also better, and that’s where we feel like costs can be lifted from the system, which ultimately gets passed through to borrowers and investors.

Wolak: You brought up the element of trust here. What are the biggest regulatory or trust-related hurdles?

Benson: Naturally, there are custody functions. MERS has fought for what is, and there’s case law behind, how to create digital assets. That’s one example where the change to a digital representation of ownership and enforceability of an asset has already started to hit a tipping point. The concept isn’t new, but it’s not well-trusted, and I think it hasn’t been easy for the system to adopt this type of thing. 

A low point in my career was when we were trading a set of assets that had eNotes attached, and we actually had to print out the notes themselves so the financing partner would accept them.

But we are seeing movement. Fannie Mae is moving toward acceptance of crypto for down payments. We’re seeing things in the industry that are moving toward a trusted digital infrastructure.

AI functions have changed even in the past quarter. … It’s become the tipping point. One enables the other: When the AI can validate assets, certify them and create trusted layers, then put them on-chain, you create an immutable, auditable asset. When you have a validated, immutable asset that can be consistently updated with validated information, then you have an asset that becomes more tradable.

And frankly, you’re raising the value of the asset because you’re taking out the uncertainty of the asset.

Wolak: Where do you think the largest impact lies: a specific group of borrowers, investors or someone else?

Benson: It’s a great question. The progression starts with operational improvements. When you release inefficiencies and costs from the system, that ultimately gets passed through to the borrower or the investor.

In either case, it’s what we call the “golden rule” — those who have the gold make the rules. So we see a lot of capital markets that will influence this first, which ultimately gets passed through to the borrower.

In terms of who benefits first, it’s probably the operational functions [through Rocktop Technologies
and Rocktop Digital]. The operational functions really sit with the servicers, lenders, and how loans are transferred. These inefficiencies are embedded in servicing costs and processes, especially with rising delinquencies.

We first see the benefits of this tech in operations, then those benefits pass through to borrowers and capital markets. We need the capital markets to push the adoption piece because they are the ones driving the functions. But ultimately, the goal is really to pass it to the borrowers.

Wolak: How do you ensure the “source of truth” is accurate and trustworthy once assets are tokenized?

Benson: There is essentially a game of telephone happening in the industry. You have the lender, third-party document holders, the servicers — and that becomes the source of truth that then passes through to the investors.

Rocktop Technologies is addressing that by going to the source of truth and creating validation layers. How do you ingest both structured data and unstructured data, so data and documents, and create using AI, to marry up or validate all that data? And then you think about how do you create both the transparency and the portability of an asset?

That’s where Rocktop Digital comes in, by creating an asset that moves easily and has validation layers already on top of it in real time. Technology has gotten to a point where we can do this at scale and at a speed that has never been done before, with trust.

Wolak: What operational challenges have you faced in building this?

Benson: We at Rocktop Technologies embraced AI almost 10 years ago. But, again, we live in an industry that has just as much fight against change or lobbying against change. So there are natural adoption hurdles and headwinds against change.

But what we’re seeing now is that the technology is changing so fast and becoming so proficient. There is a mindset change — much like equities decades ago — and there’s a need for adoption of technology to create efficiencies. And it allows more to become accessible. What I mean by that is, we’re seeing the retail side, they’ve never been able to invest in mortgages, but having a trusted, portable asset with transparency and allowing for efficiency actually brings new capital into the game.

So it raises the bar for the institutional investor … while bringing in new capital players to the market, which creates more fluidity and more liquidity.

This post was originally published on here

A Jersey City icon will reopen its doors this year. Loew’s Jersey Theatre announced this week that the historic venue will return this fall, following a $130 million restoration. New renderings provide an updated look at the 1929 theater’s transformation into a year-round entertainment destination in Journal Square, more than 40 years after preservation efforts began. Led by OTJ Architects, the project rehabilitates and modernizes the space while retaining its ornate historical details, with upgrades that include new sound and lighting systems and flexible seating for between 2,600 and 4,000 guests.

Loew’s Jersey Theatre, Rapp and Rapp, Journal Square theater, Journal Square history, Loew's Jersey City, Loew's Wonder Theatres, Wonder Theatre Jersey City, Jersey City historic theater
Loew’s Jersey in 2018. Photo by James and Karla Murray, exclusively for 6sqft

Built by architect George Rapp in a gilded Baroque-Rococo style, the theater is one of five Loew’s Wonder Theatres constructed between 1929-30 across the tri-state area, along with the Loew’s Paradise in the Bronx, the Loew’s Kings in Brooklyn, the Loew’s Valencia in Queens, and the Loew’s 175th Street, now known as the United Palace Theatre, as 6sqft previously reported.

The series of grand movie palaces was built to establish Loews Corporation’s stature in the film industry, but also as an escape for people from all walks of life, especially during the Great Depression and World War II.

Jersey City’s theater served as an entertainment hub for decades before being converted into a triplex movie theater in the 1970s and nearly facing demolition in the 1980s. Pressure from grassroots preservation efforts ultimately led the city to buy the theater in 1987, allowing the nonprofit Friends of the Loew’s to begin the restoration and operate it as a nonprofit arts center.

Loew’s Jersey Theatre, Rapp and Rapp, Journal Square theater, Journal Square history, Loew's Jersey City, Loew's Wonder Theatres, Wonder Theatre Jersey City, Jersey City historic theater
Loew’s Jersey in 2018. Photos of the balcony before restoration work, by James and Karla Murray, exclusively for 6sqft

However, the project has been hampered by delays for decades. In a 2018 interview, Friends of the Loew’s executive director Colin Egan said that while the city matched a $1 million state grant awarded at the start of the project, the combined $2 million was not even enough to cover basic costs such as restoring heat or making the bathrooms operational.

Exterior rendering of the new theatre. Credit: OTJ Architects

To compensate for the lack of funding, volunteers worked on the theater every weekend until 1996, tackling projects ranging from mechanical and lighting systems to mapping every seat and scraping, priming, and repainting them.

By 2001, enough work had been completed to allow the theater to partially reopen for the first time in 15 years. Until its closure for restoration, it hosted live performances, events, and film screenings, according to the Jersey City Office of Cultural Affairs.

The Grand Lobby
View from the Lower Mezzanine Level. Credit: VStudio

“These renderings offer a glimpse into the quality of the restoration and an insight into what our patrons, promoters, partners, performers, and neighbors will see when they first step into this very special venue,” Bruce Wheeler, general manager of Loew’s Jersey Theatre, said.

The restoration project is a collaboration between the Jersey City Redevelopment Agency, the State of New Jersey, and Harris Blitzer Sports & Entertainment (HBSE), with which the city entered into a lease agreement in 2021 to renovate, manage, and operate the theater. In 2022, the theater was officially designated a National Historic Landmark. Interior and exterior restoration work has been ongoing.

In 2020, former Jersey City Mayor Steve Fulop estimated the project at $40 million. The following year, the city said it had reached a $72 million agreement for the renovation. Last May, it was announced that due to multiple stops and starts and rising material costs, the price tag had nearly doubled to $130 million, according to NJ.com.

When it reopens, the venue is expected to host roughly 150 events annually, including live music, comedy, touring performances, sporting events, and community and educational programming.

The Musician’s Gallery

“The Loew’s Jersey Theatre is a symbol of Jersey City’s past and future. For decades, Journal Square has been the heart of our city, home to working families, immigrants, and dreamers, and this restoration is a testament to their resilience and to the neighborhood they never gave up on,” Mayor James Solomon said. 

“The Friends of Loews fought to bring this iconic Wonder Theatre back to life—proving that communities thrive when properly invested in.”

The Star Dressing Room
The Lower Lounge. Credit: VStudio

OTJ Architects is restoring both the exterior and interior while modernizing the stage, backstage, and public areas. The orchestra level floor is being reconfigured with flexible tiers that can be arranged for seated shows or cleared for general admission. Off the Record Collective is handling the interiors for the artist and backstage spaces.

Additionally, the rear of the theater will feature an upgraded loading dock and expanded back-of-house support spaces, along with enhancements to front-of-house areas.

Restoration work is being reviewed by the Jersey City Historic Preservation Commission, the NJ Historic Preservation Office, and the National Park Service, and will meet the Secretary of the Interior’s Standards for the Rehabilitation of Historic Structures. Construction is overseen by Phelps Construction Group.

RELATED:

The post Jersey City’s historic Loew’s Theatre to reopen this fall after $130M restoration first appeared on 6sqft.

This post was originally published here

A report released Thursday is calling for reforms to New York City’s leasing process, finding that some affordable housing buildings can take up to 14 months to reach full occupancy due to delays. Published by Enterprise, the report highlights how even amid the city’s housing crisis, newly built affordable units can sit vacant for months as tenants and owners navigate the “lease-up process,” the period between when a building is ready for move-ins and when it reaches capacity. As first reported by The City, the report outlines a series of recommendations, including reforms to CityFHEPS, the city’s Housing Connect lottery system, and streamlining of the homeless placement process.

Enterprise, a national nonprofit focused on increasing affordable housing supply and advancing racial equity, found that 100 percent of the affordable housing developments it financed in NYC between 2021 and 2024 experienced delays, with an average lease-up time of more than 14 months.

Last year, the organization convened a group of marketing agents, affordable housing owners, policy experts, housing navigators, New Yorkers, and nonprofit organizations who have experienced these issues as applicants. The report documents their findings and policy recommendations aimed at connecting tenants to homes faster.

More than 800 affordable housing projects nationwide were analyzed, including 50 in the five boroughs, revealing a median of 439 days between apartment completion and tenant move-in. Lease-up periods ranged from roughly 8.5 months to more than two years.

According to the report, the city has more severe lease-up delays than any other community where Enterprise operates. The nonprofit found that it takes three times longer to lease up an affordable housing building in NYC than the national median of 156 days. The average lease-up delay in the city is 285 days, compared with a national median of 110 days.

These long lease-up times leave New Yorkers in shelters or other unstable housing situations for longer periods and increase costs for landlords, with delayed projects costing owners an average of $500,000 in lost tax credit equity. These costs are further compounded by additional expenses, including extended construction loan interest and payments.

The report’s first recommendation aims to reduce bureaucracy surrounding Housing Connect, the city’s housing lottery system. In 2024, six million New Yorkers applied for 10,000 affordable units through the lottery.

The Department of Housing Preservation and Development (HPD) and the Housing Development Corporation (HDC), the agencies that set marketing and lottery rules, have recently made changes to reduce documentation requirements, back-end audits, and income verification in an effort to streamline the process.

Before a lottery launches, the marketing plan for a development must be approved. This process typically begins when a project is about 70 percent complete, with the goal of aligning the lottery with building completion. However, the report finds this timeline to be unrealistic, citing too many steps and excessive administrative burden.

Enterprise recommends that the city streamline approvals by adopting a universal marketing plan template that can be completed within the Housing Connect system and finalized with city agencies at closing. It also recommends involving HPD marketing staff earlier in the process, rather than during construction.

Next, the report outlines reforms to the referral process for set-aside units for homeless placements. In 2020, the city began requiring city-financed affordable housing developments to set aside at least 15 percent of units for individuals experiencing homelessness.

According to the 2025 Mayor’s Management Report, a record 3,743 homeless households were placed into newly constructed affordable housing last year. However, those moves took an average of 235 days to complete.

Enterprise says the process requires too much interagency involvement, leading to vacant units and delayed move-ins. These delays leave homeless households waiting longer for stable housing and can also create financial consequences for tax credit properties that fail to meet lease-up deadlines.

The report recommends that, instead of being directly involved in the placement process, city agencies outsource coordination to third-party housing navigation organizations. These groups would liaise between shelters and housing opportunities, taking on responsibilities currently handled by HPD’s Homeless Services Unit and Department of Homeless Services staff, in order to improve efficiency.

Third-party navigators would focus on working with shelter residents and staff to ensure appropriate housing matches, which the report says would lead to higher rates of successful placements.

Additionally, direct referrals from shelters into affordable housing should be allowed when the shelter and housing operators are the same organization, when the shelter is co-located with an affordable housing site, or when a housing provider has a relationship with a local shelter. It also urges housing owners to accept referrals beyond these direct sources.

Finally, the report calls for a series of reforms to the CityFHEPS program, which allows low-income New Yorkers to pay 30 percent of their income toward rent, with the city covering the remainder. The program is a lifeline for the roughly 65,000 households, or about 140,000 people, who currently use the vouchers, as 6sqft previously reported.

First, Enterprise says the income verification process must be streamlined. Currently, income verification and rebudgeting are triggered when a household’s income changes by more than $100 between initial voucher approval and lease-up, creating delays that can result in lost units or apartments sitting vacant for months.

The process is burdensome for all parties involved, requiring tenants to gather and submit documentation, service providers to review and process paperwork, and city staff to approve rebudgeting and final package submissions.

To reduce this burden, the city could increase the rebudgeting threshold, allow community partners to handle rebudgeting, or permit the income determined at the initial eligibility stage to carry through until package submission or even after move-in, particularly in cases where approval has been delayed for more than a month.

In addition, the report outlines a series of inspection reforms for CityFHEPS. After hearing about inconsistent understanding of the G704 waiver for new construction units, which allows for inspection waivers and virtual inspections, Enterprise says the city should clarify and better publicize these waivers.

The city could also implement an apartment review checklist (ARC) and inspection hierarchy that would allow move-ins with non-hazardous “fails” and provide clearer guidance to inspectors on which issues require immediate resolution versus those that should not delay a tenant’s move-in.

Certain types of issues could still require an inspection after move-in to confirm resolution. In these cases, move-in would proceed at the tenant’s discretion, with appropriate sign-off.

Most units require an ARC inspection completed by a contracted provider, but certain units, such as ground-floor residences, must be inspected by the Department of Social Services’ CAR unit, adding a substantial amount of time to the approval process.

Eliminating this requirement for new construction or renovations that go through a new Department of Buildings (DOB) inspection and adding ARC-specific items to the DOB checklist would streamline the process. ARC inspections could also stand for six months to prevent the need for re-inspections after a tenant declines an apartment or a lease-up falls through.

Subsidized affordable housing properties with regulatory agreements could shift from unit-by-unit submissions to a building-wide registration process, significantly streamlining landlord package submissions. Improved coordination between HPD, HDC, and HSS would allow for seamless registration and eliminate the need for separate submissions for each unit.

With these reforms, Enterprise estimates that median lease-up time would be cut from 14 to six months, average homeless placement timelines from more than seven months to two months, and CityFHEPS approval and move-in times from more than nine months to one month.

City Hall has been exploring ways to improve the lease-up process. On his first day in office, Mayor Zohran Mamdani created the Streamlining Procedures to Expedite Equitable Development Task Force to identify ways to accelerate housing development and leasing. The task force is expected to release its findings on Saturday, but City Hall has since said the report will instead be published in a few weeks.

RELATED:

The post Even amid NYC’s housing crisis, new affordable units sit vacant for over 14 months first appeared on 6sqft.

This post was originally published here

A vacant land transaction in Maryland nearly became the latest victim of deepfake fraud last week when artificial intelligence (AI) was used to impersonate the property owner during a live video session.

That roughly $100,000 deepfake fraud attempt was stopped by identity verification and transaction security platform Proof during a remote notarization, the company said.

The incident highlights a continued vulnerability in real estate transactions, particularly those involving out-of-state sellers or vacant land where in-person verification is impossible.

“Real estate fraud isn’t always a high-volume issue, but it’s an incredibly high-impact issue,” Proof CEO and co-founder Pat Kinsel told HousingWire. “A lot of title companies will say, ‘It hasn’t happened to me,’ and then when it does happen to them, it’s devastating.

“I know a title agent that had a million-dollar loss, and they ended up having to personally cover this.”

Tech-enabled fraud reached $13.7 billion in 2024, according to the FBI’s Internet Crime Complaint Center. Meanwhile, deepfake-related scams are rising quickly — jumping 40% year-over-year, per Entrust’s 2026 Identity Fraud Report.

How deepfakes evade human detection

In a demonstration, Kurt Ernst, product manager at Proof, showed how easily commercially available software can create convincing deepfake videos.

Ernst placed a deepfake face over his own in real time, noting the setup took just 15 minutes using off-the-shelf technology.

“I don’t have a supercomputer sitting in my closet here running the latest in video drivers,” Ernst said. “We set this up very quickly. It’s using commercial, off-the-shelf software that you can get, or your fraudsters, your friendly neighborhood fraudsters, can get as well.”

A recent study by Deloitte estimated fraud losses tied to AI-generated deepfakes could reach billions annually, with financial services and real estate among the most exposed sectors.

Ernst also cited common flaws in deepfake videos, including hand warping when crossing the face, imperfections in facial hair rendering and inconsistencies in mouth movement.

“You can see how there’s warping there. You can see my face over my fingers,” he said. “These different types of technologies are terrible with fingers and hands, and they’ll look kind of creepy.”

Proof’s technology flagged the deepfake video as fraudulent within seconds during the demonstration.

The system scans video frames in real time while also analyzing device information, location data and email addresses, Ernst added.

Multilayered detection approach

The Maryland transaction involved a vacant lot where the seller claimed to be local but, as often is the case, was operating elsewhere.

“They don’t always have the exact details on their ID correctly,” Ernst said of scammers. “Their email address — that’s a classic one. You can spin up a new email address in five seconds. So their email address will have never been seen by anyone.”

Detection systems can flag suspicious transactions and red flags autonomously.

“We can say, ‘We think this one needs to be reviewed,’ even if the notary doesn’t see it,” Ernst said. “That can happen almost instantaneously.”

Best practices for professionals

Kinsel recommended that real estate teams and title offices add identity verification at every step of the transaction process — and even across avenues once thought to be relics of the past.

“It’s been proven that fraud is returning to paper channels,” Kinsel said. “You can provide a better customer experience and a more secure experience by actually securing the credential.”

The company has invested in deepfake detection for four years — training models on synthetic videos created from monitoring the dark web and platforms like Telegram.

“It’s going to be an endless battle, but we think it’s really core to our mission as a company,” Kinsel said.

Proof’s long-term strategy in staying ahead of evolving fraud technology involves persistent digital identities secured by cryptographic keys, he added.  

“Every single time that someone is enrolled or the identity is verified represents the opportunity for fraud,” Kinsel said. “Every single time when you go from the Realtor to the title company, to the mortgage lender, these handoffs are an opportunity for someone to steal your identity.”

This post was originally published on here

A new report released on April 6 found that community lenders could play a larger role in attracting institutional investment for climate and infrastructure projects, despite longstanding concerns around risk, scale and liquidity.

The report, “Bridging Institutional Capital and Community Climate Investments,” published by Ceres and the Justice Climate Fund, argues that community-based financing institutions offer a viable pathway for investors seeking stable returns while supporting local economic resilience.

Community lenders, including community banks, credit unions and green banks, have historically been underutilized by institutional investors due to perceived constraints such as small loan sizes, limited aggregation mechanisms and a lack of standardized reporting, the report said.

In a conversation with HousingWire, Holly Li, program director, Ceres Accelerator for Sustainable Capital Markets, Net Zero Finance, as well as an author of the report, said that there is a strong desire from both the institutional investor side and the community development financial institution (CDFI) side to work together.

“What we are seeing is a mismatch between institutional capital and community-scale investment,” Li said. “The projects are there, and the performance of community projects is very strong, but investors need scale, they need liquidity, they need standardized products. They also need to understand the CDFI market a little bit more.”

Steven Rothstein, chief program officer at Ceres, agrees with Li. “I think there is a lot of interest, but there needs to be more knowledge on both sides; Big institutional investors don’t always know who all the local CDFIs are or who to reach out to.”

At the same time, demand for financing in underserved communities is rising, particularly for housing, small businesses, infrastructure and climate resilience projects. These investments can help mitigate risks tied to extreme weather events such as flooding, wildfires and drought, while also generating long-term returns.

Researchers found that institutional investors are primarily seeking competitive risk-adjusted returns, predictable cash flows, diversification and clear exit pathways. Community lenders, the report said, can meet many of those expectations by offering asset-backed loans, historically low default rates and access to public incentives and co-investment opportunities.

“I think the question is, what is stopping the investors from working with CDFI? One thing that we hear over and over again is perceived risk, because a lot of CDFIs don’t have standardized rate ratings and they have very limited reporting capacity, so the risk of their projects is often misunderstood,” Li said.

To bridge the gap between investor expectations and current market barriers, the report outlines four primary strategies. Both Rothstein and Li said that solutions like aggregation products and securitization can bridge these gaps.

The first strategy involves traditional financing tools such as insured deposits, certificates of deposit and promissory notes, which offer stable, predictable returns and are widely understood by investors. The second strategy focuses on innovative financing models, including loan securitization, equity-equivalent investments and loan participation structures.

A third approach highlights the use of first-loss or low-cost capital, typically provided by philanthropic or public entities, to absorb early losses and reduce risk for private investors. Such structures are designed to attract additional capital into sectors like clean energy, affordable housing and community development.

The final strategy emphasizes cross-sector collaborations between community lenders, corporations and philanthropic organizations, which the report says could form partnerships that support broader economic goals such as workforce development, infrastructure improvements and job creation.

“I think all financial institutions, CDFIs, credit unions, banks…need to do this. And if you look at the largest banks, they’re all investing enormous amounts in New Energy,” Rothstein said. “And in fact, in the last year, those large banks made more fees on the new and emerging and green energy than they did on the fossil fuel. So that’s a growing area, but the CDFIs know their communities, so they understand the needs better.”

The report concludes that the gap between institutional capital and community investment is narrowing as new financial structures emerge, offering investors a way to achieve both financial returns and measurable climate and social impact.

This post was originally published on here

Douglas Elliman has joined the growing list of firms settling the homebuyer commission lawsuits via the opt-in settlement in the Tuccori homebuyer commission lawsuit

The firm notified the court in the Lutz homebuyer commission lawsuit, in which it is a defendant, of its settlement on Thursday. According to the filing, the opt-in period for the Tuccori settlement closes on Monday. 

The terms and financial conditions of the settlement were not released. 

Douglas Elliman’s settlement announcement comes as the homebuyer plaintiffs in the Batton lawsuit have sought to prevent other brokerage defendants from settling the homebuyer claims via the Tuccori suit opt-in settlement. So far, the Batton plaintiffs have been denied in their efforts to intervene in the Tuccori lawsuit. 

But the Batton plaintiffs and the Lutz plaintiffs are jointly seeking to appoint the Tuccori plaintiffs’ counsel as co-lead counsel in their lawsuits. According to the notice filed by Douglas Elliman earlier this week, the company opposes this motion because it “improperly seeks to prevent the non-released, non-enjoined buyer-side putative class and Defendants from participating in the court-approved opt-in settlement procedure in Tuccori.” 

Other firms who have opted into the Tuccori settlement include Anywhere Real Estate and Hanna Holdings

Douglas Elliman did not immediately return HousingWire’s request for comment. 

This post was originally published on here

Mariah Carey is selling her triplex atop 90 Franklin Street, which was featured in Architectural Digest and “MTV Cribs” and exemplifies the rarified experience of penthouse living. Asking $27 million, the three-floor, 12,700-square-foot home has 1,100 square feet of outdoor space, wrapped by dazzling Hudson River and Manhattan skyline views in every direction. With interiors designed by Mario Buatta, the Art Deco residence is no less opulent today.

In 1999, the “Queen of Christmas” paid $9 million for two top-floor units, the penthouse and a full-floor unit below, at the 100-year-old bank building Franklin Tower, which was converted from offices to apartments. The listing marks the first time the home will be available since Carey lived there.

The world first got a look at her glamorous penthouse in an iconic episode of “MTV Cribs” in 2002, where the singer famously exercised in stilettos and took a bath. In the episode, Carey also mentioned, but did not reveal, Marilyn Monroe’s white baby grand piano, which she paid over $660,000 for in 1999.

In 2022, as 6sqft reported, Carey hosted “Mariah’s Ultimate Holiday Experience,” a Booking.com partnership that included a Christmas-themed photoshoot in the penthouse.

For space alone, the possibilities are about as endless as you’d imagine in a home this size. The 16th floor is a downtown paradise on its own. The two floors above add up to a sky mansion topped by an endless private terrace. Combined, it’s an estate of epic proportions.

The listing description says the next owner can “enjoy it as one expansive private home or reimagine it as an exceptional blank canvas for a developer or design-minded buyer.”

Surrounding a stunning glass-wrapped rotunda, the jewel atop this trophy-level downtown crown is a vast roof terrace. The airstrip-sized patio features an indoor/outdoor room with a fireplace for multi-season use.

The condominium tops a 17-story Art Deco brick tower built as a bank in 1915. Historic details like high, beamed ceilings and exposed brick give the space a graceful pre-war elegance.

Amenities include a doorman, a concierge, and a gym.

[Listing details: 90 Franklin Street, PH, at CityRealty]

[At Core by Emily Beare and Lexi Alper]

RELATED:

The post Mariah Carey lists Tribeca penthouse for $27M first appeared on 6sqft.

This post was originally published here

Nearly 60 brokerages and franchisors have now joined Zillow Preview, giving agents and sellers a way to publicly market pre‑MLS listings on Zillow and Trulia. Zillow announced Friday that 28 additional firms have signed on to offer Zillow Preview to their agents, signaling growing broker adoption of pre-marketing coming soon listings.

The latest participants include The Keyes Family of Companies, 8z Real Estate, Russell Real Estate Services, Seven Gables Real Estate, NorthGroup Real Estate, Homes of Idaho, DeLex Realty, Home Grown Group Realty, JohnHart Real Estate, Nest Realty, Realty Masters, Beverly & Company, Newport & Company, W Real Estate, Thrive Real Estate Group, KOMAR, Bella Realty Group, ICON Realty Experts, Queenston Realty, Libertas Real Estate, The Advantage Group, ROI Real Estate, Lamica Realty, Intege Realty, Arizona Proper Real Estate, Grace Hagerty Real Estate Inc, Real Estate Fixed and iad Real Estate.

These firms join over two dozen other brokerages and franchisors, including Side, United Real Estate, REMAX, HomeServices of America, Keller Williams and SERHANT., whose coming soon listings are already live on Zillow Preview.

Under the Zillow Preview program, listings can appear publicly on Zillow and Trulia before going active in the MLS, with visibility to any consumer with a phone or computer. The company has said that listing agents and sellers can use the pre‑market period to test pricing, gauge interest and build a pipeline of showings before the official go‑live date. Buyers can discover, save and share upcoming listings, connect directly with the listing agent or schedule tours with an agent of their choice.

“Pre-market listings belong in the daylight — giving sellers the broadest possible exposure and giving all buyers access without the requirement to get past a registration wall or work with one particular brokerage,” Errol Samuelson, chief industry development officer at Zillow, said in a statement. “Our research is clear: the best outcomes for sellers come from the broadest competition among buyers.”

Unlike many private networks, Zillow Preview does not require consumers to work with a specific brokerage to see or inquire about a home. Zillow says buyers are never locked into any one firm to access the inventory, a key distinction as regulators and plaintiffs in ongoing commission litigation have questioned practices that may limit consumer choice.

“For 100 years, The Keyes Company has thrived by asking one question: What do consumers need right now, and how do we deliver it?” Mike Pappas, the CEO of The Keyes Family of Companies, said in a statement. “Zillow Preview gives sellers and their agents a new choice: the ability to start marketing early while still reaching the broadest possible audience.”

Other brokerage leaders share a similar view, with Ryan Carter, the president and CEO of 8z Real Estate, stating that he and his firm appreciate that Zillow Preview aligns with their beleif that “buyers and sellers are best served by an open, transparent market.”

“By making pre-market listings publicly visible to everyone, not just a select network, we are giving our sellers the broad exposure they deserve and giving buyers access to more homes,” Carter said in a statement.

According to the company, Zillow Preview is designed to operate within local MLS rules while giving brokerages more flexibility in how they time and stage the marketing of listings. Participation is at the brokerage level; individual agents can then choose, with their sellers, whether to use it as part of their listing strategy.

Zillow first announced Zillow Preview in mid-March, just weeks after Compass, which now owns Anywhere and @properties Christie’s International Real Estate, announced an exclusive deal with Rocket Companies and Redfin to showcase its coming soon listings during its Q4 2025 earnings call.

In late March, eXp Realty announced non-exclusive pre-marketing deals with Realtor.com, Homes.com and ComeHome.com, which is HouseCanary’s real estate portal that has partnered with Google to showcase listings in Google search results in select markets, to syndicate its coming soon listings.

This article was written by Brooklee Han and generated with the assistance of HousingWire Automation. It was reviewed by a HousingWire editor before publication. The system helps convert company announcements and industry data into HousingWire-style news coverage.

This post was originally published on here

Inflation hit its highest rate in nearly two years, according to data released Friday by the U.S. Bureau of Labor Statistics (BLS).

According to the Consumer Price Index (CPI) the inflation index for all items jumped 3.3% in March, up from the 2.4% annual increase recorded in February. Month over month, the all-items index rose 0.9% in March, up from a 0.3% increase a month prior. This is the largest monthly increase in nearly four years. 

The biggest contributor to the all-items index’s monthly increase was the energy index, which rose 10.9% in March, led by a 21.2% increase in the index for gasoline. According to the release, the gasoline index’s increase accounted for roughly 75% of the all-items index’s monthly increase.

The index for shelter also rose month over month in March, jumping 0.3%, as the owners’ equivalent rent also rose 0.3%. The index for food, however, remained unchanged. 

Due to this, the index for all items, less food and energy (aka core inflation), rose 0.2% from the month prior in March.

On an annual basis, the core items index was up 2.6%, up slightly from the 2.5% increase reported in February, as the index for energy was up 12.5% year over year in March and the food index was up 2.7% annually. The index for gasoline reported an 18.9% annual increase in March. Year over year, the shelter index rose 3%, with the owner’s equivalent of rent rising 3.1% annually. 

According to economists, the March inflation data combined with the resilience shown by the labor market in the March jobs report effectively removes the possibility of a Federal Reserve rate cut in the near future. Additionally, falling consumer sentiment and rising mortgage rates are expecting to impact the spring homebuying season.

“Higher inflation has impacted the housing market in a couple of ways. Mortgage rates, which fell briefly below 6% in February, rose for five weeks in a row before declining slightly this week. Higher rates erode buyers’ purchasing power and stall progress toward greater affordability,” Lisa Sturtevant, chief economist at Bright MLS, said in a statement.

“The spring housing market is currently caught in a crosscurrent of conflicting signals. Although inventory is rising seasonally, a tug-of-war has emerged between increased choice and decreased confidence. Both buyers and sellers are acting with extreme caution, waiting for lower rates, more stable inflation and more certainty.”

This post was originally published on here

Redfin has been recognized among the top residential real estate brokerages for the fourth year in a row! In 2025, our agents closed 50,484 transactions, totaling nearly $32 billion in sales – earning the #8 spot on the RealTrends Verified Brokerage Rankings by both sales volume and transaction count.

Redfin Agents Remain The Most Productive

The average Redfin agent closed more than 22 deals in 2025—nearly three times the productivity of agents at other top-10 brokerages, according to RealTrends data. 

Our agents also led in sales volume, with an average agent sales volume of approximately $14 million. That’s almost double the per-agent volume of our next closest competitor. 

Redfin agent sales volume in 2025 was $14M, double our nearest competitor.

This level of productivity isn’t an accident. It reflects the talent of our agents and the strength of the platform behind them. This allows Redfin to help customers navigate even the most challenging markets with confidence. 

We’re Just Getting Started

What makes this recognition even more meaningful is the small but mighty team behind it. Redfin had just under 2,300 agents at the end of 2025, a fraction of many of our competitors – some of which have tens of thousands of agents. 

It’s proof that when you pair great agents with the right tools, support, and demand, you get outsized results.

In 2026, we’re building on this momentum. We’re continuing to invest in our agents through Redfin Next and Redfin Teams – giving them more control over their business, stronger economics, and the tools they need to grow their business while delivering a better experience for customers

As part of Rocket Companies, we’re accelerating that work by bringing together brokerage, lending, and technology to create a more seamless, end-to-end experience for customers and more opportunity for agents.

And through our partnership with Compass International Holdings, we’re expanding the selection of homes on Redfin.com, bringing more choice to customers and more demand to our platform. We’re proud to work with one of the nation’s top brokerages to unlock more inventory and help more people home.

It all comes back to a simple idea: when you put the customer at the center, everything else follows.

That’s why agents are choosing Redfin. We help them generate demand, operate more efficiently, and focus on what matters most: guiding customers through one of the most important decisions of their lives. The result is stronger performance, higher earnings potential, and a more scalable path to building a lasting business.

And we’re not slowing down. With Rocket’s platform, continued investment in our agents, and partnerships that expand our reach, Redfin is in a stronger position than ever to lead – and to make real estate better for customers across the country.

Are you ready to join some of the best agents in the industry and take your career to the next level? We’re always looking for ambitious, mission-driven agents to join our team. Visit our career page or join our talent community to learn more.

The post Redfin Earns Top 10 Spot in RealTrends Verified Rankings, Powered by Agent Productivity appeared first on Redfin Real Estate News.

This post was originally published here

Takeaway: Headline inflation, which includes food and energy prices, spiked in March, but rates won’t move much today because core inflation, which ignores those volatile components, remained subdued.
The closing of the Strait of Hormuz led to a 0.9% monthly increase (3.3% annual increase) in prices in March, but there is little evidence so far that is bleeding through to other prices, which is what the Fed cares about.

  • Gas prices surged 21% and fuel oil 31% in the March inflation data. These spikes were forecasted accurately by market observers ahead of time and the implications have been priced in by bond markets these past six weeks, so there is little market reaction to this data.
  • Fed officials are mainly concerned with core inflation, which removes the volatile food and energy categories, because these underlying inflationary measures are what responds to interest rate changes. That came in slightly below expectations with a 0.2% monthly increase (2.6% annual increase) in prices.
  • The softness was driven in part by a large 1.0% monthly decline in prescription drug prices and -1.5% monthly decline in non-prescription drugs
  • Shelter, the largest component of the overall index, ticked up to 0.3% monthly because of an unwind of the 0% shelter inflation assumptions the Bureau of Labor Statistics made six months ago after the October government shutdown.
  • Overall, there is little evidence of the energy price spike affecting other categories yet. However, airline fares, an especially energy-sensitive sector, jumped 2.7% monthly. There is also some evidence of continued tariff rollback, with household goods prices soft.

There’s been some fear among investors that the Fed may have to hike rates this year, which this report should help to alleviate. Overall, similar to the recent jobs reports, today’s data along with the volatility in the Middle East, point to the Fed holding steady for a while.

The post Fed, Mortgage Rates, Likely to Hold Steady on Latest Inflation Report appeared first on Redfin Real Estate News.

This post was originally published here

The housing market remains in flux, setting the stage for this year’s RealTrends Verified rankings.

Inventory has improved but remains constrained, affordability continues to pressure buyers and brokerages are still adjusting to new policies around private listings. In turn, firms are rethinking how they recruit, retain and support agents — and the rankings offer a clear look at which strategies are gaining traction.

That dynamic is reflected in the 2026 RealTrends Verified brokerage rankings, based on 2025 production. It tells a familiar story at the top — and a much more interesting one just beneath it.

A total of 1,267 firms met RealTrends Verified standards this year, with each closing at least 500 transaction sides or $350 million in sales volume. Together, these brokerages accounted for $2.24 trillion in volume and 3.94 million transactions, underscoring just how concentrated production remains among the industry’s top performers.

“RealTrends Verified exists to set the standard — and this year’s growth underscores the value of a consistent benchmark,” Caroline Scanlon, director of RealTrends Verified, said in a statement. “When the market moves, the industry needs a trusted way to see who’s gaining share and who’s building on a real scale.”

The ‘fab four’ aren’t going anywhere — yet

At the top of the brokerage rankings, stability reigns.

Compass, prior to its acquisition of Anywhere, once again led all firms in sales volume at $262.2 billion, while eXp Realty retained its hold on the No. 1 spot for transaction sides with 343,091. Anywhere Advisors and HomeServices of America rounded out the top four across both metrics.

It’s a continuation of a trend that has defined the rankings for several years now: scale begets scale. The largest brokerages are not just holding their positions — they’re reinforcing them.

But if the top four feel locked in, the gap behind them is starting to narrow.

visualization

The Real Brokerage is no longer a disruptor — it’s a contender

The Real Brokerage, headed by CEO Tamir Poleg, continues to gain traction among the industry’s top firms.

The company held steady at No. 5 by sales volume at $65.2 billion, but more notably moved up to No. 5 by transaction sides, overtaking Hanna Holdings. That dual top-five position signals a shift: Real is no longer just growing fast — it’s now competing directly with legacy players on both scale and productivity.

That mirrors what was seen last year, when Real posted triple-digit growth and began climbing the rankings in earnest. This year’s data confirms that momentum wasn’t a one-off.

visualization

LPT Realty’s leap signals a new kind of growth engine

Continuing on last year’s theme, if there’s a breakout story in this year’s rankings, it’s Robert Palmer‘s LPT Realty.

The firm jumped from No. 10 to No. 7 in transaction sides, increasing its total to 61,041 sides. That kind of movement in a single year is rare at this scale and it reinforces a broader trend: Brokerage models built around flexibility, agent economics and rapid recruiting are still gaining traction.

LPT isn’t alone. Across the rankings, newer and nimble firms continue to climb, even as the very top remains relatively unchanged.

The middle of the top 10 is where the action is

While the top four brokerages by volume remained unchanged, the middle of the rankings saw subtle but meaningful shifts.

Hanna Holdings moved up to No. 6 by volume, while Douglas Elliman slipped to No. 7. Peerage Realty Partners entered the top 10, replacing United Real Estate.

These aren’t dramatic shakeups, but they do point to increased competition, where small gains in sides or volume can translate into meaningful rank changes.

Brands are reshuffling — and LeadingRE is surging

Keller Williams remains the clear No. 1 brand by both sides and volume. But beneath it, the hierarchy is shifting.

LeadingRE, a network of independent real estate firms, made the biggest leap, jumping from No. 5 to No. 2 by transaction sides and increasing its market share to 11.08%, up from 8.93%.

Meanwhile, Coldwell Banker and REMAX both slipped in the rankings and lost share.

That reshuffling signals a more competitive landscape — one where the gap beneath Keller Williams is tightening, and no single challenger has a firm grip on the No. 2 spot.

visualization

Independents are quietly taking share

One of the most important shifts in this year’s data is the continued rise of independent brokerages.

Independents accounted for 28.79% of market share this year, up from 26.98% last year.

That growth is showing up everywhere: Compass (pre-Anywhere acquisition), eXp Realty, The Real Brokerage, LPT Realty, Redfin and Side are all operating outside traditional franchise structures. And many of them are gaining ground.

The implication is clear. The industry isn’t abandoning brands, but it is increasingly embracing models that offer flexibility in compensation, technology and operations.

This year’s RealTrends Verified rankings show an industry defined by two competing forces: stability at the top and disruption just below it.

The largest brokerages continue to dominate, but the fastest-growing companies are steadily reshaping the leaderboard. The power structure isn’t breaking, but it is bending.

This post was originally published on here

The housing market remains in flux, setting the stage for this year’s RealTrends Verified rankings.

Inventory has improved but remains constrained, affordability continues to pressure buyers and brokerages are still adjusting to new policies around private listings. In turn, firms are rethinking how they recruit, retain and support agents — and the rankings offer a clear look at which strategies are gaining traction.

That dynamic is reflected in the 2026 RealTrends Verified brokerage rankings, based on 2025 production. It tells a familiar story at the top — and a much more interesting one just beneath it.

A total of 1,267 firms met RealTrends Verified standards this year, with each closing at least 500 transaction sides or $350 million in sales volume. Together, these brokerages accounted for $2.24 trillion in volume and 3.94 million transactions, underscoring just how concentrated production remains among the industry’s top performers.

“RealTrends Verified exists to set the standard — and this year’s growth underscores the value of a consistent benchmark,” Caroline Scanlon, director of RealTrends Verified, said in a statement. “When the market moves, the industry needs a trusted way to see who’s gaining share and who’s building on a real scale.”

The ‘fab four’ aren’t going anywhere — yet

At the top of the brokerage rankings, stability reigns.

Compass, prior to its acquisition of Anywhere, once again led all firms in sales volume at $262.2 billion, while eXp Realty retained its hold on the No. 1 spot for transaction sides with 343,091. Anywhere Advisors and HomeServices of America rounded out the top four across both metrics.

It’s a continuation of a trend that has defined the rankings for several years now: scale begets scale. The largest brokerages are not just holding their positions — they’re reinforcing them.

But if the top four feel locked in, the gap behind them is starting to narrow.

visualization

The Real Brokerage is no longer a disruptor — it’s a contender

The Real Brokerage, headed by CEO Tamir Poleg, continues to gain traction among the industry’s top firms.

The company held steady at No. 5 by sales volume at $65.2 billion, but more notably moved up to No. 5 by transaction sides, overtaking Hanna Holdings. That dual top-five position signals a shift: Real is no longer just growing fast — it’s now competing directly with legacy players on both scale and productivity.

That mirrors what was seen last year, when Real posted triple-digit growth and began climbing the rankings in earnest. This year’s data confirms that momentum wasn’t a one-off.

visualization

LPT Realty’s leap signals a new kind of growth engine

Continuing on last year’s theme, if there’s a breakout story in this year’s rankings, it’s Robert Palmer‘s LPT Realty.

The firm jumped from No. 10 to No. 7 in transaction sides, increasing its total to 61,041 sides. That kind of movement in a single year is rare at this scale and it reinforces a broader trend: Brokerage models built around flexibility, agent economics and rapid recruiting are still gaining traction.

LPT isn’t alone. Across the rankings, newer and nimble firms continue to climb, even as the very top remains relatively unchanged.

The middle of the top 10 is where the action is

While the top four brokerages by volume remained unchanged, the middle of the rankings saw subtle but meaningful shifts.

Hanna Holdings moved up to No. 6 by volume, while Douglas Elliman slipped to No. 7. Peerage Realty Partners entered the top 10, replacing United Real Estate.

These aren’t dramatic shakeups, but they do point to increased competition, where small gains in sides or volume can translate into meaningful rank changes.

Brands are reshuffling — and LeadingRE is surging

Keller Williams remains the clear No. 1 brand by both sides and volume. But beneath it, the hierarchy is shifting.

LeadingRE, a network of independent real estate firms, made the biggest leap, jumping from No. 5 to No. 2 by transaction sides and increasing its market share to 11.08%, up from 8.93%.

Meanwhile, Coldwell Banker and REMAX both slipped in the rankings and lost share.

That reshuffling signals a more competitive landscape — one where the gap beneath Keller Williams is tightening, and no single challenger has a firm grip on the No. 2 spot.

visualization

Independents are quietly taking share

One of the most important shifts in this year’s data is the continued rise of independent brokerages.

Independents accounted for 28.79% of market share this year, up from 26.98% last year.

That growth is showing up everywhere: Compass (pre-Anywhere acquisition), eXp Realty, The Real Brokerage, LPT Realty, Redfin and Side are all operating outside traditional franchise structures. And many of them are gaining ground.

The implication is clear. The industry isn’t abandoning brands, but it is increasingly embracing models that offer flexibility in compensation, technology and operations.

This year’s RealTrends Verified rankings show an industry defined by two competing forces: stability at the top and disruption just below it.

The largest brokerages continue to dominate, but the fastest-growing companies are steadily reshaping the leaderboard. The power structure isn’t breaking, but it is bending.

This post was originally published on here

The conversation around artificial intelligence has largely defaulted to one of two extremes: AI as an existential threat to human work, or AI as a magic button that solves every operational problem automatically. In practice, neither framing holds up. The organizations gaining the most ground right now are those that have moved past the debate entirely and are focused on something more concrete: how to pair human expertise with AI capability in ways that produce real, usable solutions faster than traditional development cycles allow.

This is not a philosophical argument. It is a practical one, and the evidence is accumulating.

The hidden cost of how we’ve always built things

For decades, the process of turning a problem into a working solution followed a familiar path: define the problem, gather stakeholders, write specs, build a roadmap, wireframe the product, review, revise, and eventually, often months later, begin development. Each step was necessary, given the constraints of the time. But those constraints have changed, and the process largely hasn’t.

The result is a development cycle that burns time and organizational bandwidth before a single line of functional code is written. In fast-moving markets where competitive advantage can hinge on speed, this is no longer just inefficient. It is a liability.

A different model: Problem to prototype

What is emerging in practice, and what teams actively working at the intersection of AI and real-world operations are experiencing firsthand, is a fundamentally compressed workflow. Instead of beginning with weeks of spec development and roadmapping, practitioners are bringing their domain expertise directly into conversation with AI tools and moving to functional prototypes almost immediately.

The process works roughly like this: a subject matter expert articulates the problem and frames a possible solution. AI handles what would previously have required a room full of engineers and product managers and two weeks at a whiteboard: the architecture, the roadmap structure, the sequencing of development tasks. From there, AI-assisted coding tools translate that structure into working code. What remains is iteration, refinement, and deployment.

The human contribution in this model is irreplaceable: domain knowledge, problem framing, and judgment about what actually needs to be solved. AI does not identify the right problems. It accelerates the path from problem to solution once a knowledgeable person has clearly framed the challenge.

What this looks like in real operations

Consider sales productivity, a challenge that exists in virtually every industry, including real estate and title. A field representative spending long days meeting with clients faces a real and persistent problem: accurately capturing the details of each interaction in a form that managers and leadership can act on. The traditional solution involves CRM systems that require sitting down, logging in, and manually entering data; a task that rarely happens in real time and creates downstream gaps in visibility.

Using the human-AI partnership model, the solution takes shape quickly, starting with just a plain-language description of the problem. The need is described, the solution framed, and AI handles the architecture and development structure from there.

WFG recently developed a prototype to address a persistent pain point for its sales team. Field reps spending long days meeting with clients struggled to capture interaction details accurately and in real time; the kind of data managers need to coach effectively, and leadership needs to track activity. In the prototype, a field rep records notes conversationally throughout their day without needing to log in to CRM or park to complete data entry. AI synthesizes those notes, scores each interaction based on tone and context, and delivers a concise report with recommended next steps, giving managers real-time visibility into field activity without waiting for manual input.

The same approach has already been put into production. WFG built and deployed an AI-powered OKR tracking tool that ingests regular inputs from reps and managers, scores progress against established goals, and delivers leadership a clear, accurate summary of where each team member stands, along with recommended next steps to help them meet their objectives fully. What previously required manual cross-referencing and follow-up calls now happens automatically. That tool is live and in active use today.

In a traditional development environment, building either of these capabilities might take months of spec development, road-mapping, and testing. Using AI-assisted prototyping, both went from problem statement to working product in a matter of days.

The same principle applies to goal tracking and performance management, an area where data often exists, but synthesis is the bottleneck. Executives and managers typically receive reports that require manual cross-referencing against stated objectives. An AI-assisted solution built from a clear articulation of the problem can ingest that data automatically, score progress against established metrics, and surface a concise, actionable summary, eliminating hours of manual review and enabling faster course corrections.

Neither of these examples requires exotic technology or large development teams. What they require is human expertise in determining which problem is worth solving, combined with AI’s ability to rapidly architect and build the solution.

Why partnership, not replacement

The “AI will replace human workers” narrative overlooks an important aspect of how the most effective implementations actually work. AI is extraordinarily capable at pattern recognition, code generation, synthesis, and structure. It is not capable of knowing which problems are worth solving, understanding the organizational and market context in which solutions will live, or exercising the kind of judgment that comes from years of experience in a specific industry.

In the title and real estate sectors specifically, that domain expertise is deep and consequential. Compliance requirements, transaction complexity, agent relationships, and the high-stakes nature of the product mean that the humans closest to these workflows bring knowledge that no model can independently possess. What AI changes is how efficiently that expertise can be translated into operational solutions.

The professionals and teams who will define the next chapter of this industry recognize that the combination — human expertise driving AI capability — is where the compounding advantage lies. Not in automating humans out of the process, but in removing the friction between expertise and execution.

The practical takeaway

For industry leaders evaluating their own AI strategy, the most actionable question is not “what can AI do?” It is “where is expertise already present in our organization, and what is slowing the translation of that expertise into solutions?” The gaps in that answer are where the human-AI partnership model delivers disproportionate value.

The organizations building that discipline now, and establishing the internal capability to move from problem articulation to working prototype without the traditional overhead of the development cycle, are compressing timelines in ways that compound over time. The competitive distance between those organizations and those still building the traditional way is only going to grow from here.

Ryan Ozonian is Senior Director of Innovation and AI at Williston Financial Group (WFG). 
This column does not necessarily reflect the opinion of HousingWire’s editorial department and its owners. To contact the editor responsible for this piece: zeb@hwmedia.com.

This post was originally published on here

A new appraisal management platform is aiming to upend the traditional role of appraisal management companies (AMCs) by allowing mortgage lenders to oversee the process internally while maintaining regulatory compliance.

The platform, known as PAM, or Private Asset & Management Group LLC, is designed as a web-based system that enables lenders to manage appraisal workflows without relying on third-party AMCs.

David Cedar, president of PAM and a licensed appraiser, claims that the platform restores lender control over a process that he says has long been outsourced at the expense of both borrowers and appraisers.

Under the PAM system, lenders build and manage their own networks of vetted appraisers based on geographic competency and professional qualifications. The platform then automates the rotation of assignments to ensure independence and compliance with appraisal regulations, including Appraiser Independence Requirements (AIR).

“The platform … assigns the appraisals, it rotates the appraisers. It gives the lender control over using appraisers they want to use, not who the AMC is choosing for them,” Cedar said in a conversation with HousingWire.

Each transaction is tracked and documented within the system, providing what the company describes as full transparency and auditability. The platform also integrates with popular loan origination systems like Encompass to streamline workflows.

Cedar said that PAM, which launched at the end of 2025, can reduce costs for borrowers by eliminating AMC-related markups. The estimated savings range from 25% to 40% on appraisal fees, allowing appraisers to receive more equitable compensation while giving lenders greater oversight of appraisal quality and compliance.

“AMCs are charging ridiculous prices. … It’s overkill. It’s gouging. And there’s no regulation and there’s no transparency,” Cedar said.

PAM operates under a lender-managed, direct-engagement structure that the company says is compliant in all 50 states. It is offered at no cost to lenders or appraisers, according to its developers.

“Our flat fee is transparent and one time per order of $99 instead of an AMC charging $300, $400, $500 or even more,” Cedar confirmed. “We absorb the cost of the software, so the lender pays nothing. We also absorb the cost for the appraiser.”

The platform enters a market where some lenders have raised concerns about the traditional AMC model, citing issues related to cost, transparency and control over the appraisal process. Proponents of lender-managed alternatives say such platforms could offer a more efficient and transparent approach, though broader adoption and industry response remain to be seen.

This post was originally published on here

Virginia Gov. Abigail Spanberger has until Monday to sign or veto legislation that would make her state one of the few that allow faith-based organizations to build affordable housing on their properties by overriding local zoning limits.

Spanberger faces pressure from local governments and a small but vocal group of civic organizations to veto the bill, extending the fight after they failed to stop it in the state’s General Assembly.

If she signs the bill, the Commonwealth will join California and Florida in enacting so-called “yes in God’s backyard” (YIGBY) legislation that preempts local zoning control. For Spanberger, the law would be the most consequential affordable housing initiative to advance in her first months in office.

Losing on the broader affordable housing agenda

Shortly after taking office, she presented a housing agenda to improve housing affordability, but the marquee piece ran into a legislative buzzsaw. Lawmakers killed a proposal to allow by-right multifamily and mixed-use projects in many commercially zoned areas.

Lawmakers, however, passed proposals focused on subsidies and preservation of affordable housing.

The YIGBY bill sponsored by state Sen. Jeremy McPike moved on a separate track from the governor’s core housing agenda. Its advocates are mounting their own pressure campaign to persuade the governor to sign it into law.

“We are hopeful, and we are still waiting,” Jessica Sarriot, a co-lead organizer for Virginians Organized for Interfaith Community Engagement (VOICE), told The Builder’s Daily.

Voice, a nonpartisan coalition of Northern Virginia faith-based and community organizations, has pushed for the change for several years.

“I feel pretty confident that she will sign this because I think it fits so neatly within her affordability agenda,” Sarriott said. “It can be something that she really celebrates making forward motion on and it’s packed with bipartisan support.”

A Commonwealth housing solution

Virginia continues to face growing housing affordability pressures. Spanberger won on a platform that emphasized improving affordability.

HousingForward Virginia estimates that faith-based organizations control more than 74,000 acres statewide, creating a large potential supply of land for affordable housing.

The Faith in Housing bill would let churches and certain tax-exempt groups build affordable housing on land they already own without local rezoning. The legislation requires at least 60% of units to remain income-restricted for decades and keeps most new housing taxable.

Next steps for Spanberger

The governor has more options than just signing or vetoing, but they could become complicated.

Spanberger could issue a conditional veto and ask the General Assembly to approve amendments, according to Sarriot. The veto becomes official if lawmakers do not approve the changes.

She could also submit her own amendments for lawmakers to vote on. Sarriot said that whether they approve the amendments, the governor could still sign the original bill.

The governor has limited time to act on the bill because she faces a stack of other measures awaiting her decision.

There is precedent for a governor vetoing a housing bill and later signing it into law after changes.

Last year, Connecticut Gov. Ned Lamont vetoed a bill he initially supported. The legislation would have preempted local zoning authority to encourage missing-middle housing but faced pressure from suburban communities that did not want to lose control. Lamont later followed through on a promise for a special session to craft a compromise and then signed the revised bill.

This post was originally published on here